1. Introduction
A specific manifestation of low stratus (LST), fog plays a key role in the Earth’s climate system [
1] through modifying the radiation balance [
2]. In a more practical sense, it also severely obstructs land, air, and sea traffic [
3]. Microphysical properties have been shown to significantly influence LST/fog clearance time [
4]. Hence, modern techniques for accurately casting fog and its microphysical properties are required [
5]. The operational observations of visibility and cloud properties are rarely available, in particular over large, fog-prone marine areas, such as the Yellow Sea. Based on station observations spanning over 30 years, Zhang
et al. [
6] indicated that over 50 foggy days were recorded on the northwest coast of the Yellow Sea each year, with the maximum of over 80 foggy days at Chengshantou station on the eastern side of the Shandong Peninsula. Wu
et al. [
7] found that fog and low clouds mainly occurred over the western, central, and northern parts of the Yellow Sea during the sea fog season (from April until July). However, sea fog retrieved from satellite data plays a critical role in the surveillance of sea traffic obstructions due to fog, provided that a reliable retrieval scheme based on Geostationary (GEO) satellite data is available. The currently operational GEO systems capturing data over the Yellow Sea are the Japanese Multifunctional Transport Satellite (MTSAT) with its five-band imager Japanese Advanced Meteorological Imager (JAMI) [
8], FengYun-2 (FY-2 C-H) with a five-band Stretched Visible and Infrared Spin Scan Radiometer (S-VISSR) [
9], and the South Korean Communication, Ocean and Meteorological Satellite (COMS-1) with a five-band Meteorological Imager (MI) instrument [
10].
Based on the European geostationary satellite system Meteosat Second Generation (SEVIRI) data, Cermak and Bendix [
11] developed a technique for ground fog detection during daylight hours which differentiates between low stratus and fog by determining whether the LST base (LST base height = LST top height - LST thickness) touches the ground (ground height derived from a digital elevation model (DEM)). Yi
et al. [
12] recently described a LST top height detection method over the Yellow Sea based on MTSAT JAMI data. Cloud Optical Thickness (COT) and Droplet Effective Radius (DER) are necessary in order to obtain the liquid water path (LWP), which is a key parameter in calculating LST thickness, and the LWP is derived from Equation (1) [
13],
in which
is the liquid water density. The retrieval scheme used by Cermak and Bendix [
11] for COT and DER is the Comprehensive Analysis Program for Cloud Optical Measurement (CAPCOM) [
14,
15,
16] adapted to Meteosat Second Generation (MSG) Spinning Enhanced Visible and Infrared Imager (SEVIRI). CAPCOM delivers reliable COT and DER values, particularly over ocean surfaces, when applied to the National Oceanic and Atmospheric Administration (NOAA) Advanced Very High Resolution Radiometer (AVHRR) and Moderate Resolution Imaging Spectroradiometer (MODIS) data during daylight hours [
17].
Some authors recently tested COT and DER retrievals with MTSAT-1R JAMI for the Yellow Sea by comparing them with properties retrieved by MODIS. For example, Choi
et al. [
18] used the cloud analysis algorithm to retrieve COT and DER [
19], which is similar to CAPCOM; Oku
et al. [
20] obtained DER retrieval using an empirical approximation equation [
21]. Ham
et al. [
22] indicated that the MTSAT-1R visible sensor might be subject to biases, as the reflectance bias showed a range of +5% near 0.1 (reflectance) to −20% near 1.0 (reflectance). Such biases can have a significant impact on COT and DER retrievals. Uncertainties in COT and DER, and the resulting LWP, can affect the accuracy of cloud thickness retrieval based on the method of Cermak and Bendix [
11]. As demonstrated in
Figure 1, a large bias in COT and DER could result in skewed cloud thickness retrieval, which, in turn, may fail to detect sea fog. Since mid-December 2010, the Japanese Meteorological Agency (JMA) has provided linear regression coefficients (C0 and C1) to improve the Visible (VIS) channel calibration accuracy (Equation (2)).
This study adapts CAPCOM to MTSAT to test the retrieval of LST over the Yellow Sea during daylight hours. The purpose of the study is to use these values as a precondition for differentiating LST from sea fog through the ground fog retrieval scheme [
11]. We also test the improvement in MTSAT-JAMI VIS calibration to see if it improves COT retrieval. A comparison with the MODIS and CloudSat COT/DER products serves to validate the effectiveness of the adjusted CAPCOM scheme as applied to the retrieved and re-calibrated MTSAT JAMI data.
Figure 1.
Cloud thickness (m) retrieval based on the method of Cermak and Bendix [
1] with the following initial conditions: top temperature 280 K, surface temperature 295 K, and cloud top 600 m. The cross indicates the retrieved cloud thickness is 286 m with COT = 10 and DER = 10 µm.
Figure 1.
Cloud thickness (m) retrieval based on the method of Cermak and Bendix [
1] with the following initial conditions: top temperature 280 K, surface temperature 295 K, and cloud top 600 m. The cross indicates the retrieved cloud thickness is 286 m with COT = 10 and DER = 10 µm.
3. Material and Methods
Preprocessed data is necessary in order to apply CAPCOM to MTSAT-1R JAMI, MTSAT-2 JAMI, and AQUA/TERRA MODIS (in
Table 1). CAPCOM is then also used to retrieve COT and DER. Finally, the CAPCOM retrievals are validated.
Table 1.
Data used in this study.
Table 1.
Data used in this study.
| Sensor/Satellite | Data | Product |
|---|
| JAMI | MTSAT-1R/2 | Radiance (Vis, IR1, IR4) and Reflectance (Vis, IR4) |
| CloudSat | 2B-TAU | Optical Thickness (COT), Effective Radius (DER) |
| MODIS (AQUA/TERRA) | MYD021KM/MOD021KM | Reflectance (Band 1), Radiance (Band 1, 20, 31) and Brightness Temperature (Band 20, 31) |
| MYD03KM/MOD03KM | Lat/Longitude, Solar/Satellite Zenith/Azimuth angle |
| MYD06KM/MOD06KM | Optical Thickness (COT), Effective Radius (DER) |
| MYD09Q1/CMG MOD09Q1/CMG | Reflectance (Band 1) and Brightness Temperature (Band 20) |
| NOAA-AVHRR | OISST | Sea Surface Temperature (SST) |
| Radiosonde | Sounding Profile | Vertical temperature and humidity profile |
3.1. Data
3.1.1. MTSAT Data
We used data from both the MTSAT-1R and MTSAT-2 satellites. Each satellite has five-band imagers on board, including one channel in the visible spectrum (VIS, 0.725 µm) and four bands in the infrared (IR) spectrum (IR1 at 10.8 µm; IR2 at 12 µm; IR3 at 6.75 µm; and IR4 at 3.9 µm, [
9]). The IR bands have a nominal ground resolution of 4 km. The data used in this study were obtained from Kochi University, Japan, and can be downloaded from
http://weather.is.kochi-u.ac.jp for the coverage from 20°S to 70°N and from 70°E to 160°E (1800 pixels × 1800 pixels, 0.05° resolution). Brightness temperatures were calculated from the raw digital data using the calibration table included with the data.
MTSAT-2 data has been available since mid-December 2010, and the JMA provides re-calibration coefficients for the visible channel data. Monthly linear regression coefficients are available for the period between mid-December 2010 and November 2011. Daily regression coefficients have been available since November 2011 and can be found at (
http://ds.data.jma.go.jp/mscweb/data/monitoring/gsics/vis/gsvis_mt2.html). In order to consider the influence of VIS calibration schemes for our comparison, we divided the data set into two portions: (i) VIS reflectivity of MTSAT-1R prior to 22 December 2010 was calculated from the official calibration table; (ii) for the portion of the MTSAT-2 data set beginning in 2011, VIS calibration accuracy benefitted from the bias correction by being re-calibrated according to Equation (2), considering both daily (after 5 December 2011) and monthly (from January 2011 to December 2011) linear regression coefficients. Therefore, the data set in the first portion was not re-calibrated (in
Table 2), while two time bin data sets in the second portion were re-calibrated using daily and monthly coefficients (in
Table 2), respectively. Mid-infrared (3.9 µm) and infrared (10.8 µm) channel data were directly extracted from the digital calibration table without using the re-calibration table.
3.1.2. MODIS Data
The pixel radiance and brightness temperature inputs to CAPCOM were taken from the MYD021KM/MOD021KM product (collection 5). The visible (0.725 µm) surface albedo for CAPCOM was extracted from the MODIS surface reflectance product MYD09/MOD09 (“Surface Reflectance 8-Day”) [
23]. The MYD09/MOD09 CMG product provides the daily brightness temperature in the mid-infrared (3.7 µm) and IR (10.8 µm) channels for further calculating the surface albedo of the mid-infrared (3.9 µm) channel.
Table 2.
Soundings used for 64 LST/fog imaging scenes over the Yellow Sea between 2007 and 2014. A: Aqua, T: Terra; 1R: MTSAT-1R; 2R: MTSAT-2. (The MTSAT scan time over the target area is normally approx. 20 min earlier than the delivery time).
Table 2.
Soundings used for 64 LST/fog imaging scenes over the Yellow Sea between 2007 and 2014. A: Aqua, T: Terra; 1R: MTSAT-1R; 2R: MTSAT-2. (The MTSAT scan time over the target area is normally approx. 20 min earlier than the delivery time).
| DAY (yyyymmdd) | Satellite Time (A/T/1R/2R+hhmm) | Sounding Station | DAY (yyyymmdd) | Satellite Time (A/T/1R/2R+hhmm) | Sounding Station |
|---|
| MODIS | MTSAT | MODIS | MTSAT |
|---|
| 20070209 | A0510 | 1R0500 | ShangHai | 20130514 | A0525 | 2R0600 | Qingdao |
| 20070218 | A0505 | 1R0500 | ShangHai | 20130514 | T0210 | 2R0200 | Qingdao |
| 20070225 | A0510 | 1R0500 | ShangHai | 20130521 | A0530 | 2R0600 | Qingdao |
| 20090207 | A0510 | 1R0500 | Qingdao | 20130521 | T0215 | 2R0200 | Qingdao |
| 20090414 | A0500 | 1R0500 | Baengnyeongdo | 20130522 | A0435 | 2R0500 | Qingdao |
| 20090521 | A0515 | 1R0500 | Baengnyeongdo | 20130522 | T0300 | 2R0300 | Qingdao |
| 20100519 | A0455 | 1R0500 | Qingdao | 20130523 | A0520 | 2R0600 | Qingdao |
| 20100618 | A0505 | 1R0500 | Qingdao | 20130523 | T0200 | 2R0200 | Qingdao |
| 20100625 | A0515 | 1R0600 | Qingdao | 20130524 | A0425 | 2R0500 | Qingdao |
| 20110602 | A0435 | 2R0500 | Qingdao | 20130524 | T0245 | 2R0300 | Qingdao |
| 20110603 | A0515 | 2R0500 | Qingdao | 20130525 | A0505 | 2R0500 | Qingdao |
| 20110605 | A0505 | 2R0500 | Qingdao | 20130525 | T0150 | 2R0200 | Qingdao |
| 20110608 | A0535 | 2R0600 | Qingdao | 20130602 | A0415 | 2R0500 | Qingdao |
| 20110621 | A0505 | 2R0500 | Qingdao | 20130602 | T0240 | 2R0300 | Qingdao |
| 20120416 | A0530 | 2R0600 | Qingdao | 20130603 | A0500 | 2R0500 | Qingdao |
| 20120416 | T0215 | 2R0200 | Qingdao | 20130603 | T0320 | 2R0400 | Qingdao |
| 20120509 | A0535 | 2R0600 | Qingdao | 20130604 | A0545 | 2R0600 | Qingdao |
| 20120509 | T0220 | 2R0200 | Qingdao | 20130604 | T0225 | 2R0200 | Qingdao |
| 20120520 | A0520 | 2R0600 | Qingdao | 20140408 | A0520 | 2R0600 | Qingdao |
| 20120520 | T0200 | 2R0200 | Qingdao | 20140408 | T0200 | 2R0200 | Qingdao |
| 20130402 | A0450 | 2R0500 | Qingdao | 20140409 | A0425 | 2R0500 | Qingdao |
| 20130402 | T0310 | 2R0300 | Qingdao | 20140409 | T0245 | 2R0300 | Qingdao |
| 20130415 | A0415 | 2R0500 | ShangHai | 20140410 | A0505 | 2R0500 | Qingdao |
| 20130415 | T0240 | 2R0300 | ShangHai | 20140410 | T0150 | 2R0200 | Qingdao |
| 20130425 | A0455 | 2R0500 | Qingdao | 20140414 | A0440 | 2R0500 | Qingdao |
| 20130425 | T0315 | 2R0300 | Qingdao | 20140414 | T0305 | 2R0300 | Qingdao |
| 20130504 | A0450 | 2R0500 | Qingdao | 20140501 | A0525 | 2R0600 | Qingdao |
| 20130504 | T0310 | 2R0300 | Qingdao | 20140501 | T0210 | 2R0200 | Qingdao |
| 20130505 | A0530 | 2R0600 | Qingdao | 20140518 | A0430 | 2R0500 | Qingdao |
| 20130505 | T0215 | 2R0200 | Qingdao | 20140518 | T0250 | 2R0300 | Qingdao |
| 20130511 | A0455 | 2R0500 | Baengnyeongdo | 20140521 | A0500 | 2R0500 | Qingdao |
| 20130511 | T0315 | 2R0300 | Baengnyeongdo | 20140521 | T0320 | 2R0300 | Qingdao |
3.1.3. Sounding Data
Sounding profiles of 64 scenes required for the CAPCOM retrieval algorithm are available from the University of Wyoming (
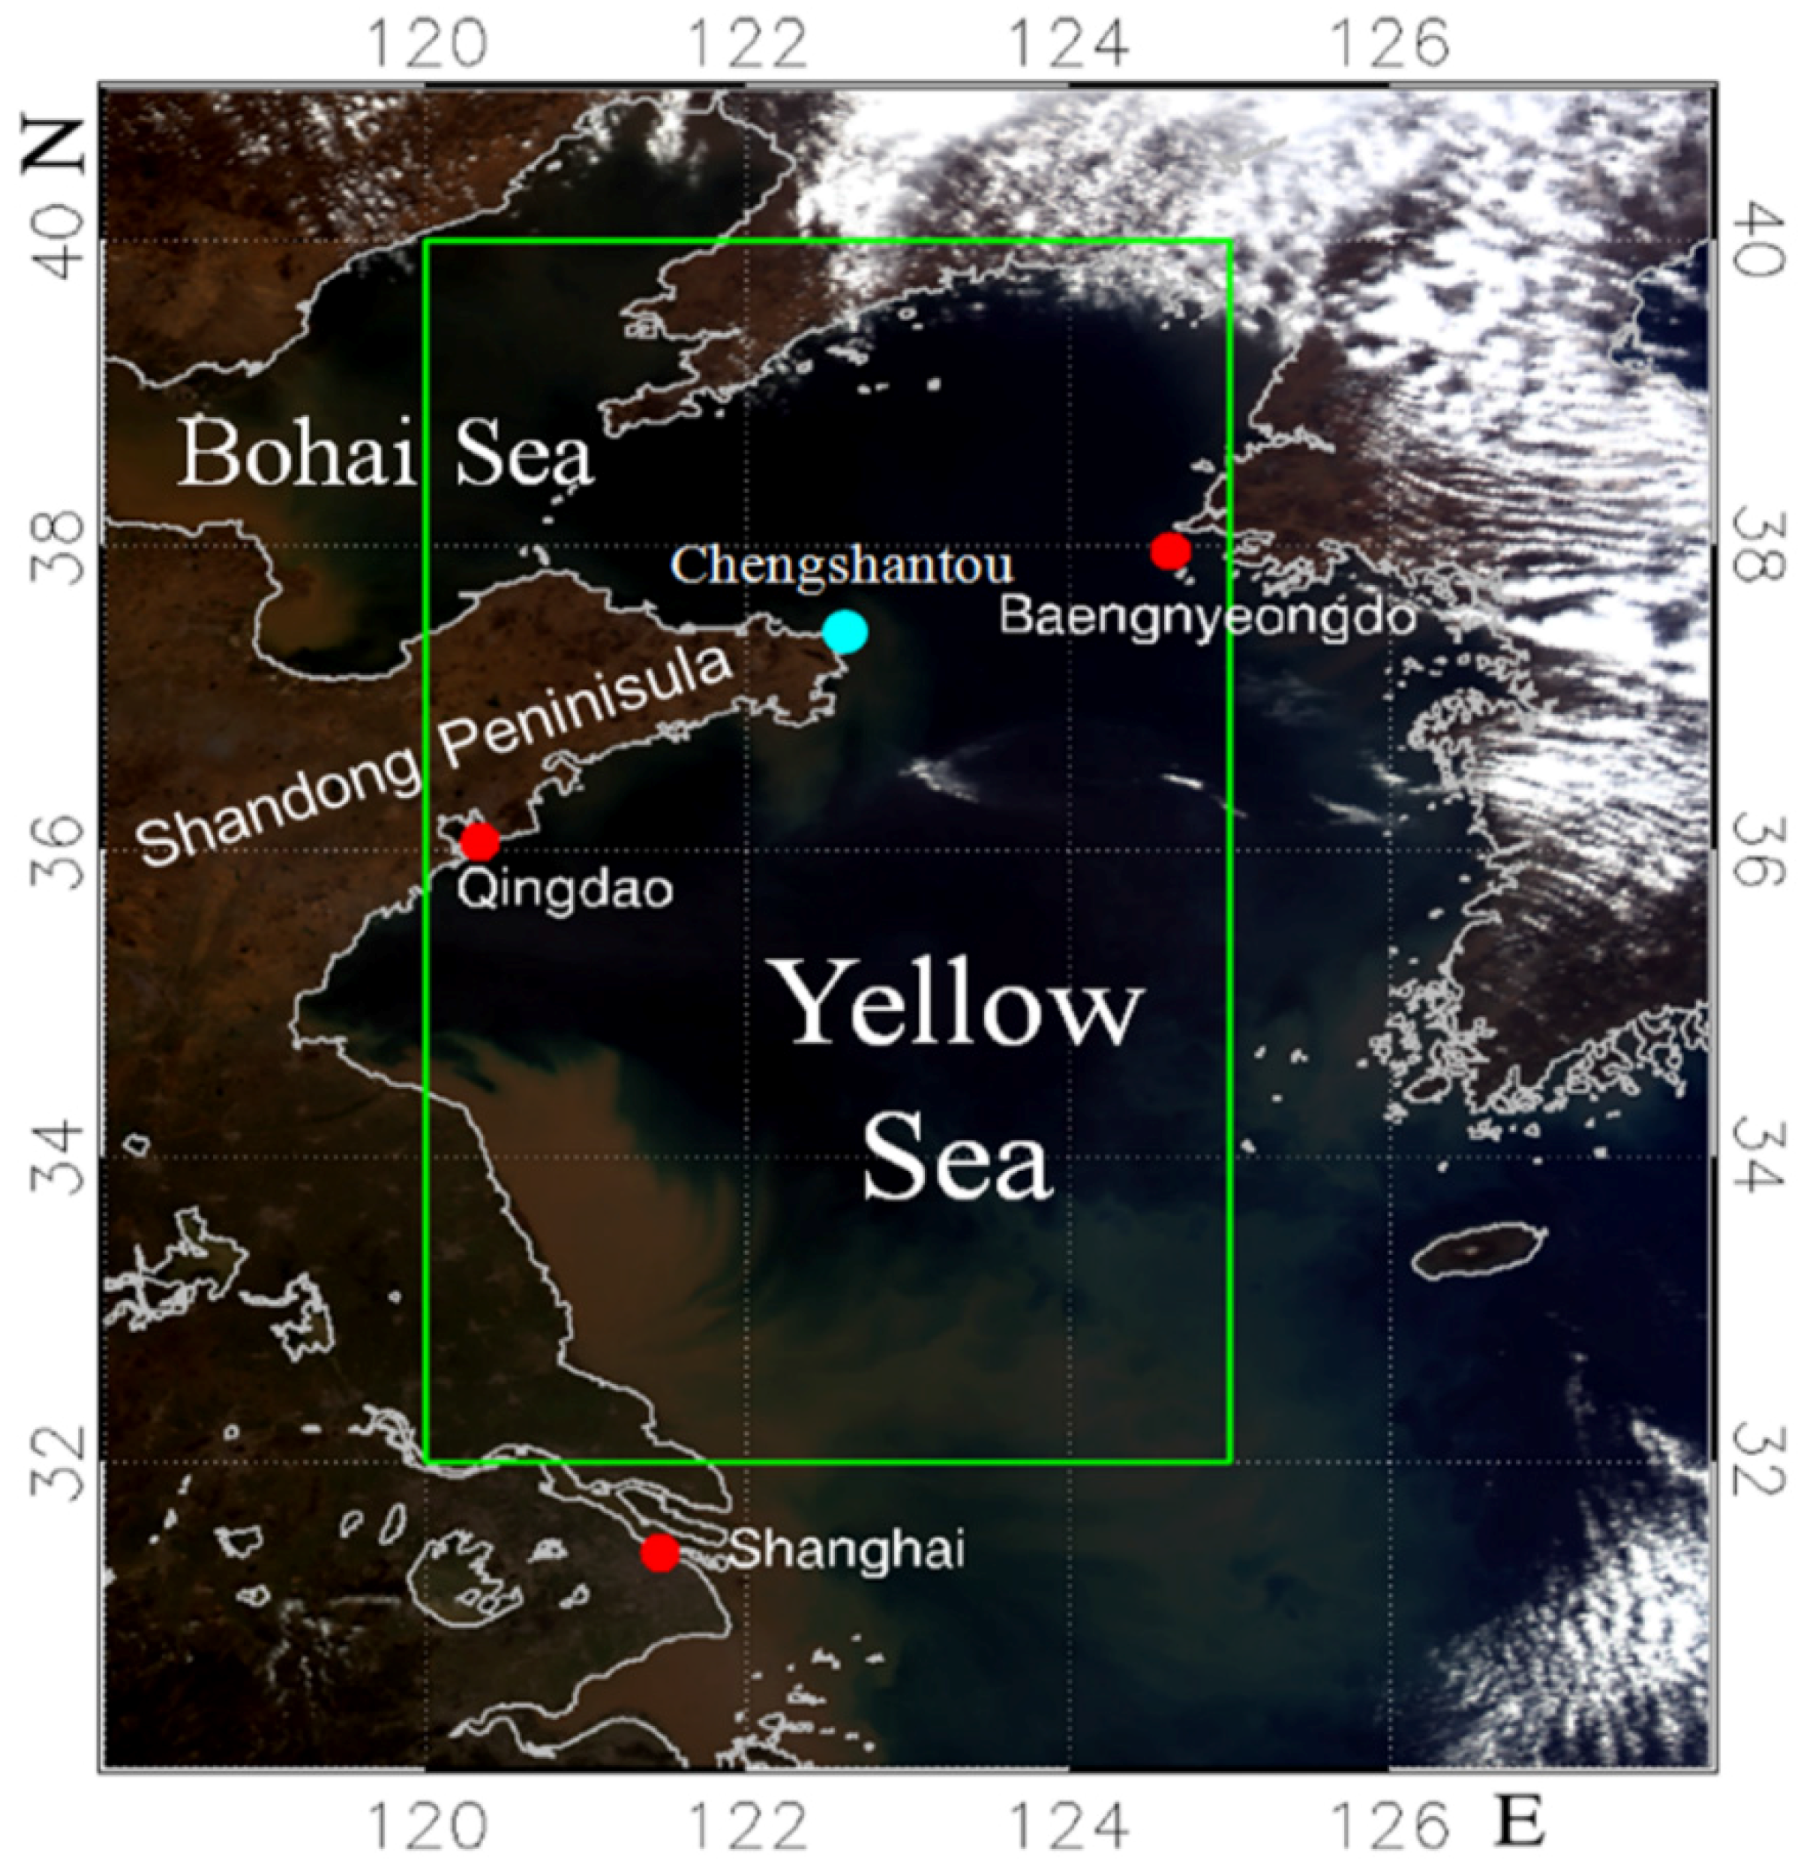
http://weather.uwyo.edu/upperair/sounding.html). The soundings around 00:00 UTC were downloaded for weather stations in Qingdao (36.06°N, 120.33°E), Shanghai (31.4°N, 121.46°E), and Baengnyeongdo (37.97°N, 124.63°E). In each case, the nearest sounding station to the LST/fog area was selected (
Table 2).
3.1.4. Sea Surface Temperature
The required sea surface temperature for the CAPCOM algorithm was taken from the National Oceanic and Atmospheric Administration (NOAA) High-Resolution Blended Analysis of Daily Sea Surface Temperature (OI SST) [
24]. The resolution of the OI SST was sharpened from 0.25° to 0.05° to correspond with the MTSAT JAMI data.
To evaluate of the MTSAT COT/DER products, we used the following data:
(1) COT and DER from MYD06/MOD06, which are derived from the MODIS visible and near-infrared channel radiance [
25], are used to assess the COT and DER retrievals from MTSAT JAMI. The MYD06/MOD06 utilize channel 6 (1.6 µm), channel 7 (2.1 µm), and channel 20 (3.7 µm) in near-infrared channels, which is different from CAPCOM in this study. “Cloud Optical Thickness Relative Uncertainty (percent)” and “Cloud Effective Particle Radius Relative Uncertainty (percent)” with values greater than 20% were excluded from MYD06/MOD06 to control the quality of the evaluation data.
(2) The other COT and DER data sets for evaluation from the CloudSat Cloud Optical Depth (2B-TAU) product are named “total_optical_depth” and “mean_effective_radius”, respectively [
26]. The effective radius was retrieved and included in 2B-TAU [
27] to estimate its accuracy.
3.2. The CAPCOM Algorithm
3.2.1. Introduction of CAPCOM and Simple Execution Procedure
CAPCOM is an enhanced algorithm used to calculate COT and DER using channel 1 (0.63 µm), channel 3 (3.74 µm), and channel 4 (10.8 µm) of the NOAA AVHRR data [
16] based on Nakajima and King [
15]. Kawamoto
et al. [
13] and Bendix [
28] applied CAPCOM in climatological studies on cloud microphysics at the global and regional levels, respectively. We used an inverse method to obtain COT and DER from CAPCOM (
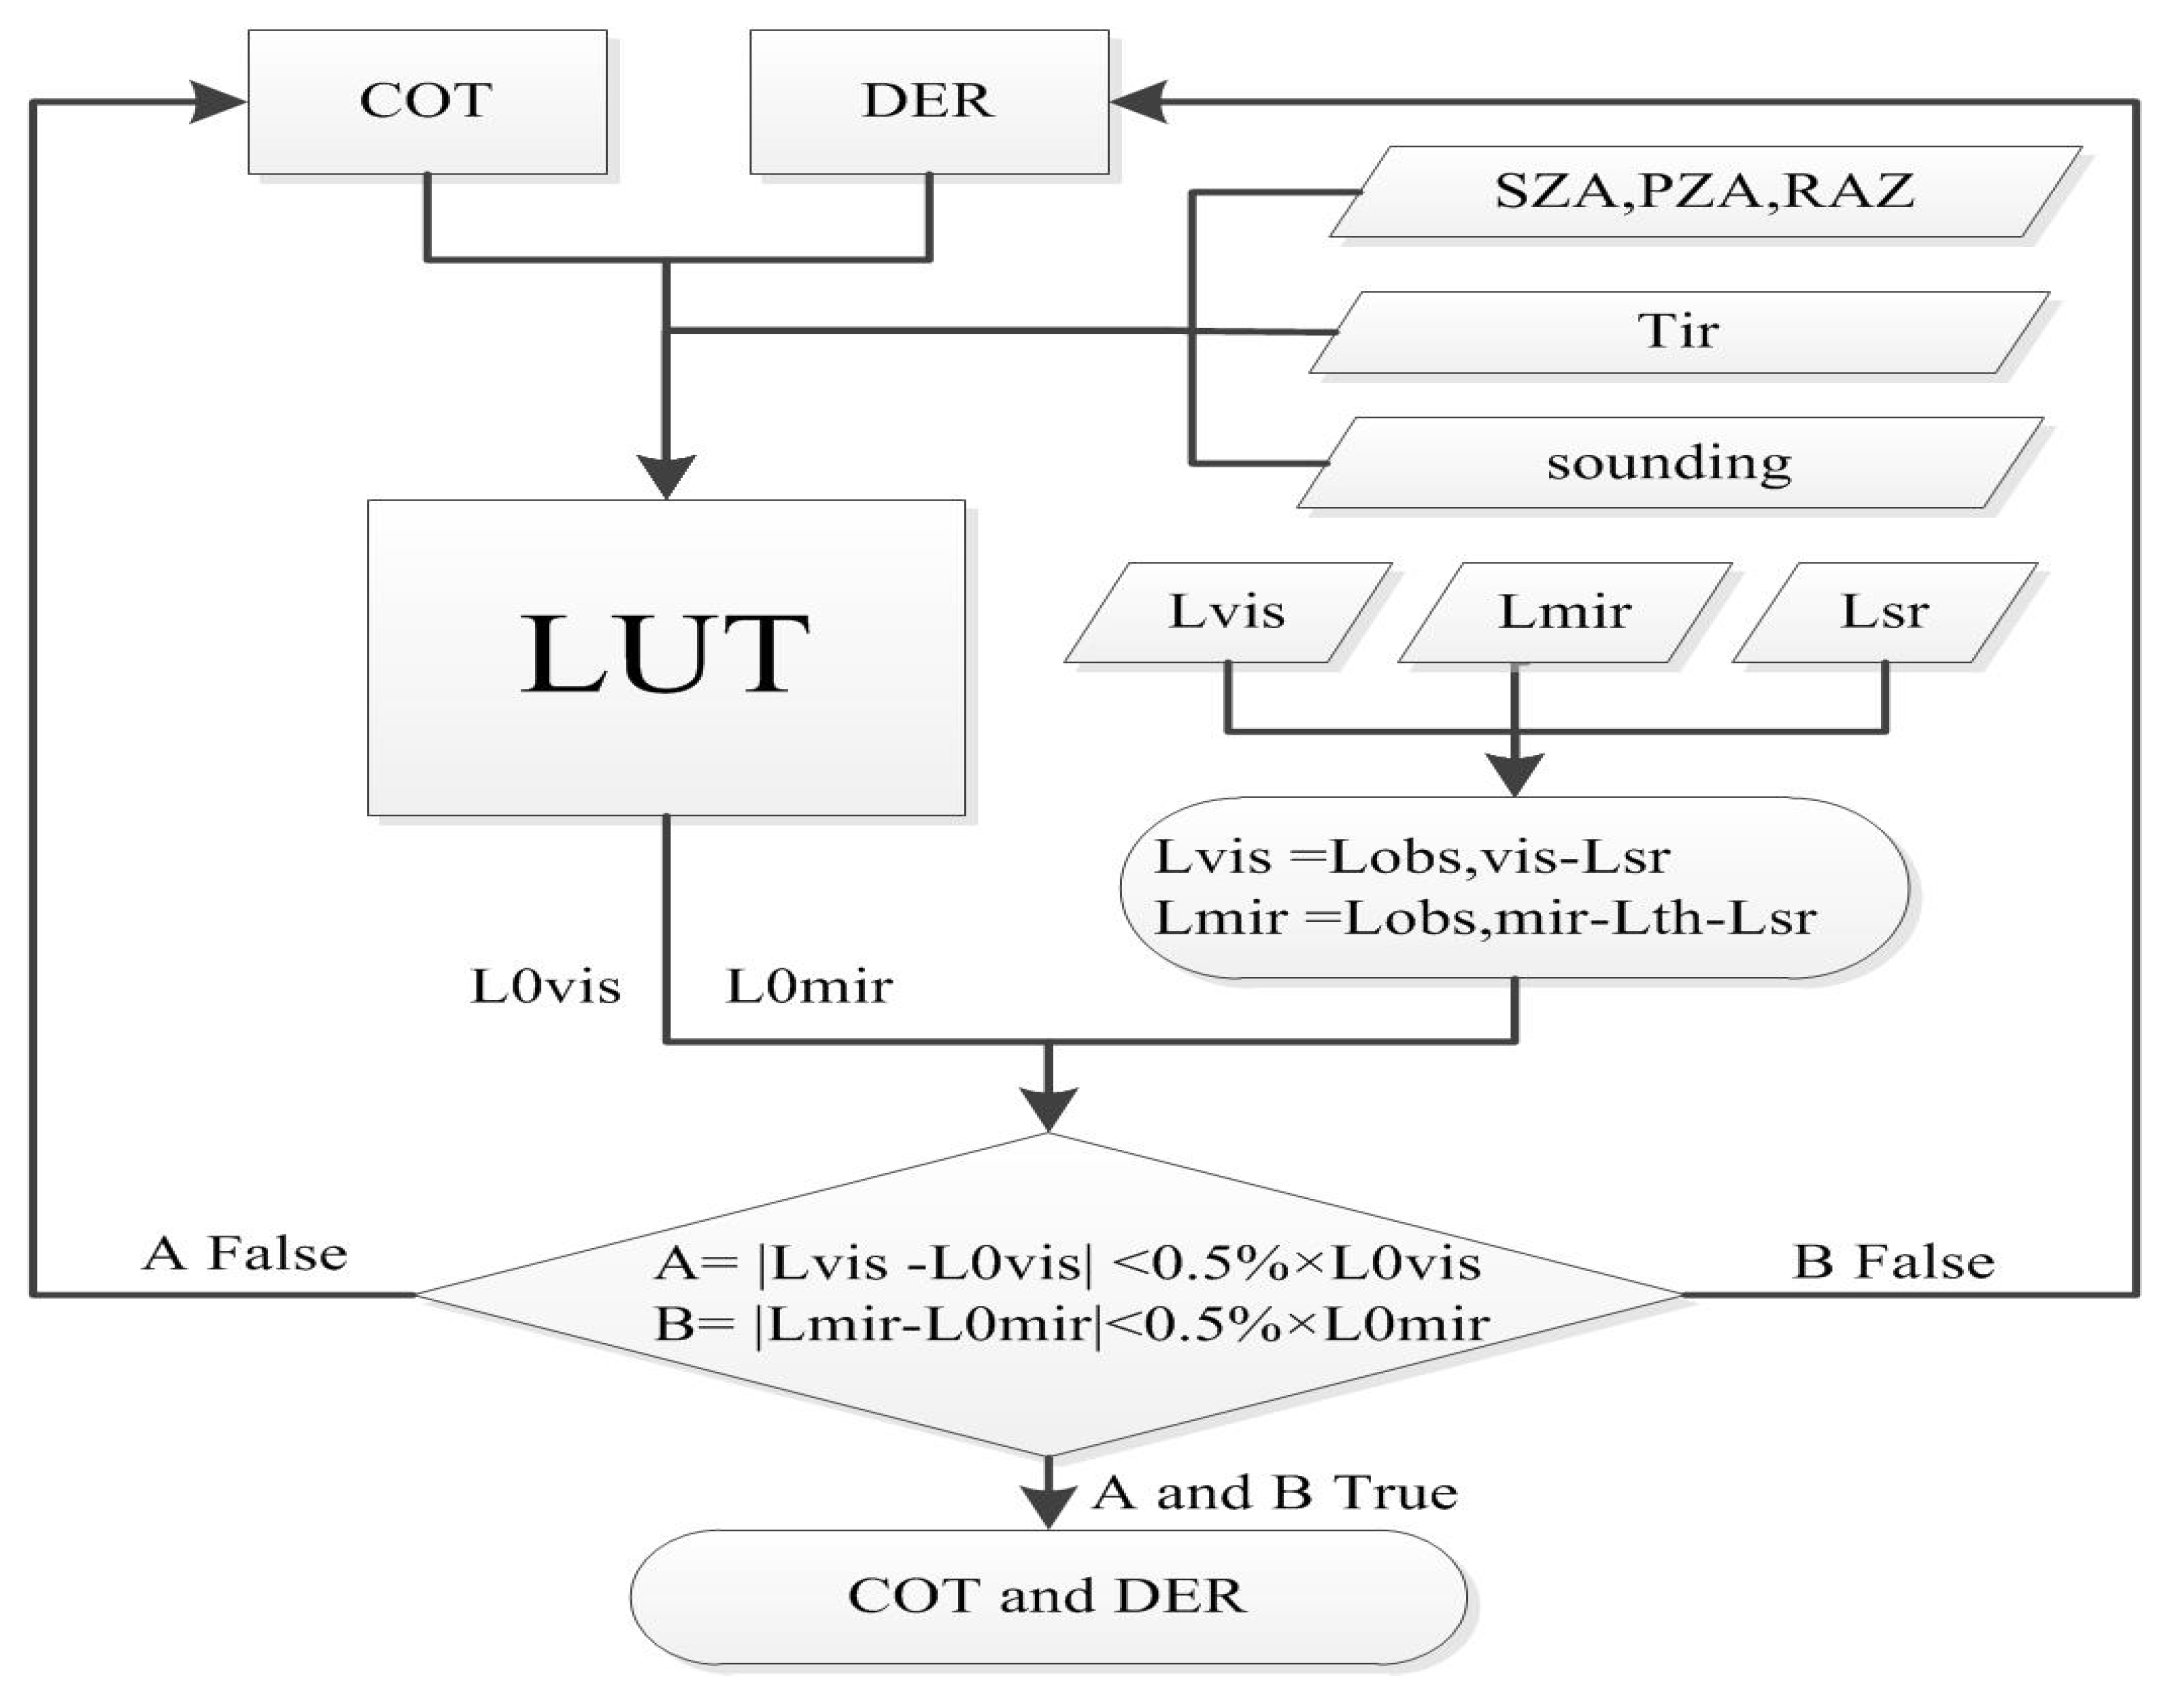
Figure 3). This required the following three steps:
(1) Initial estimates of COT and DER, sounding data, infrared wavelength brightness temperature (Tir), and angular variables (solar zenith angle, SZA; pixel zenith angle, PZA; relative azimuth angle, RAZ) to simulate radiance reflected upwards by clouds in the visible (L0vis, about 0.7 µm) and mid-infrared (L0mir, about 3.9 µm) channels with a radiative transfer model, which utilizes the spectral response functions corresponding to the satellite sensors. Results were stored in look up tables (LUT);
(2) The radiance reflected upwards by clouds was measured in visible wavelength (Lvis) and obtained through observed cloud-up-reflected radiance in visible wavelength (Lobs, vis) minus ground-reflected radiance in visible wavelength (Lsr). Mid-infrared wavelength radiance (Lmir) was obtained through observed mid-infrared wavelength radiance (Lobs, mir) minus both surface radiance (Lsr) and thermal radiance (Lth);
(3) If either of the conditions (A or B) in
Figure 3 was false, the initial COT or DER value was iteratively modified. Then steps (1) and (2) were repeated until both A and B were true and the corresponding output values for COT and DER were found.
Figure 3.
COT and DER retrieval flow chart.
Figure 3.
COT and DER retrieval flow chart.
3.2.2. Adaptation of the CAPCOM Algorithm to MTSAT JAMI and MODIS
To adapt CAPCOM to MTSAT(-1R/-2) JAMI and MODIS, the spectral response functions of the visible (0.725 µm), mid-infrared (3.9 µm), and infrared (10.8 µm) channels from MTSAT(-1R/-2) JAMI and those of the visible (ch. 1, 0.65 µm), mid-infrared (ch. 20, 3.7 µm), and infrared (ch. 31, 10.8 µm) channels from MODIS were included in the radiative transfer code, and the LUTs for MTSAT(-1R/-2) JAMI and MODIS (
Section 3.2.1) were calculated.
The adaptations of the CAPCOM execution procedure presented in
Section 3.2.1 are described as the following:
In step (1),
(1) sounding data for CAPCOM is complemented by the standard summer mid-latitude profile [
29] for the upper atmosphere (>10 km);
(2) for MTSAT(-1R/-2) JAMI, angular variables (SZA, PZA, RAZ) are calculated with temporal and spatial resolutions of 1 h and 0.05°, respectively; for MODIS, the information is already stored in the meta data.
In step (2),
(1) for MTSAT(-1R/-2) JAMI, the surface albedo (ALB) for the visible channel (0.725 µm) and Lsr are obtained by calculating a minimum albedo composite of 30 days before the scene in question; for MODIS, the ALB for the visible (0.65 µm) channel is available from the MYD09 product, which provides eight-day composites of the surface reflectance;
(2) for MTSAT(-1R/-2) JAMI, the surface albedo in the mid-infrared channel is extracted according to methods presented by Nakajima and Nakajima [
16] and Kawamoto
et al. [
13]. The solar radiance in the 3.9 µm channel is calculated by subtracting the thermal radiance from the total radiance of the 3.9 µm channel. The thermal radiance in the 3.9 µm channel is obtained by solving the inverse Planck function (Equation (3)) with the 10.8 µm channel temperature and the central wavelength of the 3.9 µm channel,
where Rad is radiance, T is the black-body temperature at 10.8 µm, and fk1, fk2, bc1, and bc2 are the constants of MTSAT JAMI channel 3.9 µm (
http://cimss.ssec.wisc.edu/goes/calibration/).
The albedo in the 3.9 µm wavelength is obtained by dividing the reflected radiance by the incident radiance which is weighted by the spectral response function of the 3.9 µm channel (Equation (4)) [
30],
wherein L is the reflected radiance in the 3.9 µm channel, Rad is the radiance converted from 10.8 µm based on Equation (3), T is the brightness temperature of the corresponding pixel in the 10.8 µm channel, t is the total transmissivity, F is the extra terrestrial solar flux, and µ is the cosine of the solar zenith angle. The reflected radiance in the mid-infrared (3.9 µm) channel is calculated from a minimum value corresponding to the ALB in the visible channel.
MODIS Lsr observations for mid-infrared (3.9 µm) are derived from the same method as for MTSAT-JAMI, and are named MODIS-CAPCOM.
3.3. Validation
The data from 64 fog/LST events over the Yellow Sea are summarized in
Table 2. Selection of the date depended on the availability of data for each data set depicted in
Table 1 during a fog/LST event occurrence over the study area. Ice clouds and other bright surfaces were excluded from the samples in order to confine the validation of COT and DER to LST/fog pixels. Simple thresholds were applied to classify LST pixels without adjusting the small bias for the corresponding channel between MTSAT-1R/-2 and MODIS sensors.
The threshold (right-hand term is −8 K in Equation (5)) is widely used and related to the work of Bendix and Bachmann [
31], who detected fog/LST pixels based on difference in brightness temperatures between the 10.8 µm and 3.75 µm AVHRR channels. Other authors have adapted a similar procedure for fog detection to geostationary satellites [
32,
33,
34]. In Equation (5), the threshold was set to 15 to exclude all the cloud-free (no fog and no cloud) pixels because some cloud-free pixels are mixed in the values between −5 and 15 [
35],
wherein IR3.9 µm and IR10.8 µm are the infrared brightness temperatures of 3.9 µm and 10.8 µm channels, respectively.
To differentiate cloud from cloud-free pixels, we chose a fixed threshold of 0.1 in Equation (6) [
36],
wherein VIS and VIS_background are the visible channel (0.725 µm) reflectance and the background reflectance, respectively.
To extract both fog and low cloud pixels, a threshold of −8 K was applied in Equation (7) [
37],
Equations (5) and (6) ensure all possible cloud-free pixels are excluded, while Equation (7) keeps fog and some low clouds. Although Equation (7) excludes some low cloud pixels, there are still enough LST pixels left for a proper validation of COT and DER validation. In the case of MODIS and JAMI, LST pixels that passed all three tests using Equations (5)–(7) were then used for the comparison.
To evaluate the performance of the JAMI DER and COT retrievals of MODIS products, the latter were linearly interpolated to a resolution of 0.05°. The data from MODIS 1B were interpolated to a 0.05° resolution before calculating the COT and DER in CAPCOM.
CloudSat data were available for six imaging scenes. The MODIS product and the JAMI-based DER and COT results were also linearly interpolated to the CloudSat footprints (~1.1 km).
Correlation coefficients and the root mean square error (RMSE) were calculated among CloudSat-, MYD06-, JAMI-, and MODIS-based COT and DER values to get an initial assessment of the JAMI retrievals. Six groups of COT/DER comparisons were obtained because of the six CloudSat scenes available.
The MODIS-based data set was compared to the COT and DER retrievals for the whole data set (64 scenes from 39 days) over the Yellow Sea. For MODIS products, LST pixels with an uncertainty value “Cloud Optical Thickness Relative Uncertainty (percent)” and “Cloud Effective Particle Radius Relative Uncertainty (percent)” of less than 20% were taken into account. Because of the apparent time difference between the satellite imaging scenes and potential cloud movement during this time, LST pixels only came into consideration when the difference in brightness temperature between the 10.8 µm MODIS and JAMI channels was less than 1 K. This served to exclude cloud edge, and fragmentary cloud pixel effects are excluded from the assessment, though some multi-layer cloud pixels were still mixed into the detected fog/LST pixels.
4. Results
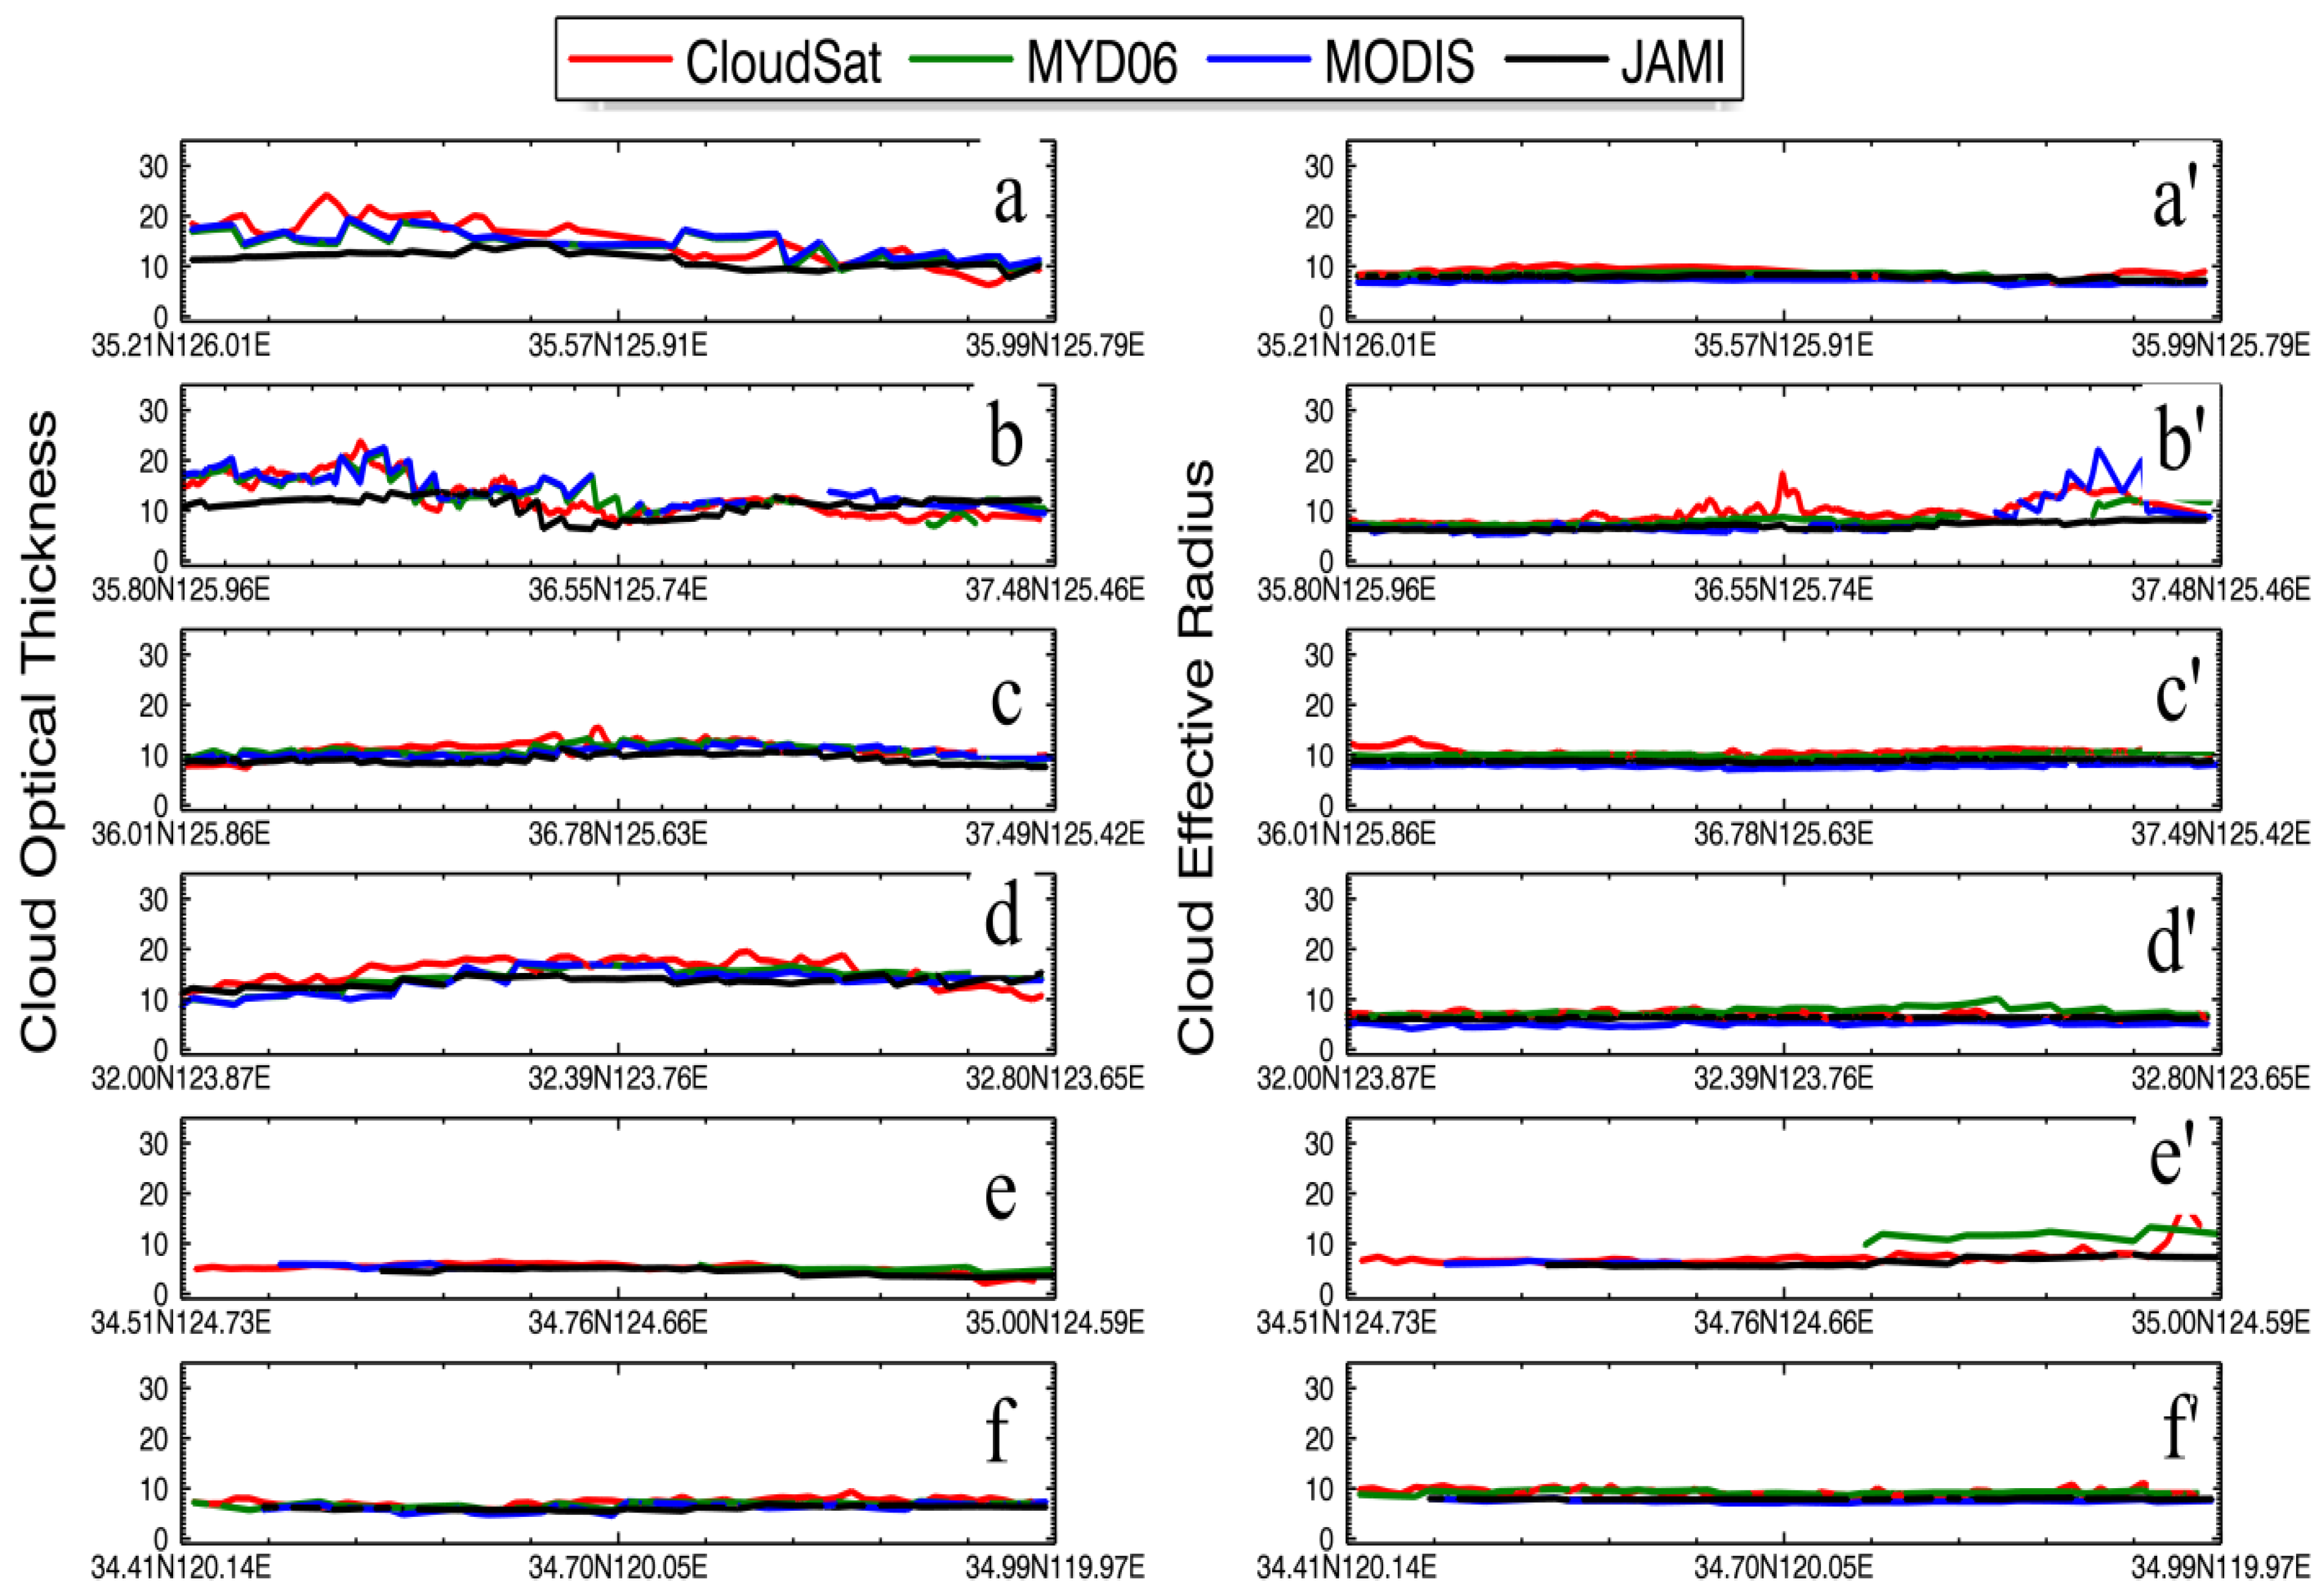
Figure 4 shows the cross-sections of COT and DER over the Yellow Sea. The data indicate clear deviations in the JAMI retrievals in the two instances in which CloudSat data are available (
Figure 4a,b) before 2011 without visible channel re-calibration. For the four test cases after 2011 (
Figure 4c–f), the adapted CAPCOM-based JAMI retrieval of COT exhibits good overall performance. It is generally well within the range of scatter of the other three data sets and performs better than cases prior to 2011.
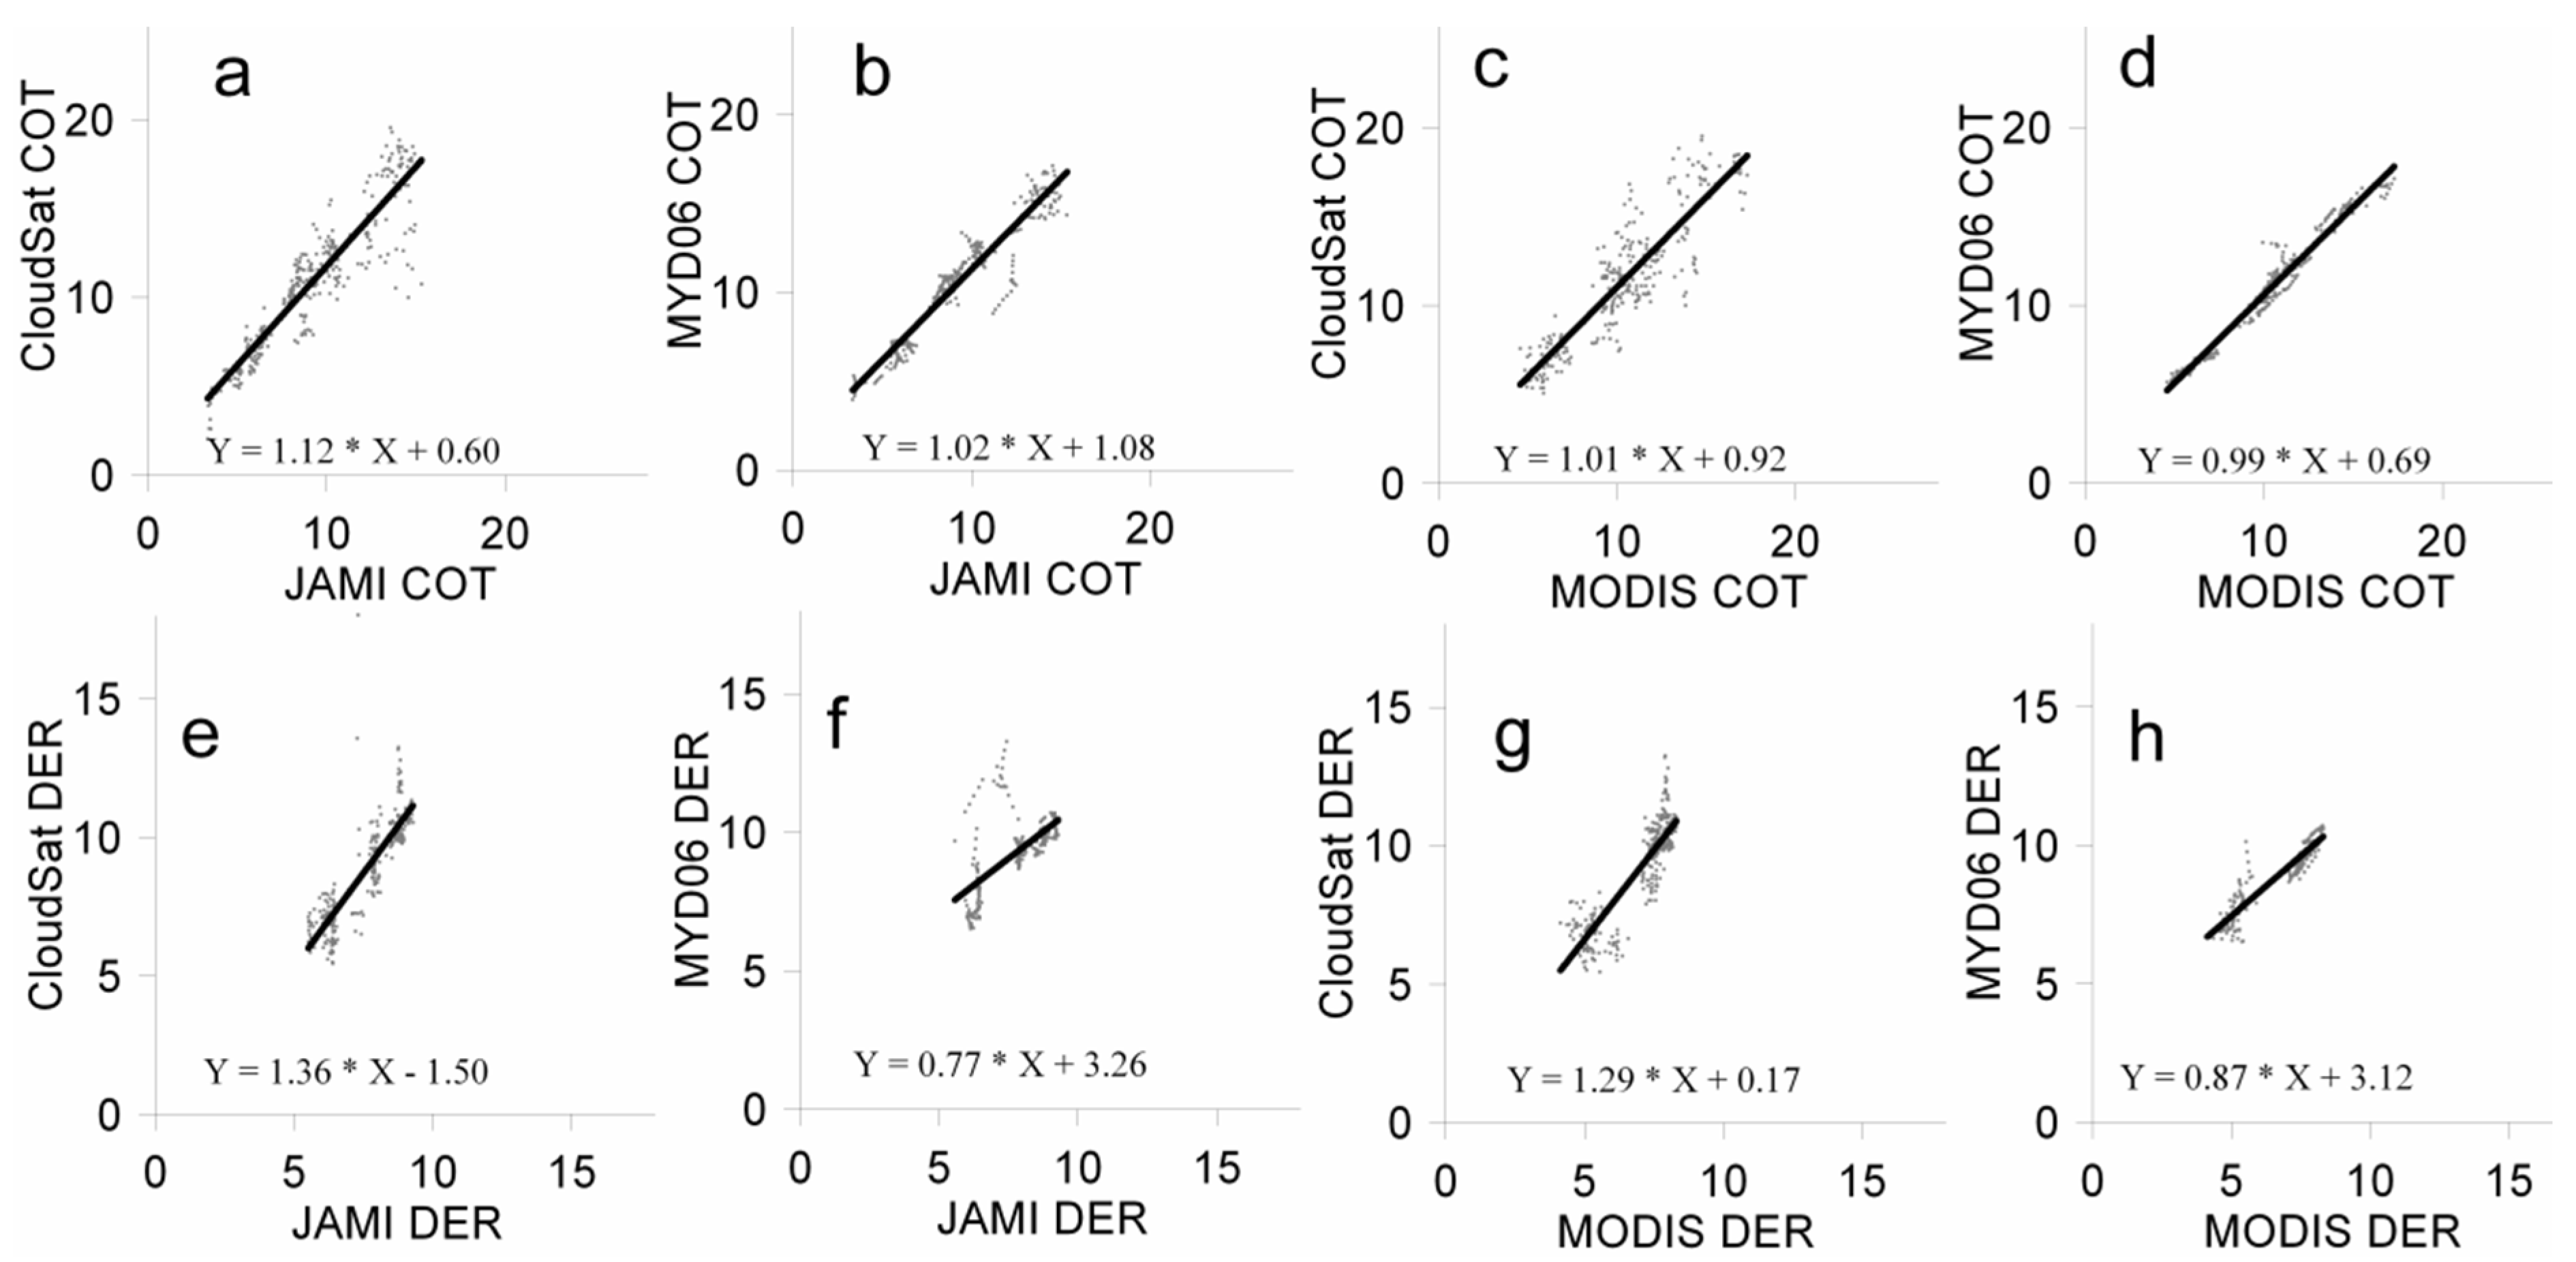
Detailed statistics for the four post-2011 cases in
Figure 4 are depicted in
Figure 5 and
Table 3. Compared to the COT from the CloudSat, the COT output of JAMI is better (
r = 0.92) than the COT of MODIS (
r = 0.89). Compared to MYD06, the COT of MODIS is slightly more similar (
r = 0.98) than that of JAMI (
r = 0.95). Aside from the lower scatter of the MYD06/MODIS compared to MYD06/JAMI COT, MODIS- and JAMI-derived COT products show nearly the same magnitude as CloudSat-derived COT, with the MODIS values being slightly closer to the CloudSat values.
Figure 4.
COT and DER comparison for LST clouds from CloudSat, MYD06, MODIS, and JAMI for 14 April 2009 (a, a'), 19 May 2010 (b, b'), 11 May 2013 (c, c'), 25 May 2013 (d, d'), 3 June 2013 (e, e'), 8 April 2014 (f, f') over the Yellow Sea along the CloudSat footpath.
Figure 4.
COT and DER comparison for LST clouds from CloudSat, MYD06, MODIS, and JAMI for 14 April 2009 (a, a'), 19 May 2010 (b, b'), 11 May 2013 (c, c'), 25 May 2013 (d, d'), 3 June 2013 (e, e'), 8 April 2014 (f, f') over the Yellow Sea along the CloudSat footpath.
With regard to DER, the CAPCOM-based MODIS retrieval (r = 0.89) corresponds well to the CloudSat DER retrieval and is better than the JAMI retrieval (r = 0.87). Compared to MYD06, JAMI DER values (r = 0.66) are slightly smaller than the CloudSat DER values. Interestingly, the DER product based on MODIS (RMSE = 1.8) reveals a larger scatter than that observed for the COT retrieval (RMSE = 1.67). Compared to MYD06, CAPCOM-based MODIS DER shows a slight overestimation of DER compared to the CloudSat, which suggests MYD06 generally performs better.
We also investigated the effect of re-calibration on CAPCOM’s retrieval performance. Due to the poor performance of MTSAT-1R JAMI COT retrieval, the 64 LST cases taken for the Yellow Sea were divided into two sets. The first set included MTSAT-1R JAMI cases prior to 2011, and the second set included MTSAT-2 JAMI since 2011. Each set was analyzed separately (see
Figure 6 for the first set and
Figure 7 for the second set).
Figure 5.
Comparison of JAMI COT among CloudSat (a) and MYD06 (b), and MODIS COT among CloudSat (c) and MYD06 (d). Also shown is a comparison of JAMI for DER among CloudSat (e) and MYD06 (f), and MODIS DER among CloudSat (g) and MYD06 (h).
Figure 5.
Comparison of JAMI COT among CloudSat (a) and MYD06 (b), and MODIS COT among CloudSat (c) and MYD06 (d). Also shown is a comparison of JAMI for DER among CloudSat (e) and MYD06 (f), and MODIS DER among CloudSat (g) and MYD06 (h).
Table 3.
Correlation coefficient (r) and RMSE between different COT/DER retrievals.
Table 3.
Correlation coefficient (r) and RMSE between different COT/DER retrievals.
| | Optical Thickness | Droplet Effective Radius |
|---|
| CloudSat | MYD06 | CloudSat | MYD06 |
|---|
| JAMI | r | 0.92 | 0.95 | 0.87 | 0.66 |
| RMSE | 2.31 | 1.66 | 1.67 | 1.80 |
| MODIS | r | 0.89 | 0.98 | 0.89 | 0.93 |
| RMSE | 1.92 | 0.84 | 2.38 | 2.24 |
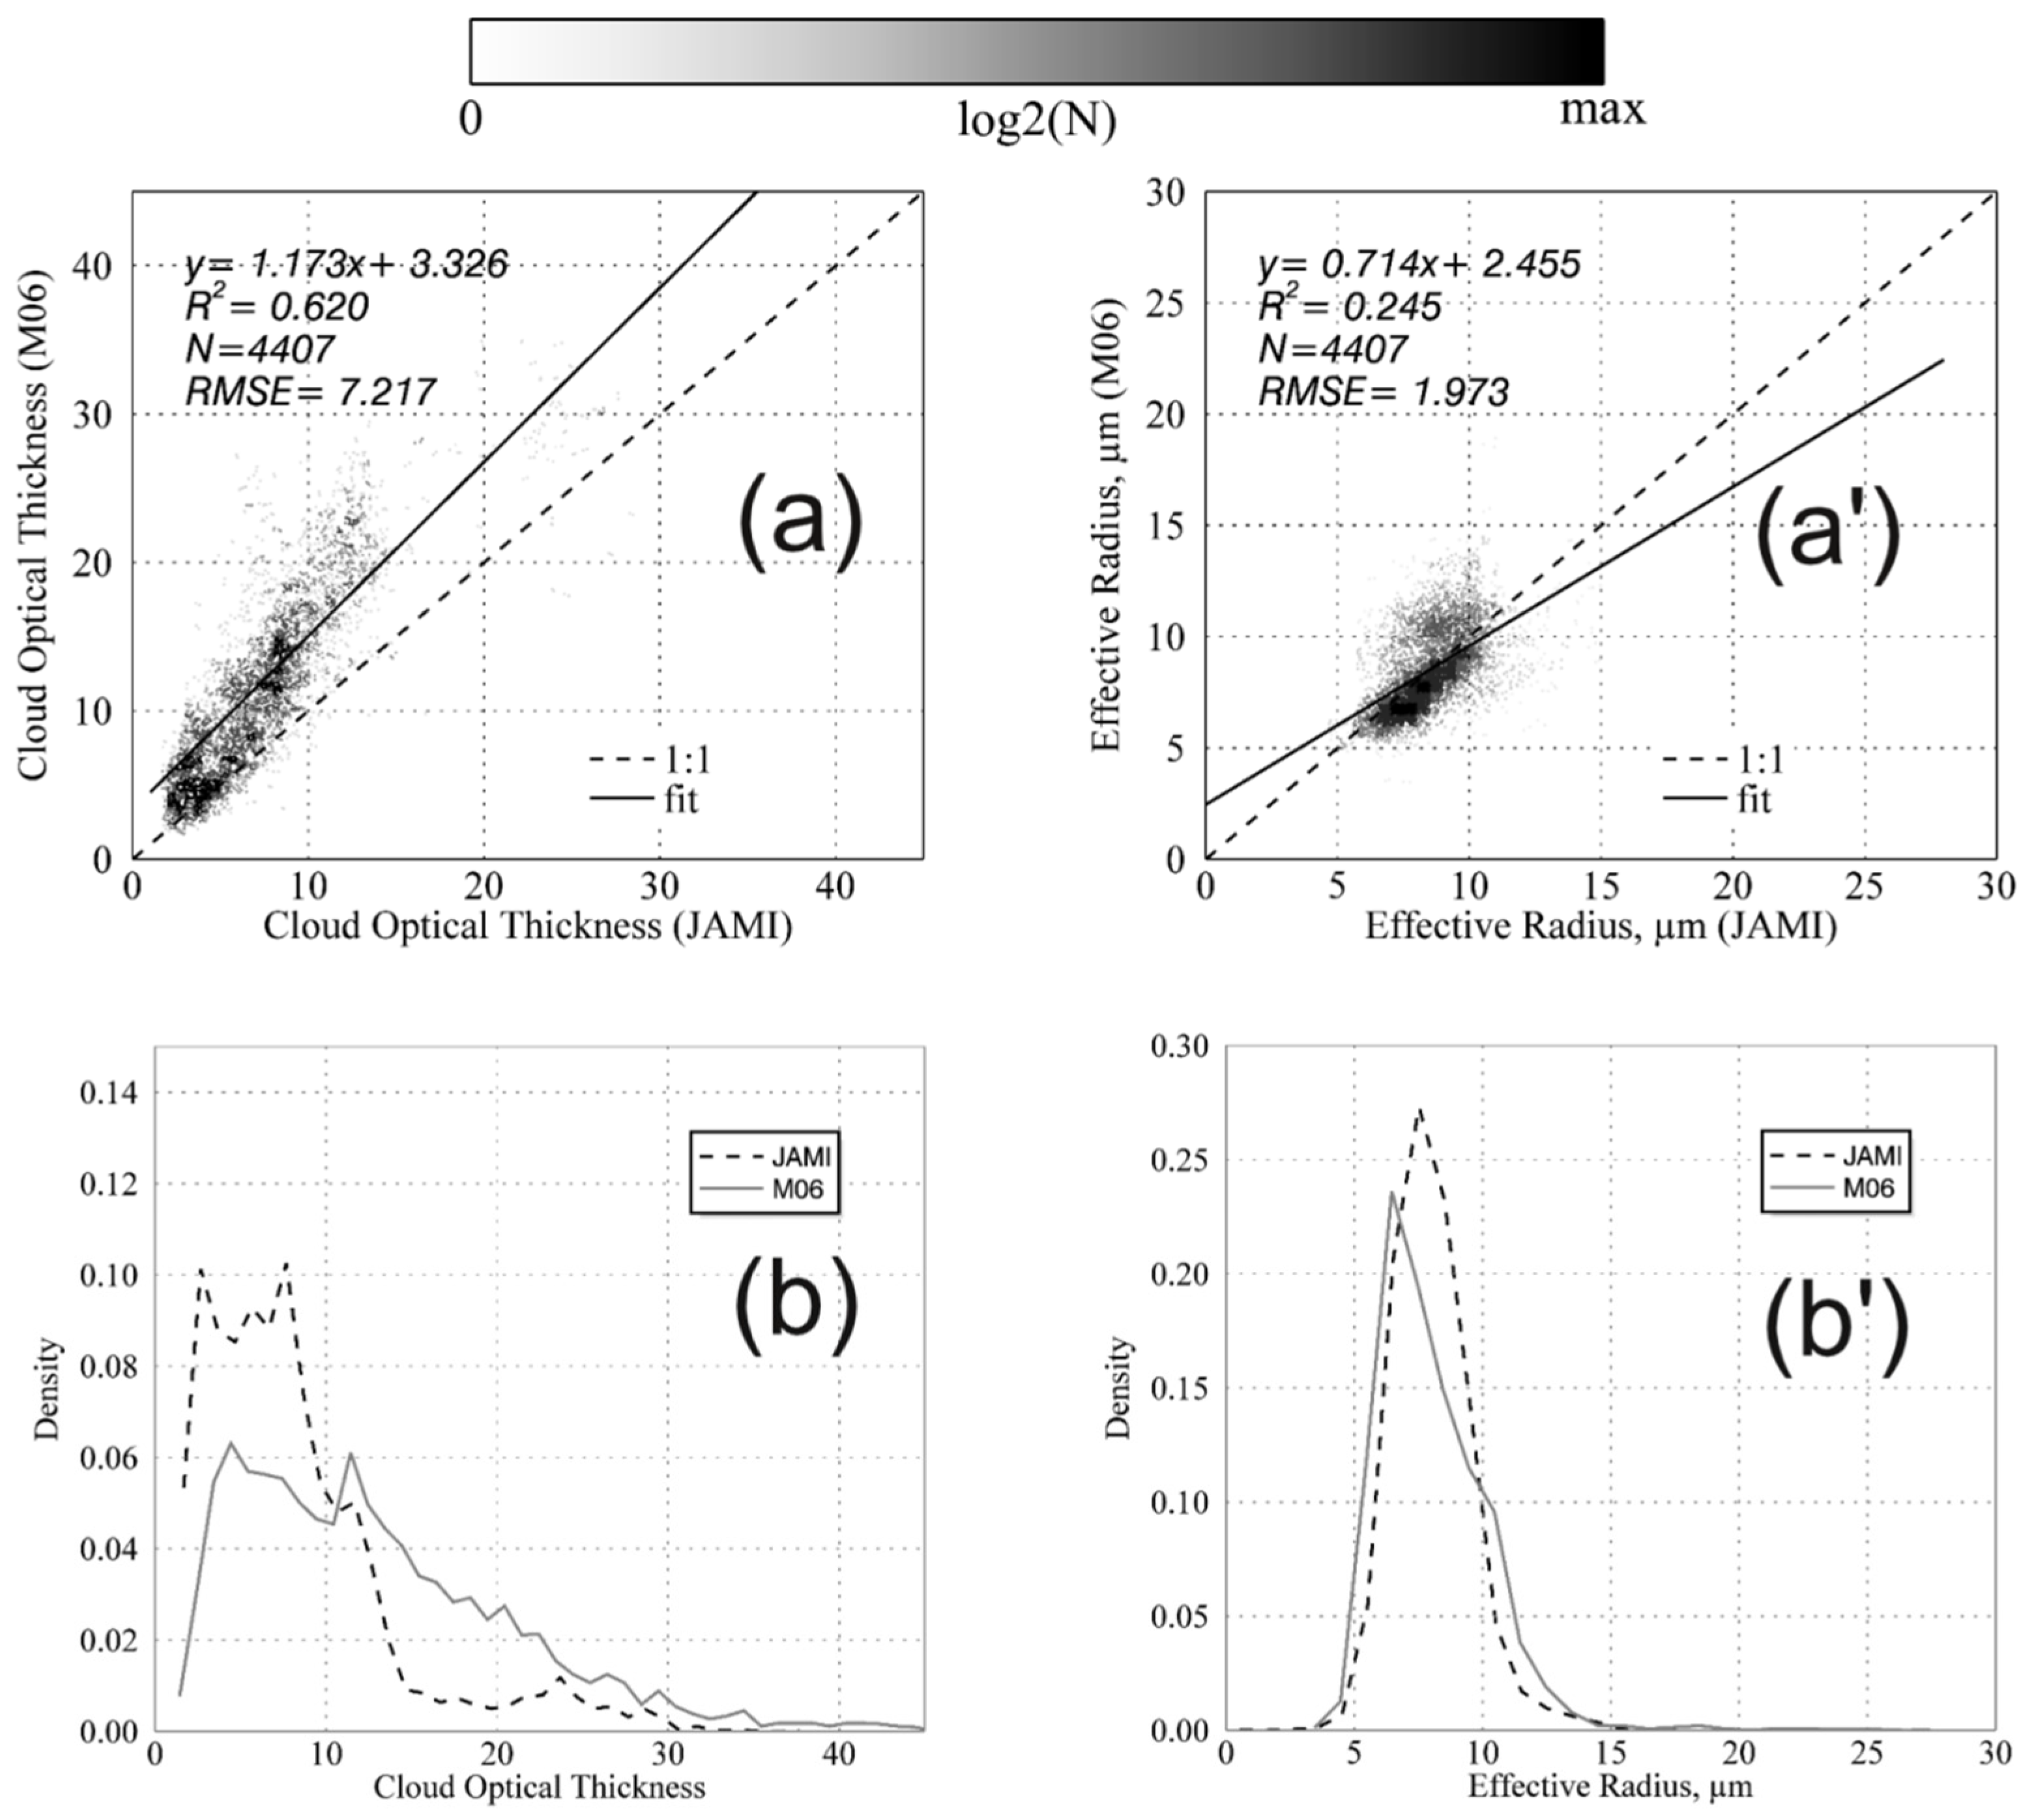
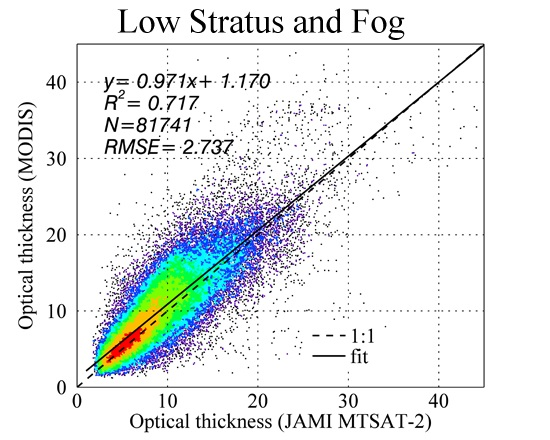
Figure 6.
COT (a) and DER (a') retrieved by CAPCOM using JAMI data (MTSAT-1R JAMI data prior to VIS re-calibration in 2011) vs. M06 (MYD06 and MOD06). Histogram density distribution difference between M06 and JAMI for COT (b) and DER (b').
Figure 6.
COT (a) and DER (a') retrieved by CAPCOM using JAMI data (MTSAT-1R JAMI data prior to VIS re-calibration in 2011) vs. M06 (MYD06 and MOD06). Histogram density distribution difference between M06 and JAMI for COT (b) and DER (b').
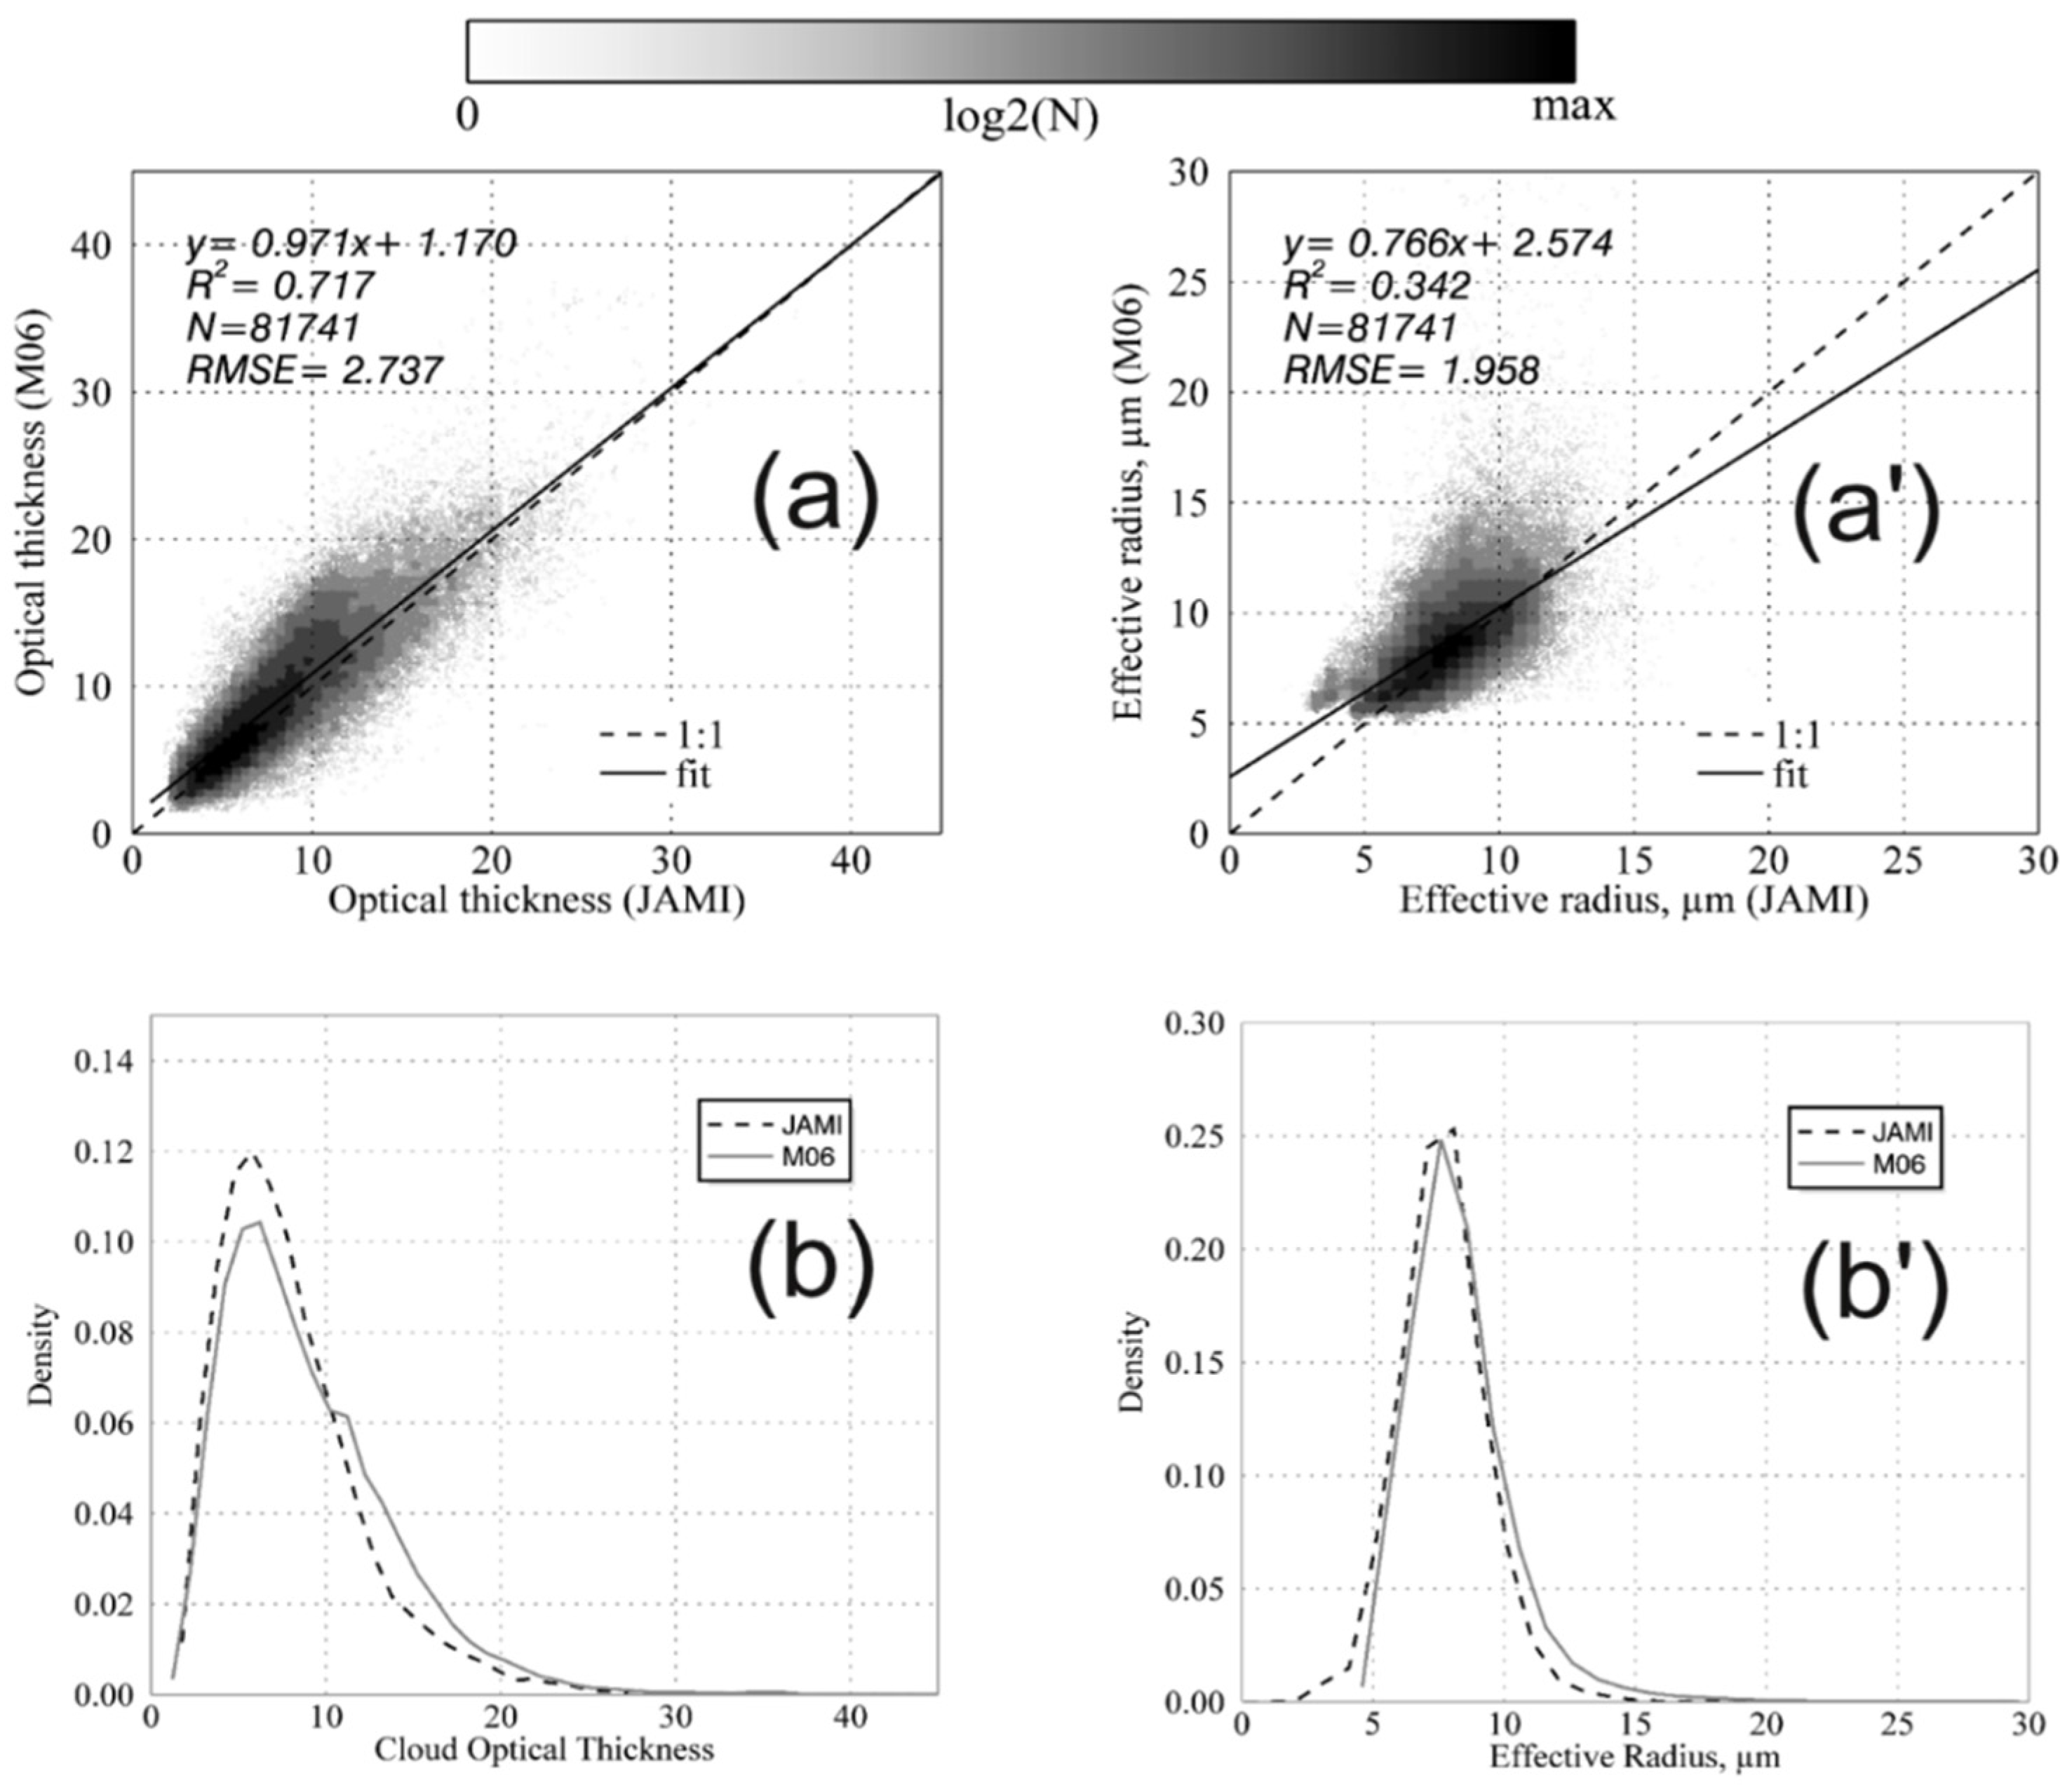
Figure 7.
(a) COT and (a') DER retrieved by CAPCOM using JAMI data (MTSAT-2 JAMI data after VIS re-calibration) vs. M06; (b, b') Histogram density distribution difference between M06 and JAMI for COT and DER.
Figure 7.
(a) COT and (a') DER retrieved by CAPCOM using JAMI data (MTSAT-2 JAMI data after VIS re-calibration) vs. M06; (b, b') Histogram density distribution difference between M06 and JAMI for COT and DER.
Figure 6a reveals a similarly negative COT bias to what Choi
et al. [
18] found, while
Figure 7a depicts a clear improvement in JAMI COT retrieval once the VIS was re-calibrated in 2011 (RMSE 2.74
versus 7.22). Re-calibration nearly eliminates the tendency to underestimate COT as magnitude increases (
Figure 6a).
Figure 7b is a histogram that also shows improved performance of COT compared to that without VIS re-calibration (
Figure 6b). DER retrieval also improved, which is reflected in a better fit of JAMI and MODIS DER distributions (compare
Figure 6b' to
Figure 7b'), because VIS reflectance also influences CAPCOM DER retrieval (even if it mostly relies on the 3.9 µm signal) to some extent.
5. Discussion
To investigate the influence of errors that COT and DER values derived from MTSAT data have on cloud thickness retrieval, we calculated cloud thickness according to the method of Cermak and Bendix [
11] for the conditions (top temperature 280 K, surface temperature 295 K) shown in
Figure 1 of the varied COT and DER according to the respective RMSE values (
Figure 6 and
Figure 7) and of cloud top height (600/300 m). The results are displayed in
Table 4.
The example is based on the theoretical initial conditions of top temperature 280 K, surface temperature 295 K, cloud top 600 m, COT 10, DER 8 µm, and a calculated cloud thickness of 268 m. Considering the COT/DER RMSE (
Figure 6 and
Figure 7), the maximum and minimum cloud thickness values were calculated for MTSAT-1R and MTSAT-2. The difference in cloud thickness (−110 m~129 m) between the theoretical example and MTSAT-1R is nearly two times that of MTSAT-2 (−61 m~62 m). In the fog detection procedure, MTSAT-1R and MTSAT-2 can detect stratus clouds when the stratus base height is positive. If the stratus top height is low (or the cloud is relatively thick compared with its top height), the error may result in reduced fog detection ability. For example in
Table 4, when cloud top height is 300 m, the theoretical example indicates there is a stratus cloud with a base height of 41 m. On the other hand, the maximum cloud thicknesses calculated by MTSAT-1R (372 m) and MTSAT-2 (318 m) are greater than the cloud top height, indicating the existence of “fog”, which is not true. Thus, if the real stratus cloud top (base) is low or the cloud is relatively thick, the error of calculated cloud thickness from MTSAT-1R and MTSAT-2 could lead to false hits in fog and low stratus detection. It is also noteworthy that MTSAT-2 calculates cloud thckness better than MTSAT-1R.
Table 4.
Calculated thickness test based on COT and DER retrieved using MTSAT-1R and MTSAT-2. Parameters of theoretical example are: top temperature 280 K, surface temperature 295 K, COT 10, DER 8 µm, and cloud top height 600/300 m. The COT and DER of MTSAT-1R and MTSAT-2 are varied according to the RMSE values in
Figure 6 and
Figure 7.
Table 4.
Calculated thickness test based on COT and DER retrieved using MTSAT-1R and MTSAT-2. Parameters of theoretical example are: top temperature 280 K, surface temperature 295 K, COT 10, DER 8 µm, and cloud top height 600/300 m. The COT and DER of MTSAT-1R and MTSAT-2 are varied according to the RMSE values in Figure 6 and Figure 7.
| | COT and DER | Cloud Top = 600 (m) | Cloud Top = 300 (m) |
|---|
| Min-Thickness (Cloud Base Height, m) | Max-Thickness (Cloud Base Height, m) | Min-Thickness (Cloud Base Height, m) | Max-Thickness (Cloud Base Height, m) |
|---|
| Theoretical example | COT = 10 | 268 (332) | 268 (332) | 258 (42) | 258 (42) |
| DER = 8 µm |
| MTSAT-1R | COT = 10 ± 7.217 | 138 (462) | 378 (222) | 134 (166) | 372 (−72) |
| DER = 8 ± 1.973 µm |
| Thickness difference between Standard and MTSAT-1R (Thickness difference to cloud top height, %) | 129 (22%) | −110 (18%) | 125 (42%) | −114 (38%) |
| MTSAT-2 | COT = 10 ± 2.737 | 206 (394) | 329 (271) | 199 (101) | 318 (−18) |
| DER = 8 ± 1.958 µm |
| Thickness difference between Standard and MTSAT-2 (Thickness difference to cloud top height, %) | 62 (10%) | −61 (10%) | 59 (20%) | −60 (20%) |
6. Conclusions
The evaluation of the CAPCOM method for LST applied to JAMI, since VIS re-calibration in 2011, shows reasonable retrieval results of COT and DER compared to CloudSat and MYD06/MOD06 products. The differences are due to inherent uncertainties involved in the comparison process. First, there is a considerable time difference (about 10, 20, 15, and 30 min for the four cases since 2011, respectively) between CloudSat and MTSAT JAMI retrievals, which may affect the results of the comparison. This time difference does not exist between Aqua MODIS products and CloudSat because they are delayed by just 1 min in the A-train constellation [
38]. It should be kept in mind that because cloud development is a highly dynamic process, even small time differences can be critical and of great importance for considerable oscillation in the microphysical properties of LST [
39]. Second, the CloudSat and MYD06 products are calculated using vertical atmospheric profiles, whereas the case-adapted CAPCOM retrievals from JAMI and MODIS use real-time radiosonde data in this study. The different water vapor contents in the profiles used for different retrievals caused modifications of atmospheric extinction [
25,
40], which could be one explanation for the apparent JAMI/MODIS COT scatter revealed in
Section 4.
MTSAT JAMI retrieval of COT has certainly improved since 2011, which is consistent with the results reported by Choi and Ho [
18]. Assuming that cloud top height can be accurately retrieved, the increased accuracy of COT and DER retrievals could improve forecasters’ ability to differentiate separate fog from stratus clouds. Fog detection capability is reduced for thick, low clouds because the significant error in cloud thickness produced from the bias of COT and DER is large. Sometimes the error is even as large as the cloud base height. As a result, COT and DER bias could strongly influence the cloud base height retrieval and lead to further failure in sea fog detection. Considering the different resolutions of the CloudSat, MODIS, and MTSAT JAMI pixels, the COT and DER values retrieved from MTSAT can detect daytime fog over the Yellow Sea in the method suggested by Cermak and Bendix [
11]. Adjustments to the fog detection techniques for the Yellow Sea fog require additional research because of the limited spectral resolution of MTSAT JAMI compared with MSG SEVIRI and GEO satellites’ inaccurate detection of low cloud top height over the Yellow Sea.


