1. Introduction
The safety of power-line infrastructure significantly affects our everyday life and industrial activities. Automating the monitoring of high-voltage transmission lines is of importance to power utility companies [
1]. There are two components of the automated monitoring methodology: detection of potential hazards, such as encroaching vegetation [
2,
3], and the analysis of power-line structural stability. Therefore, an important consideration when reconstructing 3D power-lines is to assert that the physical parameters of the cable are still within a safe margin while quickly detecting anomalies or defects [
4].
Due to its ability to provide dense, fast and accurate measurements, Airborne Laser Scanning (ALS) is becoming increasingly popular for extensive, large area surveying tasks [
5,
6]. Used in power-line settings, ALS is able to extract information about objects with respect to power-line network system [
7,
8]. Therefore, an algorithm to reconstruct individual spans using ALS is introduced in this paper to model the sag of individual spans, or to compute its parameters.
Before reconstruction, the point cloud data have to be classified and extract the power-line points. Axelsson [
9] introduced a method of three steps to extracting power-line points: (1) separation of ground surface; (2) classification of objects in power-lines and vegetation; and (3) refining classification of power-lines. Clode and Rottensteiner [
10] detected trees and power lines from less than one point per m
2 point cloud in Sydney. First and last pulse return differences were applied. Zhu and Hyyppä proposed an automated power line detection method for forest environments [
11].
There have been many methods for power-line span reconstruction, which mainly focus on constructing a singular line span. McLaughlin defined the parametric model of a power-line span, and extracted each individual span from classified power-line point cloud data [
12]. Firstly, the model is fitted locally to a small seed region, which is then grown by adding neighbor points consistent with the trend of the model. After a region has been grown, the parameters of its corresponding model are re-estimated. This process is iterated until a given termination criteria is met. Jwa
et al., introduced a method for detecting and modeling power-line spans based on perceptual grouping framework which groups similar features at different levels of information using a Voxel-based Piece-wise Line Detector (VPLD) method for power-line modeling [
13]. Melzer and Briese firstly use a 2D Hough transformation to locate the groups of parallel power-lines in the projection points onto the XY plane. A 3D fit for each power-line span is then computed locally within its corresponding corridor [
14]. Liang
et al. considered that points in the same power-line would be close together whereas the points in different power-lines would be far apart [
15]. Therefore, a power-line points clustering method based on KD trees was adopted. This method only considered the point distance and it ignored breakage points, which may have detrimental effects. Jwa and Sohn proposed a piecewise catenary curve model-growing algorithm to identify the points, which achieved clustering by iterative catenary curve fitting and cubic growing [
16]. To a certain degree, this method is limited with the fitting curve and the selection of the initial growing cube. Based on the piecewise model growing [
16], Sohn
et al., precisely modeled power-line spans with catenary curve models in 3D, once the pylon localization is accomplished [
17]. Cheng
et al. introduced a method based on vehicle-borne LiDAR to cluster of power-line points, in which the initial clustering and clustering recovery procedures were conducted iteratively to identify each power line [
18]. Also the sag reconstruction results are mainly based on robustness of the methods, it is also influenced to ambient conditions such as the temperature and the ageing of spans [
19]. Lu and Kieloch [
20] surveyed the modeling accuracy of power lines based on conductor temperature. They found that wind, electrical load and solar radiation are the three major factors that may affect the modeling accuracy. Because the data used in this paper were mainly collected in one time, we mainly focused on the reconstruction on certain ambient conditions when the point cloud data were obtained.
The methods mentioned above provide good results for power-lines reconstruction. However, if data omission occurs due to variations of laser position, occlusions, and insufficient data resolution, there are many failures such as undetected and splitting of transmission lines [
12]. Therefore, more robust and integrated power-line modeling is important for monitoring of power safety.
Power-lines are distributed regularly between two neighbor pylons and are nearly parallel, with the same direction, sag and other physical properties. Using all of this information can improve existing power-line modeling results which only consider local information of power-line spans.
- (1)
Power-lines and pylons are two types of related objects. In the power-line reconstruction process, we can use the distribution of neighbor pylons to improve the reconstruction results of power-lines.
- (2)
The group set of power-lines spanning two pylons have same properties. Thus, the parameters of each line span are similar. Therefore, reconstructing a group set of power-line spans between two neighbor pylons together can avoid the fitting failures of initial parameters by reconstructing power-line span one by one.
In this paper, an improved and robust algorithm is proposed to reconstruct transmission line spans from ALS data based on the two properties mentioned above, in order to overcome the reconstruction failures caused by data sparseness and occlusion. Before reconstruction, data are firstly classified into five categories: power-line, pylon, vegetation, building and ground. Then, an algorithm based on RANdom SAmple Consensus (RANSAC) rule [
21] is introduced to reconstruct each individual power-line span.
2. Point Cloud Data Classification
In this section, an algorithm is proposed to classify data into five categories: power-line, vegetation, building, ground and pylon. This classification process is mainly based on our previous work [
22], which is a machine learning [
23,
24] algorithm. Firstly, 26 features based on the geometry and echo information of the point cloud data are calculated. A JointBoost classifier [
25] is then used to classify the point cloud data into different target classes. The objects in five categories are classified simultaneously rather than by directly extracing power-line points. Although direct power-line extraction methods using discriminant rules [
14] are effective, these methods still have inherent limitations when dealing with complex landscapes, and they lack the contextual information [
26,
27] provided by other kinds of objects. The simultaneous classification can be used to overcome these defaults, and as we mention before, the detection of pylons together is helpful for power-lines reconstruction. As for power-line point detection, the features, which can effectively distinguish line objects, such as line echo, linearity and Hough transformation are mainly used [
22].
In the JointBoost classifier training step, balanced object-based sampling is important [
28]. In our study, the training step was performed with samples (points with true labels) of equal number per class. Another part of the training set was randomly chosen as a validation set. The validation set was used to measure the effectiveness of the classifier parameters. The trained classifier was then used to classify the test data. A well-trained JointBoost classifier with properly selected features can generate good classification results [
22]. The precision and recall of the classification are important considerations for power-line reconstruction. It is found that both the precision and recall for the pylon and power-lines are high (
Section 4.1).
3. 3D Reconstruction of Power-Line Spans
A power-line span can be reconstructed using a certain pattern which can be represented by a catenary curve [
12]. The traditional power-line reconstruction are mainly region grouping based [
12,
13]. Using these methods to estimate the parameters of a line span, the algorithms usually begin with an arbitrarily chosen local section, and then iteratively identifying adjacent samples on the same span, progressively redefining the catenary parameters. The extraction and reconstruction of some singular span could fail in some situations: splitting, undetected,
etc. This is primarily due to sparseness of the data, resulting in a failure to first compute a reliable local model or being unable to find the connected samples.
In order to overcome these faults, we introduce an improved method based on RANSAC rule, which is an iterative method to estimate the parameters of a mathematical model from a set of observed data that contains a number of outliers, resulting in robustly reconstructed power-line spans. During the iterations, general RANSAC generates a large number of hypotheses of the mathematical model parameters by randomly selecting a minimum subset of samples that each uniquely determines a set of parameters of the model. After determining an initial hypothesis of the mathematical model, the other samples are gradually added into the model to determine whether they are inliers or outliers. At last, the final results are determined if their number of inliers selected by RANSAC is bigger than a voting threshold [
29,
30]. Using the RANSAC rule in power-line reconstruction can avoid failures of initial parameters fitting which caused by the sparseness of data.
There are two key concepts in RANSAC: (1) setting the initial parameters and (2) searching for candidate samples. The inherent information of power-line distribution properties can be used to modify these two concepts in the traditional RANSAC rule in order to improve the efficiency and precision of reconstruction.
Based on the parallel distribution of power-line spans, we first use a segmentation method (
Section 3.1) to detect the similar distribution of a group of power-line spans between two neighbor pylons and further to roughly detect points that belong to a power-line span with high probability. We then improve upon the two key concepts in RANSAC rule by using this rough detection (
Section 3.2).
3.1. Similarity Detection
The distribution of power-line group set between two neighbor pylons are similar: roughly parallel, with the same sag and direction. A profile segmentation based method is used to detect these similar properties.
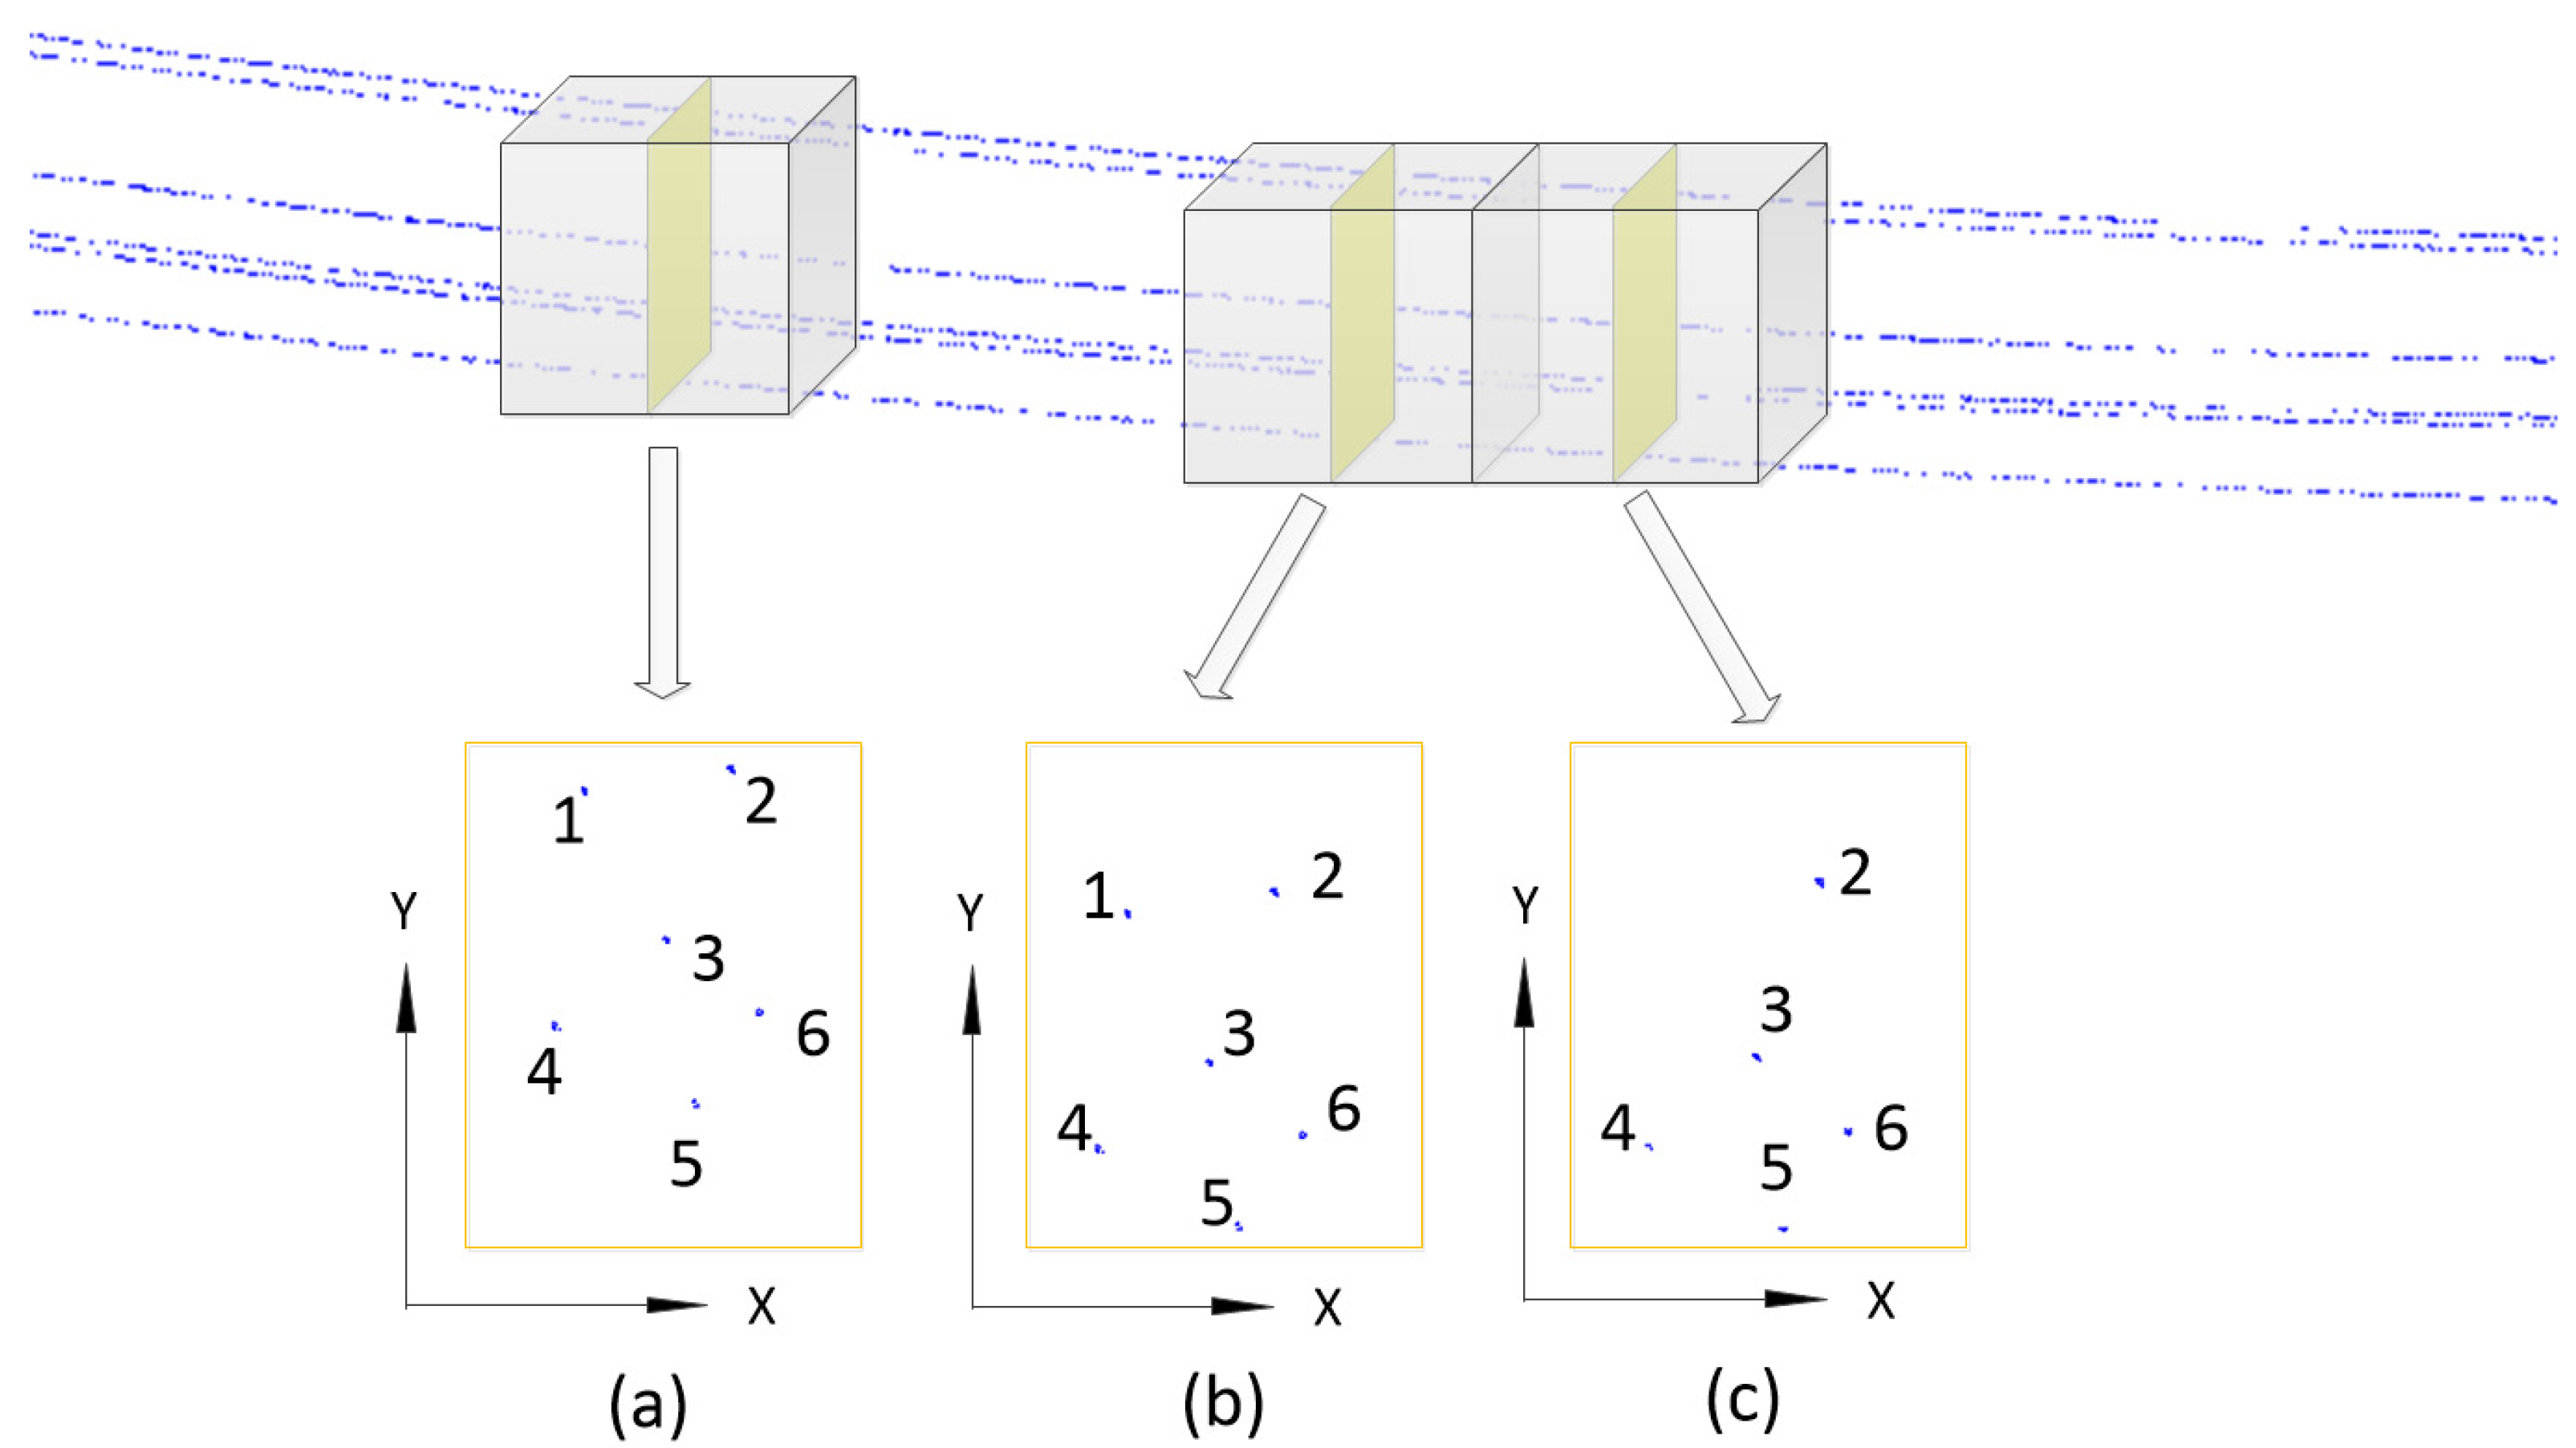
Figure 1 outlines the method of segmentation. Firstly, the power-line point data between two neighbor pylons are segmented into profiles (indicated with transparent cuboids) equally distant along the main direction of the power-lines. Then, the points within a profile are projected to its main plane (indicated with a yellow plane). A region growing algorithm is used to connect the comparable projecting points and create groups (indicated in
Figure 1, a number represents a center point of group). This segmentation method are also used for constructing neighborhood space of points. There are three levels for neighborhood space construction: point-based level [
31], voxel-based level [
32,
33] and object-level [
34]. The points within a group of a profile are considered to be within a neighborhood which containing local structure of a singular power-line. In order to maintain consistency of the coordinates among the different profiles, the coordinates for a projection plane are constructed by the following rules: (1) the X and Y axes are orthogonal to the main direction of the power-lines; and (2) the point of origin is a certain point projecting to this projection plane. As shown in
Figure 1, projected center points on neighboring profiles have a similar distribution.
Figure 1.
Similarity detection by segmentation. The corresponding center points among different profiles (represented by (a–c)) for the same power-line span are given the same number. In instances of missing data, the points do not correspond.
Figure 1.
Similarity detection by segmentation. The corresponding center points among different profiles (represented by (a–c)) for the same power-line span are given the same number. In instances of missing data, the points do not correspond.
The similar properties are used to roughly detect the points belonging to the same power-line among different profiles. We first explain this method between two profiles (
Section 3.1.1), and then expand it to many profiles (
Section 3.1.2).
3.1.1. Similarity Detection between Two Neighbor Profiles
Given two corresponding points and on two neighbor profiles and , respectively, we use two principles, neighboring and geometry matching, to detect how probable these two points are belonging to the same power-line span.
The Neighboring Ratio
Due to the projection way, the locations of center points of each power-line on adjacent profiles are similar (see
Figure 1b,c). Thus, we first use distance to test for points on a specific power-line span between two neighbor projecting profiles. The distance
is defined as
, where
and
are the coordinates of points
and
on profiles
and
, respectively.
The smaller this distance, the more probable that the corresponding points belong to a singular power-line span. The neighboring ratio is defined as:
where,
is the largest value of
.
The Geometry Matching Ratio
As mentioned previously, because of omitting or outlying power-line points, there may be failures to connect points only using the neighboring ratio. For this reason, we additionally introduce a geometry matching based method to detect the geometric similarity of the layout of points on adjacent profiles.
Due to the parallel property of power-line group, there must be some structural similarities between the projecting points of two profiles. Therefore, using geometry matching methods [
35] is helpful for identifying the points belonging to a power-line span between different profiles. In order to overcome the problems of noise and missing points, we use similar triangles based point set matching method [
36,
37,
38]. This method to detect similarity is independent of the coordinates and transformation (
Figure 2).
Figure 2.
Geometry matching based on similar triangles. Based on the frequency that triangles match, we can easily get the corresponding points and conclude that and are noise or undetected points.
Figure 2.
Geometry matching based on similar triangles. Based on the frequency that triangles match, we can easily get the corresponding points and conclude that and are noise or undetected points.
Two triangle sets are created from the triplets of points in each profile. In geometry, similar triangles have the following properties: the corresponding interior angles are equal and corresponding edges are proportional. The triangles from the two triangle sets are searched to find all of the possible similar pairs and the most frequently matched vertices are treated as corresponding points. In
Figure 2, if
matches
most frequently, it can be concluded that these are corresponding points and each belong to a power-line span with high probability.
Let us assume
matches
with
number, the geometry matching ratio is defined as:
where
is the maximum number of
.
3.1.2. Similarity Detection among Many Profiles
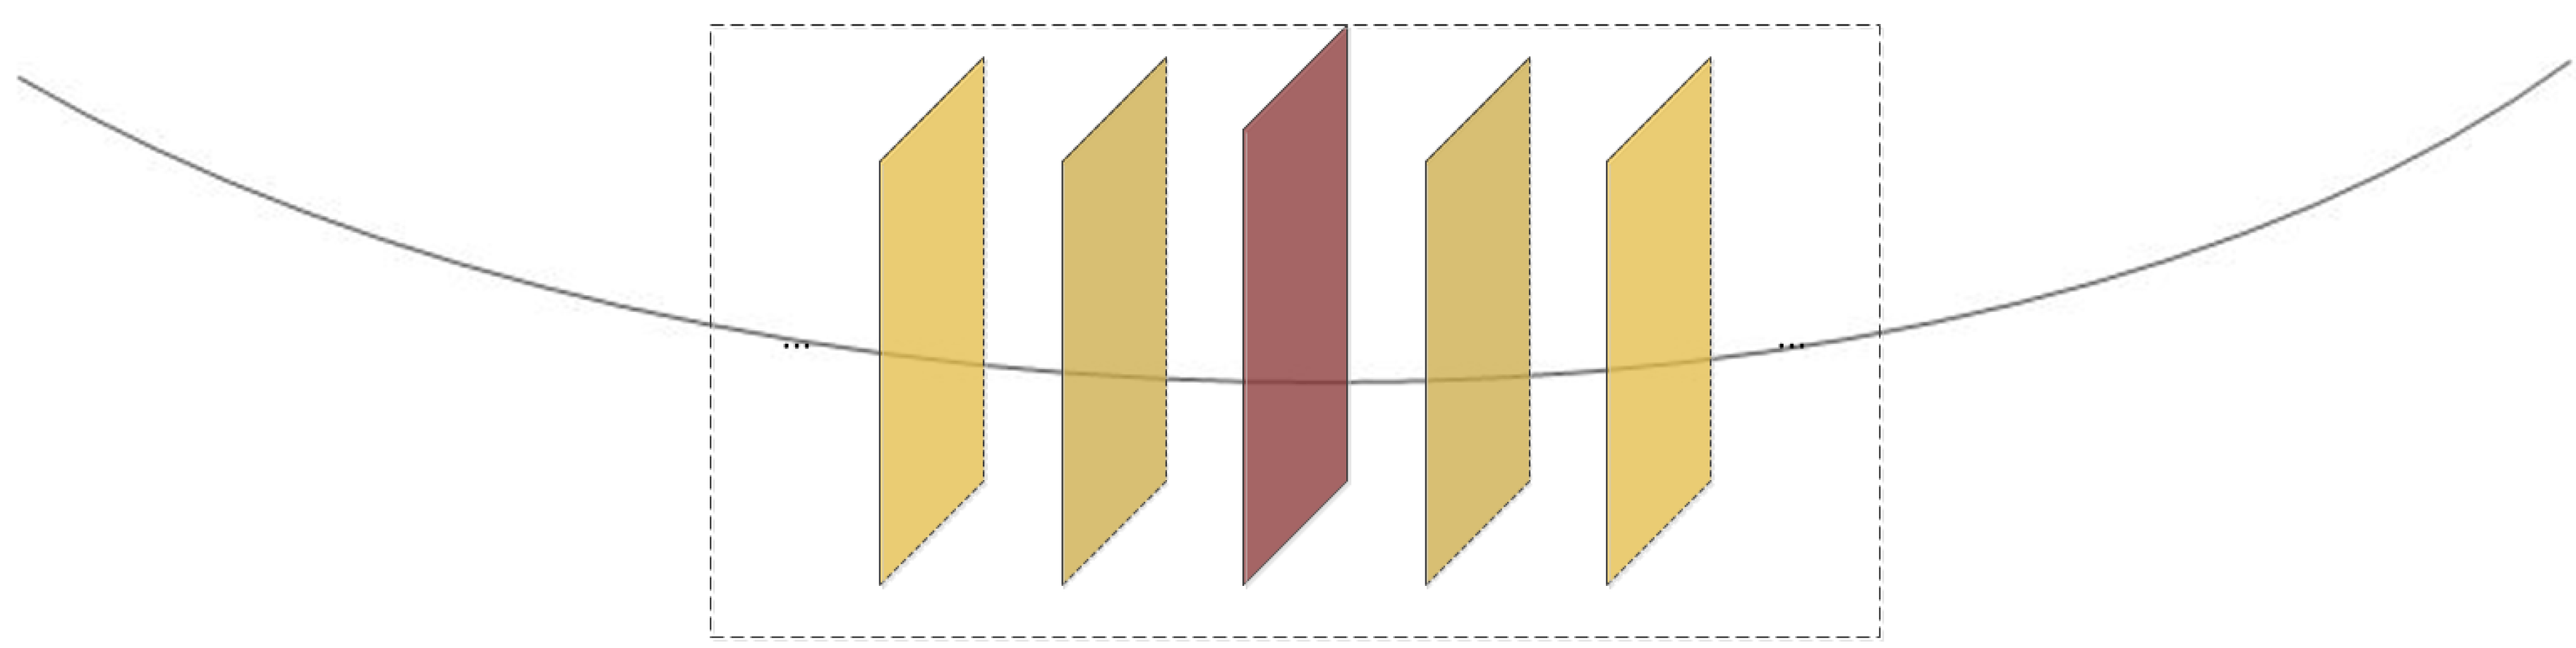
Rather than only using two neighbor profiles, we expand the similarity detection method by comparing one profile with many other profiles within a range (
Figure 3). The range is defined by the biggest gap between successive points on a line and the vertical distance of power-line spans.
Figure 3.
A main profile matches with many others within a range (indicated using the rectangle of dotted lines). The main profile is displayed with red plane, other matched profiles are displayed with yellow planes.
Figure 3.
A main profile matches with many others within a range (indicated using the rectangle of dotted lines). The main profile is displayed with red plane, other matched profiles are displayed with yellow planes.
3.1.3. Seed Section Detection and Candidate Samples Searching
The similarity can be used to roughly detect points belong to the same spans, and therefore is mainly used to detect seed sections of power-line spans, and search candidate samples.
Seed Section Detection
Before the reconstruction of a power-line span, we have to search a seed section on which all the points must belong to this span. Given a section, we suppose its center points
exist, respectively, on profiles
(
Figure 4).
Figure 4.
exist, respectively, on profiles on a seed section.
Figure 4.
exist, respectively, on profiles on a seed section.
We use a chain rule to detect all points on this seed section. Arbitrarily chose a points
on profile
, there must be always at least one point
on other profiles
on this seed section meet the strict conditions: the neighboring and geometry matching ratio are both bigger than its defined threshold.
where
is the neighboring ratio,
is the geometry matching ratio,
and
are neighboring and geometry matching threshold, respectively.
It is ensured that all points on this section are tightly connected by these strict conditions.
Candidate Sample Detection
During the reconstruction process, given a point
on profile
on a reconstructed section, we chose a corresponding point
on neighbor profile
to measure the probability that the two points belong to a same power-line span. The probability value is defined as:
where,
is the neighboring ratio, and
is the geometry matching ratio.
3.2. RANSAC Based Reconstruction
After initially detecting points on a power-line span using similarity detection (
Section 3.1), a RANSAC rule is designed for precisely reconstructing power-line spans between two neighbor pylons. As mentioned previously, the RANSAC rule has two key parts: setting the initial parameters and searching for candidate samples.
3.2.1. Setting the Initial Parameters
Given a seed section, we have to set its initial parameters. Due to the parallel nature of power-lines between two neighbor pylons, the parameters of some power-line spans in a group may be same. Therefore, using the parameters of properly fitted power-line spans as initial parameters to others for reconstructing is helpful for avoiding the failure of initial parameters fitting.
If there is no properly initial parameters searched, we have to select a seed section and determine its initial parameters according to [
12]. The similarity detection is used to identify suitable seed sections (
Section 3.1). It has been found that as the length of the seed section increases, the rate of successful reconstruction will be higher. Therefore, the sections with bigger length are first tested and then those with reducing length are sequentially selected as seeds.
3.2.2. Candidate Sample Detection
After seed section selecting and initial parameters fitting, in the RANSAC reconstruction process, candidate samples are added by selecting neighbor profile center points with high corresponding probability with the reconstructed section. The increasing power-line span is fitted using numerical methods [
39] to check whether the added samples could meet a convergence rule: whether the residual of fitted function to data is smaller than a threshold. If not, the candidate points with decreasing probability are sequentially added to be checked until converging points are found, or there are no points remaining.
Due to these two favorable properties, the RANSAC method can improve reconstruction results.
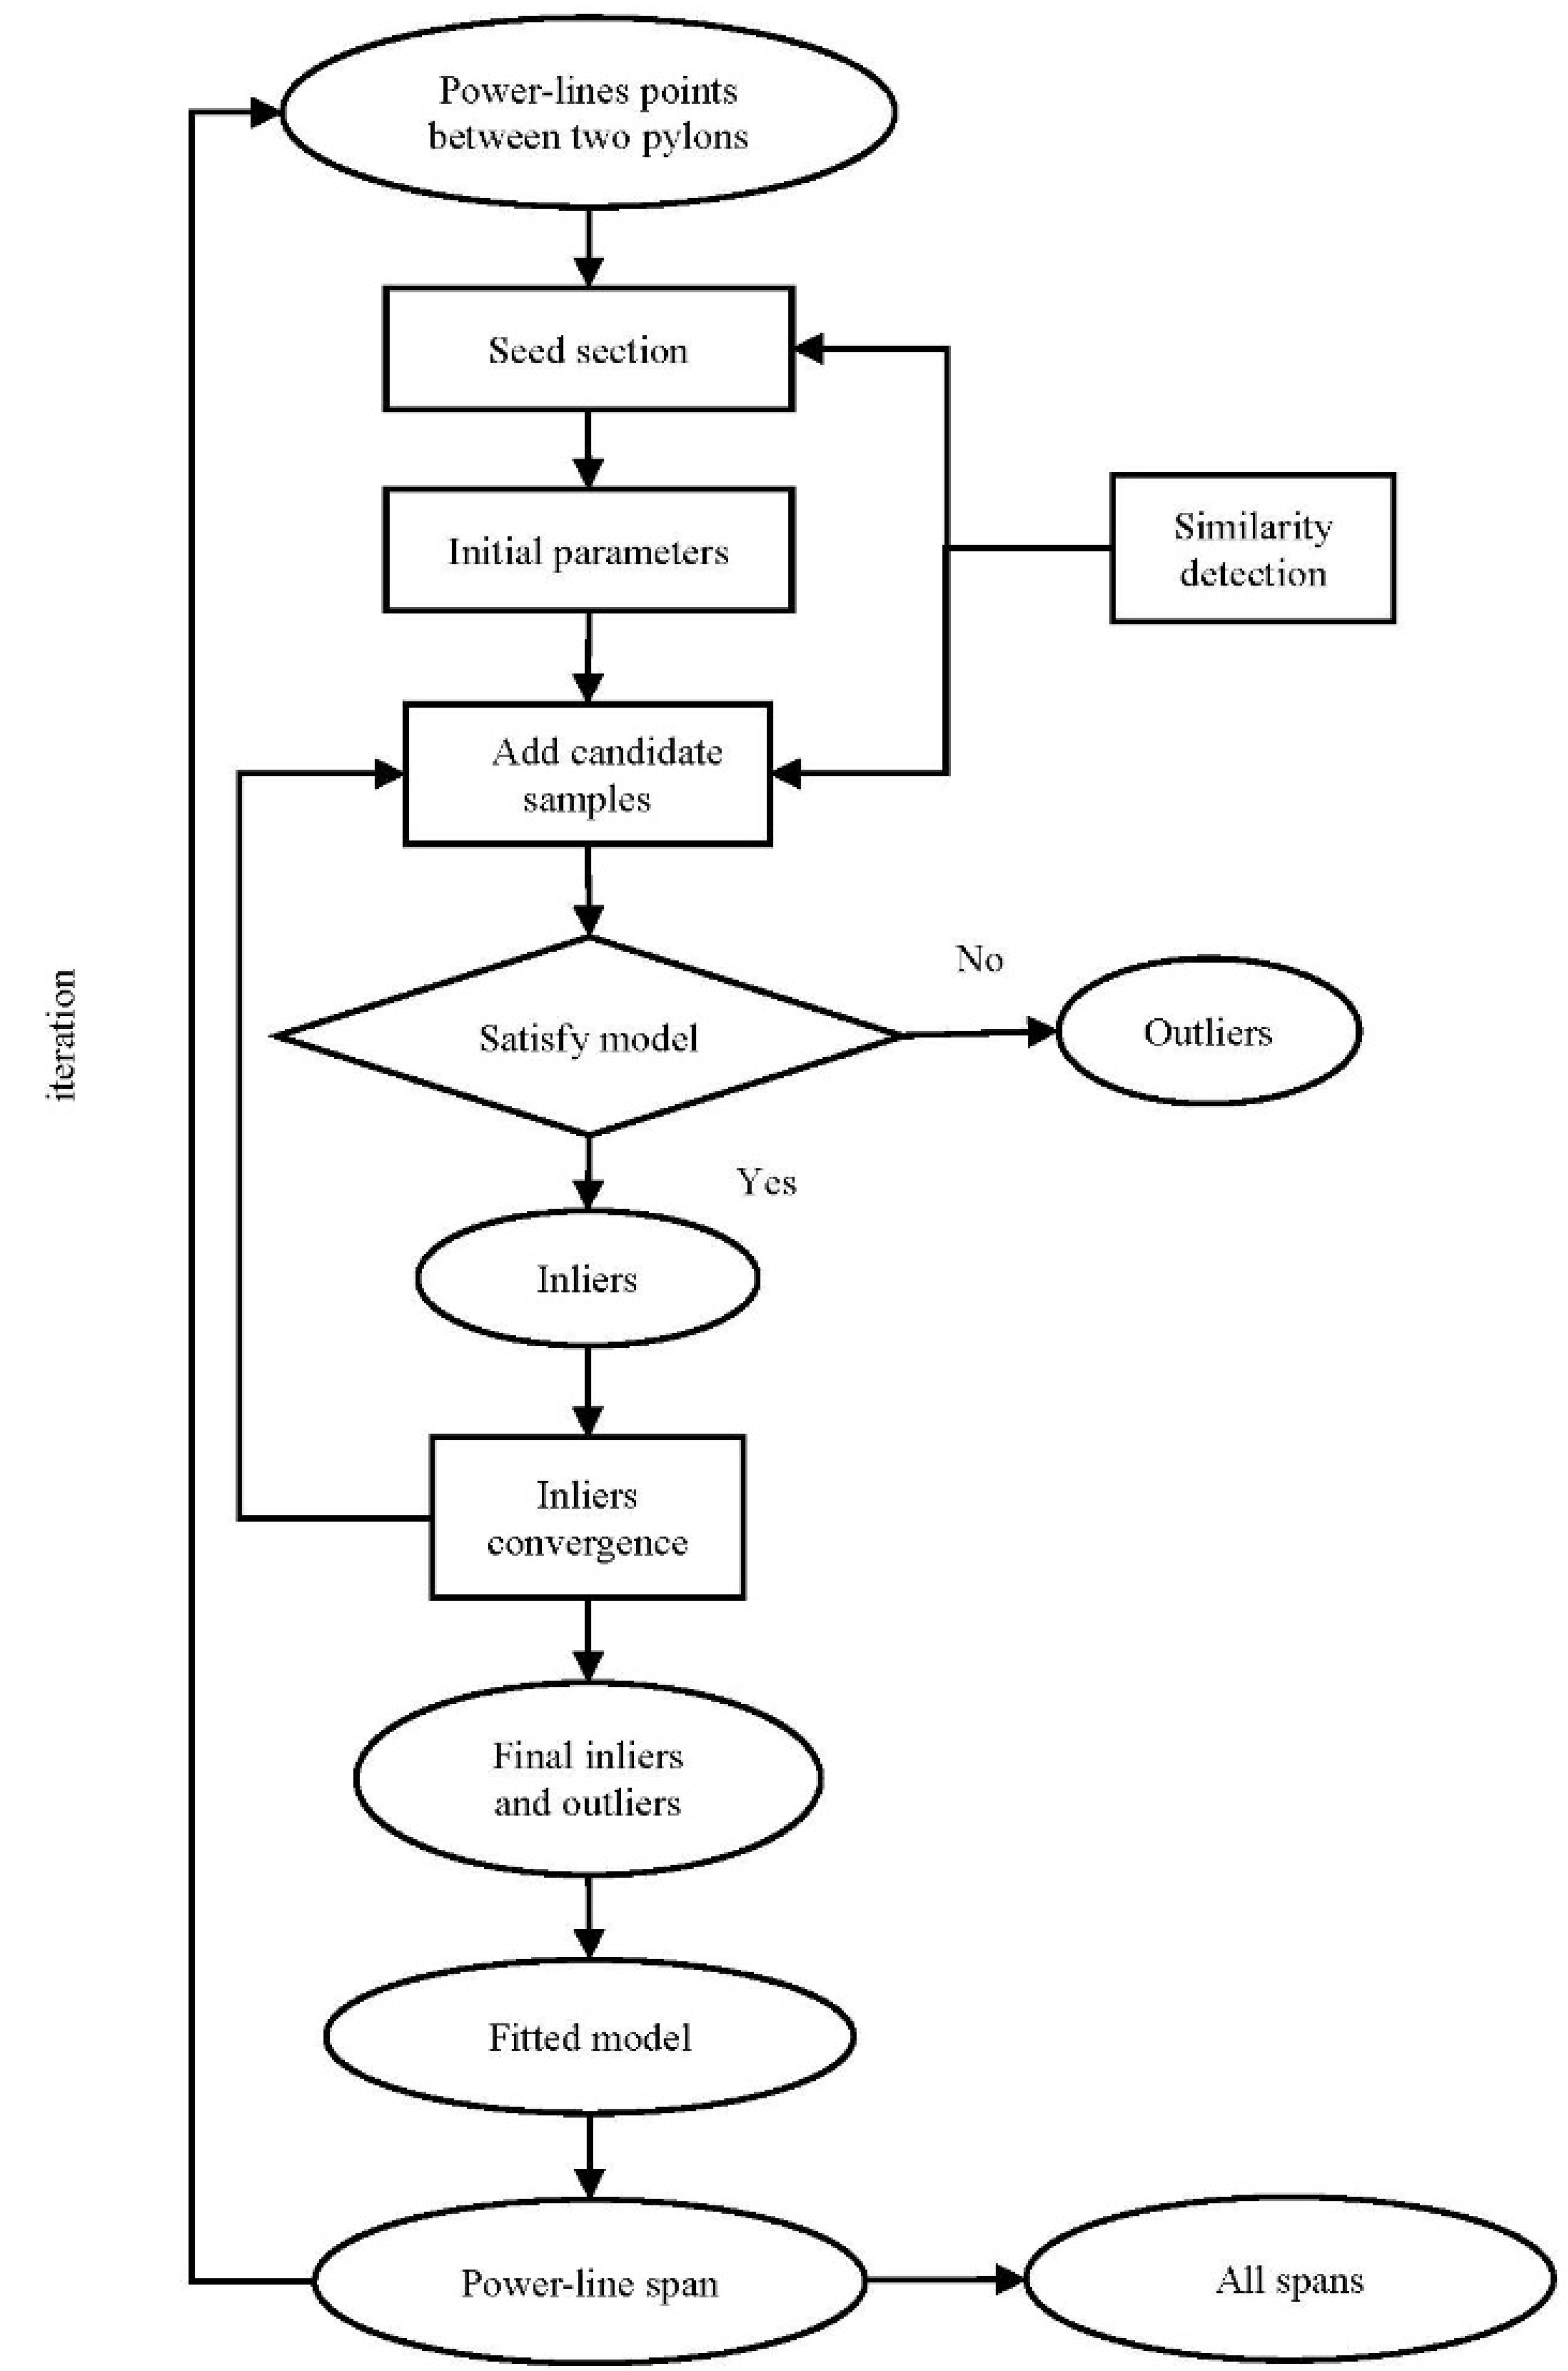
Figure 5 describes the flow chart of RANSAC for power-line span reconstruction between two connected neighboring pylons. At the beginning, we select a seed section with similarity detection. The other candidate samples are gradually added into the model to determine whether they are inliers or outliers. After incorporating all of the inlier points, the parameters of the power-line span are recalculated. These steps run iteratively until the parameters converge. The power-line span model is then chosen as the final result if their length is bigger than a defined threshold. After all spans between two connected neighboring pylons are iteratively reconstructed using the rules described above, the final output is all well-reconstructed spans between these two neighbor pylons.
Figure 5.
Progress of RANSAC rule for power-line spans reconstruction.
Figure 5.
Progress of RANSAC rule for power-line spans reconstruction.
4. Experimental Analysis and Results
The results were obtained using a dataset that has been acquired for power-line management in Hubei, China. The data were collected using the Riegl Q560. Due to the topography, the flying altitude varied significantly and was approximately 200–600 m above the ground. The scan angle was . It was swept across an average swath of width 160–500 m. Based on the changing of flying height and speed, the point density variation was large. The gap between successive points was 0.2–1.2 m. Due to data omission and misclassification, there were also many large gaps up to 10 m.
Approximately 20 km of data were obtained. The dataset was partitioned into two subsets for testing and training. The testing dataset comprise around 412 power-line spans. Testing data were manually labeled as classes of ground truth. Additionally, each individual power-line was identified for analyzing the reconstruction. In order to be clearly demonstrated, we mainly show typical reconstruction results in this section.
We first classified the data, and then extracted the power-line and pylon points. The classification accuracy is important for objects reconstruction. Therefore we have to analyze the precision and recall of classification and eliminate errors. After classification, the power-lines were reconstructed using an improved RANSAC method. In order to analyze the robustness of our methods, the reconstruction results obtained using different methods were compared.
4.1. Initial Classification
In classification, an algorithm is proposed to classify data into the categories: power-lines, vegetation, ground, pylon, and building. The training step is performed with 4000 samples (points with true labels) per class except pylons and power-lines, randomly selected from the training dataset. The training samples for power-lines and pylons are twice the size as each of the other classes in order to improve the extraction accuracy of these two kinds of objects. Typical results are shown in
Figure 6.
Figure 6.
Classification results. For simplification, the ground and building points are not shown in this figure. (color legend: trees, green; power-lines, violet; and pylons, blue).
Figure 6.
Classification results. For simplification, the ground and building points are not shown in this figure. (color legend: trees, green; power-lines, violet; and pylons, blue).
The classes of major points are correctly identified using the classification algorithm [
21]. However, there are many misclassifications. Some points representing power-lines adjacent to the region of pylons are misclassified as vegetation or pylon. Some points representing vegetation are misclassified as power-lines because of the sparse distribution. Misclassified points are also detected in pylons where they are labeled as power-lines. The main reason is that the structure of a pylon is comprised of multiple metallic triangles for stabilization, and the sides of the triangles share the same linear structure characteristics as power-lines. There are also many false vegetation points that belong to pylons. This is because the densities of pylon points vary in different regions, especially the intersecting regions between power-lines and pylons and regions near the ground.
The precision and recall of power-line and pylon are shown in
Table 1.The situation of some vegetation being misclassified as pylons is harmful. In order to precisely use the information of pylons’ distribution, we have to eliminate the false positive. Between two neighbor pylons, a Hough-Transformation (HT) is used to detect whether they are connected by power-lines [
14]. Detected ALS power-line points are firstly projected onto a XY plane and apply the HT to measure a maximum voting score accumulated in HT space as indicating a degree of the presence of linear feature. If the maximum voting score is corresponding to the angle of connecting line by these two neighbor pylons, these pylons are true positive. Otherwise, either of these pylon may be false positive.
Due to the effectiveness of classification process, although there are many errors, the majority of points are correctly classified.
The situation of some vegetation being misclassified as pylons is harmful. In order to precisely use the information of pylons’ distribution, we have to eliminate the false positive. Between two neighbor pylons, a Hough-Transformation (HT) is used to detect whether they are connected by power-lines [
14]. Detected ALS power-line points are firstly projected onto a XY plane and apply the HT to measure a maximum voting score accumulated in HT space as indicating a degree of the presence of linear feature. If the maximum voting score is corresponding to the angle of connecting line by these two neighbor pylons, these pylons are true positive. Otherwise, either of these pylon may be false positive.
Table 1.
Classification accuracy.
Table 1.
Classification accuracy.
| Overall Accuracy: 94.9% |
|---|
| -- | Ground | Vegetation | Building | Power-Line | Pylon |
|---|
| Precision | 0.96 | 0.92 | 0.91 | 0.89 | 0.93 |
| Recall | 0.98 | 0.88 | 0.89 | 0.86 | 0.78 |
4.2. Power-Lines Reconstruction
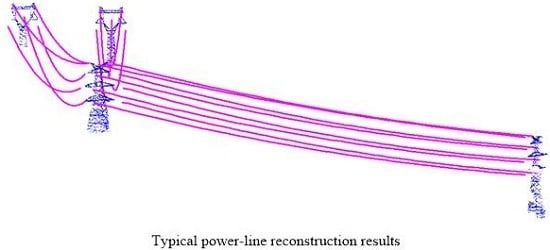
In this section, the robust method is proposed to extract and estimate the parameters of each individual span of power-line. We first use the similarity detection rule to initially detect the points belong to each same power-line span section. Based on the seed section detecting and candidate samples searching by the similarity, the RANSAC rule is used to robustly reconstruct the power-line spans. When the data quality is high, the reconstruction is precise and robust (
Figure 7).
Figure 7.
Power-line reconstruction results.
Figure 7.
Power-line reconstruction results.
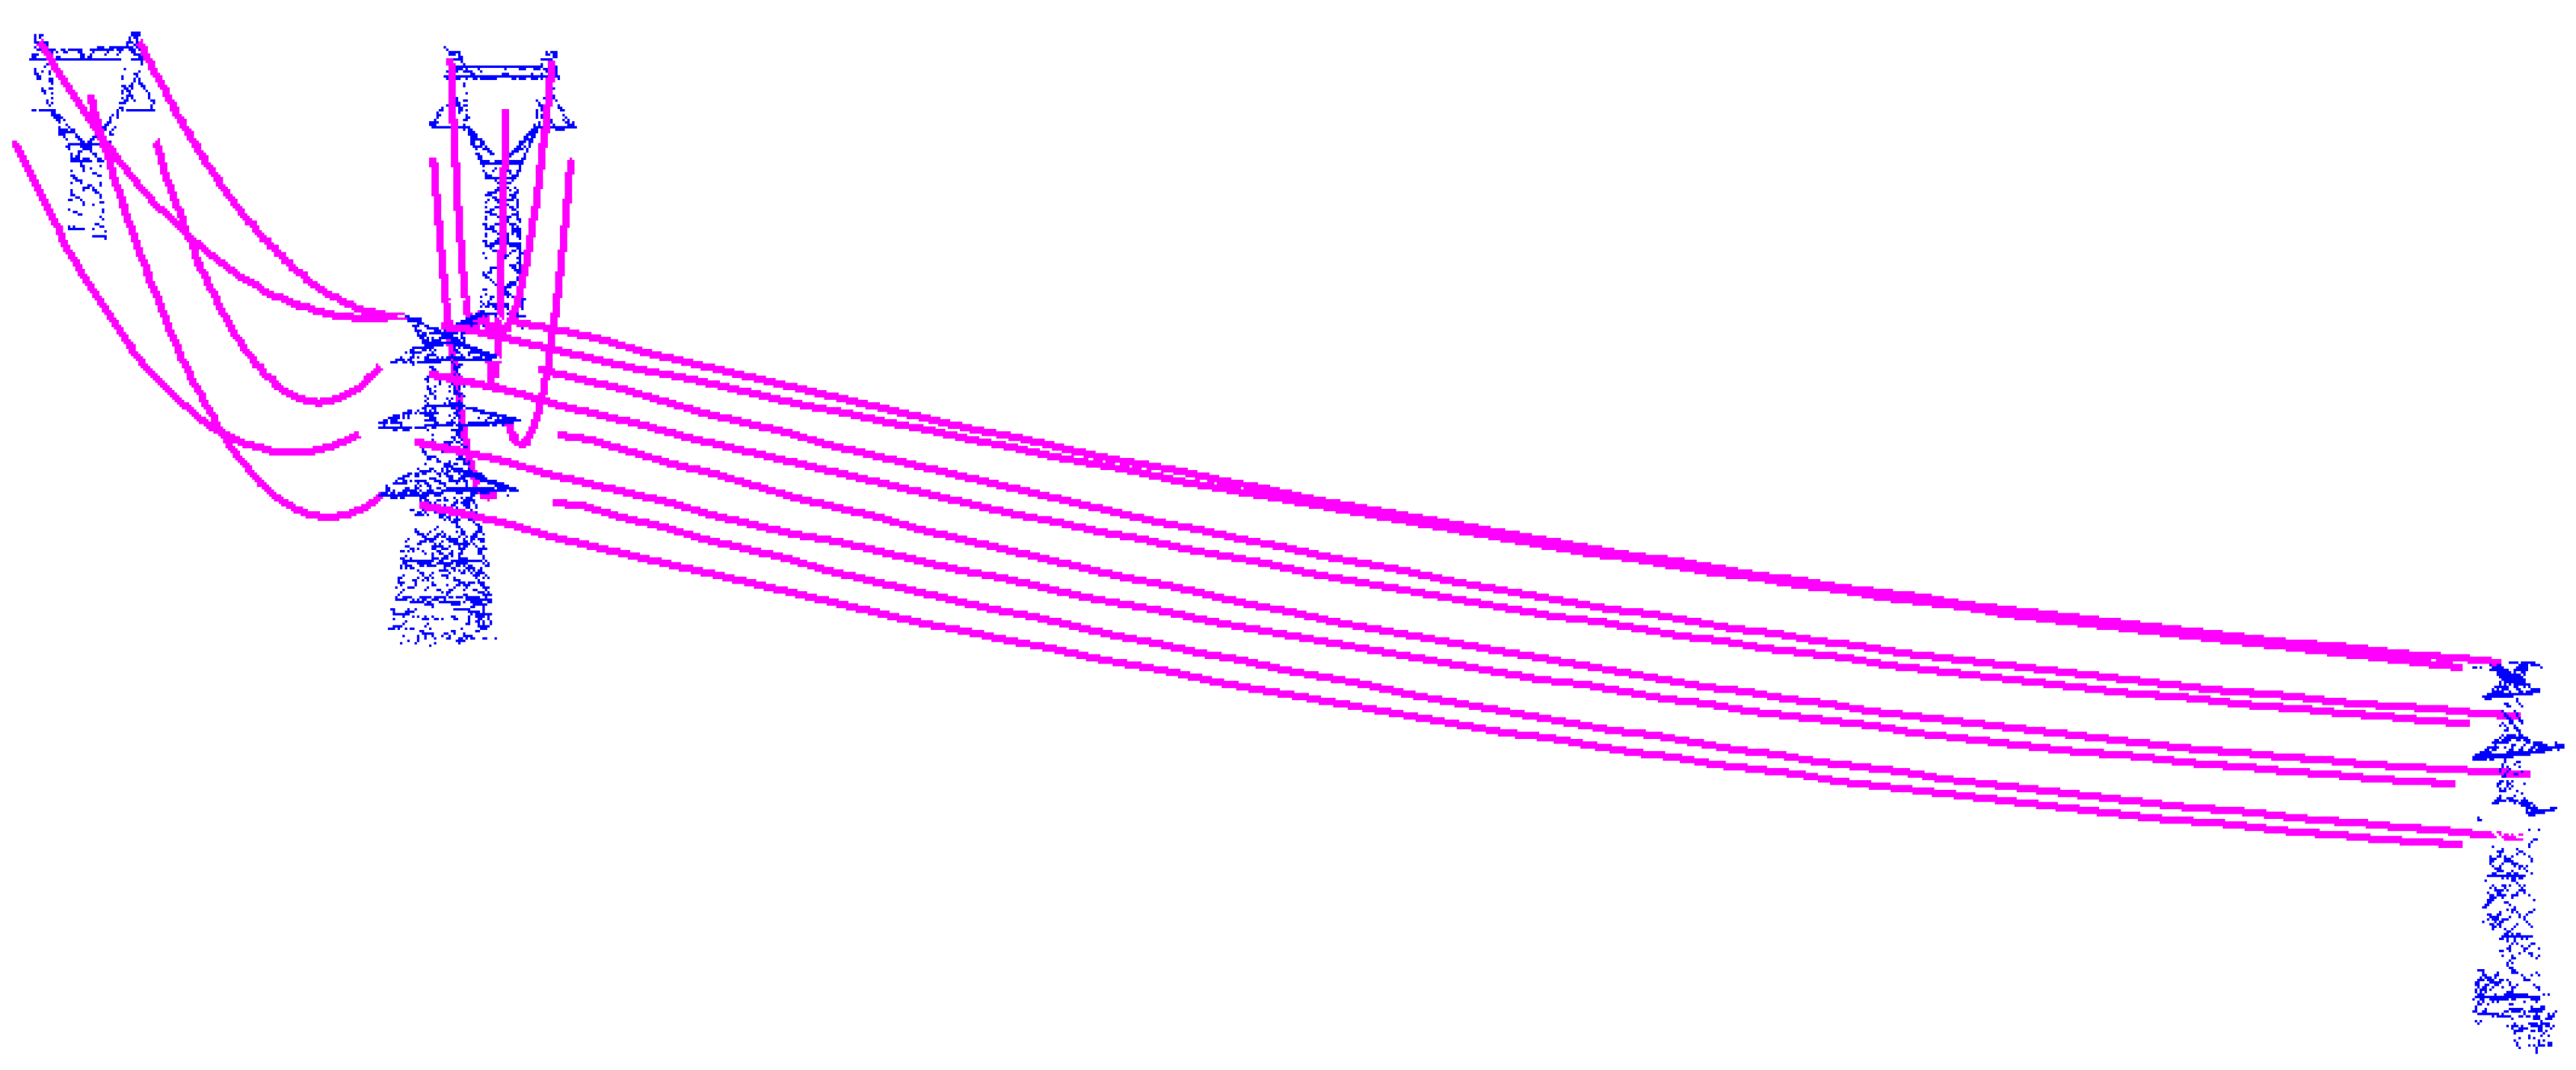
One typical situation is the splitting: a group of power-line spans are split to be two or more groups. In this situation, power-lines are connected asymmetrically between different types of pylons. Irregular power-line span shapes increase the difficulty of the reconstruction. Using our method, based on the local shape properties of a single power-line span and the distribution properties of power-line group between two neighbor pylons, power-line spans can be successfully reconstructed (
Figure 8).
Power-line spans are found to be reconstructed with accuracies as given in
Table 2. As for reconstruction accuracy calculation, all power-line spans were manually detected to produce a reference map for the power-line span models. Relying on intensive visual inspection, we carefully classify the modeling results into four different categories: correct, splitting, undetected, partially detected.
Table 2 shows that our method achieved a nearly 90 percent complete modeling rate with a 10 percent error rate. Compared to McLaughlin’s method [
12], the reconstruction accuracy is higher. The comparing details are shown in
Section 5. Due to the robustness, many reconstruction failures such as splitting and undetected spans can be correctly reconstructed.
Figure 8.
Power-line reconstruction results of splitting situation.
Figure 8.
Power-line reconstruction results of splitting situation.
Table 2.
Reconstruction accuracy.
Table 2.
Reconstruction accuracy.
| -- | Correct | Splitting | Undetected | Partially Detected |
|---|
| Our method | 89.8% | 3.4% | 2.7% | 4.1% |
| McLaughlin’s method | 72.1% | 4.6% | 12.9% | 10.4% |
In reconstruction process, we have to analyze the RANSAC iteration parameters and thresholds. Guided sampling in the RANSAC process can substitute random sampling to accelerate convergence and reduces the necessary number of iteration [
30]. Based on the similarity detection, the candidate samples on a single power-line span are firstly detected. Thus, the iteration for reconstruct can be reduced. Through tested, the iteration number for reconstructing a span is about 1.2–1.5 times of the number of its data samples.
In seed section detection, neighboring and geometry matching threshold are, respectively, set to be 0.9 and 0.5. As the geometry matching, corresponding points belong to a power-line span match frequently, while the matching rate of wrongly corresponding points is close to zero. Thus, the geometry matching threshold is not large.
During the iteration, samples are added when the residual of fitted function to data is smaller than a threshold of 1.0. The candidate points are then thought to be inliers, or outliers.
Finally, a power-line span model is chosen as the final result if its length is bigger than a defined threshold. The threshold is set according to the distance of two neighboring pylons connected by this span. We set the threshold to be four-fifth of the distance. A piece is considered to be noise if its length is less than one-third of the distance.
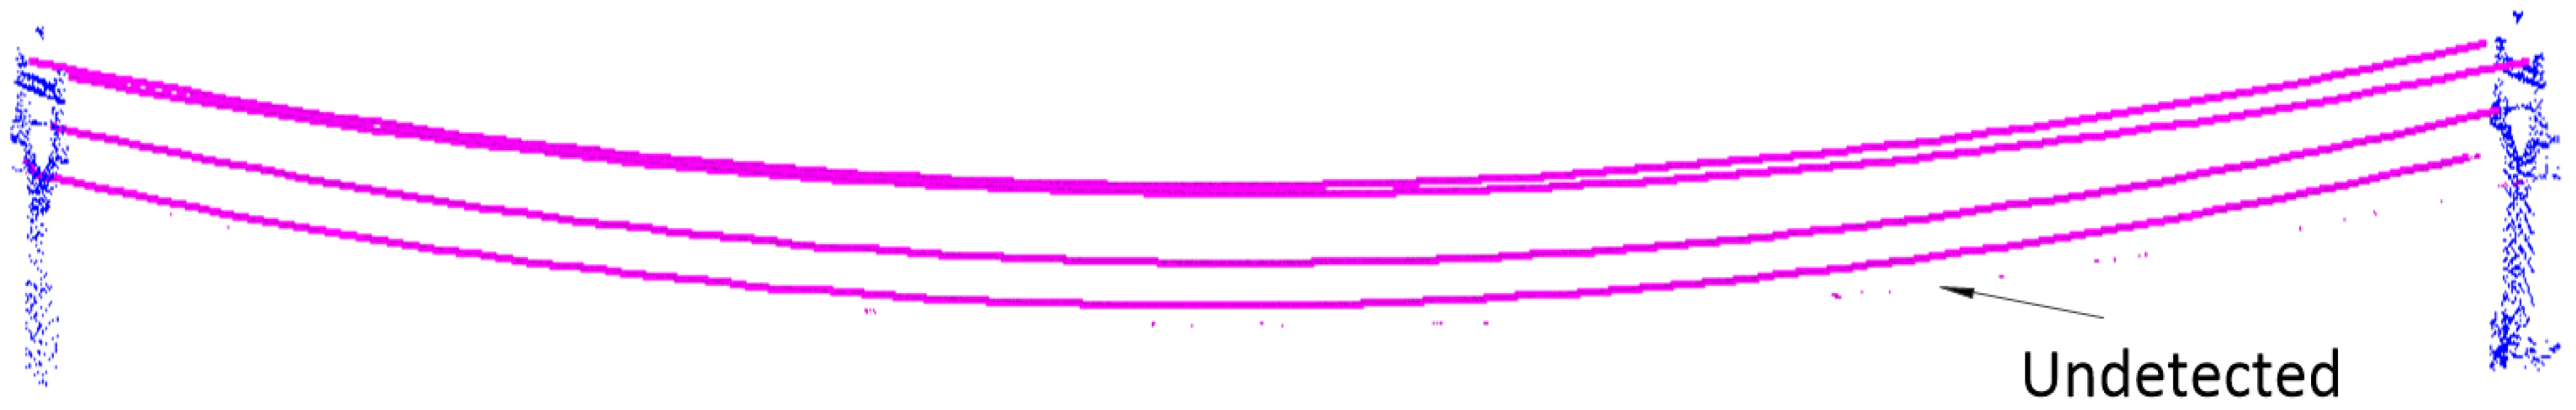
Failures of our method are found in some extreme situations. Undetected spans are found where there are almost no detected power-line points (
Figure 9). There are two reasons for this failure: (1) It can not to detect an effective seed section of this span using the similarity detection rule if the points are very sparse; (2) The fitting of the span curve function is influenced by the sparseness of points. If the spans within a group are not strictly parallel, the parameters of each span is different. In this situation, the setting of initial parameters for a span with sparse points could not be precise. Therefore, the subsequent fitting of this span may fail.
Figure 9.
Power-line reconstruction results of undetected spans.
Figure 9.
Power-line reconstruction results of undetected spans.
Although the sparseness of points affects the reconstruction results, the quality of reconstruction results are mainly effective for the big gaps caused by sparseness. If the points are regularly distributed, a few number of points can also be well reconstructed. We found that in place with big gap, the span cannot be successfully reconstructed.
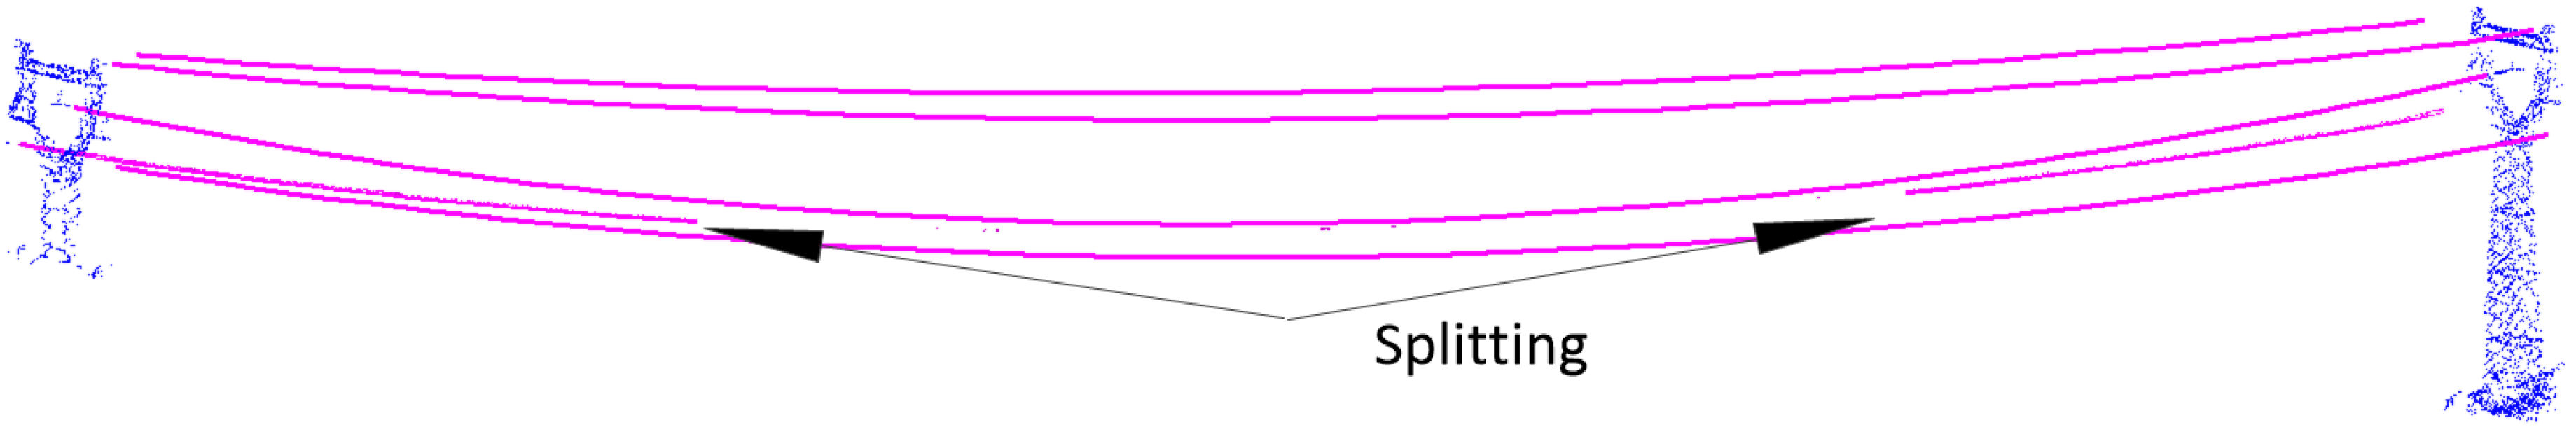
Splitting spans are found in places with big gaps, where the length of the gaps are usually bigger than one half of the spans (
Figure 10). This failure is also caused by the sparseness of points, resulting a failure to compute a reliable model for these spans. Therefore, the points distributed dispersedly cannot be represented with an unreliable model.
Figure 10.
Power-line reconstruction results of splitting spans.
Figure 10.
Power-line reconstruction results of splitting spans.
5. Discussion
The ALS technology is often used for automatically monitoring the safety of power-line infrastructure. In this paper, an improved and robust algorithm is proposed to reconstruct power-line spans from ALS data. Before reconstruction, the point cloud data have to be classified and extract the power-line points. Below, we discuss the details of these two stages.
In the initial classification of the data as power-line, vegetation, ground, pylon, and building, the precision and recall of power-line is less than those of other classes. There are many limiting factors in the accuracy of the algorithm. The sparseness of the data is found to be the problematic factor. During the classification process, a local neighborhood is computed for features calculation. The neighborhood we use is with specific shape and fixed size. Some neighborhoods is found to contain few single points. In such situations, data are classified as vegetation by default. Other incorrectly classified neighborhoods are seen to contain an intersection of power-line with vegetation or pylon. Data would be also classified as vegetation. False positives typically occurred with neighborhoods containing very few points of no power-line. The classification accuracy is a key point for power-line reconstruction. With the increasing of classification accuracy, the reconstruction results can be improved.
Due to parts of the power-lines being obscured by vegetation, or a lack of data points along a section of line, there are sparseness and large gaps of the data. Therefore, there may be a small number of power-line spans that are split into several or are undetected. This study was intended to design and test an improved and robust approach for power-line spans reconstruction over the traditional region growing based methods. The additional power-line group distribution and contextual pylons information besides the local shape of spans used in our method are mainly contributed to the improvement.
In order to analyze the robustness, we need to compare our reconstruction results with the traditional methods which only use the local shape properties of a power-line span. The method of McLaughlin [
12] is the base of many modified region growing based methods. The main default of this type of methods is similar. In the initial models generation at early growing iteration steps, there might be a very small number of points available due to the effects of occlusions, shadows and system errors. In this case, the estimated model has deviated from the targeted global model [
16]. Then, the candidate samples cannot be rightly searched using the region growing rule. Thus, the comparison with the method of McLaughlin is reasonable.
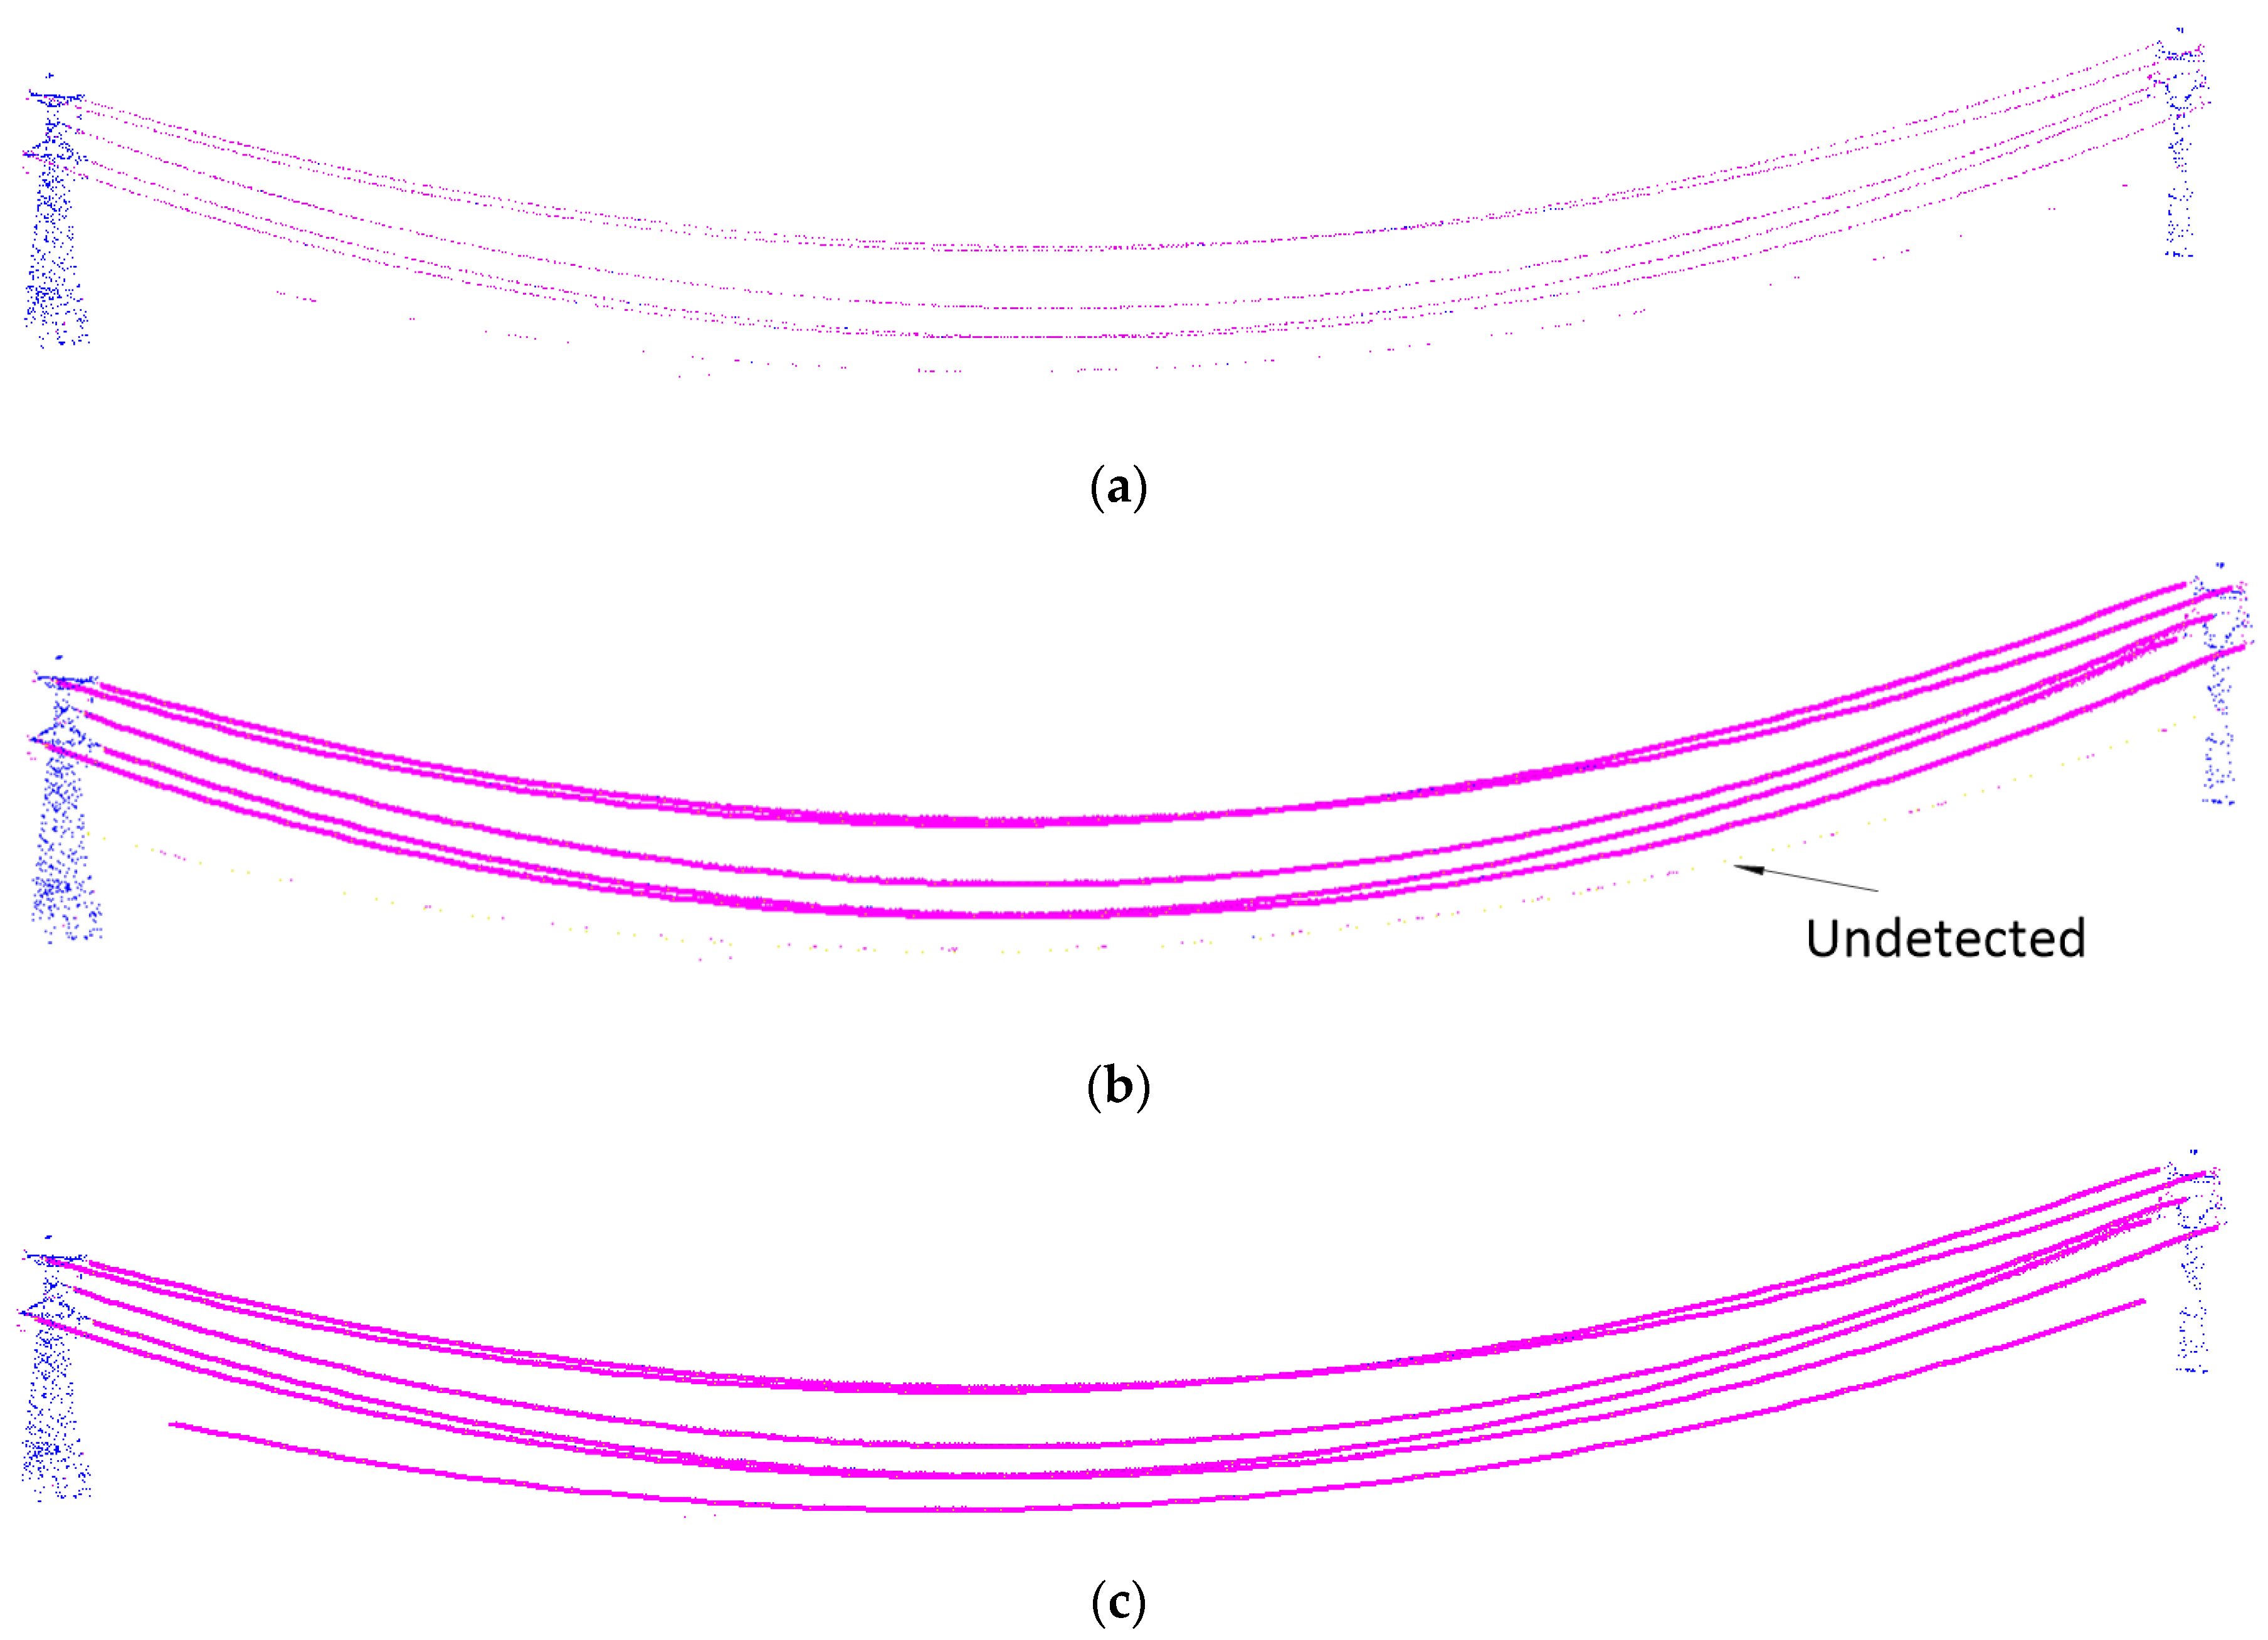
If there are large gaps along one power-line span, using the method of McLaughlin [
12], it may result in a splitting failure such that the iterative grouping algorithm can not to aggregate the separated parts into a single span (
Figure 11b). Due to robust properties of our methods, these kinds of spans with large gaps can be aggregated into a single span (
Figure 11c). Using our method, the initial parameters of a span may be well set. Combining the effective candidates searching of RANSAC, these gaps can be correctly reconstructed.
Figure 11.
(
a) Original data; (
b) reconstruction results using McLaughlin’s method [
9]; and (
c) reconstruction results with our method.
Figure 11.
(
a) Original data; (
b) reconstruction results using McLaughlin’s method [
9]; and (
c) reconstruction results with our method.
A number of power-line spans are also undetected using the method of McLaughlin [
12] (
Figure 12b). This is primarily due to the sparseness of the data, resulting in a failure to fit initial parameters of a local model or a failure of the iterative grouping algorithm to aggregate the sparse points into a single span. Using the methods introduced in this paper, based on the properly-fitted parameters and effective candidate samples searching, this problem can be overcome and produce good results (
Figure 12c). In
Figure 12c, a span with sparse points is successfully reconstructed except for a small part undetected where there are almost no data points.
Due to the robust properties, the reconstruction results using our method are better than McLaughlin’s method [
12], which is mainly based on local shape of a power-line span and region growing rule. The improvements are mainly due to the auxiliary information of distribution properties of power-line group set and contextual pylons. The improvements are also based on the RANSAC based reconstruction rule, in which we design reliable initial parameters fitting and efficient candidate sample searching according to the similarity of power-line group set distribution.
Figure 12.
(
a) Original data; (
b) reconstruction results using McLaughlin’s method [
9]; and (
c) reconstruction results with our method.
Figure 12.
(
a) Original data; (
b) reconstruction results using McLaughlin’s method [
9]; and (
c) reconstruction results with our method.
6. Conclusions
In power-line risk management, the robust, precise and automatic modeling of power-lines can provide a great benefit for the execution of a rapid and correct clearance in cases of potential hazards. In this paper, we introduced an improved and robust method for power-line reconstruction. This method can overcome the problems of undetected and splitting of power-line spans that result from only using the local shape information of power-line spans in traditional methods.
The method was mainly based on RANSAC algorithm. Two key parts of initial parameters fitting and candidate samples searching were carefully designed to improve the efficiency and precision of reconstruction. The improvement was also based on using contextual pylon information and distribution property of power-line group. The more information other than local shape information used in reconstruction are mainly described below.
Contextual Pylon Information. We automatically classified the point cloud data into five classes: power-line, vegetation, building, ground and pylon. Pylon and power-line are two related kinds of objects. Based on the contextual information, the reconstruction can avoid the defaults caused by only concerning individual power-line object.
Distribution Properties of Power-Line Group. Based on the nearly parallel nature of power-line group between two neighbor pylons, we introduced a similarity detection method to roughly detect the probability of neighbor points belonging to the same power-line span. The distribution properties of power-line group can assist the power-line reconstruction.
Generally, it deviates from traditional methods of object reconstruction, which have been mainly based only on the properties of a single kind of object. Using related and auxiliary information can improve the reconstruction results.
Due to the detection rate of power-line points and data gaps, there are still several defaults of the performance of our reconstruction method. To improve the robustness, the post-processing of power-line models should be carried out by rectifying the incompletion of power-line models based on multi-span level analysis including inner- and across-span in future. Furthermore, the sag of power-line span is changing in time according to the ambient conditions such as the temperature and the ageing of span. Thus, it is necessary to regularly check. In the future, the potential factors that effect the sag (including ambient air temperature, electrical load, solar radiation, wind, etc.) should also be considered to achieve precise modeling of power-lines.


