
Rapid Response to a Typhoon-Induced Flood with an SAR-Derived Map of Inundated Areas: Case Study and Validation

Abstract
:
1. Introduction
2. Flash Flood and Study Area
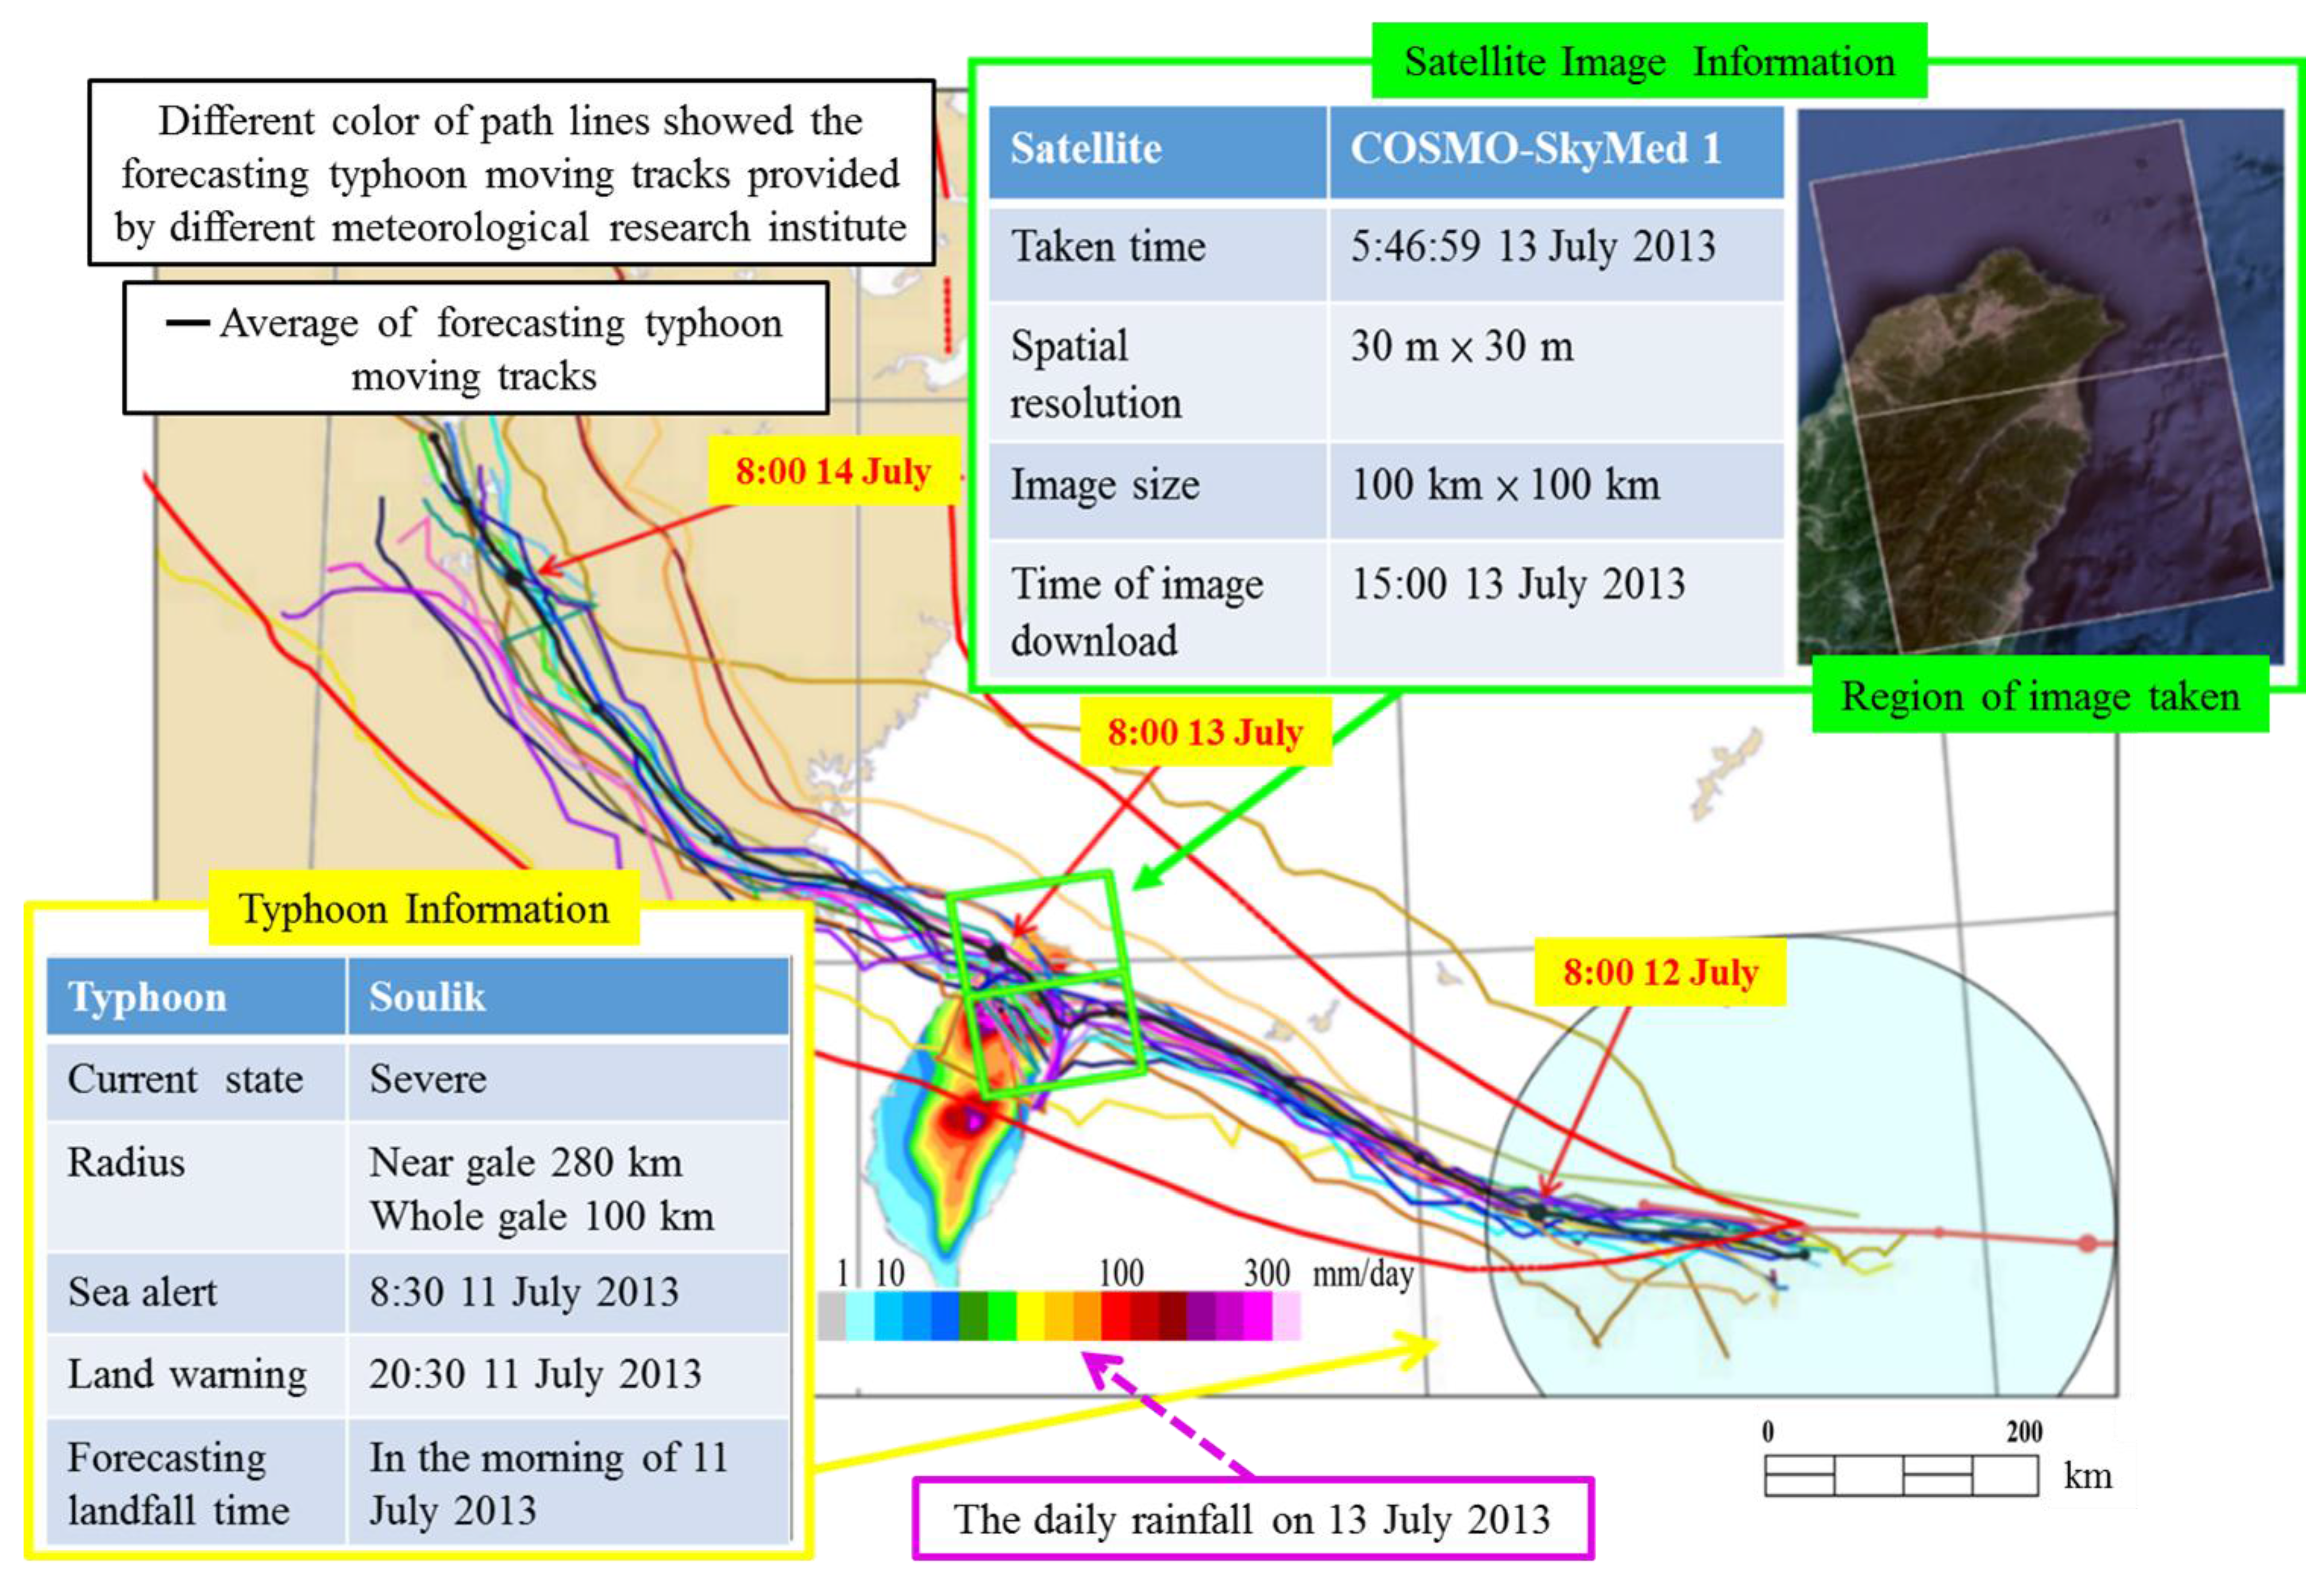
2.1. Typhoon Soulik
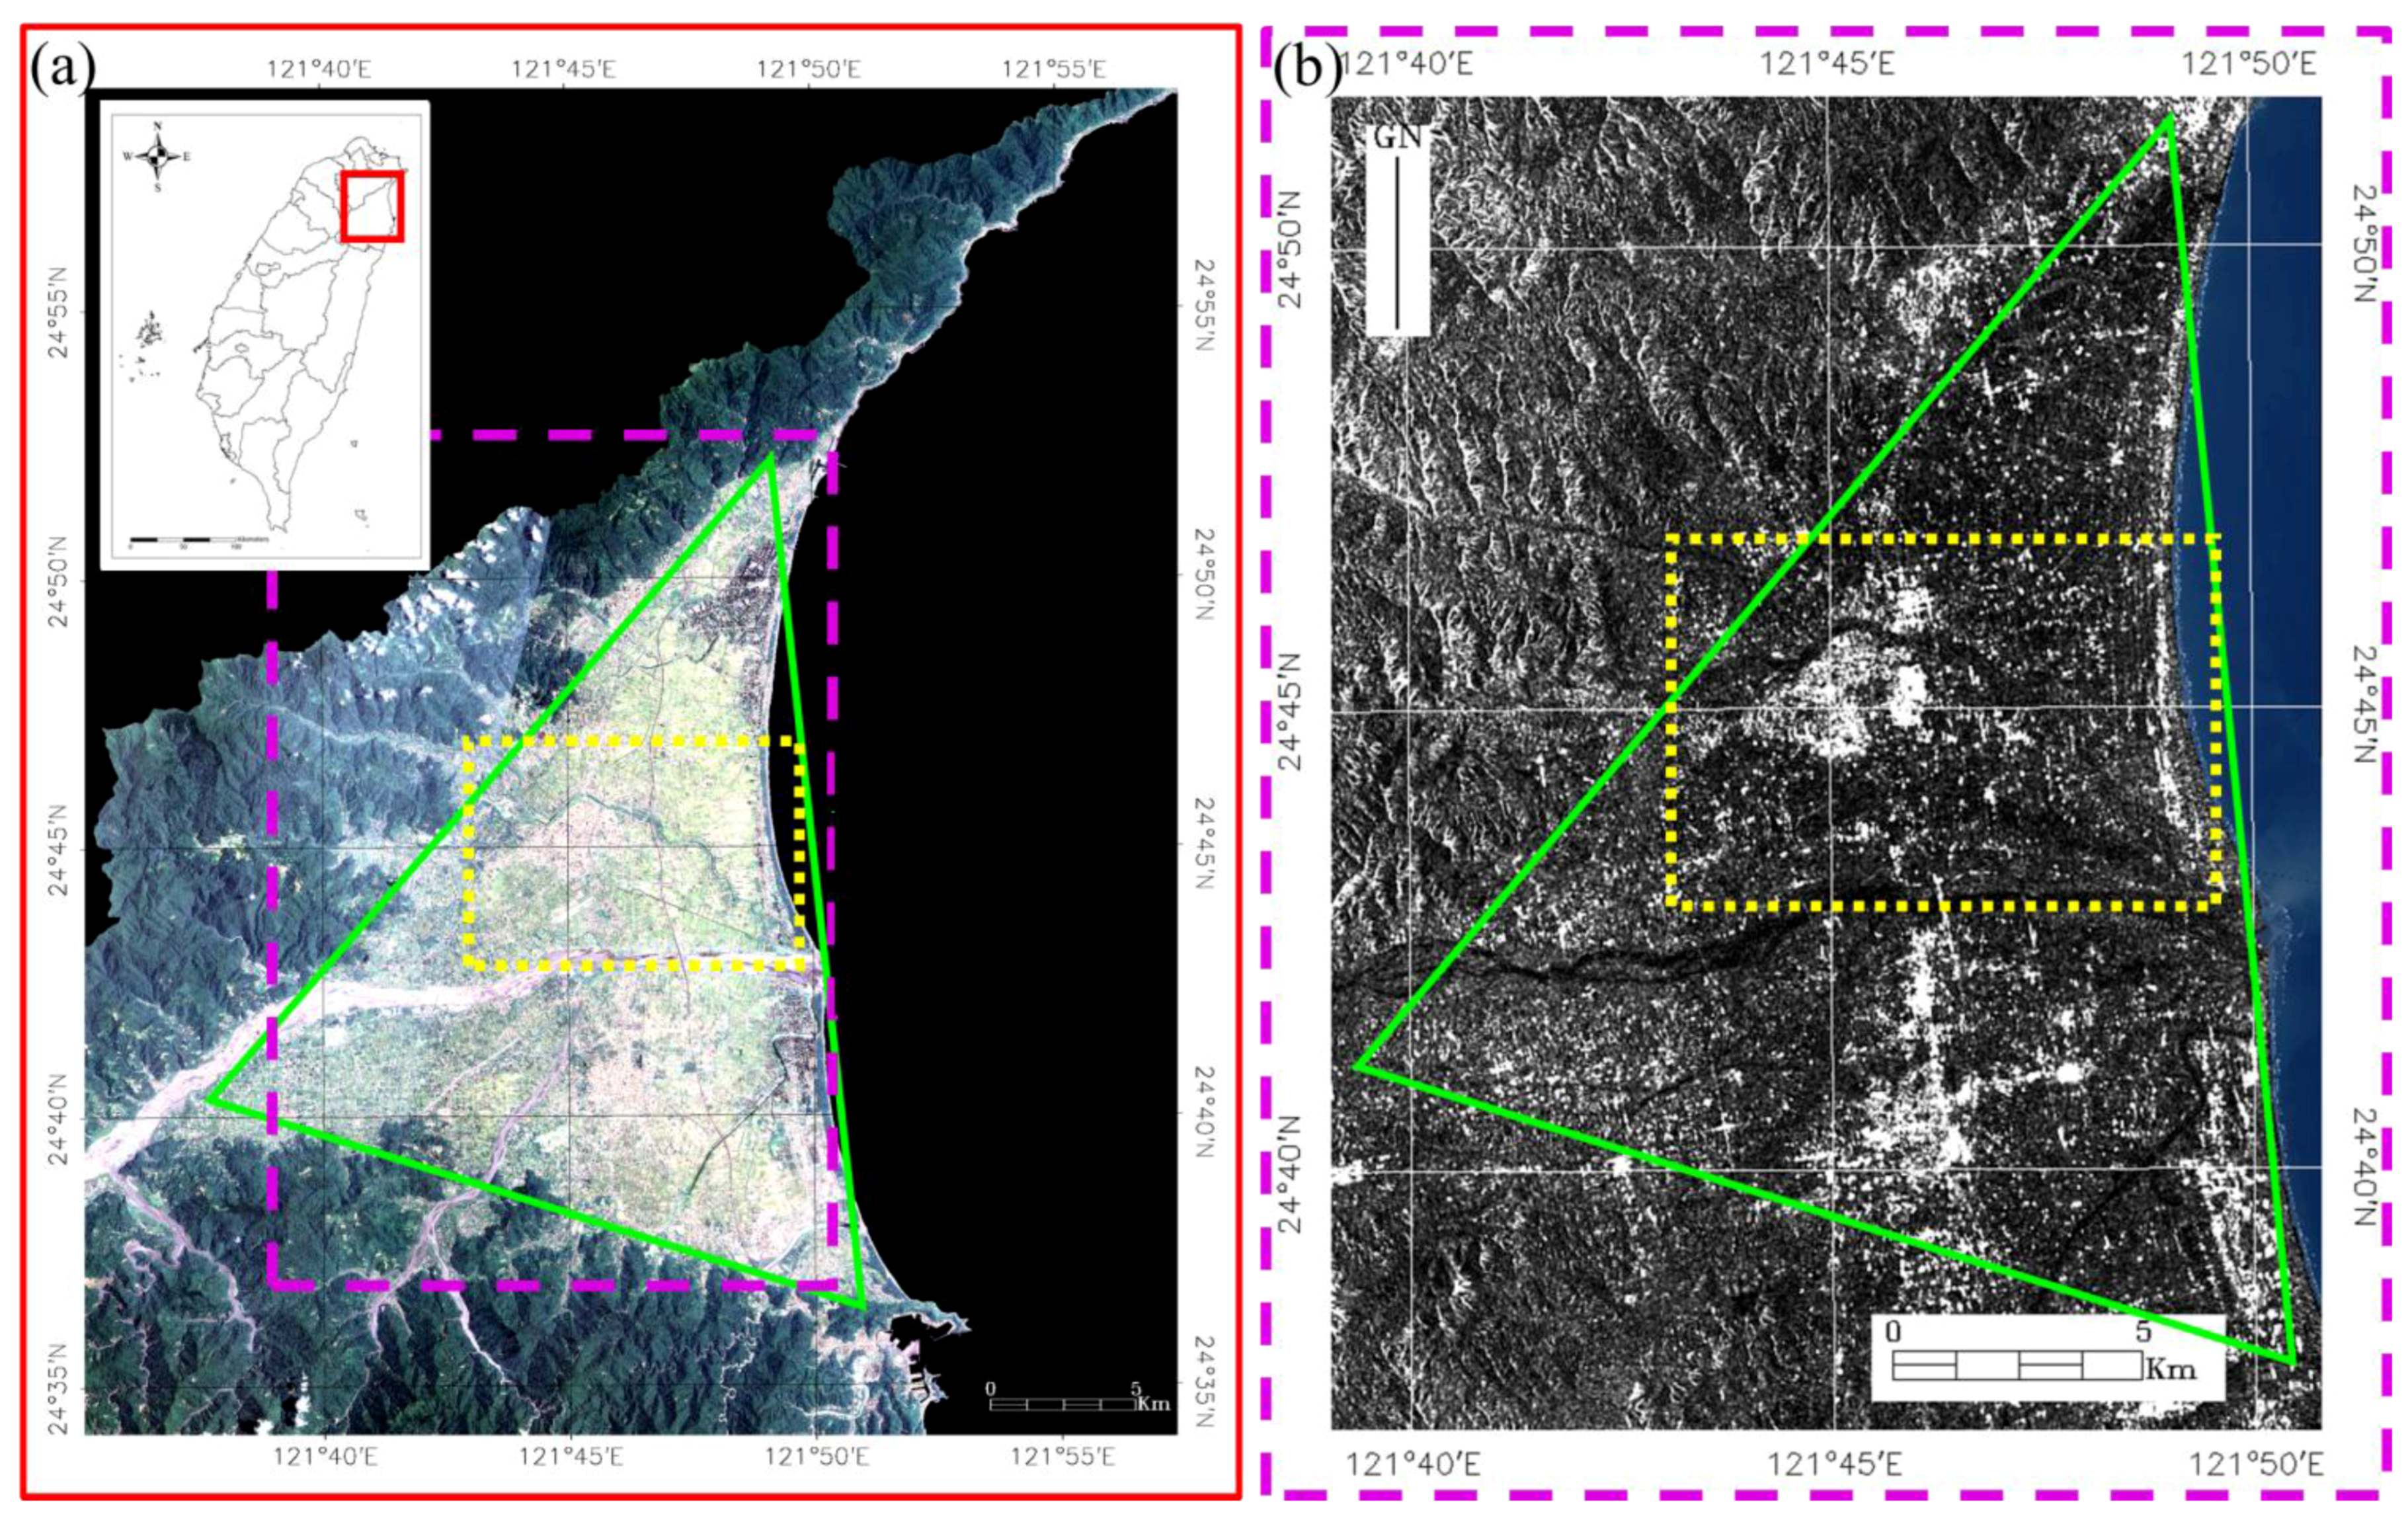
2.2. I-Lan County
3. Data
3.1. SAR Image Request


| Steps | Time (Local Time in Taiwan) |
|---|---|
| Assessment of acquired image | 8:30 a.m. 11 July 2013 (after a sea alert for the typhoon) |
| Place an urgent order | 9:00 p.m. 11 July 2013 (after a land warning for typhoon) |
| Acquired SAR image | 5:47 a.m. 13 July 2013 (three hours after making landfall) |
| SAR image download | 3:00 p.m. 13 July 2013 (begin to download the image) |
| Image processing with SARscape | 6:00 p.m. 13 July 2013 (two hours after downloading the image) |
| Derive the flood region | 8:00 p.m. 13 July 2013 (five hours after downloading the image) |
3.2. Synthetic Aperture Radar Imagery
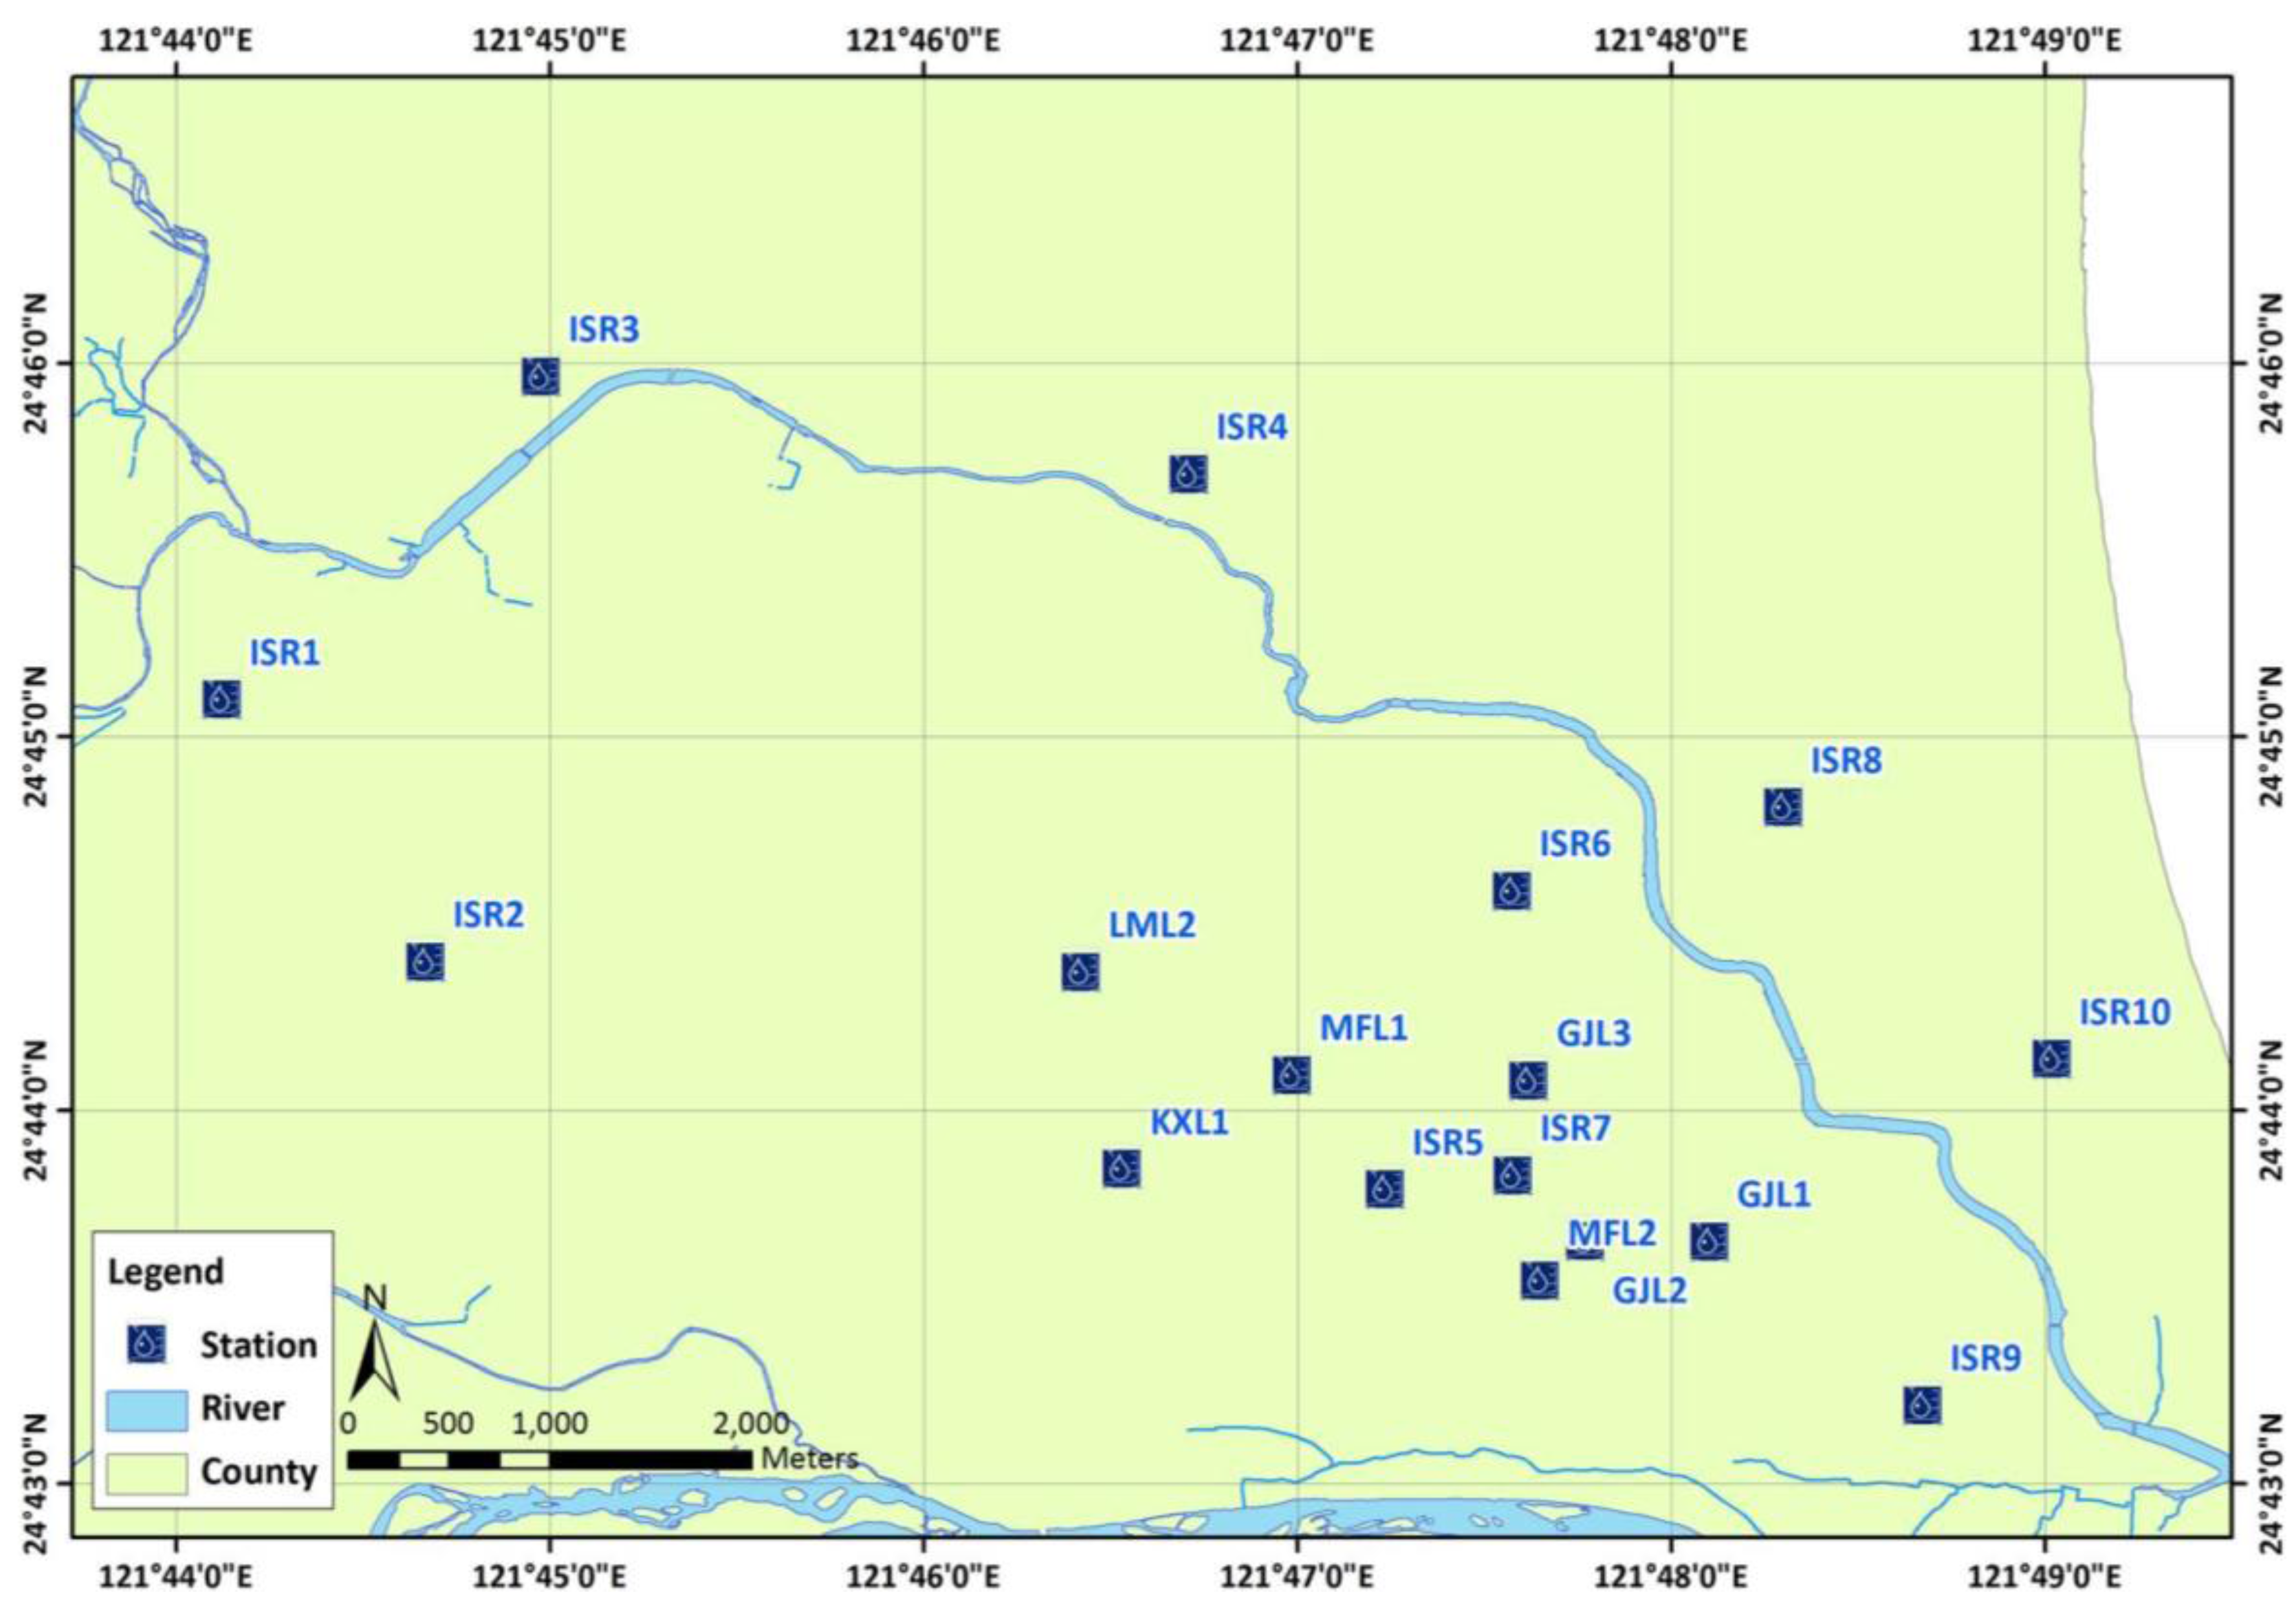
3.3. Water Level Station

4. Methods
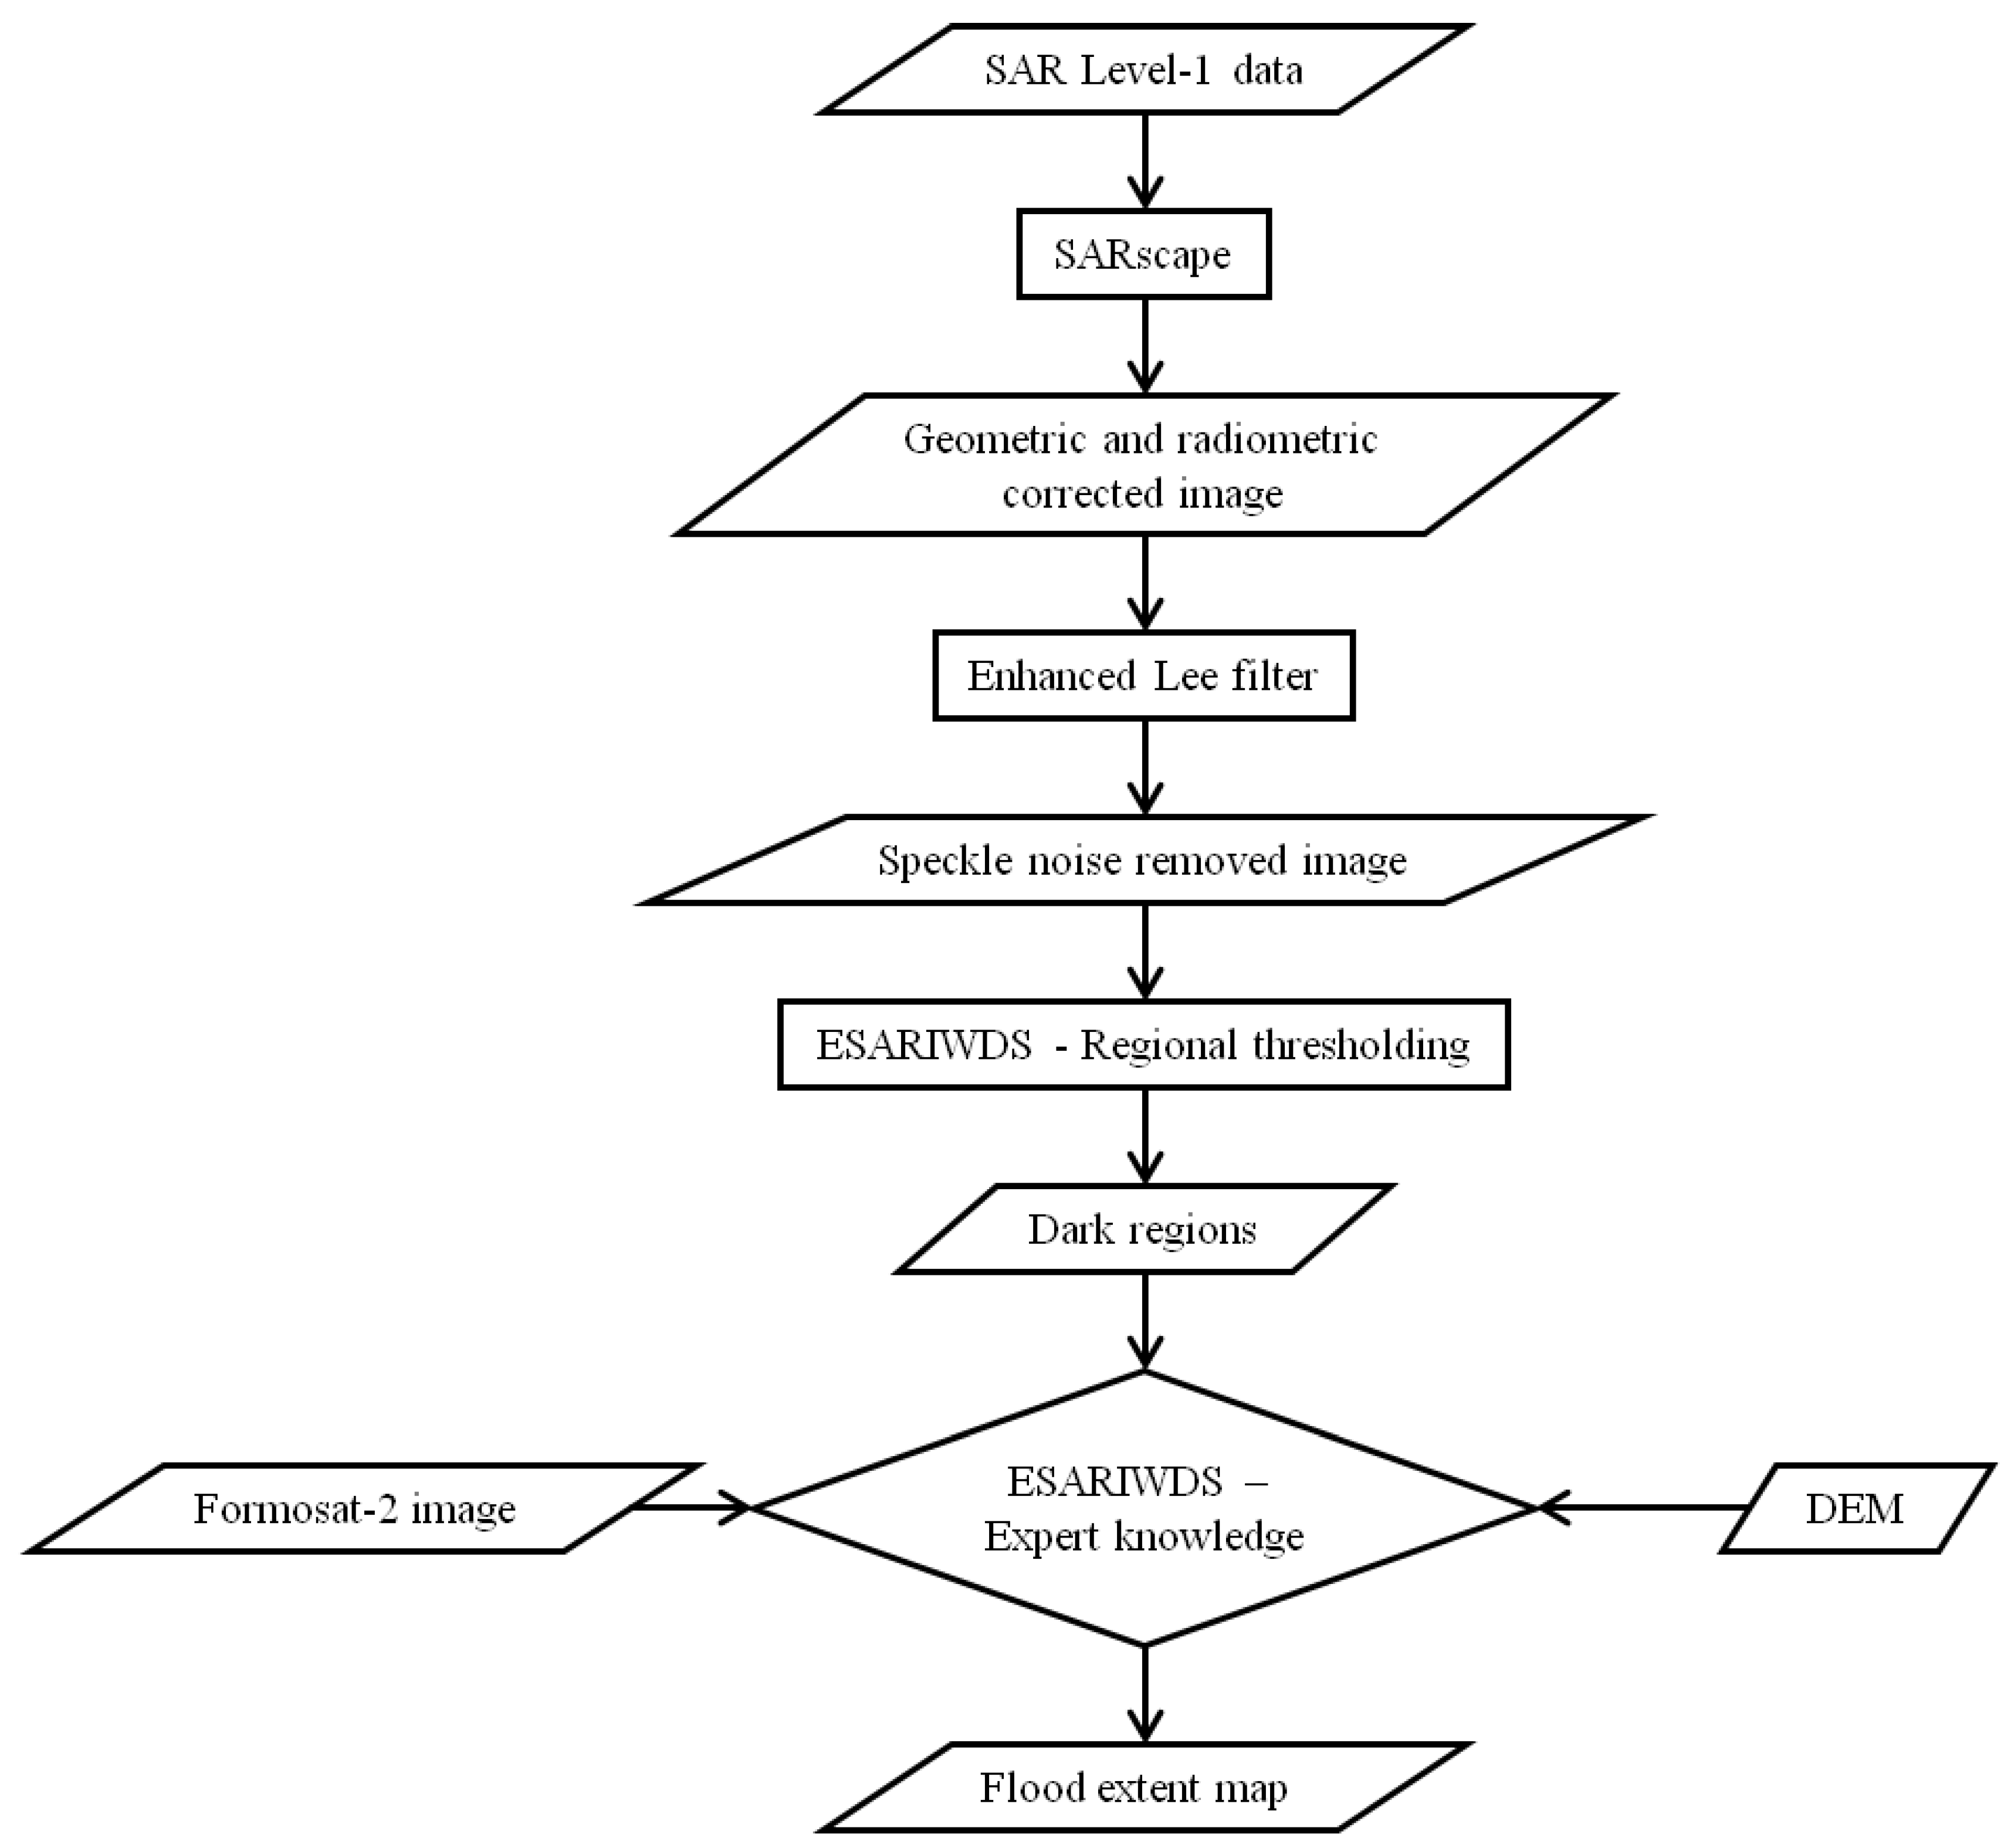
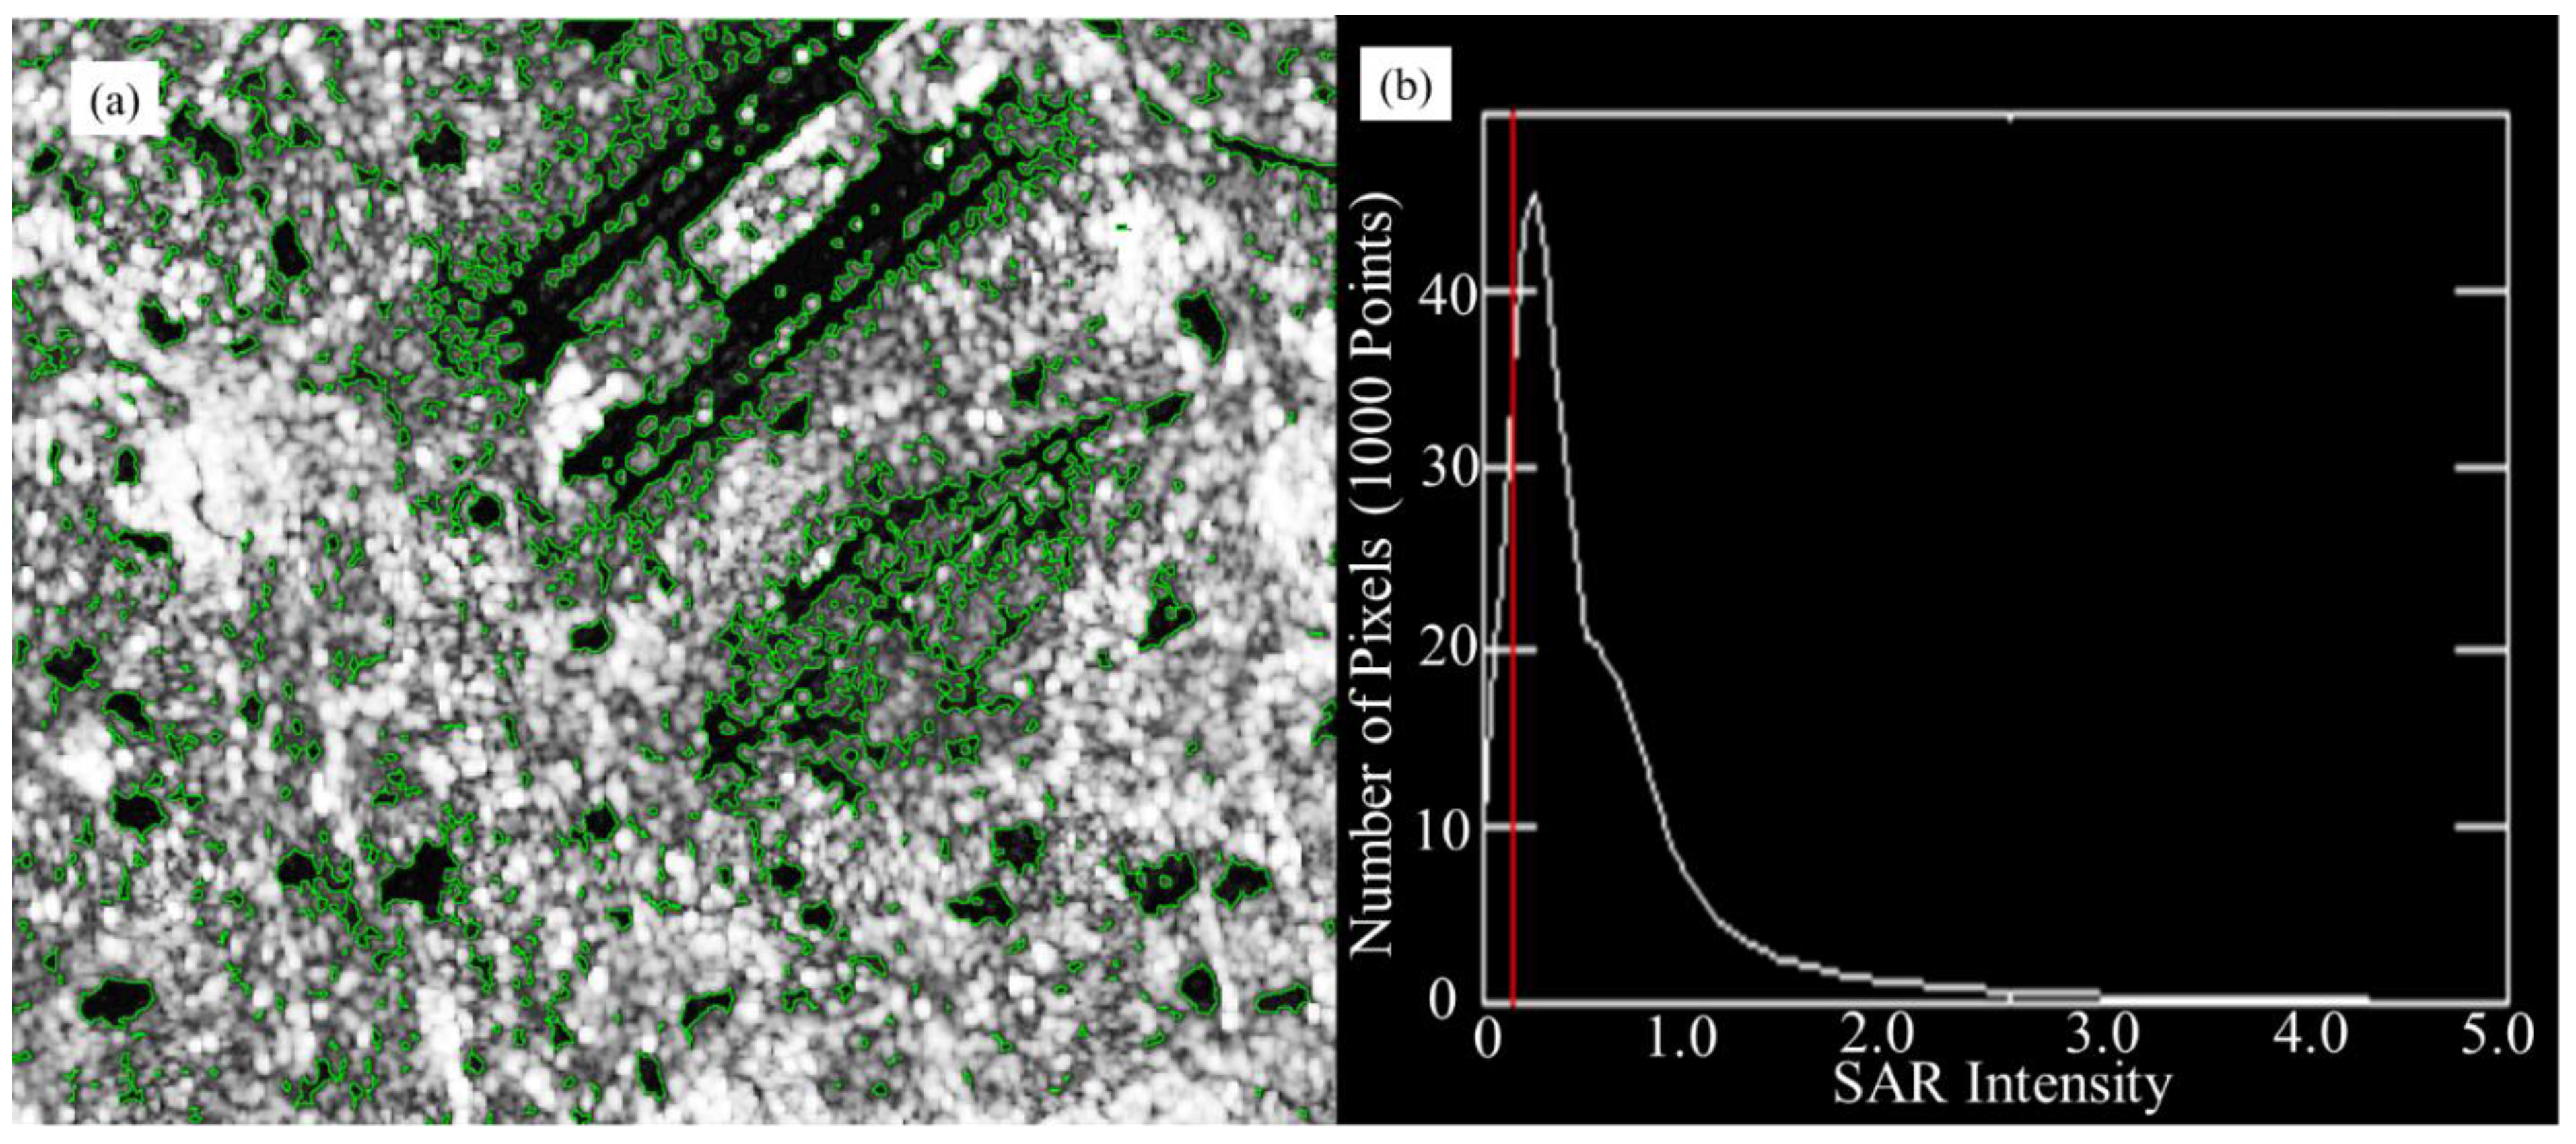
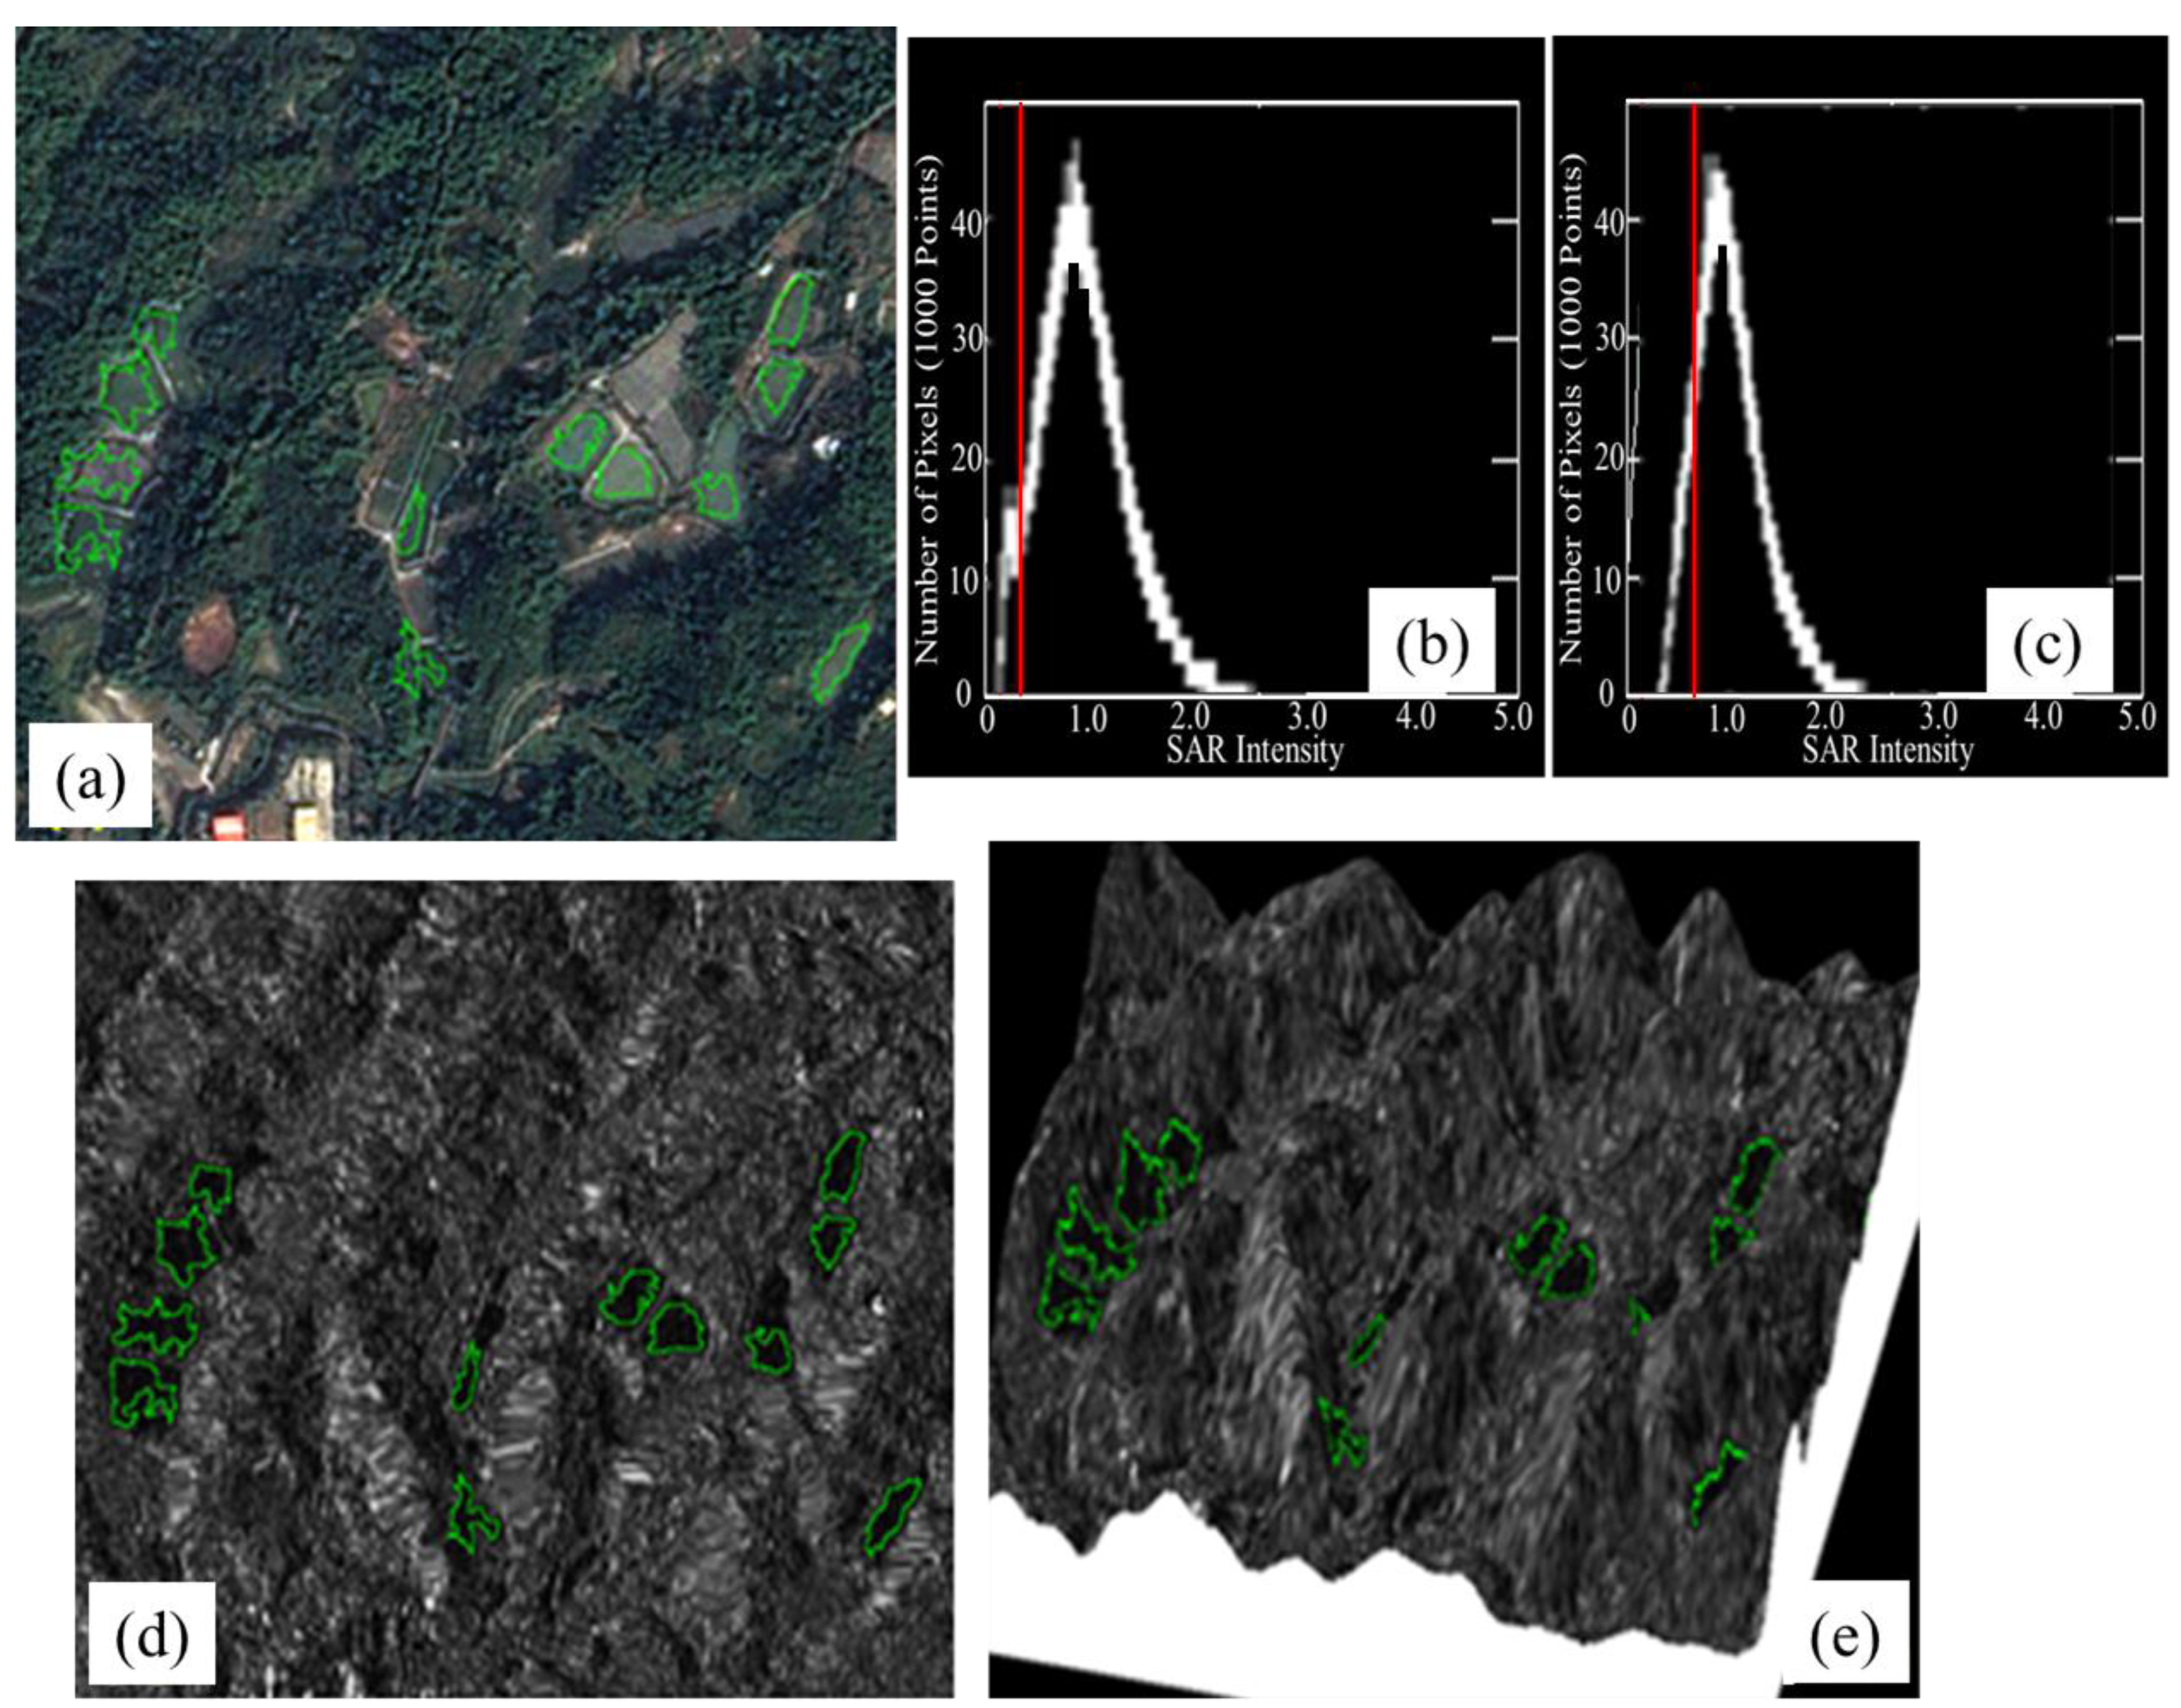
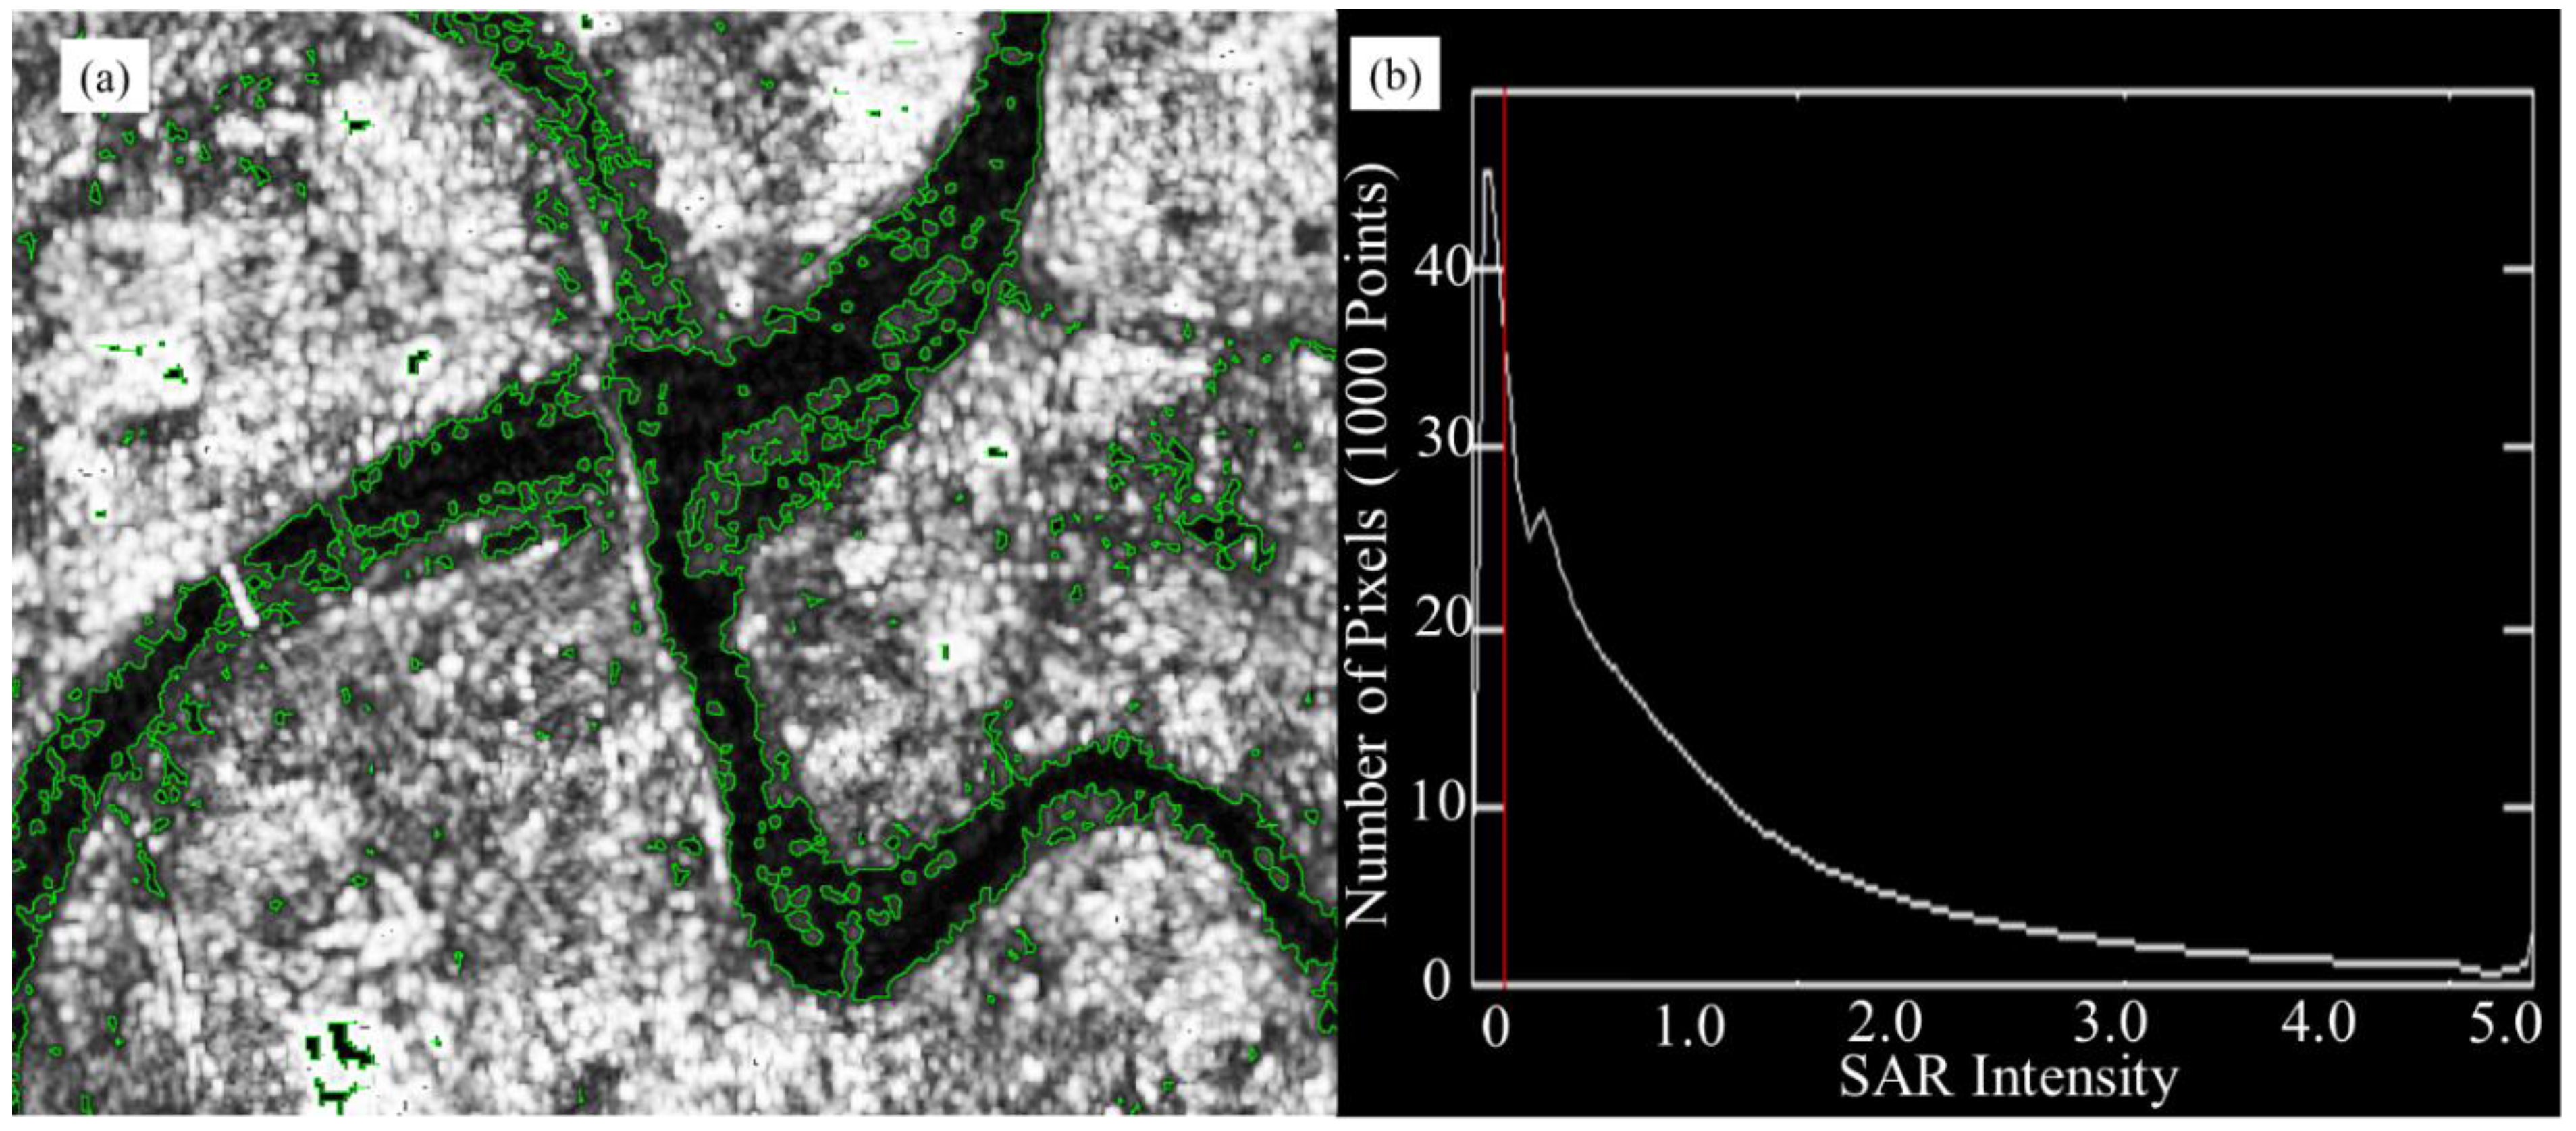
4.1. Expert Synthetic Aperture Radar Imagery Waterbody Delineation System


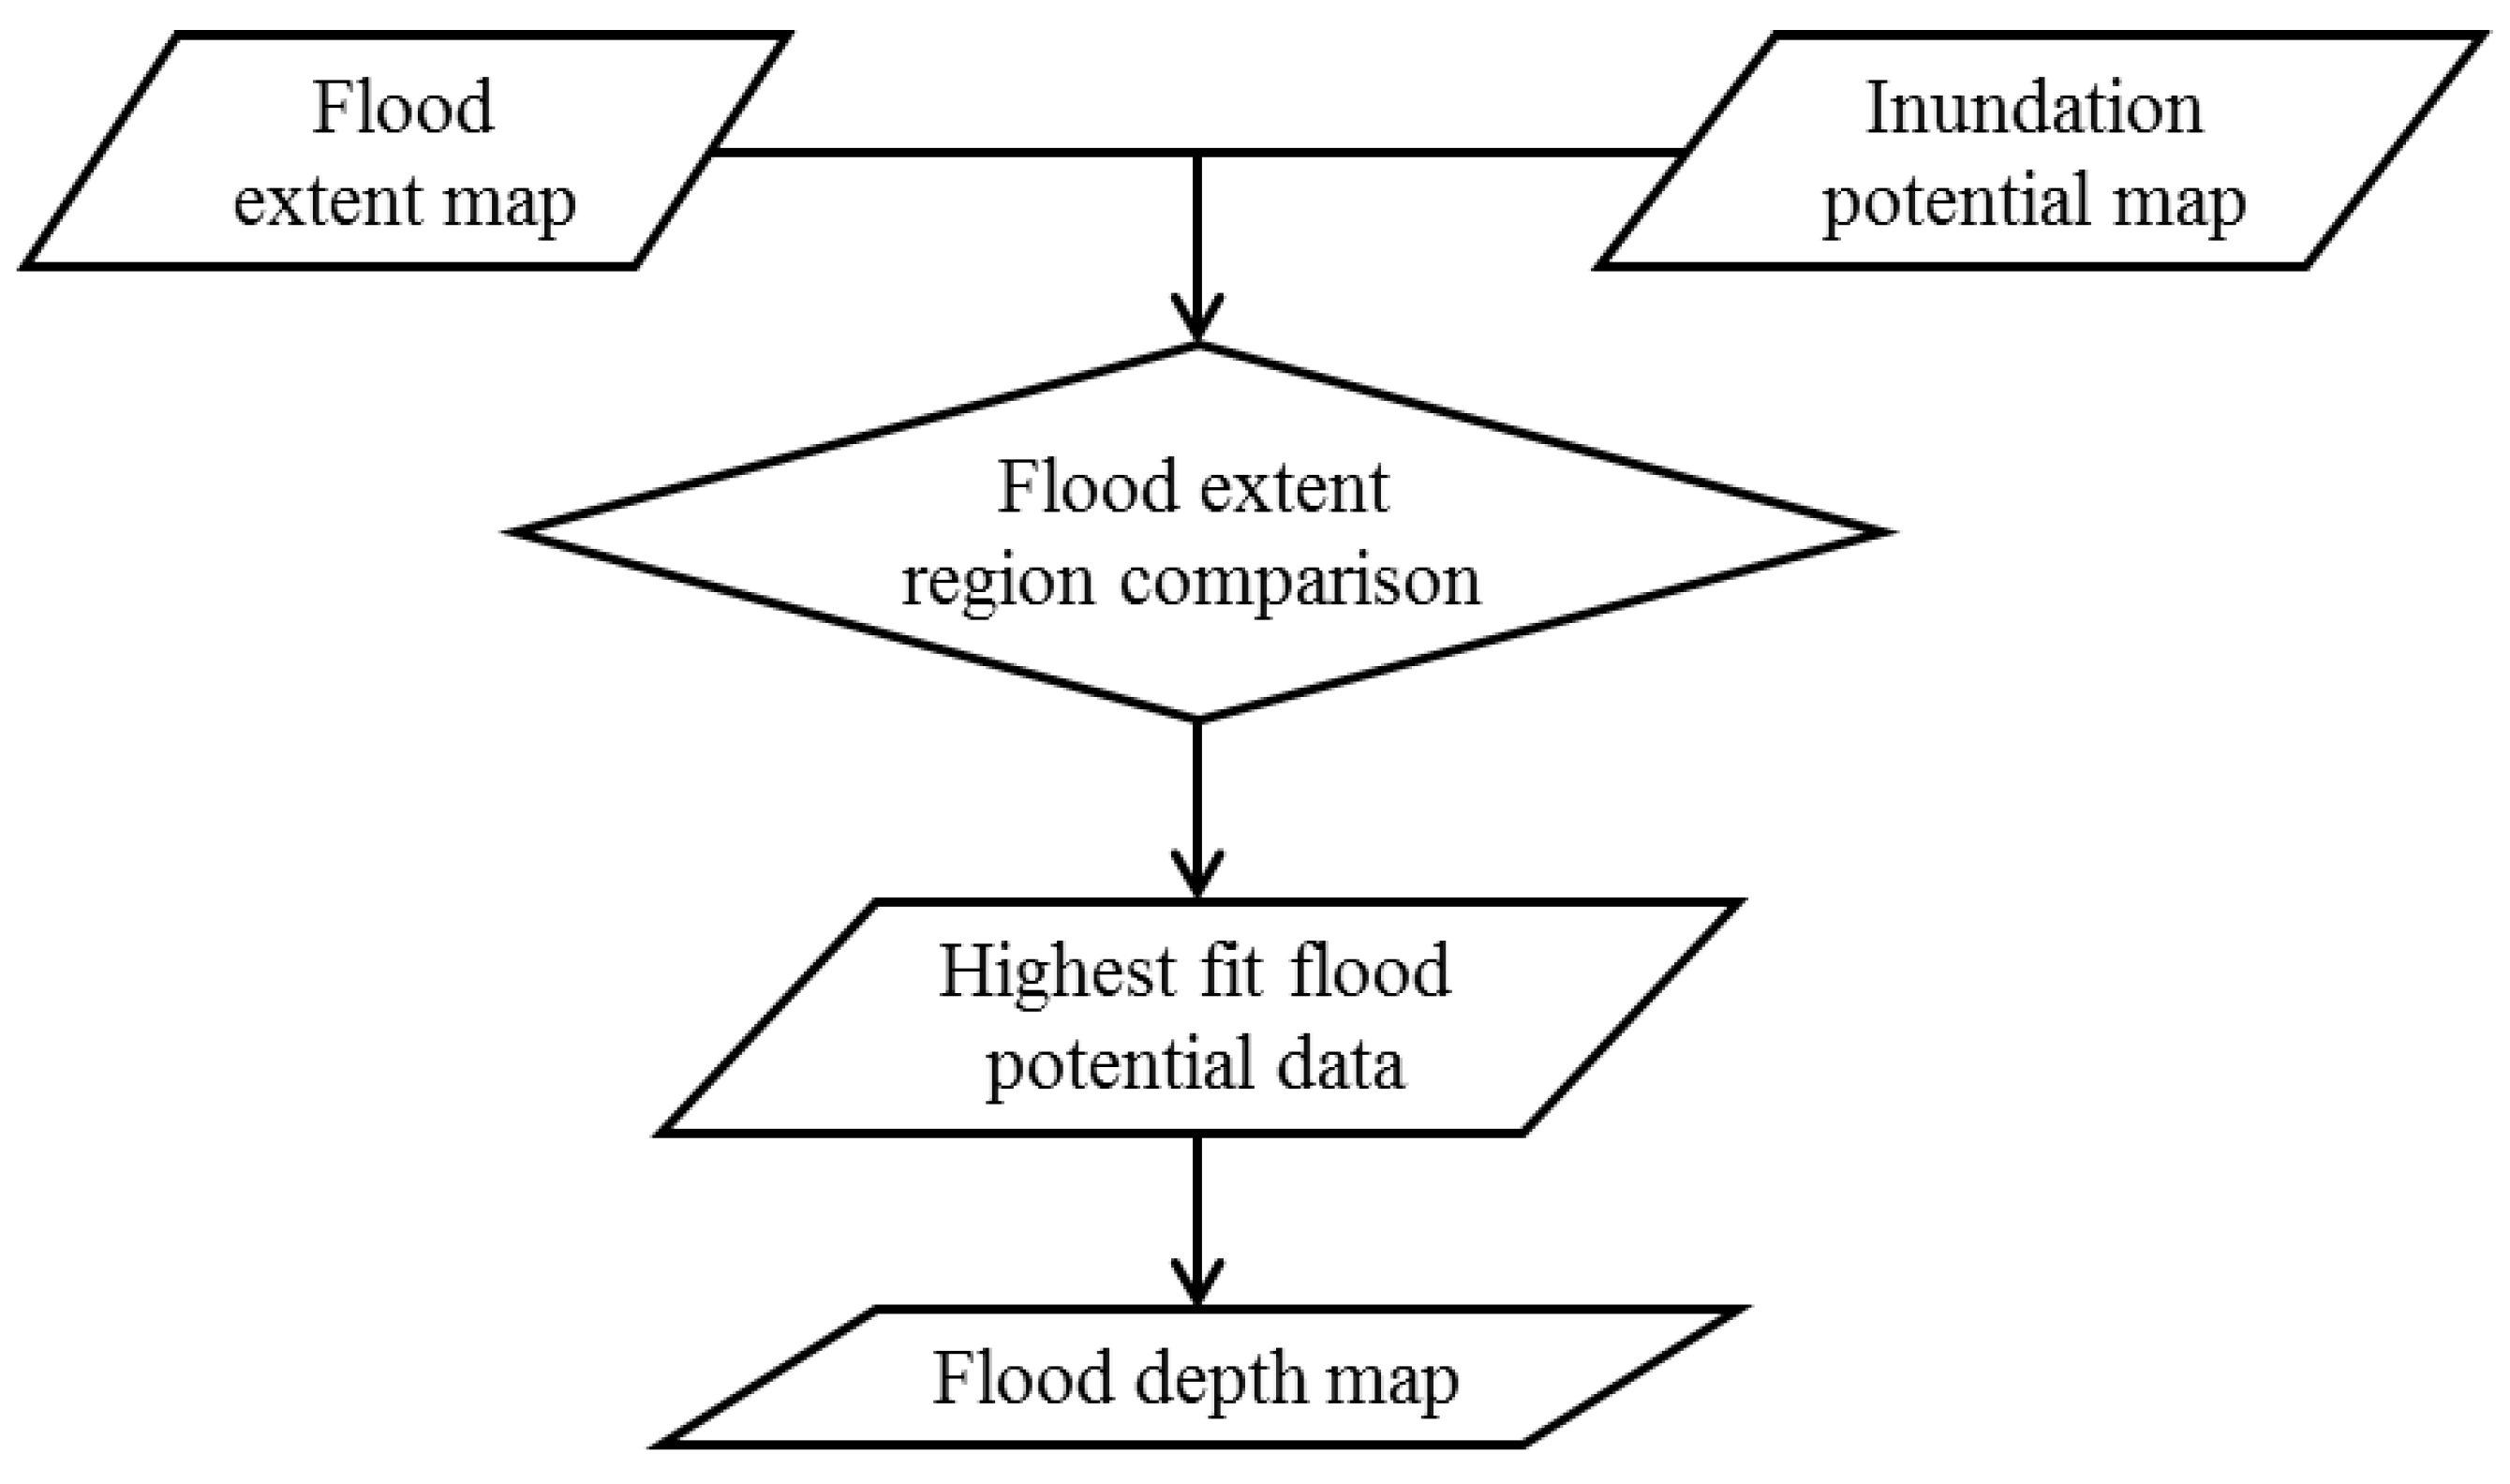
4.2. Flood Depth Deriving

5. Results and Discussion
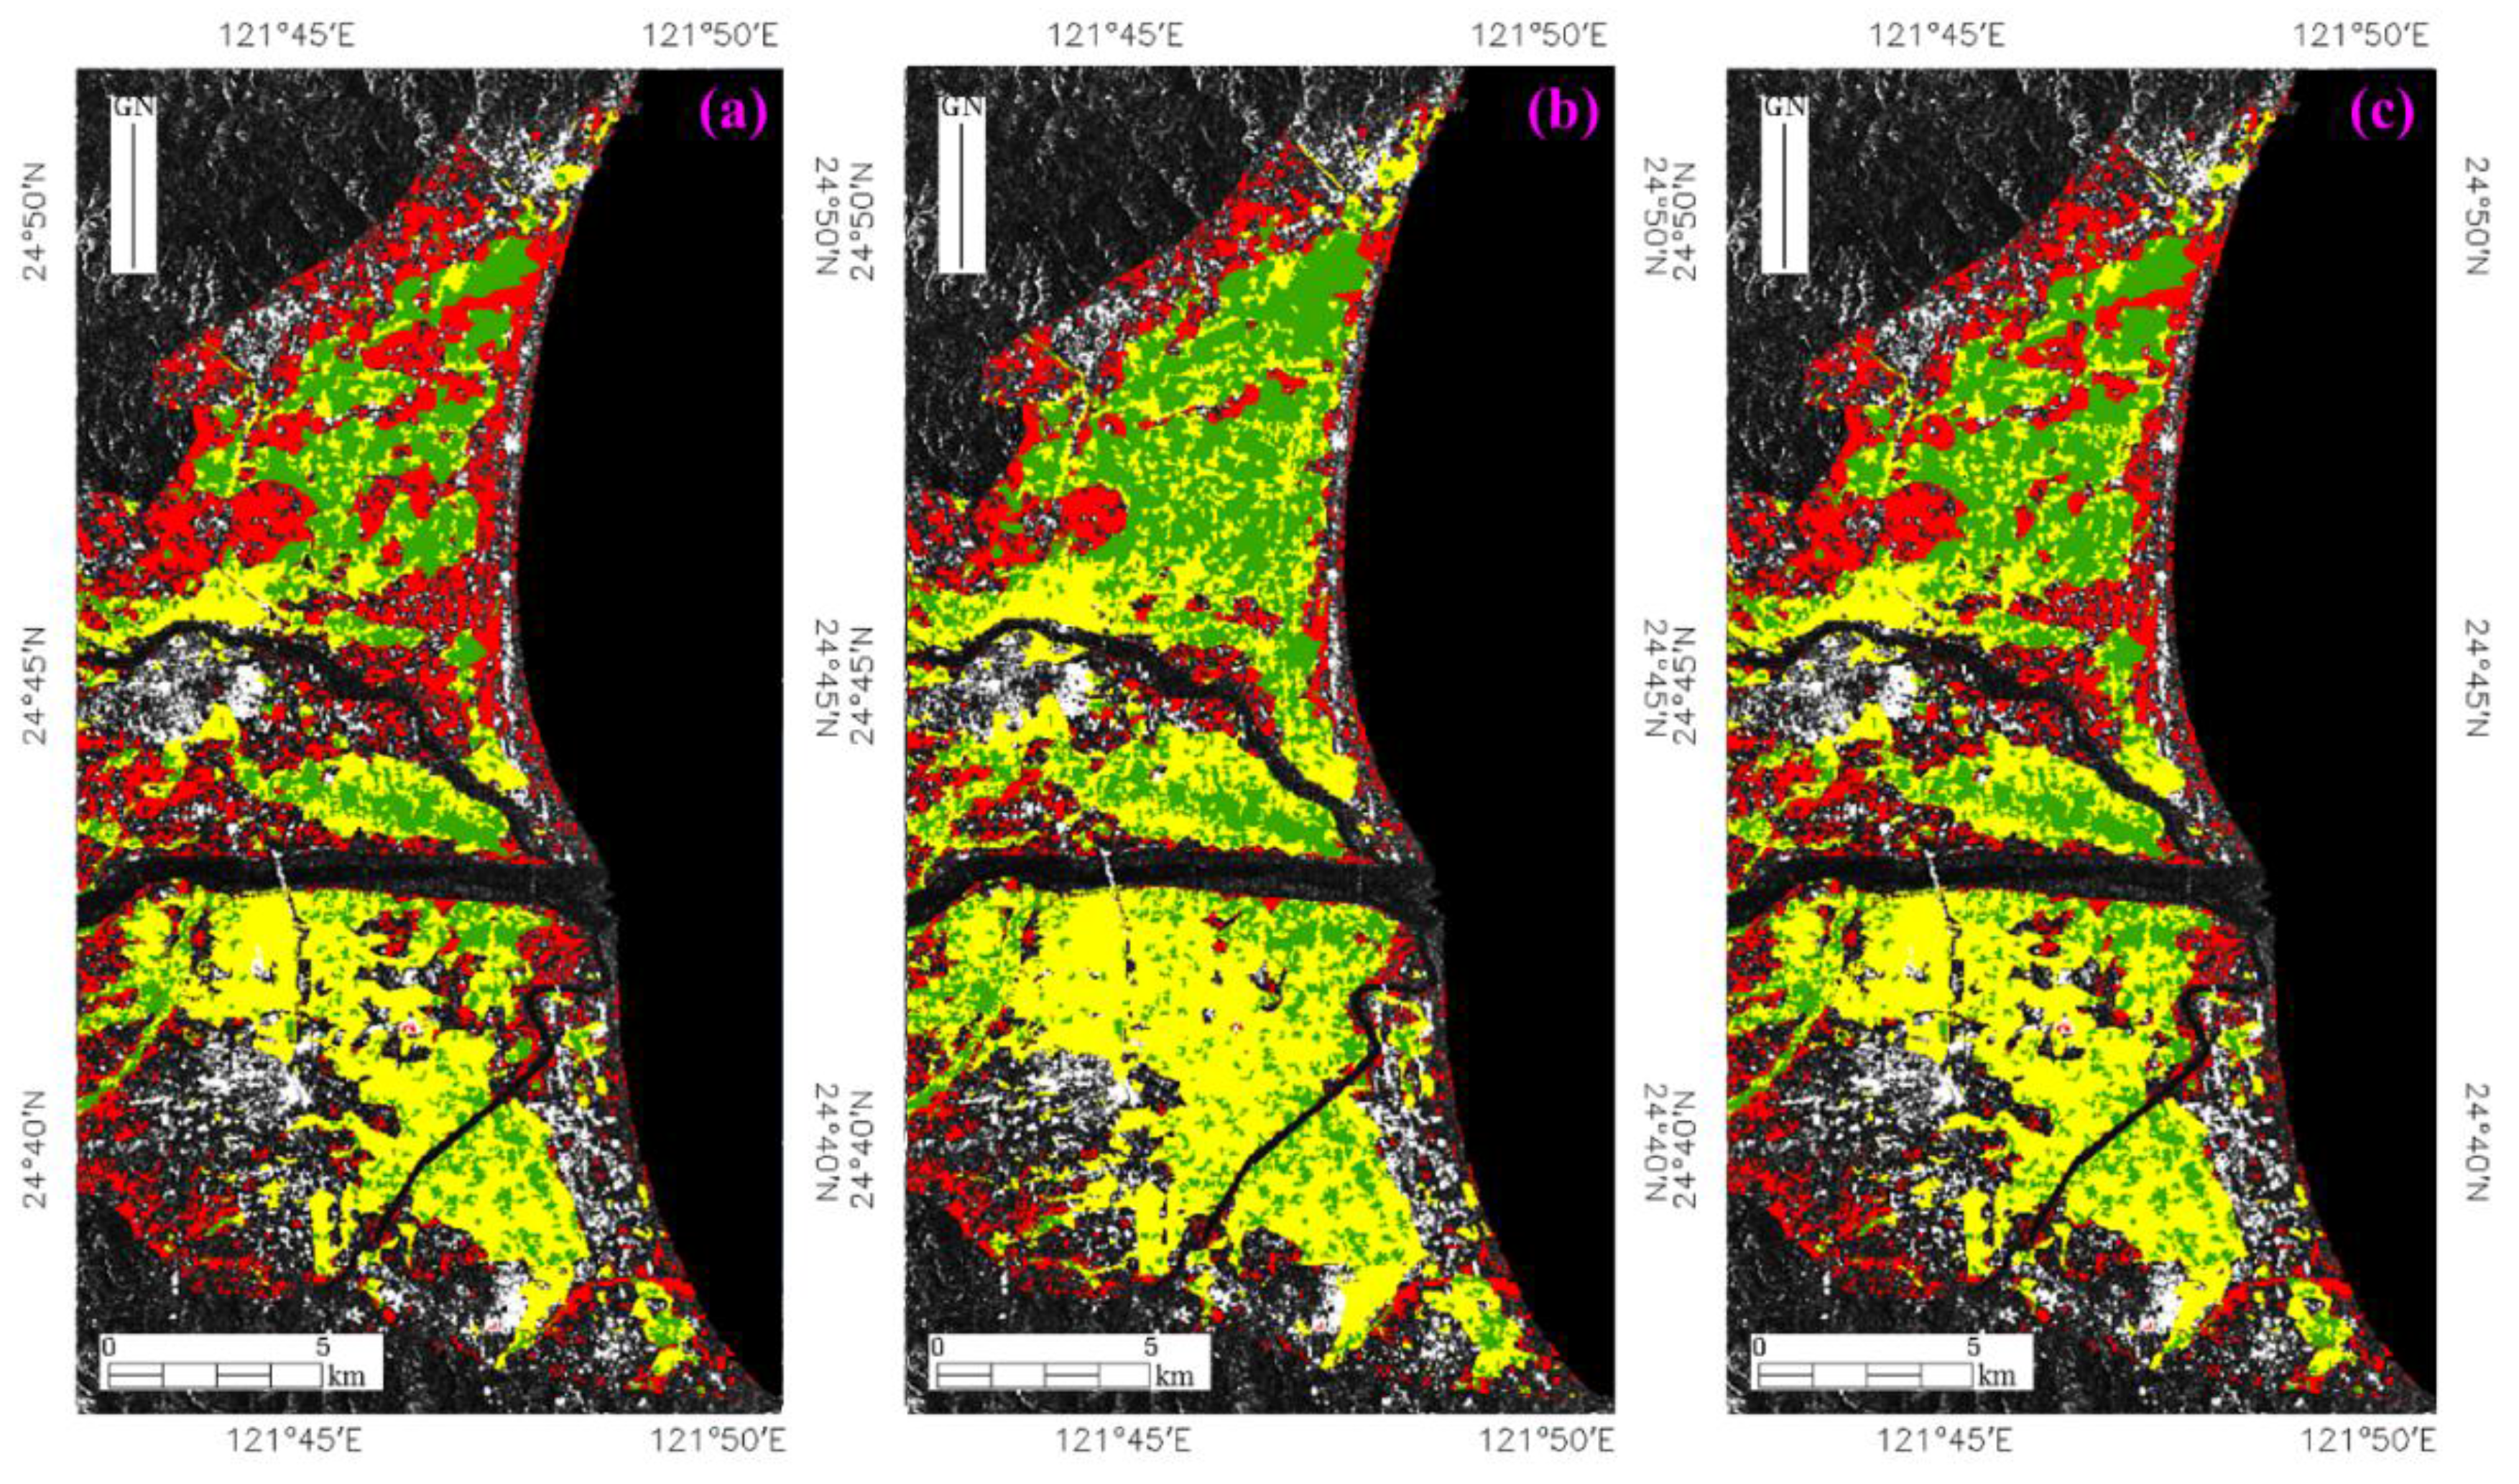
5.1. Inundation Extent
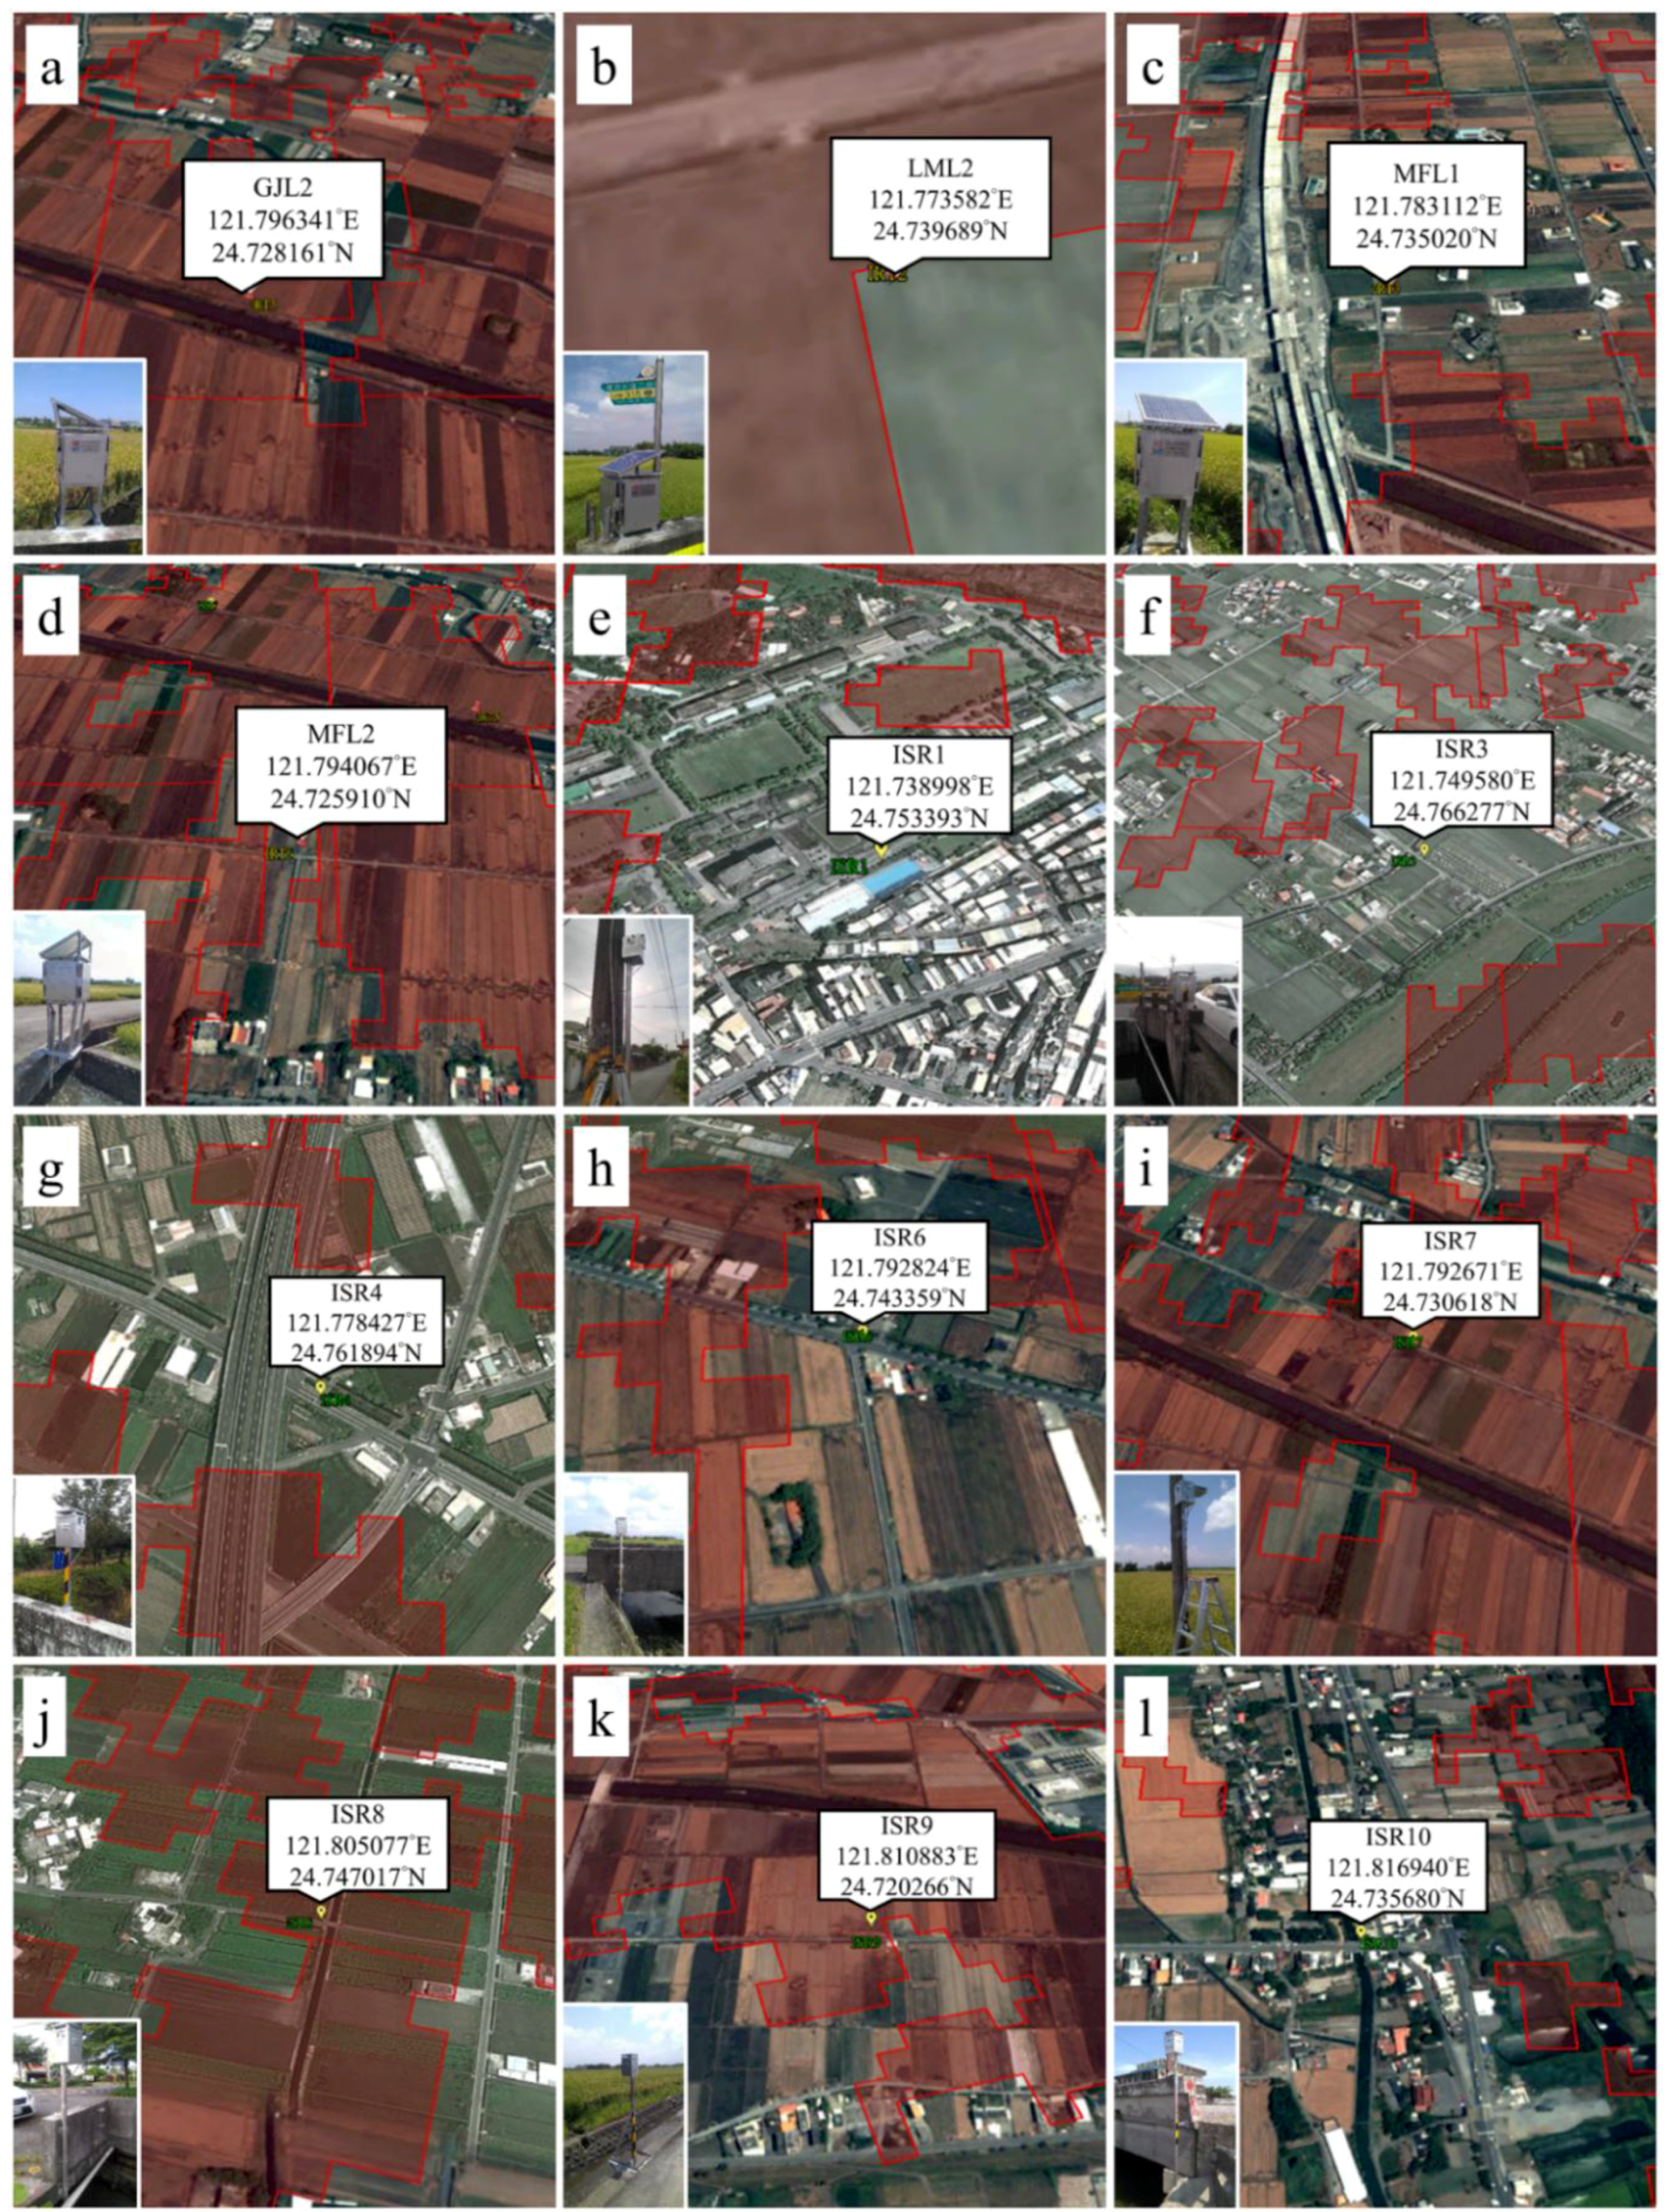
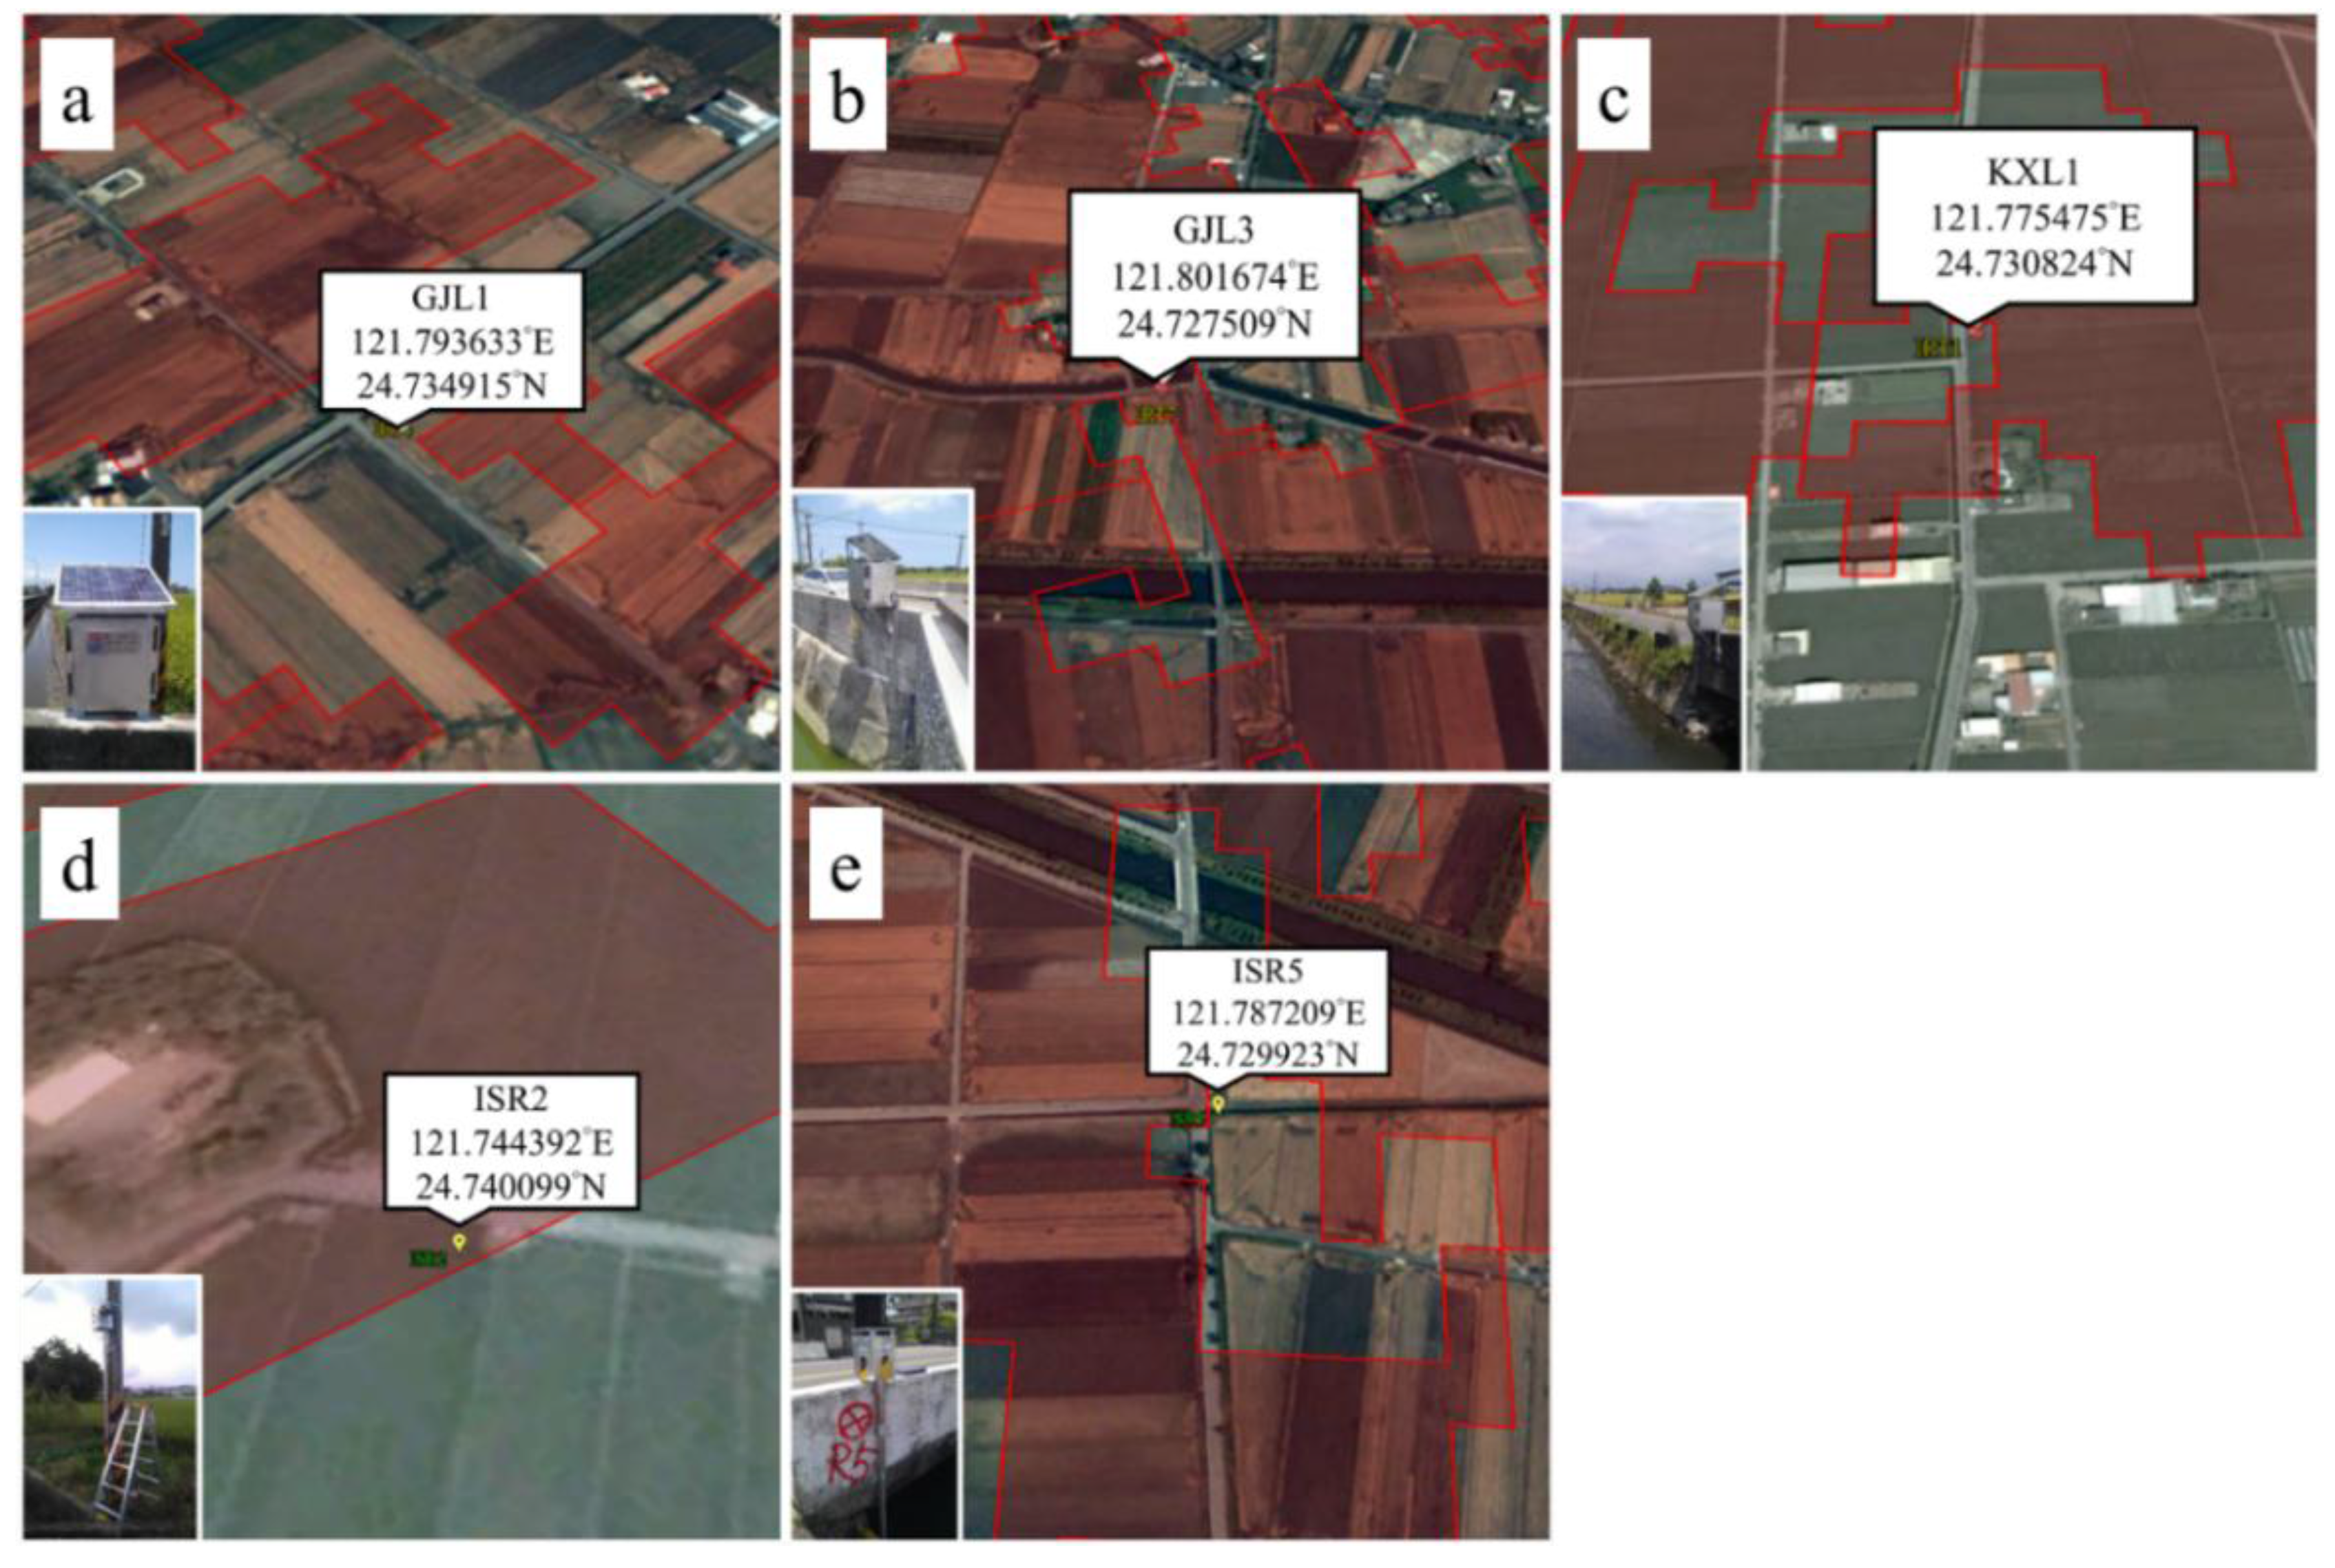

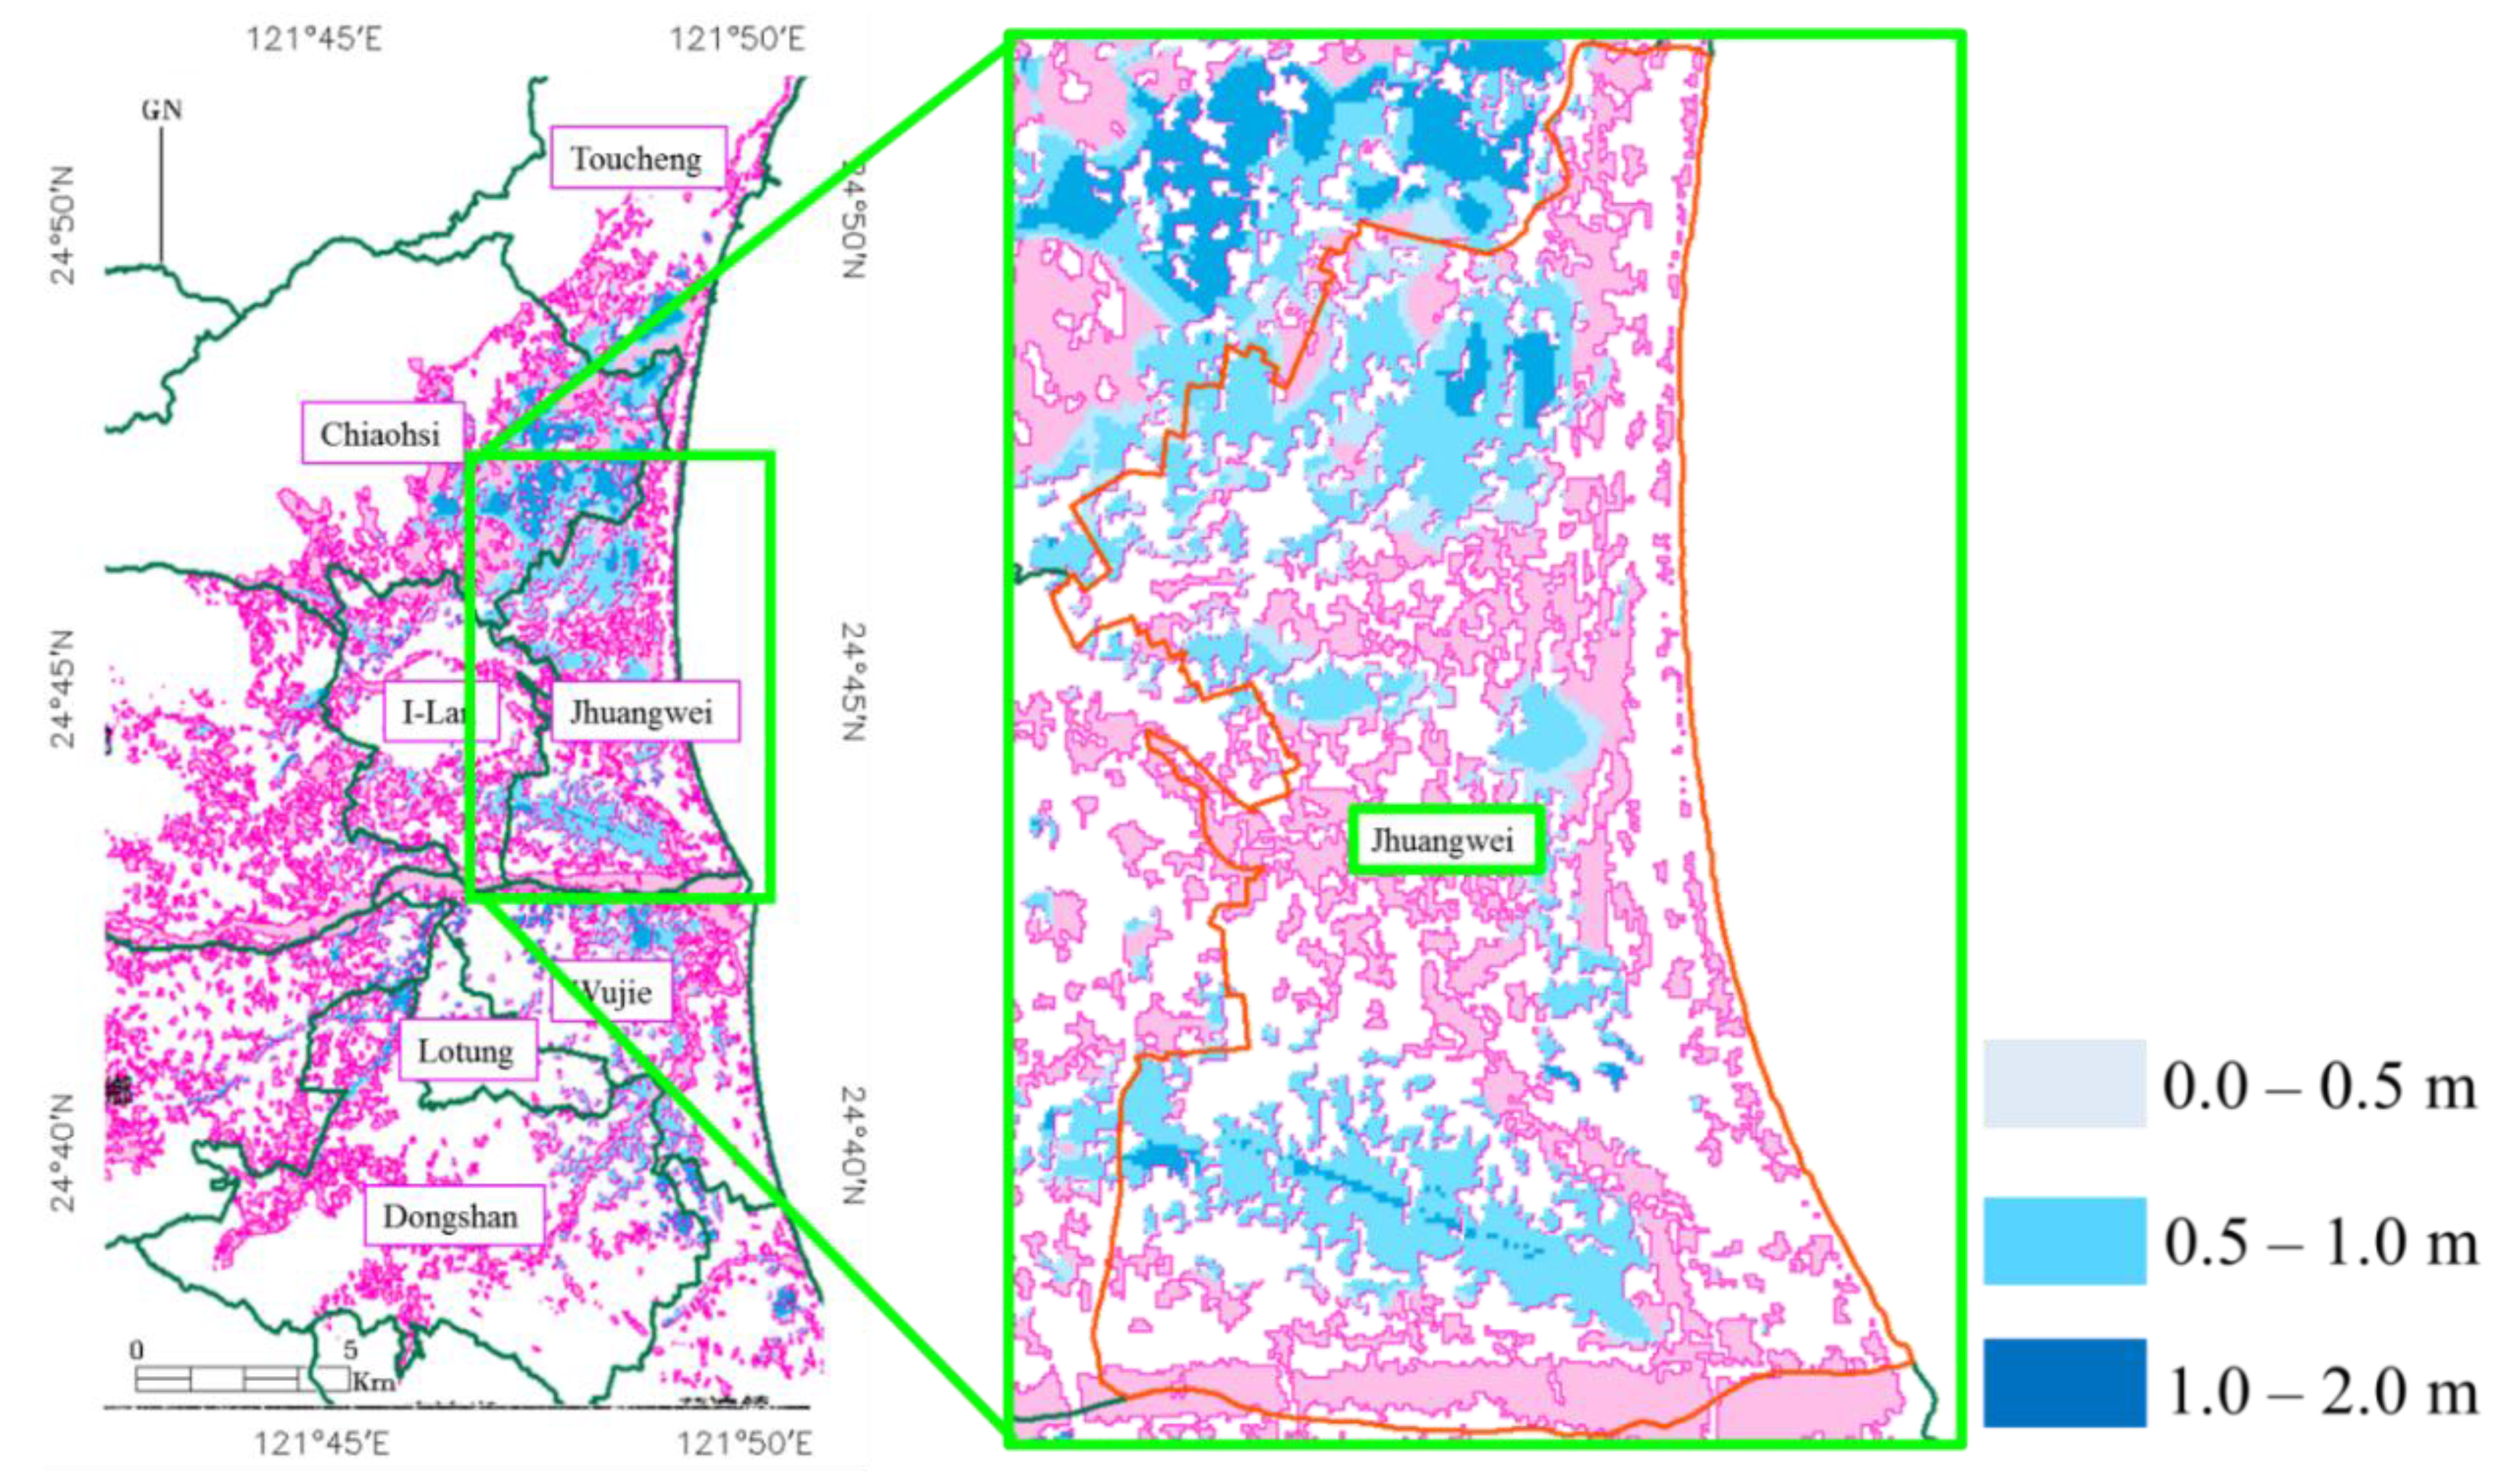
5.2. Inundation Depth

| Area of Inundation Potential Map (m2) | Area of Flood Extent Map (m2) | Fit Area (m2) | Overestimated Area of Inundation Potential Map (m2) | Overestimated Area of Flood Extent Map (m2) | Consistent Rate | Overestimation Rate of Flood Extent Map | Underestimation Rate of Flood Extent Map | Accuracy | |
|---|---|---|---|---|---|---|---|---|---|
| Symbol | A | B | C | A – C = D | B – C = E | C/B = F | D/B = G | E/B = H | F/G = I |
| I1 | 80,203,200 | 84,444,893 | 32,336,135 | 47,867,065 | 52,108,758 | 0.3829 | 0.5668 | 0.6171 | 0.68 |
| I10 | 135,708,800 | 84,444,893 | 52,866,069 | 82,842,732 | 31,578,825 | 0.626 | 0.981 | 0.374 | 0.64 |
| I100 | 156,982,400 | 84,444,893 | 59,381,731 | 97,600,669 | 25,063,163 | 0.7032 | 1.1558 | 0.2968 | 0.61 |
| I2 | 110,441,600 | 84,444,893 | 44,185,098 | 66,256,502 | 40,259,795 | 0.5232 | 0.7846 | 0.4768 | 0.67 |
| I20 | 143,035,200 | 84,444,893 | 55,200,726 | 87,834,474 | 29,244,167 | 0.6537 | 1.0401 | 0.3463 | 0.63 |
| I200 | 161,609,600 | 84,444,893 | 60,716,539 | 100,893,061 | 23,728,354 | 0.719 | 1.1948 | 0.281 | 0.60 |
| I25 | 145,214,400 | 84,444,893 | 55,817,560 | 89,396,840 | 28,627,333 | 0.661 | 1.0586 | 0.339 | 0.62 |
| I5 | 126,550,400 | 84,444,893 | 49,885,001 | 76,665,399 | 34,559,892 | 0.5907 | 0.9079 | 0.4093 | 0.65 |
| I50 | 151,299,200 | 84,444,893 | 57,693,123 | 93,606,077 | 26,751,771 | 0.6832 | 1.1085 | 0.3168 | 0.62 |
| I500 | 167,080,000 | 84,444,893 | 62,111,361 | 104,968,639 | 22,333,532 | 0.7355 | 1.243 | 0.2645 | 0.59 |
| R200 | 93,379,200 | 84,444,893 | 38,036,356 | 55,342,844 | 46,408,537 | 0.4504 | 0.6554 | 0.5496 | 0.69 |
| R350 | 120,953,600 | 84,444,893 | 48,213,636 | 72,739,964 | 36,231,258 | 0.5709 | 0.8614 | 0.4291 | 0.66 |
| R450 | 133,155,200 | 84,444,893 | 52,209,337 | 80,945,863 | 32,235,556 | 0.6183 | 0.9586 | 0.3817 | 0.64 |
| R600 | 147,368,000 | 84,444,893 | 56,693,289 | 90,674,711 | 27,751,605 | 0.6714 | 1.0738 | 0.3286 | 0.63 |
| Name | Derived Flood Depth (cm) | Water Level Station (cm) | Flood | Annotations |
|---|---|---|---|---|
| GJL1 | 61.9 | 30.7 | ○ | Flood depth overestimated. |
| GJL2 | 66.0 | 93.9 | ○ | The water level station is located at the edge of a water body. |
| GJL3 | 62.5 | 0.1 | ○ | Flood depth underestimated. |
| KXL1 | 70.9 | 48.1 | ╳ | Flood depth overestimated. |
| LML2 | 0.0 | 1.7 | ╳ | The water level station is located at the edge of a water body. |
| MFL1 | 69.6 | 1.6 | ╳ | Flood depth overestimated. |
| MFL2 | 64 | 0.8 | ╳ | The water level station is located at the edge a water body. |
| ISR1 | 0.0 | 0.4 | ╳ | The results are consistent with the water level station data. |
| ISR2 | 37.7 | 0.3 | ○ | Flood depth overestimated. |
| ISR3 | 113.5 | 0.6 | ╳ | Flood depth overestimated. |
| ISR4 | 0.0 | 0.4 | ╳ | The results are consistent with the water level station data. |
| ISR5 | 66.5 | 21.2 | ╳ | Flood depth overestimated. |
| ISR6 | 0.0 | 0.3 | ╳ | The water level station is located at the edge a water body. |
| ISR7 | 62.8 | 10.2 | ○ | Flood depth overestimated. |
| ISR8 | 0.0 | 30.3 | ○ | The results are consistent with water level station data. |
| ISR9 | 36.6 | 5.4 | ○ | Flood depth overestimated. |
| ISR10 | 38.4 | 0.5 | ╳ | The water level station is located at the edge a water body. |
6. Concluding Remarks
Acknowledgments
Author Contributions
Conflicts of Interest
References
- Skakun, S.; Kussul, N.; Shelestov, A.; Kussul, O. Flood hazard and flood risk assessment using a time series of satellite images: A case study in Namibia. Risk Anal. 2014, 34, 1521–1537. [Google Scholar] [CrossRef] [PubMed]
- Greifeneder, F.; Wagner, W.; Sabel, D.; Naeimi, V. Suitability of sar imagery for automatic flood mapping in the lower Mekong Basin. Int. J. Remote Sens. 2014, 35, 2857–2874. [Google Scholar] [CrossRef]
- Liu, C.C.; Liu, J.G.; Lin, C.W.; Wu, A.M.; Liu, S.H.; Shieh, C.L. Image processing of Formosat-2 data for monitoring the south Asia tsunami. Int. J. Remote Sens. 2007, 28, 3093–3111. [Google Scholar] [CrossRef]
- Liu, C.-C.; Chen, N.-Y. Responding to natural disasters with satellite imagery. SPIE Newsroom 2011. [Google Scholar] [CrossRef]
- Schumann, G.; Bates, P.D.; Horritt, M.S.; Matgen, P.; Pappenberger, F. Progress in integration of remote sensing-derived flood extent and stage data and hydraulic models. Rev. Geophys. 2009, 47, RG4001. [Google Scholar] [CrossRef]
- Rango, A.; Salomons, V.V. Regional flood mapping from space. Water Resour. Res. 1974, 10, 473–484. [Google Scholar] [CrossRef]
- Wang, Q.; Watanabe, M.; Hayashi, S.; Murakami, S. Using noaa avhrr data to assess flood damage in China. Environ. Monit. Assess. 2003, 82, 119–148. [Google Scholar] [CrossRef] [PubMed]
- Zhang, F.; Zhu, X.; Liu, D. Blending modis and landsat images for urban flood mapping. Int. J. Remote Sens. 2014, 35, 3237–3253. [Google Scholar] [CrossRef]
- Feng, Q.; Liu, J.; Gong, J. Urban flood mapping based on unmanned aerial vehicle remote sensing and random forest classifier—A case of Yuyao, China. Water 2015, 7, 1437–1455. [Google Scholar] [CrossRef]
- Jung, Y.; Kim, D.; Kim, D.; Kim, M.; Lee, S.O. Simplified flood inundation mapping based on flood elevation-discharge rating curves using satellite images in gauged watersheds. Water 2014, 6, 1280–1299. [Google Scholar] [CrossRef]
- Chaouch, N.; Temimi, M.; Hagen, S.; Weishampel, J.; Medeiros, S.; Khanbilvardi, R. A synergetic use of satellite imagery from sar and optical sensors to improve coastal flood mapping in the Gulf of Mexico. Hydrol. Process. 2012, 26, 1617–1628. [Google Scholar] [CrossRef]
- Pulvirenti, L.; Pierdicca, N.; Boni, G.; Fiorini, M.; Rudari, R. Flood damage assessment through multitemporal COSMO-SkyMed data and hydrodynamic models: The Albania 2010 case study. IEEE J. Sel. Top. Appl. Earth Obs. Remote Sens. 2014, 7, 2848–2855. [Google Scholar] [CrossRef]
- Yulianto, F.; Sofan, P.; Zubaidah, A.; Sukowati, K.A.D.; Pasaribu, J.M.; Khomarudin, M.R. Detecting areas affected by flood using multi-temporal alos PALSAR remotely sensed data in Karawang, West Java, Indonesia. Nat. Hazards 2015, 77, 959–985. [Google Scholar] [CrossRef]
- Goroshko, M.V.; Gil’manova, G.Z.; Rybas, O.V. Analysis of digital elevation models of the geological surveys of the Elkon Uranium-Ore District (Aldan-Stanovoi Shield). Russ. J. Pac. Geol. 2015, 9, 136–140. [Google Scholar] [CrossRef]
- Skrunes, S.; Brekke, C.; Eltoft, T.; Kudryavtsev, V. Comparing near-coincident C- and X-band SAR acquisitions of marine oil spills. IEEE Trans. Geosci. Remote Sens. 2015, 53, 1958–1975. [Google Scholar] [CrossRef]
- Vicente-Guijalba, F.; Martinez-Marin, T.; Lopez-Sanchez, J.M. Dynamical approach for real-time monitoring of agricultural crops. IEEE Trans. Geosci. Remote Sens. 2015, 53, 3278–3293. [Google Scholar] [CrossRef]
- Zhang, L.; Guo, H.; Li, X.; Wang, L. Ecosystem assessment in the Tonle Sap Lake region of Cambodia using Radarsat-2 wide fine-mode Sar data. Int. J. Remote Sens. 2014, 35, 2875–2892. [Google Scholar] [CrossRef]
- Horritt, M.S.; Mason, D.C.; Luckman, A.J. Flood boundary delineation from synthetic aperture radar imagery using a statistical active contour model. Int. J. Remote Sens. 2001, 22, 2489–2507. [Google Scholar] [CrossRef]
- Imhoff, M.L.; Vermillion, C.; Story, M.H.; Choudhury, A.M.; Gafoor, A.; Polcyn, F. Monsoon flood boundary delineation and damage assessment using space borne imaging radar and Landsat data. Photogramm. Eng. Remote Sens. 1987, 53, 405–413. [Google Scholar]
- Mason, D.C.; Davenport, I.J.; Neal, J.C.; Schumann, G.J.P.; Bates, P.D. Near real-time flood detection in urban and rural areas using high-resolution synthetic aperture radar images. IEEE Trans. Geosci. Remote Sens. 2012, 50, 3041–3052. [Google Scholar] [CrossRef]
- Kundu, S.; Aggarwal, S.P.; Kingma, N.; Mondal, A.; Khare, D. Flood monitoring using microwave remote sensing in a part of Nuna River Basin, Odisha, India. Nat. Hazards 2015, 76, 123–138. [Google Scholar] [CrossRef]
- Manjusree, P.; Kumar, L.P.; Bhatt, C.M.; Rao, G.S.; Bhanumurthy, V. Optimization of threshold ranges for rapid flood inundation mapping by evaluating backscatter profiles of high incidence angle Sar images. Int. J. Disaster Risk Sci. 2012, 3, 113–122. [Google Scholar] [CrossRef]
- Voigt, S.; Kemper, T.; Riedlinger, T.; Kiefl, R.; Scholte, K.; Mehl, H. Satellite image analysis for disaster and crisis-management support. IEEE Trans. Geosci. Remote Sens. 2007, 45, 1520–1528. [Google Scholar] [CrossRef]
- Giustarini, L.; Vernieuwe, H.; Verwaeren, J.; Chini, M.; Hostache, R.; Matgen, P.; Verhoest, N.E.C.; De Baets, B. Accounting for image uncertainty in SAR-based flood mapping. Int. J. Appl. Earth Obs. Geoinform. 2015, 34, 70–77. [Google Scholar] [CrossRef]
- CDPRC. Central disaster prevention and response council. Available online: http://www.Cdprc.Ey.Gov.Tw/default.Aspx (accessed on 13 July 2013).
- CWB. Central weather bureau, typhoon database. Available online: http://rdc28.Cwb.Gov.Tw/tdb/ntdb/pagecontrol/ty_warning (accessed on 13 July 2013).
- Lillesand, T.; Kiefer, R.W.; Chipman, J. Remote Sensing and Image Interpretation, 7th ed.; John Wiley & Sons, Inc.: Hoboken, NJ, USA, 2015; p. 768. [Google Scholar]
- Refice, A.; Capolongo, D.; Pasquariello, G.; D’Addabbo, A.; Bovenga, F.; Nutricato, R.; Lovergine, F.P.; Pietranera, L. SAR and InSAR for flood monitoring: Examples with COSMO-SkyMed data. IEEE J. Sel. Top. Appl. Earth Obs. Remote Sens. 2014, 7, 2711–2722. [Google Scholar] [CrossRef]
- Liu, C.-C. Preparing a landslide and shadow inventory map from high-spatial-resolution imagery facilitated by an expert system. J. Appl. Remote Sens 2015, 9, 096080-1–096080-13. [Google Scholar] [CrossRef]
- Martinis, S.; Twele, A.; Voigt, S. Unsupervised extraction of flood-induced backscatter changes in SAR data using Markov image modeling on irregular graphs. IEEE Trans. Geosci. Remote Sens. 2011, 49, 251–263. [Google Scholar] [CrossRef]
- Wu, S.-J.; Hsu, C.-T.; Lien, H.-C.; Chang, C.-H. Modeling the effect of uncertainties in rainfall characteristics on flash flood warning based on rainfall thresholds. Nat. Hazards 2015, 75, 1677–1711. [Google Scholar] [CrossRef]
- Mtamba, J.; van der Velde, R.; Ndomba, P.; Zoltan, V.; Mtalo, F. Use of Radarsat-2 and Landsat TM images for spatial parameterization of manning’s roughness coefficient in hydraulic modeling. Remote Sens. 2015, 7, 836–864. [Google Scholar] [CrossRef]
- Proud, S.R.; Fensholt, R.; Rasmussen, L.V.; Sandholt, I. Rapid response flood detection using the MSG geostationary satellite. Int. J. Appl. Earth Obs. Geoinform. 2011, 13, 536–544. [Google Scholar] [CrossRef]
- Amarnath, G. An algorithm for rapid flood inundation mapping from optical data using a reflectance differencing technique. J. Flood Risk Manag. 2014, 7, 239–250. [Google Scholar] [CrossRef]
- Li, L.; Chen, Y.; Yu, X.; Liu, R.; Huang, C. Sub-pixel flood inundation mapping from multispectral remotely sensed images based on discrete particle swarm optimization. Isprs J. Photogramm. Remote Sens. 2015, 101, 10–21. [Google Scholar] [CrossRef]
© 2015 by the authors; licensee MDPI, Basel, Switzerland. This article is an open access article distributed under the terms and conditions of the Creative Commons Attribution license (http://creativecommons.org/licenses/by/4.0/).
Share and Cite
Chung, H.-W.; Liu, C.-C.; Cheng, I.-F.; Lee, Y.-R.; Shieh, M.-C. Rapid Response to a Typhoon-Induced Flood with an SAR-Derived Map of Inundated Areas: Case Study and Validation. Remote Sens. 2015, 7, 11954-11973. https://doi.org/10.3390/rs70911954
Chung H-W, Liu C-C, Cheng I-F, Lee Y-R, Shieh M-C. Rapid Response to a Typhoon-Induced Flood with an SAR-Derived Map of Inundated Areas: Case Study and Validation. Remote Sensing. 2015; 7(9):11954-11973. https://doi.org/10.3390/rs70911954
Chicago/Turabian StyleChung, Hsiao-Wei, Cheng-Chien Liu, I-Fan Cheng, Yun-Ruei Lee, and Ming-Chang Shieh. 2015. "Rapid Response to a Typhoon-Induced Flood with an SAR-Derived Map of Inundated Areas: Case Study and Validation" Remote Sensing 7, no. 9: 11954-11973. https://doi.org/10.3390/rs70911954