
Geometrical Issues on the Structural Analysis of Transmission Electricity Towers Thanks to Laser Scanning Technology and Finite Element Method


Abstract
:
1. Introduction
- The first stage will address a detailed geometric description of the structure (reverse engineering) using a terrestrial laser scanner system, performing an “as built” model that provides information on the structure’s most relevant data, such as geometry, type, and dimensions of the metallic profiles and their assembly drawings.
- Secondly, and taking the geometric model obtained by the laser system as a starting point, three different structural finite element models will be developed: one model will have an ideal geometry considering the nodes of the transmission tower to be pinned, supposing that this model was the one that was used in the original design of the towers. A second model will be developed with the ideal geometry of the previous model, but considering certain continuous elements of the transmission tower to be rigidly connected at both ends. The third model will use the real geometry obtained from the laser scanner (taking into account all possible initial imperfections as, for example, misaligned structural members at joints) and will also consider the stiffness behavior of the continuous elements of the tower. For its analysis the current Spanish standard for the design of such towers will be taken into account [18]. The analysis will be carried out in a linear elastic regime with the software SAP2000 [19] to obtain data of the displacements and stresses in transmission tower members for each load case established by the current codes. It is expected to obtain conclusions about the performance of these different structural approaches and, therefore, conclude which is the most appropriate modeling strategy in structural assessment procedures when an increase in loads to accommodate new services is demanded.
2. Structural Modeling of Truss Structures
- Individual elements or rods are joined together at their ends by means of connections with no friction, which means the nodes transmit forces but do not transmit moments.
- The centroidal axis of each member is straight and matches the line that joins each end of the member. The axis of all of the members that end in the same node is cut at a single point; otherwise moments will appear in these members so that the node could be at static equilibrium.
- Whenever external loads are applied in the nodes, all the elements that comprise the structure are subjected to tensile and compressive forces, since there is no friction at the connections. This means that the self-weight of the elements is replaced with loads applied at their ends. According to [23] bending caused by direct wind loads on the structural elements can be omitted.
- The cross section of each member has a negligible area compared to its length.
- The self-weight of the elements is negligible, since the loads supported by the structural elements are usually large in comparison to their weights.
- In the case of members of the towers, their connections are bolted and thus they are not actually frictionless nodes. Additionally, some members, such as the truss chords, are continuous elements, which can evidently transmit moments from one side of a node to another [24].Thus, these nodes are assumed to be rigidly connected behaving as elastic embedment (or simply rigid joints), which cause local bending moments due to rotations that take place as a consequence of the global deformation of the structure. Such effect causes the so-called secondary bending moments and consequently a secondary stress state, which are juxtaposed to the primary stresses derived from axial forces.
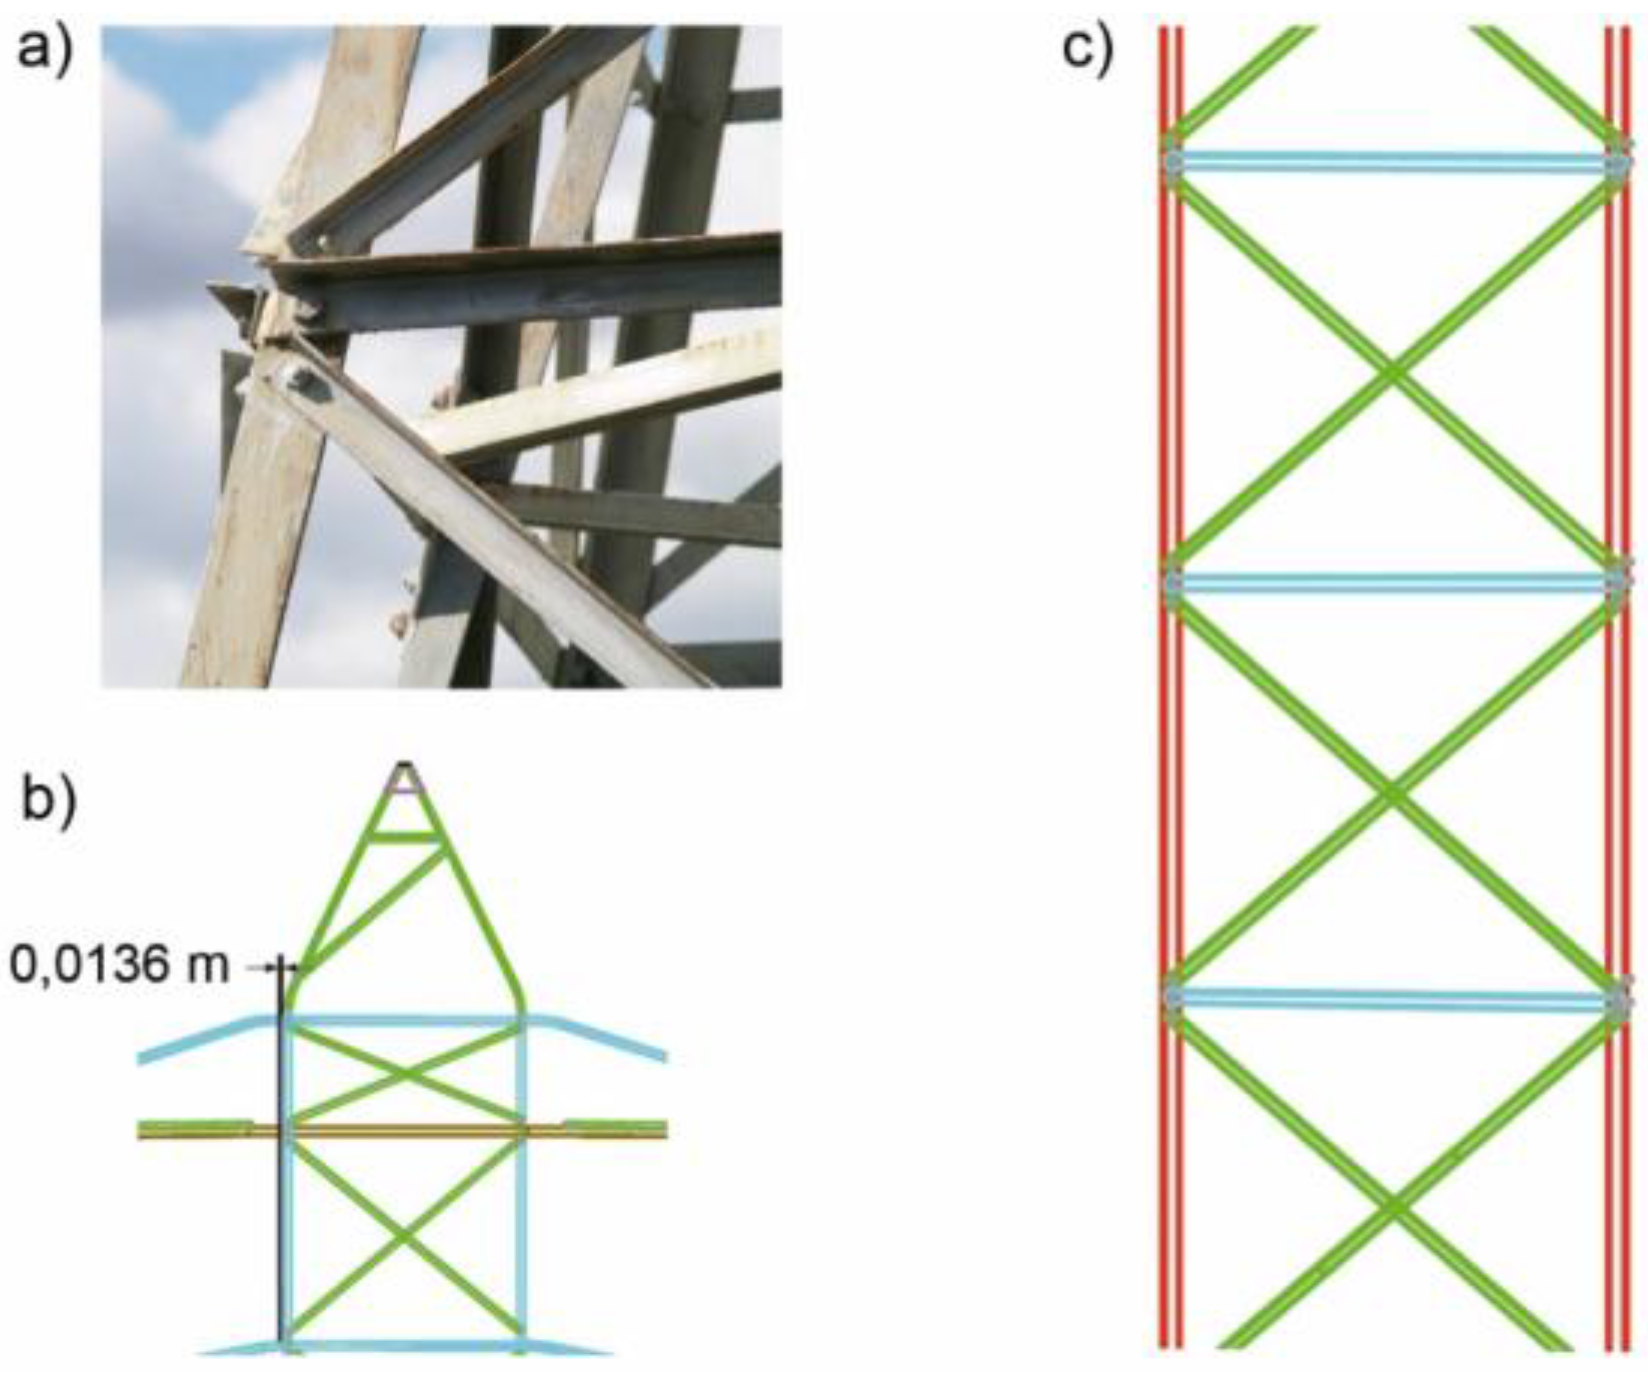
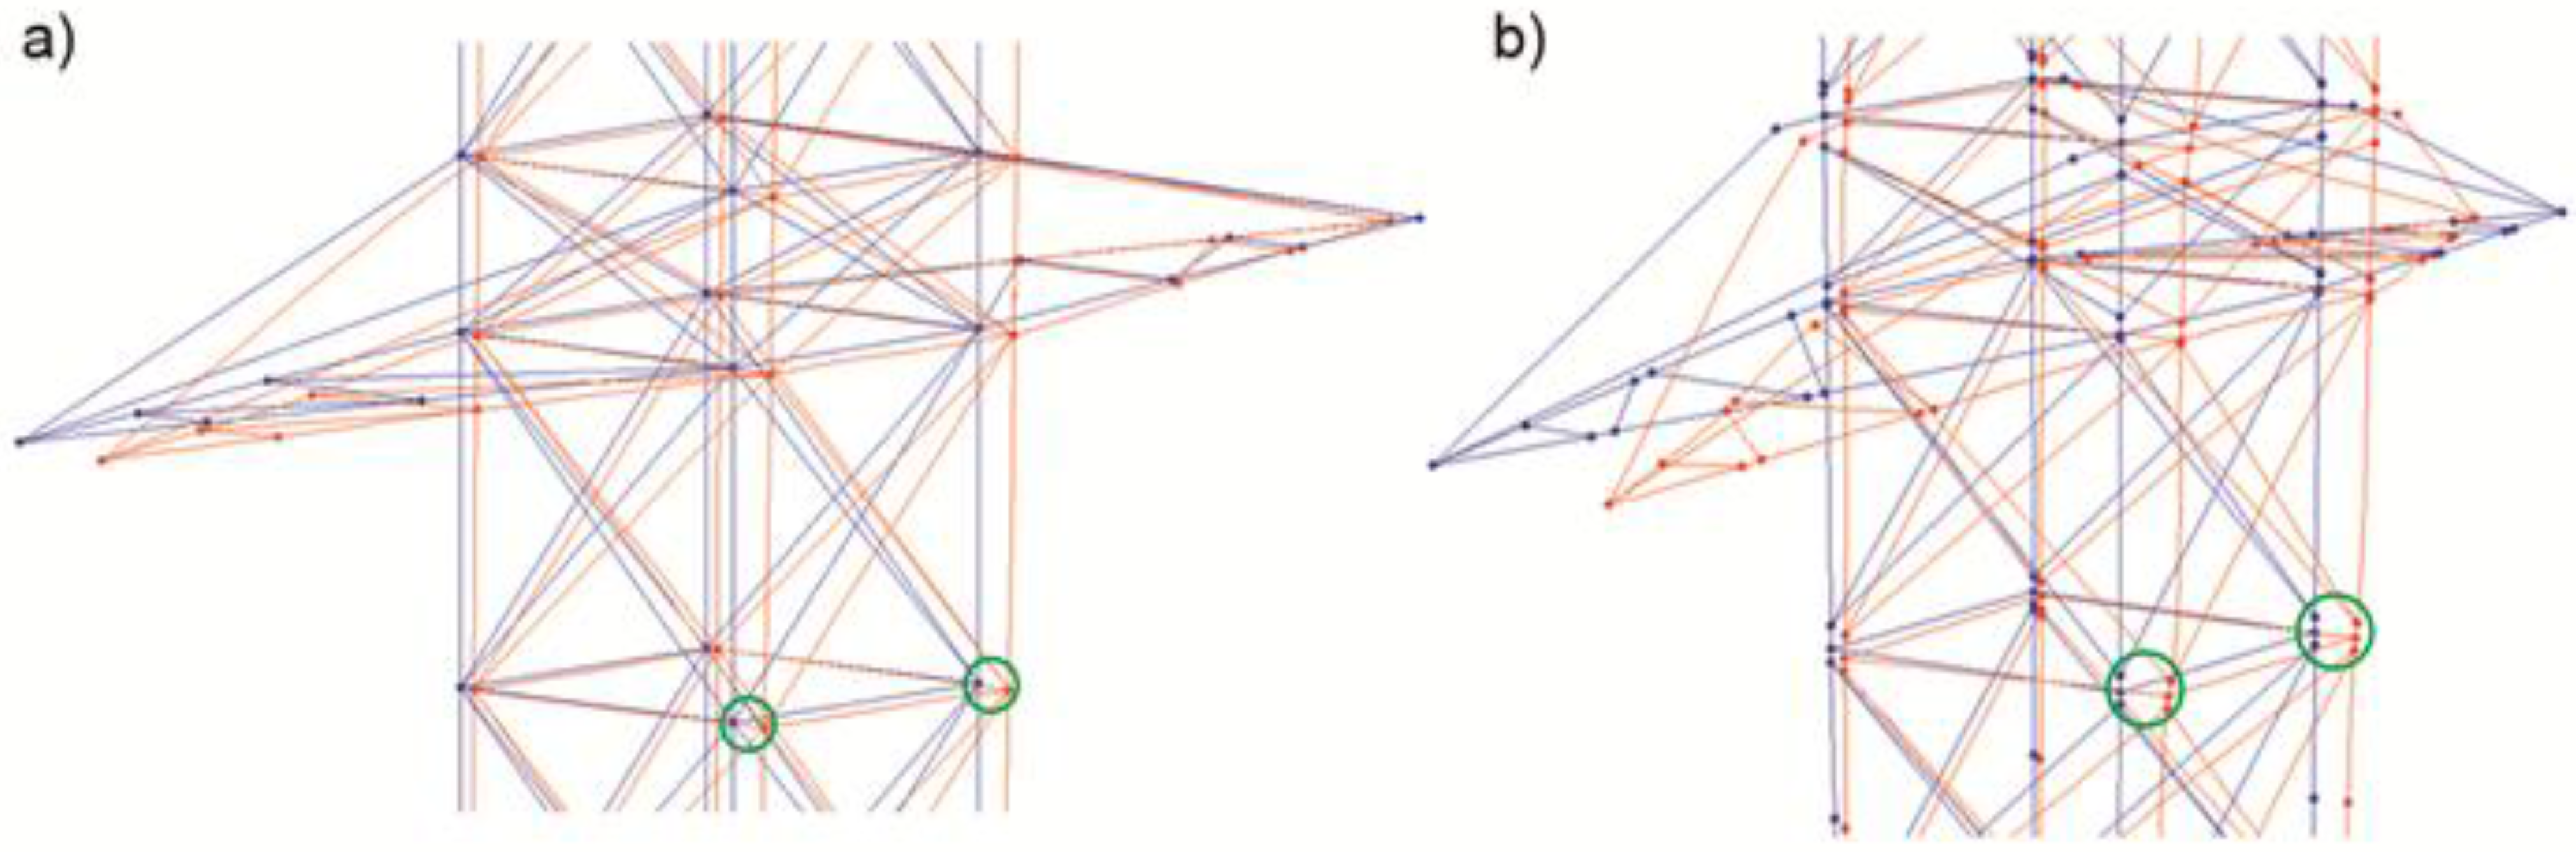
- Furthermore, truss members that end in the same node do not always cut it at the same point, leading again to an apparition of secondary bending moments. Such bending moments depend upon both proportion of the misaligned or eccentricity and stiffness of the elements.
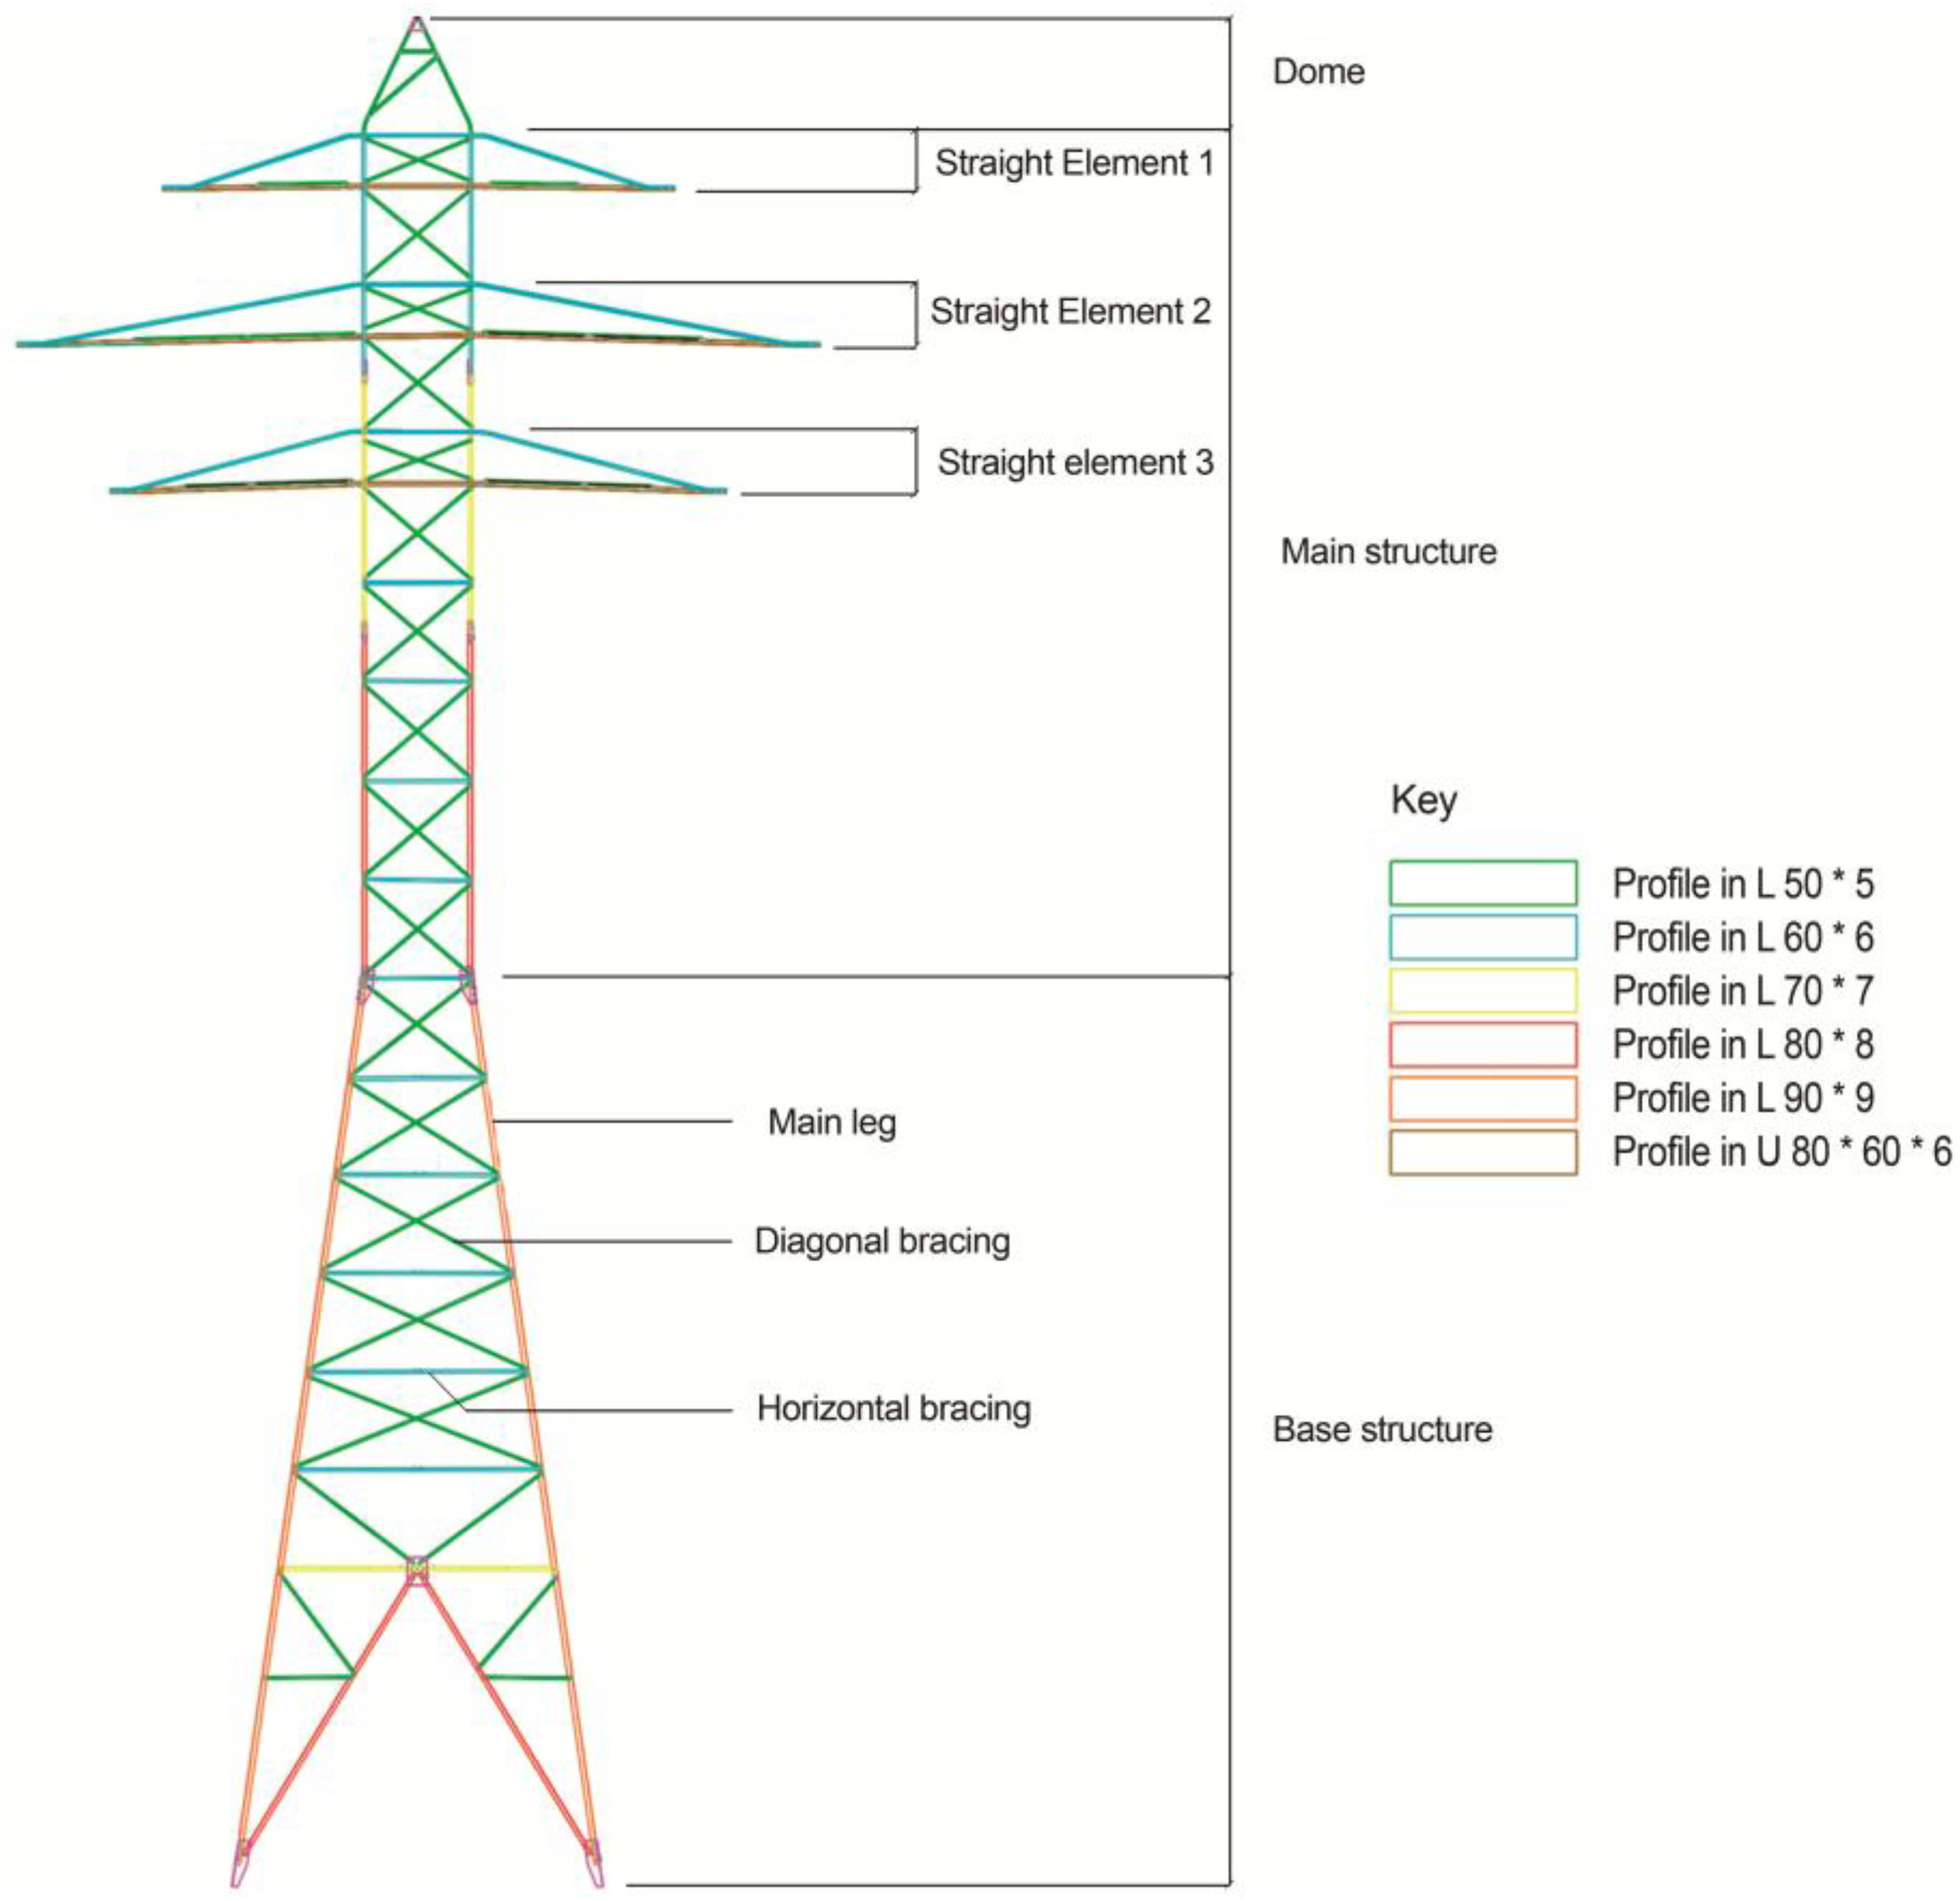
- Model with pinned joints and ideal geometry (Model 1). This model is supposed to be the one that was used for the design of the towers. A three-dimensional model with all members pin-jointed at nodes was developed that took into account all the previously-mentioned assumptions. Accordingly, the adoption of certain assumptions about the geometry provided by the laser scanner was needed in order to adapt the model to an ideal geometry. More specifically, it was assumed that all members concurring in one node were overlapping in a single common point since, in reality, these members were assembled more erratically. For this, the criterion used was to assume that the main vertical members of the tower and the horizontal members were fixed in their position, and the corrections changed the length and exact location of the diagonal braces that connect at each joint. Additionally, the geometry was simplified in certain areas of the horizontal sections of the towers, ignoring the bend and the inclination. Accordingly, vertical deviation of the main bodies of the towers was not taken into account. Finally, the obtained “as built” model measurements of certain modules that form the main body of the towers are simplified to theoretical values. For example, when certain lengths result in 1.99 m or 2.01 m, the value is simplified and considered to be 2 m. For clarity, Figure 2 presents a scheme with the principal structural parts of a transmission tower.
- Model with rigid joints and ideal geometry (Model 2). According to the data proportioned from the “as built” model, assumption 1 is not valid because certain elements, such as truss chords, are continuous elements. Therefore, a second model was elaborated which considers an ideal geometry but where truss chords and horizontal members of the towers are considered rigidly connected at both ends and all other structural components (truss elements) are treated as pin jointed. In this way, the originated secondary bending moments and, consequently, secondary stresses can be taken into account and their impact in comparison to modeling the tower with all ideal pinned joints quantified.
- Model with rigid joints and real geometry (Model 3). In contrast with the two previous models, this approach considers all of the real geometric singularities of the structure and includes them into the simulations; for example, it includes horizontal deviations of truss chords, the vertical deviation of the tower’s main body, as well as assumptions 1–3 obsolescence. To create such a structural model, first a 3D wire-model was produced using the “as-built” model as a dimensional foundation. Secondly, it was imported as a “dxf” file into the structure calculation software SAP2000 [19].

3. Methodology
3.1. Geometric Digitalization
3.2. Geometric Modeling
- Cleaning and segmentation of point clouds in order to remove undesired data, such as reflections, noise or sensor artifacts. This step was performed manually.
- Alignment of the point clouds from each scan under a common coordinate system. An automated registration method, iterative closest point (ICP) [25], was applied, supported by the identification of matching points and minimizing the Euclidean distance between corresponding point clouds. Initial approximations (three points) were manually identified by the user, trying to guarantee a good distribution around the area of interest and along the three main directions (X, Y, Z). A solid-rigid transformation based on the three points identified was executed. Afterwards, an automatic iterative process to align the different scans was performed taking the Euclidean distance as a minimization criterion.
- Generating cross-sections and technical drawings of the electrical towers, focusing on the steel profiles that make up each section of the tower and the arrangement of the connections used to define the linkage of these profiles. Different profiles were automatically generated along each main direction (X, Y, Z) in order to obtain vector information of the main sections of the towers and, thus, initial approximations to support the technical drawings and CAD model generation.
- Obtaining a computer aided design (CAD) model. Since the structural analysis based on a FEM model does not cope with dense laser models, an important step which allows us to pass from the 3D point clouds to a solid geometric model was performed. This step consists in extruding the sections obtained in the step before along its normal direction. Manual interaction is required in this step in order to solve the different intersections between profiles and their connections. In addition, specific existing libraries based on standard steel profiles (i.e. L-shaped and U channel profiles) were used for modeling the towers. Geometric modeling was done using Geomagic Spark, 2013 version.
3.3. Structural Analysis
- -
- High voltage power line with rated voltage of 132 kV and 50 Hz AC
- -
- Two duplex-circuit line with alignment support.
- -
- Span: 300 m between supports.
- -
- Electrical driver of aluminum galvanized steel, type LA-280.
- -
- Permanent loads: The self-weight of the steel profiles that comprise the towers, electrical conductors, fittings, insulators, and the grounding wire.
- -
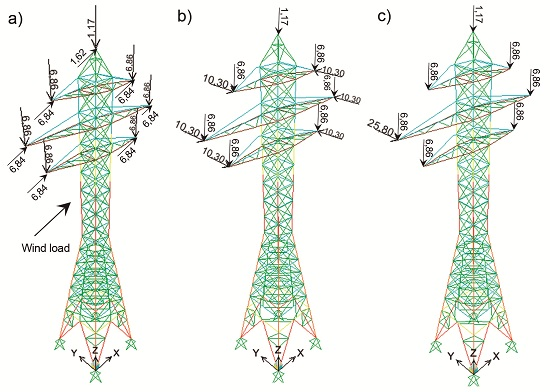
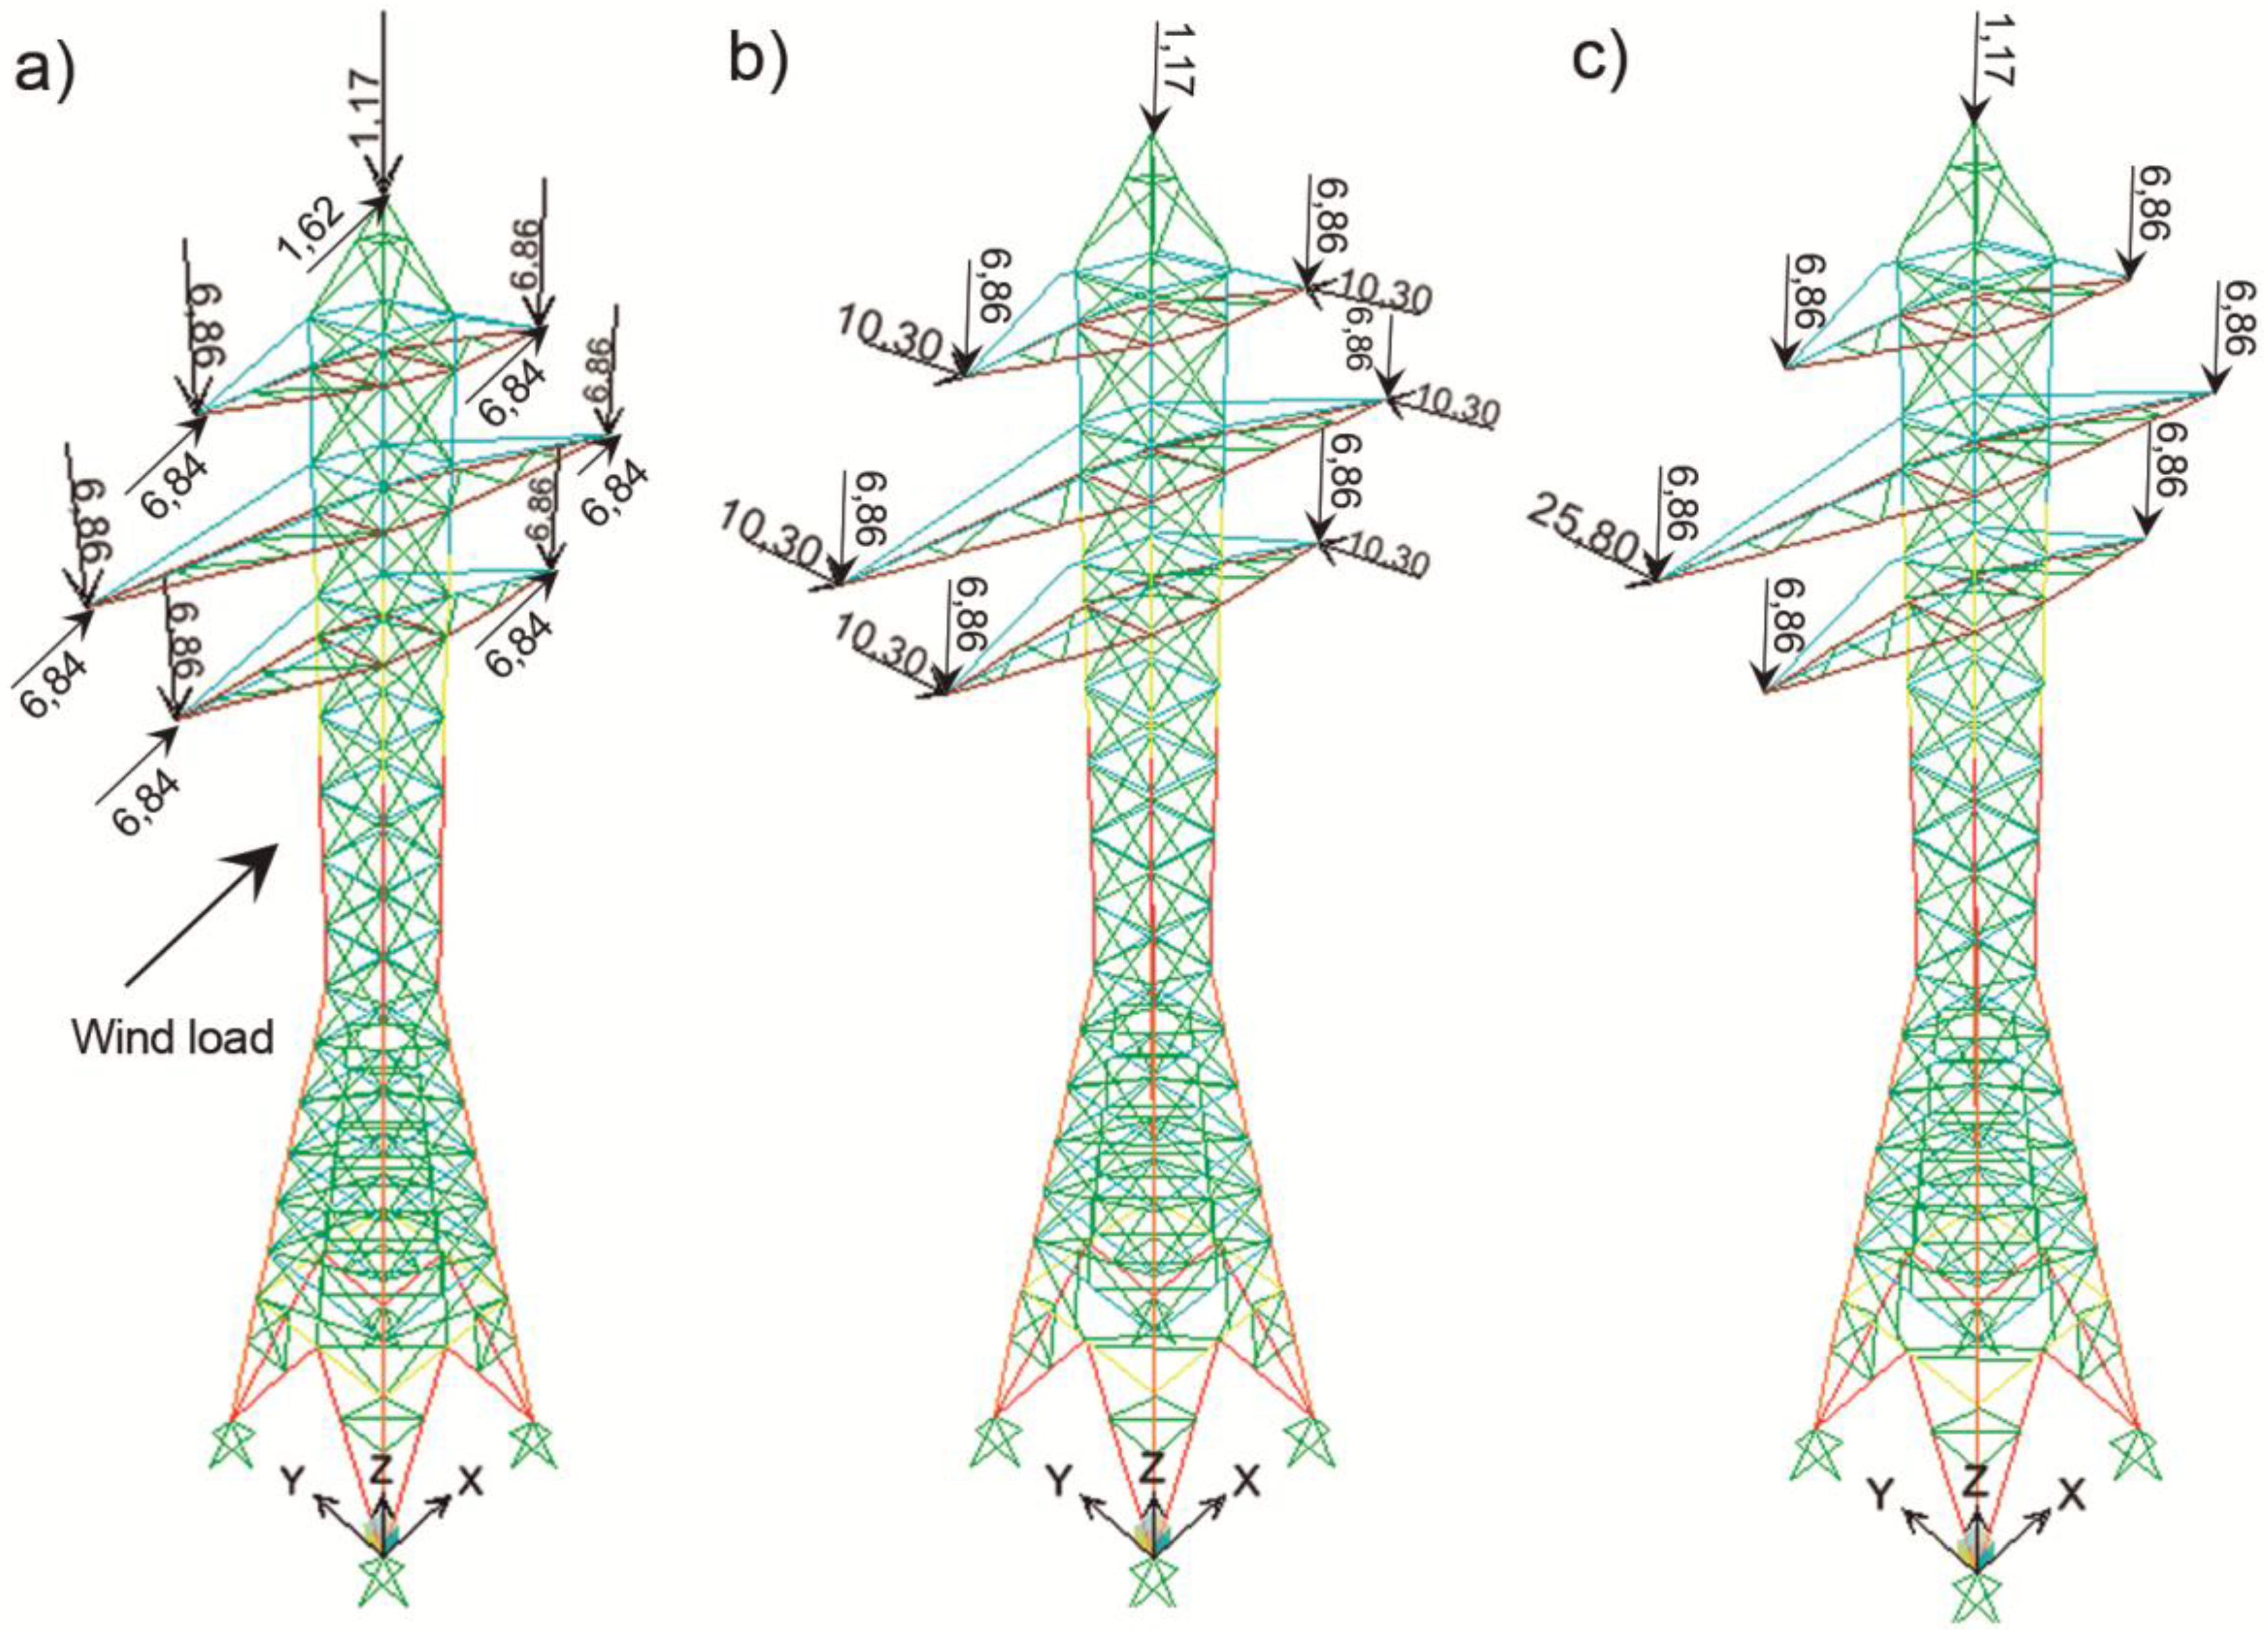
- Wind load: It acts upon steel members of the towers, the insulators, and the suspension insulator strings.
- -
- Imbalance of tensile forces: A longitudinal force equivalent to 25% of all unilateral tractions of electrical drivers and grounding wire. This tensile force will be applied at the point where the electrical conductors and the grounding wire are attached to the support, thus taking into account the torsion that these forces could create.
- -
- Electrical conductor failure: A unilateral tensile force related to a single electrical conductor or a grounding cable’s failure. The minimum admissible value for the failure is 50% of the broken cable’s tension in the power lines that have two conductors per phase.

| Tower Type | Force Direction | Hypothesis 1 | Hypothesis 2 | Hypothesis 3 |
|---|---|---|---|---|
| Alignment support and suspension insulator strings | Vertical | Permanent loads, considering the electrical conductors and the grounding cables to withstand wind load according to a 120 km/h wind speed | ||
| Transversal | Wind load (120 km/h) on electrical conductors, cables, grounding cables and supports of tower | Not applicable | Not applicable | |
| Longitudinal | Not applicable | Imbalance of tensile stress | Electrical conductor and grounding cable failure | |
4. Experimental Results and Discussion
4.1. Case Studies

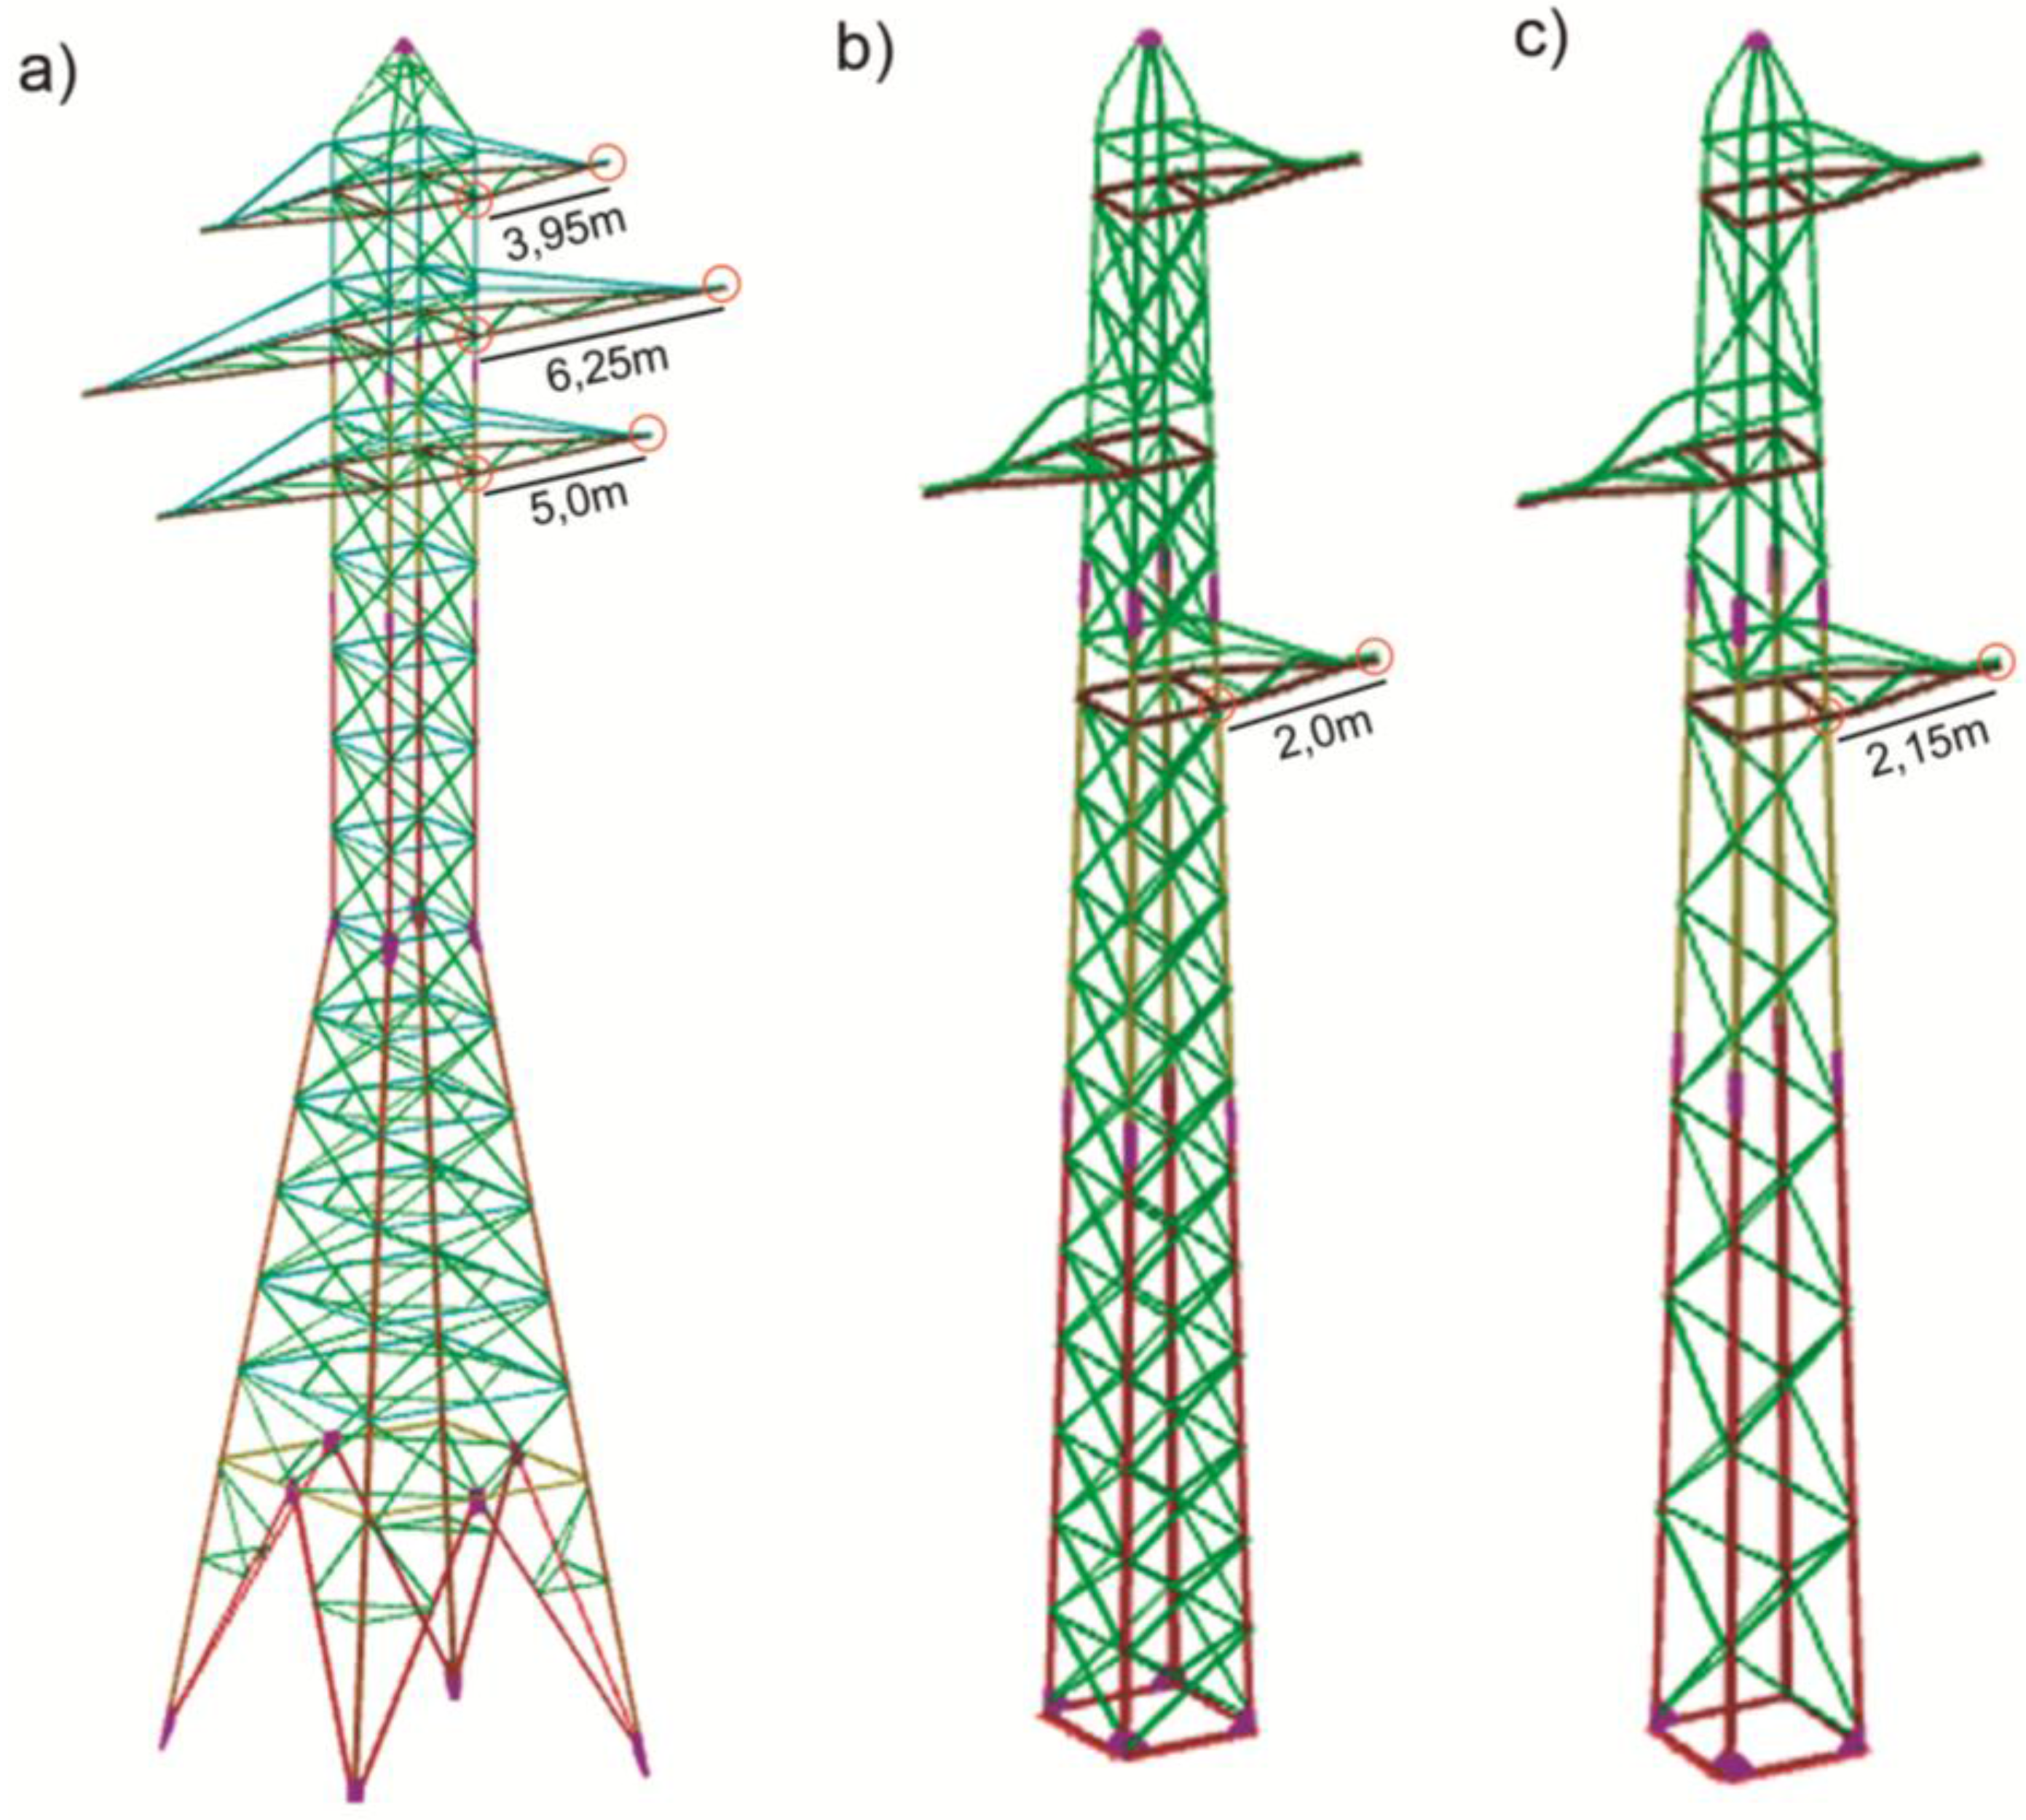
4.2. Geometric Modeling
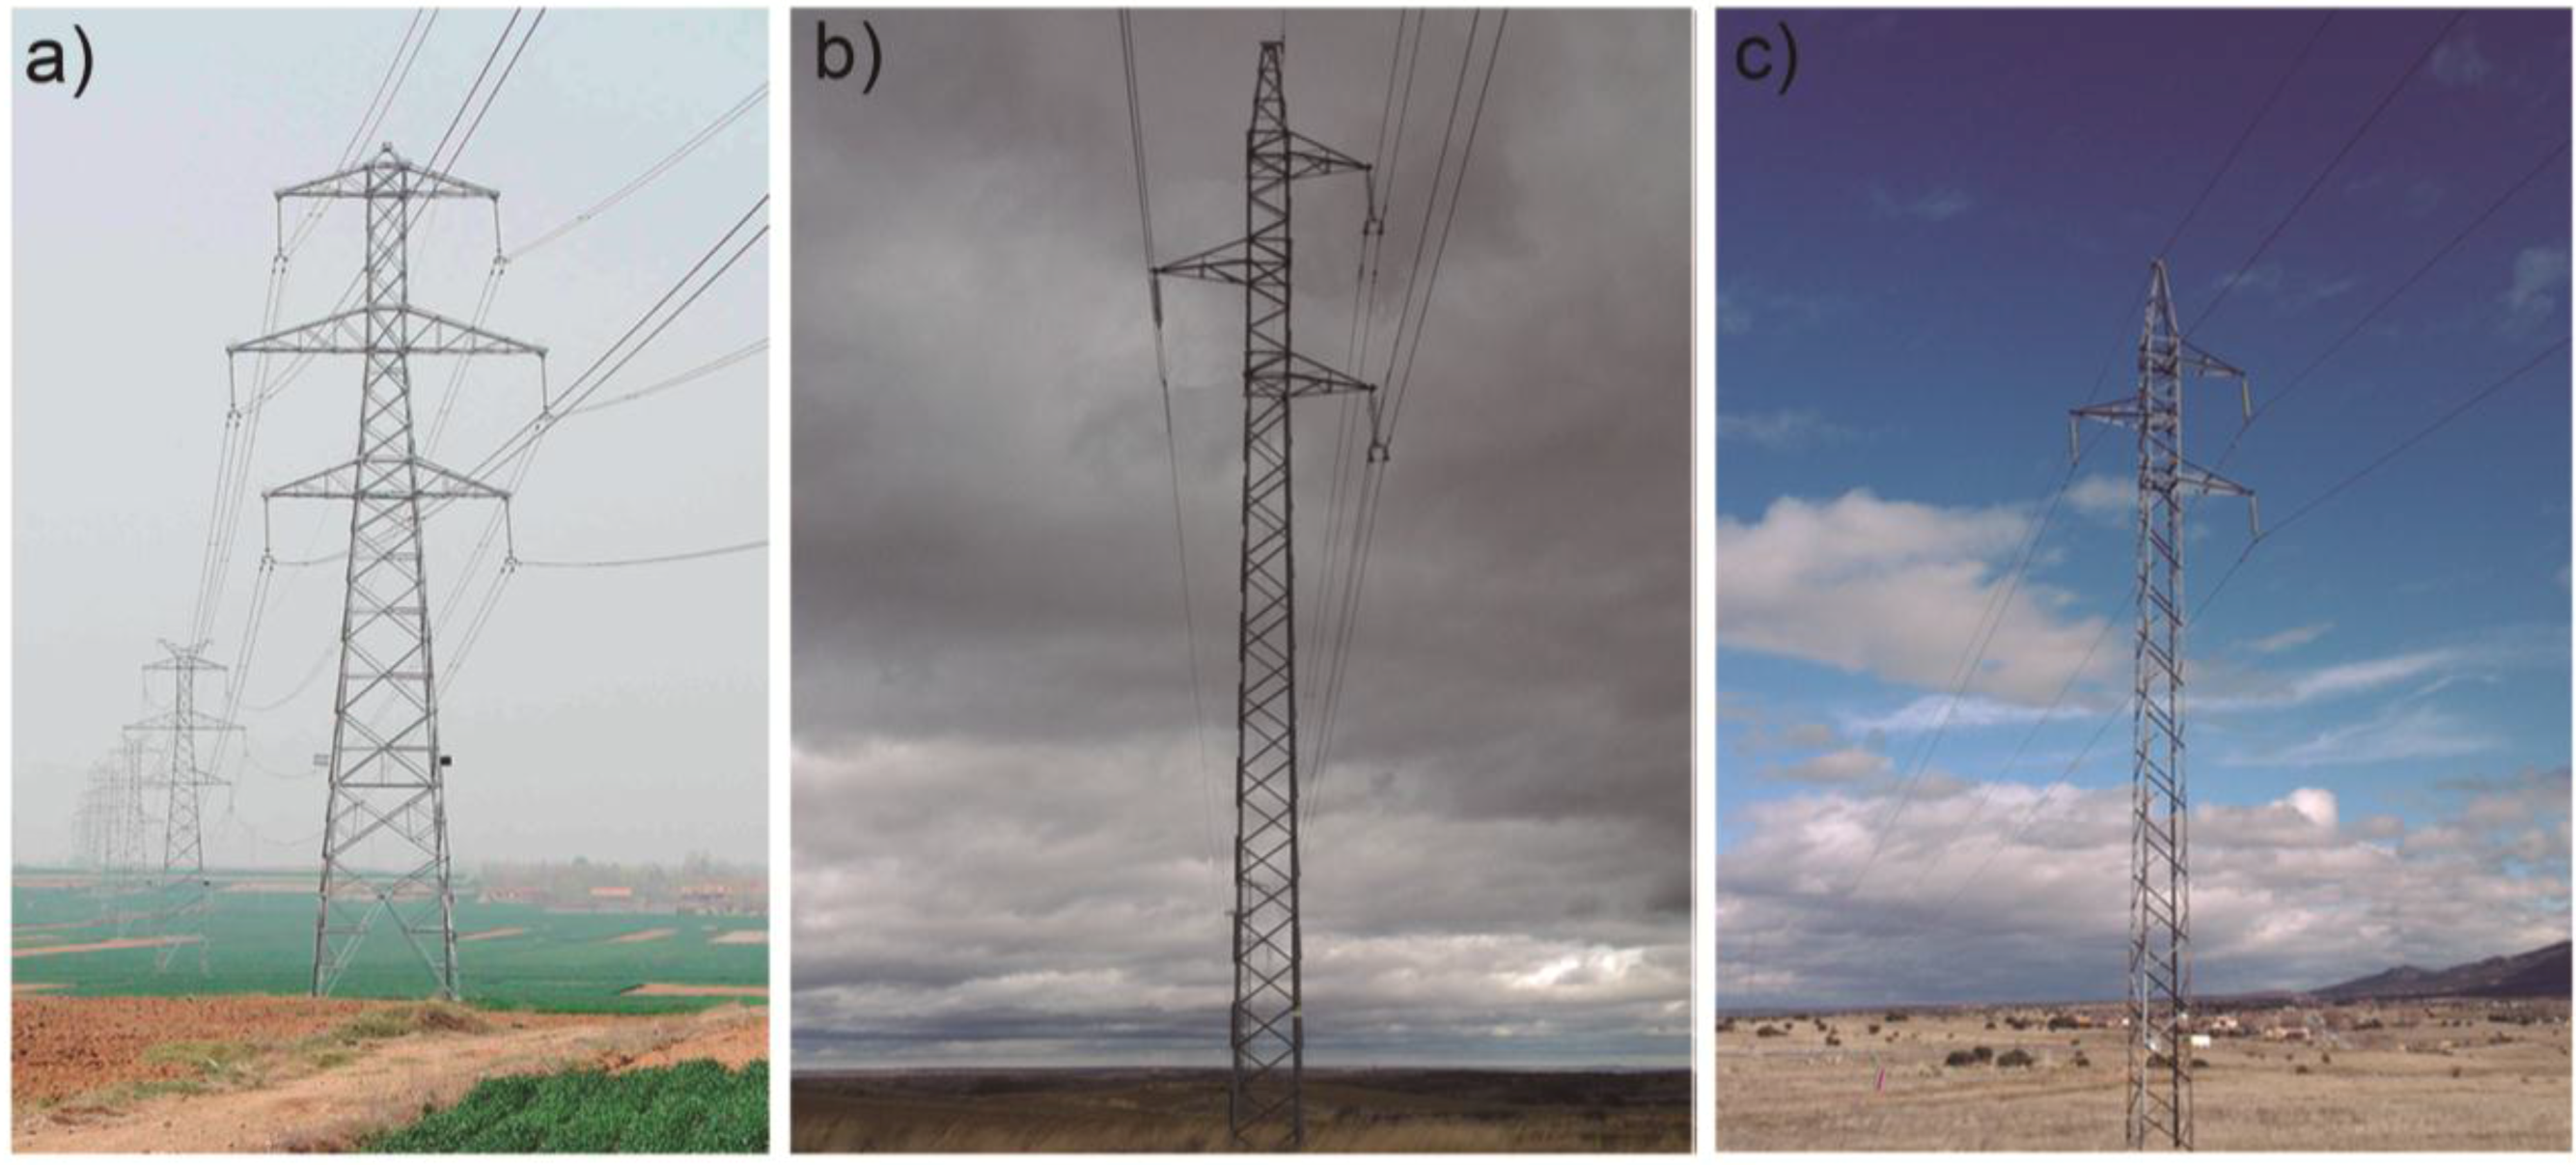
| Tower | Base Dimensions (m) | Height (m) | Length of Horizontal Body (m) |
|---|---|---|---|
| 1 | 7.25 × 7.25 | 37.25 | 3.95 6.25 5.0 |
| 2 | 1.5 × 1.5 | 18.50 | 2.0 |
| 3 | 1.5 × 1.5 | 18.50 | 2.15 |
4.3. Structural Analysis
| Tower | Model 1 | Model 2 | Model 3 | |||
|---|---|---|---|---|---|---|
| - | Frame Elements | Degrees of Freedom | Frame Elements | Degrees of Freedom | Frame Elements | Degrees of Freedom |
| 1 | 419 | 3320 | 419 | 3896 | 683 | 6772 |
| 2 | 241 | 1909 | 241 | 2348 | 321 | 3308 |
| 3 | 181 | 1448 | 181 | 2100 | 226 | 2408 |
4.3.1. Displacements
| Tower | Model | Displacement Ux (mm)/Node | Displacement Uy (mm)/Node | Displacement Uz (mm)/Node | ||||||
|---|---|---|---|---|---|---|---|---|---|---|
| H1 | H2 | H3 | H1 | H2 | H3 | H1 | H2 | H3 | ||
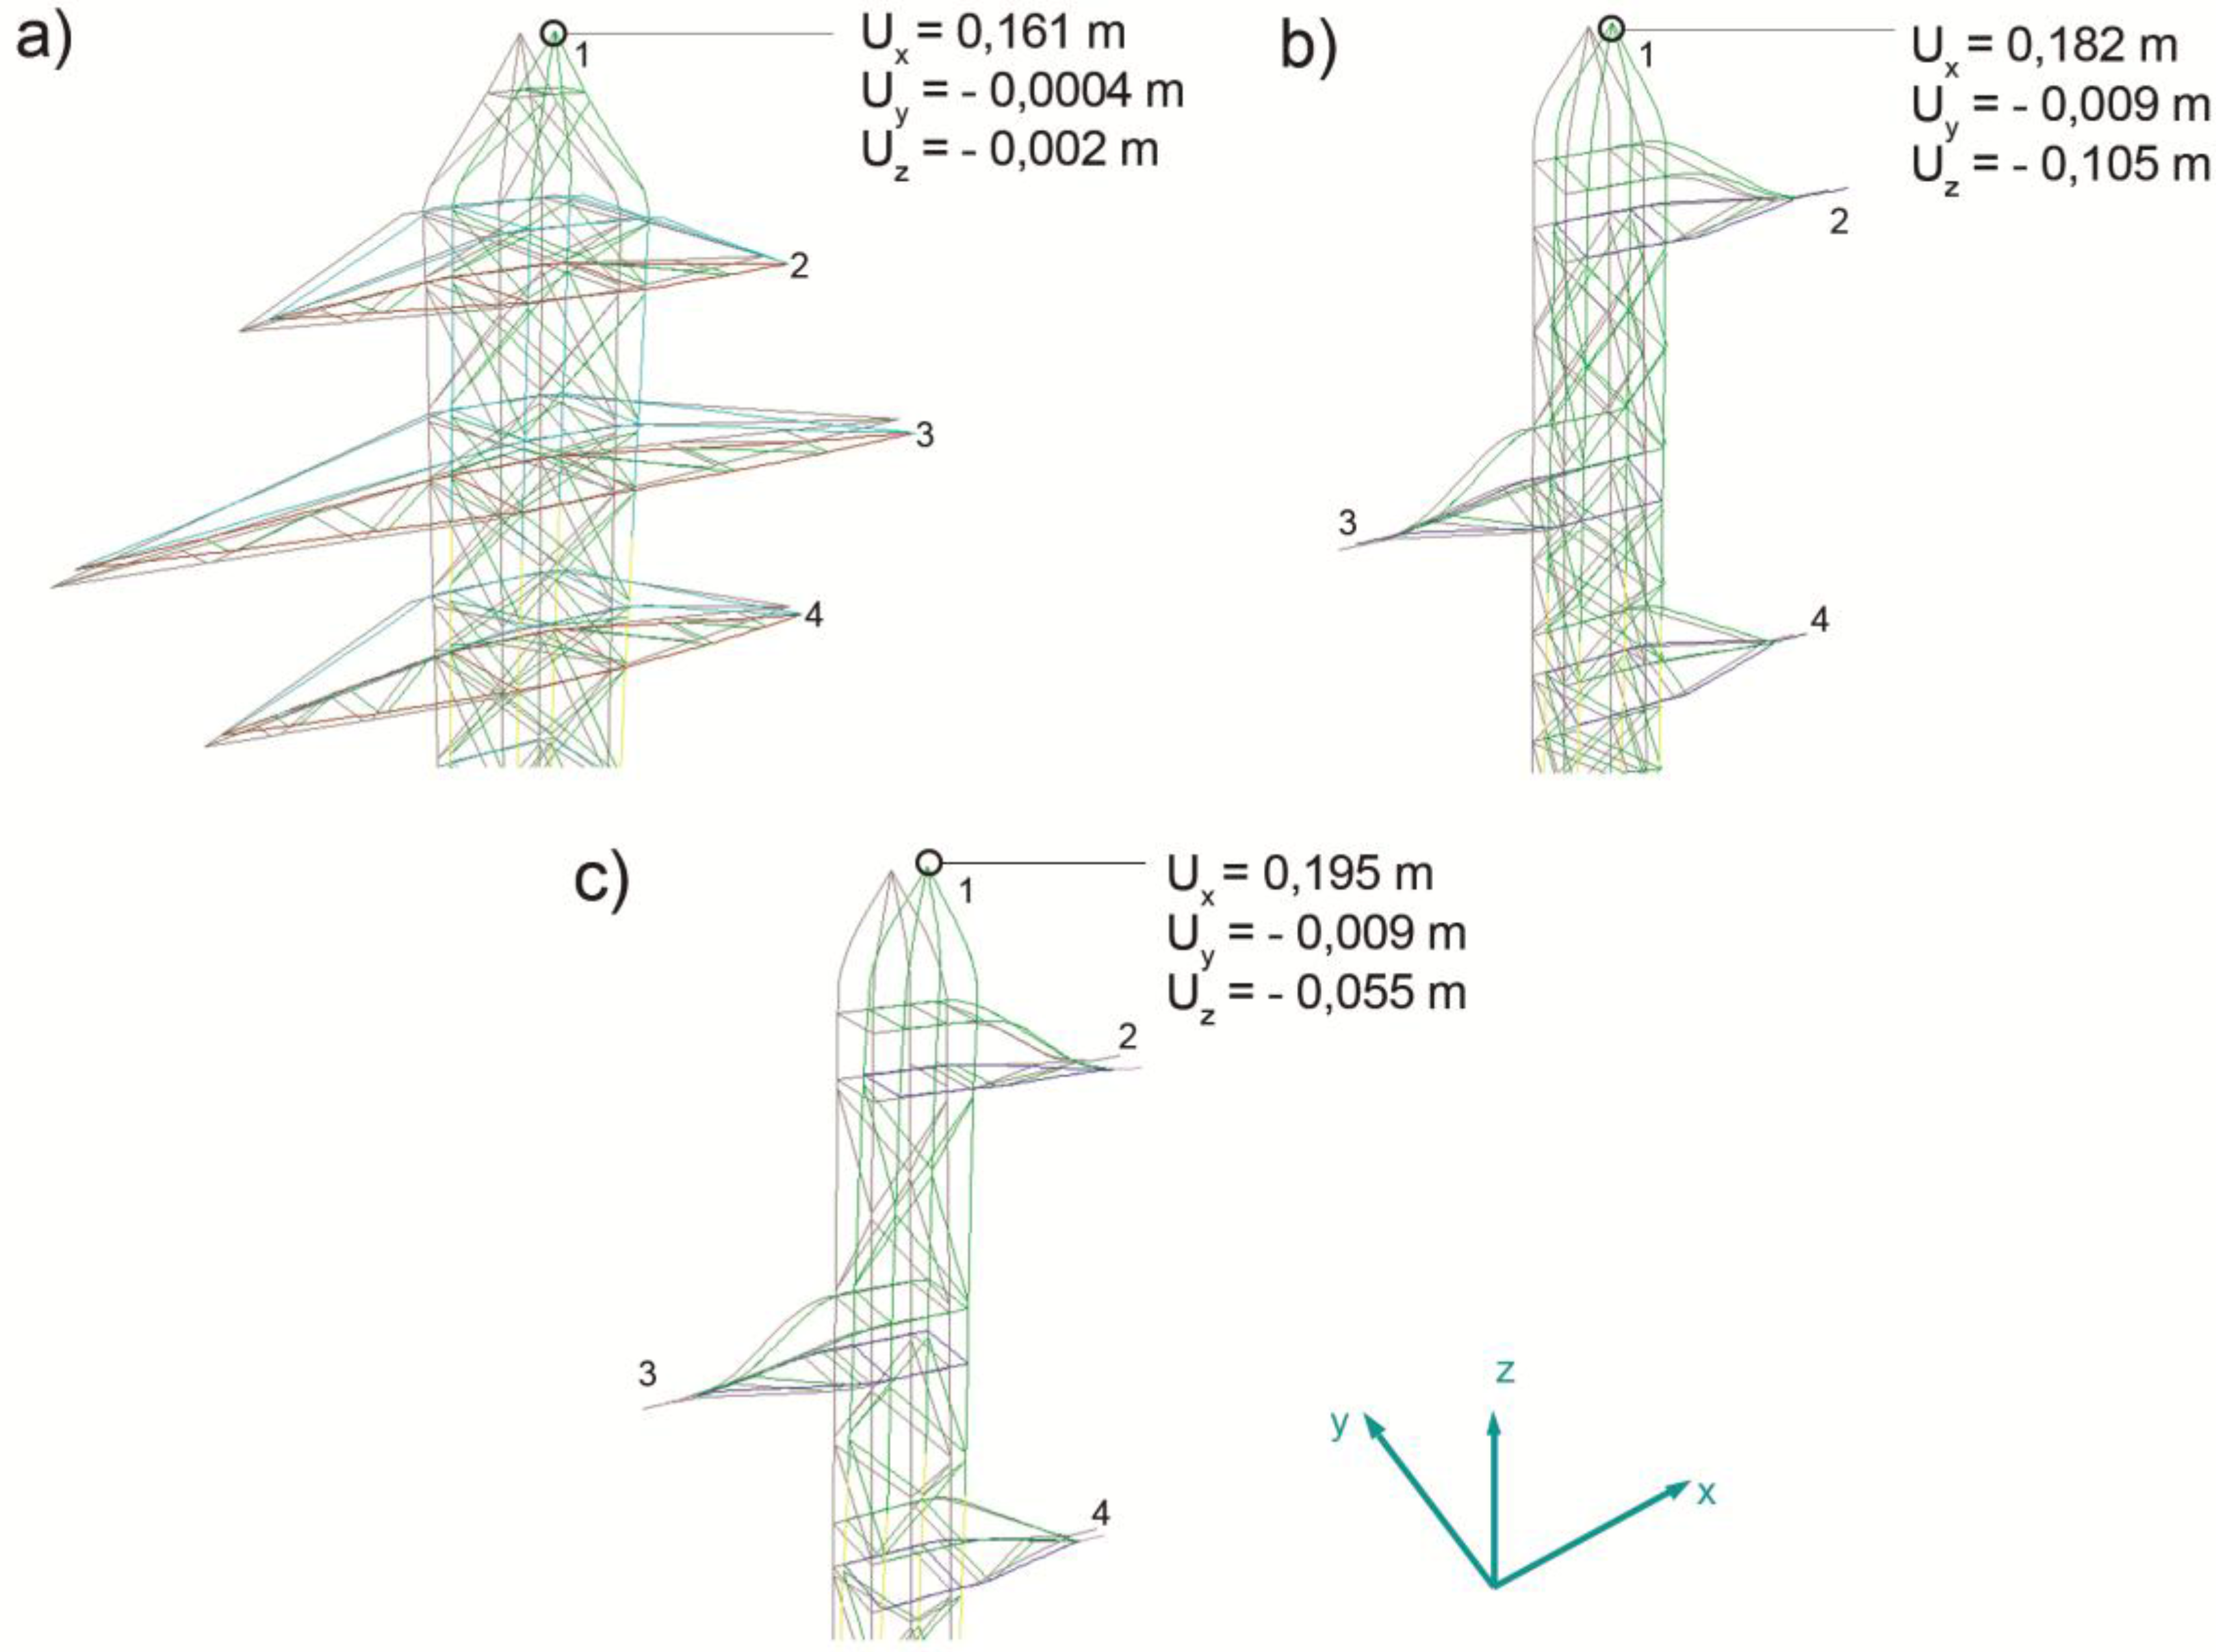
| 1 | M3 | 161/1 | 14/3 | 12/4 | 8/3 | 162/3 | 140/3 | 132/3 | 8/2 | 8/2 |
| 2 | M3 | 182/1 | 44/2 | 11/2 | 9/1 | 88/1 | 125/3 | 123/2 | 11/2 | 15/2 |
| 3 | M3 | 195/1 | 52/2 | 15/2 | 9/1 | 97/1 | 146/3 | 85/2 | 21/3 | 18/2 |
| Tower | Models Compared | Maximum Deviation Ux (mm)/Node | Maximum Deviation Uy (mm)/Node | Maximum Deviation Uz (mm)/Node | ||||||
|---|---|---|---|---|---|---|---|---|---|---|
| H1 | H2 | H3 | H1 | H2 | H3 | H1 | H2 | H3 | ||
| 1 | M3 front M1 | 93/1 | 6.3/3 | 4/4 | 5/3 | 52/3 | 62/3 | 27/3 | 4/2 | 4.6/2 |
| M3 front M2 | 95/1 | 6.3/3 | 4/4 | 5/3 | 65/3 | 78/3 | 29/3 | 4/2 | 5/2 | |
| 2 | M3 front M1 | 66/1 | 8.3/2 | 7/2 | 4/1 | 44/1 | 39/3 | 35/2 | 4/2 | 9/2 |
| M3 front M2 | 80/1 | 9/1 | 8/2 | 6/1 | 43/2 | 48/3 | 38/2 | 5/2 | 10/2 | |
| 3 | M3 front M1 | 75/1 | 9/2 | 6/2 | 7/1 | 38/1 | 37/3 | 38/2 | 3/3 | 5/2 |
| M3 front M2 | 65/3 | 7/1 | 7/2 | 4/2 | 32/2 | 42/3 | 43/3 | 5/3 | 6/3 | |
- Consideration of the initial small vertical deviations of the towers’ main bodies along with the application of wind forces in Hypothesis 1, precisely in that direction, may have accentuated the displacements in global X direction obtained in Model 3.
- The fact of considering the true connections of the profiles onto the nodes (misalignment) has a drastic consequence upon the behavior of the structure since it directly affects to its stiffness.

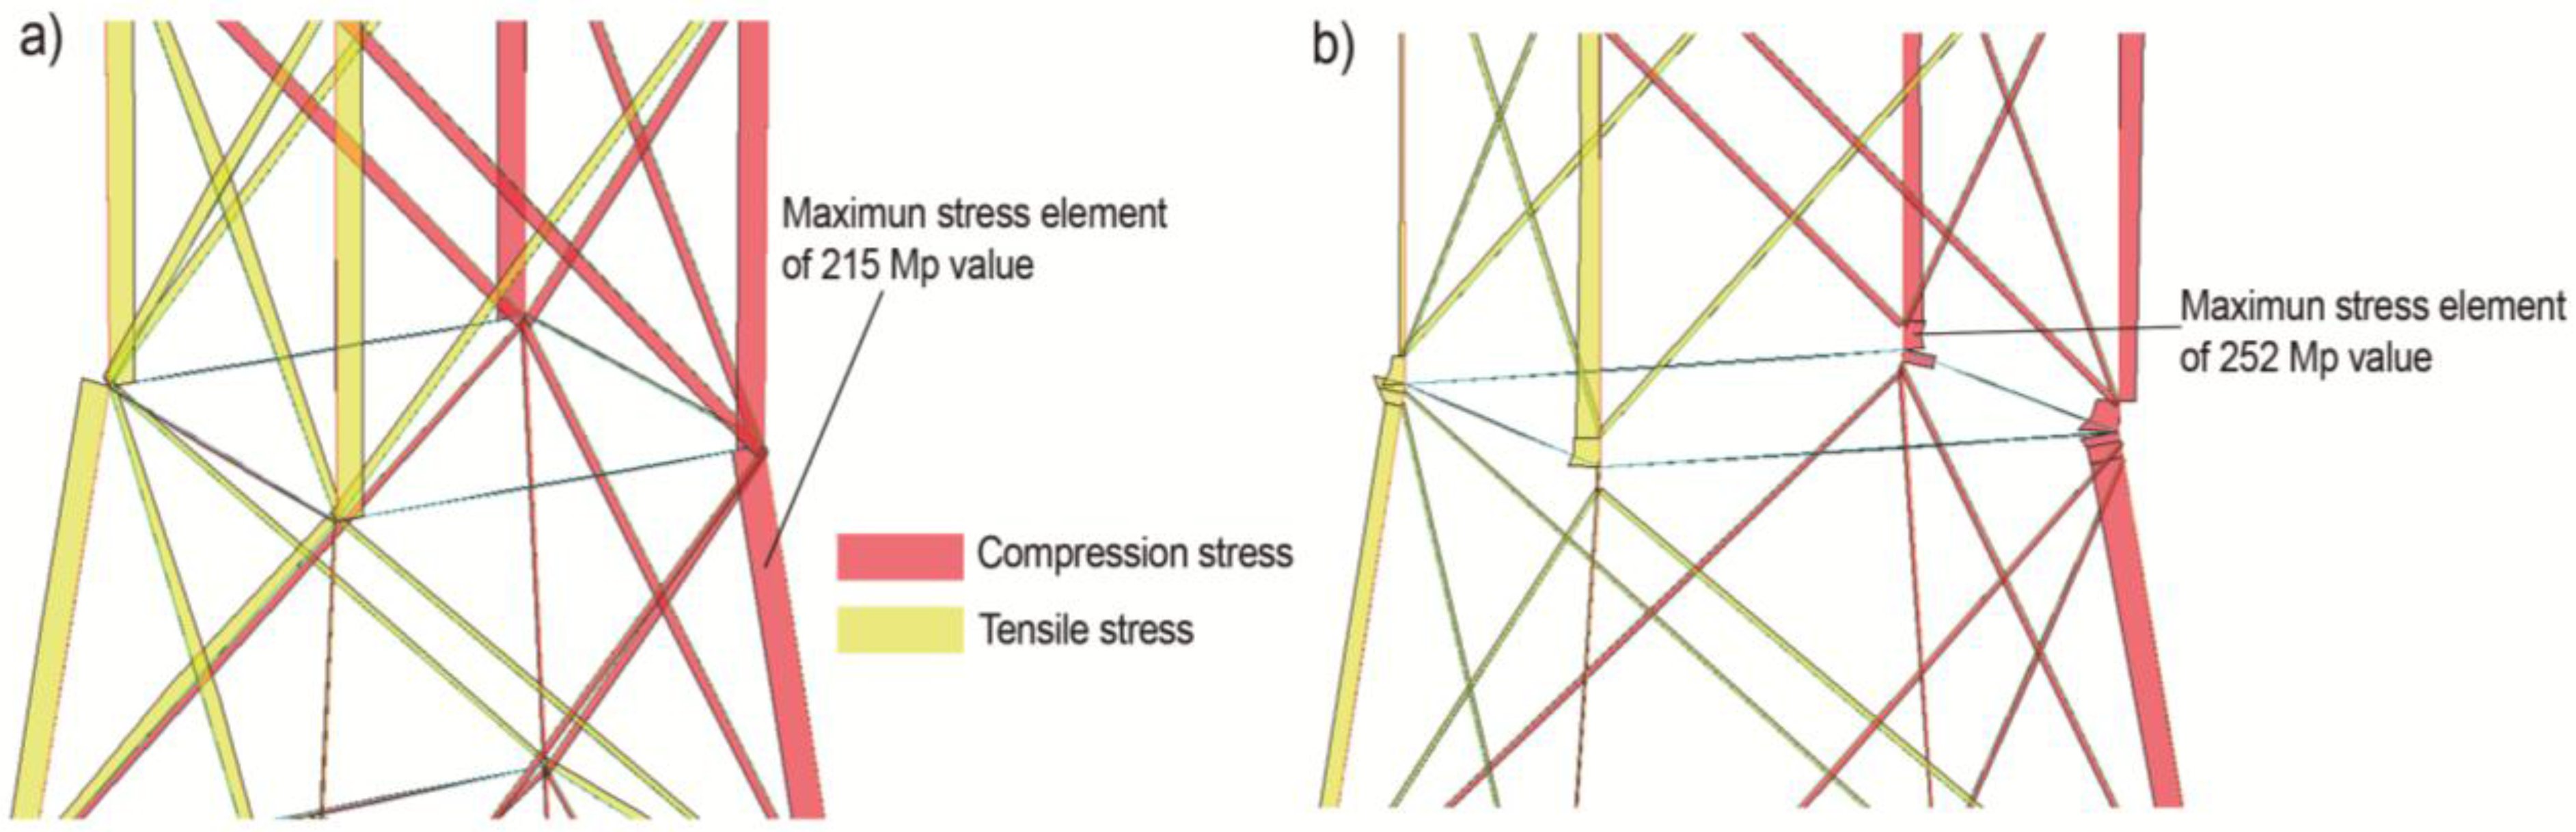
4.3.2. Stresses in Structural Elements
| Tower | Model | Maximum Stress (Mpa)/Frame Element | ||
|---|---|---|---|---|
| Hypothesis 1 | Hypothesis 2 | Hypothesis 3 | ||
| 1 | 1 | 215.15/90 | 165.26/401 | 195.56/468 |
| 2 | 225.36/90 | 170.23/401 | 205.21/468 | |
| 3 | 252.30/696 | 185.96/433 | 230.20/696 | |
| 2 | 1 | 218.96/380 | 155.50/442 | 221.32/405 |
| 2 | 222.56/380 | 163.89/442 | 232.45/405 | |
| 3 | 234.21/178 | 181.78/439 | 245.63/189 | |
| 3 | 1 | 222.25/272 | 167.25/353 | 221.45/107 |
| 2 | 232.63/272 | 175.63/353 | 226.12/107 | |
| 3 | 252.58/272 | 195.56/353 | 233.16/104 | |

5. Conclusions
Acknowledgments
Author Contributions
Conflicts of Interest
References
- Ghilani, C.D.; Wolf, P.R. Adjustment Computations: Spatial Data Analysis, 4th ed.; John Wiley & Sons: Hoboken, NJ, USA, 2006. [Google Scholar]
- Villarino, A.; Riveiro, B.; Gonzalez-Aguilera, D.; Sanchez-Aparicio, L. The integration of geotechnologies in the evaluation of a wine cellar structure through the Finite Element Method. Remote Sens. 2014, 6, 11107–11126. [Google Scholar] [CrossRef]
- Costanzo, A.; Minasi, M.; Casula, G.; Musacchio, M.; Buongiorno, M.F. Combined use of terrestrial laser scanning and IR thermography applied to a historical building. Sensors 2014, 15, 194–213. [Google Scholar] [CrossRef] [PubMed] [Green Version]
- Fregonese, L.; Barbieri, G.; Biolzi, L.; Bocciarelli, M.; Frigeri, A.; Taffurelli, L. Surveying and monitoring for vulnerability assessment of an ancient building. Sensors 2013, 13, 9747–9773. [Google Scholar] [CrossRef] [PubMed]
- Choi, S.W.; Kim, B.R.; Lee, H.M.; Kim, Y.; Park, H.S. A deformed shape monitoring model for building structures based on a 2D laser scanner. Sensors 2013, 13, 6746–6758. [Google Scholar] [CrossRef] [PubMed]
- Ioannidis, C.; Valani, A.; Georgopoulos, A.; Tsiligiris, E. 3D model generation for deformation analysis using laser scanning data of a Cooling Tower. In Proceedings of the 3rd IAG/12th FIG Symposium, Baden, Switzerland, 22–24 May 2006.
- González-Aguilera, D.; del Pozo, S.; Lopez, G.; Rodriguez-Gonzálvez, P. From point cloud to CAD models: Laser and optics geotechnology for the design of electrical substations. Opt. Laser Technol. 2012, 44, 1384–1392. [Google Scholar] [CrossRef]
- Shu, Q.; Yuan, G.; Zhang, Y.; Guo, G. Research on anti-foundation-displacement performance and reliability assessment of 500 KV transmission tower in mining subsidence area. Open Civ. Eng. J. 2011, 5, 87–92. [Google Scholar] [CrossRef]
- Yang, F.; Yang, J.; Han, J.; Zhang, Z. Study on the limited values of foundation deformation for a typical UHV transmission tower. IEEE Trans. Power Deliv. 2010, 2, 2752–2758. [Google Scholar] [CrossRef]
- Yuan, G.L.; Li, S.M.; Xu, G.A.; Si, W.; Zhang, Y.F.; Shu, Q.J. The anti-deformation performance of composite foundation of transmission tower in mining subsidence area. Proc. Earth Plan. Sci. 2009, 1, 571–576. [Google Scholar] [CrossRef]
- Shu, Q.J.; Yuan, G.L.; Guo, G.L.; Zhang, Y.F. Limits to foundation displacement of an extra high voltage transmission tower in a mining subsidence area. Int. J. Min. Sci. Technol. 2012, 22, 13–18. [Google Scholar] [CrossRef]
- Yang, F.; Li, Q.; Yang, J.; Zhu, B. Assessment on the stress state and the maintenance schemes of the transmission tower above goaf of coal mine. Eng. Fail. Anal. 2013, 31, 236–247. [Google Scholar] [CrossRef]
- Prasad Rao, N.; Kalyanaraman, V. Non-linear behaviour of lattice panel of angle towers. J. Constr. Steel Res. 2001, 57, 1337–1357. [Google Scholar] [CrossRef]
- Da Silva, J.G.S.; da S. Vellasco, P.C.G.; de Andrade, S.A.L.; de Oliveira, M.I.R. Structural assessment of current steel design models for transmission and telecommunication towers. J. Constr. Steel Res. 2005, 61, 1108–1134. [Google Scholar] [CrossRef]
- Prasad Rao, N.; Samuel Knight, G.M.; Mohan, S.J.; Lakshmanan, N. Studies on failure of transmission line towers in testing. Eng. Struct. 2012, 35, 55–70. [Google Scholar] [CrossRef]
- Klinger, C.; Mehdianpour, M.; Klingbeil, D.; Bettge, D.; Häcker, R.; Baer, W. Failure analysis on collapsed towers of overhead electrical lines in the region Münsterland (Germany) 2005. Eng. Fail. Anal. 2011, 18, 1873–1883. [Google Scholar] [CrossRef]
- Zhuge, Y.; Mills, J.E.; Ma, X. Modelling of steel lattice tower angle legs reinforced for increased load capacity. Eng. Struct. 2012, 43, 160–168. [Google Scholar] [CrossRef]
- Órgano MINISTERIO DE INDUSTRIA, TURISMO Y COMERCIO. Real Decreto 223/2008 Reglamento sobre Condiciones Técnicas y Garantías de Seguridad en Líneas Eléctricas de Alta Tensión y sus Instrucciones Técnicas Complementarias ITC-LAT 01 A 09, 1st ed.; Boletín Oficial del Estado: Madrid, Spain, 2008. [Google Scholar]
- Wilson, E. Integrated Finite Element Analysis and Design of Structures, 7th ed.; Computers and Structures, Inc: Berkeley, CA, USA, 1998. [Google Scholar]
- Eurocode 3: Design of steel structures—Part 1-1: General Rules and Rules for Buildings EN 1993-1-1: 2005. Available online: https://law.resource.org/pub/eur/ibr/en.1993.1.1.2005.pdf (accessed on 4 July 2015).
- Beer, F.; Johnston, E.R., Jr.; Mazurek, D. Vector Mechanics for Engineers: Statics, 10th ed.; McGraw-Hill Science: London, UK, 2012. [Google Scholar]
- Hibbeler, R.C. Mecánica Vectorial Para Ingenieros: Estática, 10th ed.; Pearson Educación: Mexico D.F., México, 2004. [Google Scholar]
- Eurocode 1: Actions on structures Part 1-1: General Actions—Densities, Self-Weight, Imposed loads for buildings. UNE-EN 1991-1-1: 2003. Available online: http://infostore.saiglobal.com/emea/details.aspx?ProductID=400059 (accessed on 4 July 2015).
- Argüelles, R.; Arriaga, F.; Atienza, J.R.; Martinez, J.J. Estructuras de Acero II: Uniones y Sistemas Estructurales, 1st ed.; Bellisco: Madrid, Spain, 2001. [Google Scholar]
- Besl, P.; McKay, N. A method for registration of 3D shapes. IEEE Pattern Anal. Machine Intell. 1992, 14, 239–256. [Google Scholar] [CrossRef]
- Eurocode 0—Basis of Structural Design UNE-EN 1990: 2003. Available online: http://infostore.saiglobal.com/store/details.aspx?ProductID=400051 (accessed on 4 July 2015).
- Laefer, D.F.; Truong-Hong, L.; Fitztgerald, M. Processing of terrestrial laser scanning point cloud data for computational modelling of building facades. Recent Pat. Comput. Sci. 2011, 44, 16–29. [Google Scholar]
- Liu, Y.C.; Liu, Z.D. Study on stabilization and rectification technology for inclined transmission tower. Rock Soil Mech. 2008, 29, 173–176. [Google Scholar]
- Villarino, A.; Riveiro, B.; Martínez-Sánchez, J.; Gonzalez-Aguilera, D. Successful applications of geotechnologies for the evaluation of road infrastructures. Remote Sens. 2014, 6, 7800–7818. [Google Scholar] [CrossRef]
© 2015 by the authors; licensee MDPI, Basel, Switzerland. This article is an open access article distributed under the terms and conditions of the Creative Commons Attribution license (http://creativecommons.org/licenses/by/4.0/).
Share and Cite
Conde, B.; Villarino, A.; Cabaleiro, M.; Gonzalez-Aguilera, D. Geometrical Issues on the Structural Analysis of Transmission Electricity Towers Thanks to Laser Scanning Technology and Finite Element Method. Remote Sens. 2015, 7, 11551-11569. https://doi.org/10.3390/rs70911551
Conde B, Villarino A, Cabaleiro M, Gonzalez-Aguilera D. Geometrical Issues on the Structural Analysis of Transmission Electricity Towers Thanks to Laser Scanning Technology and Finite Element Method. Remote Sensing. 2015; 7(9):11551-11569. https://doi.org/10.3390/rs70911551
Chicago/Turabian StyleConde, Borja, Alberto Villarino, Manuel Cabaleiro, and Diego Gonzalez-Aguilera. 2015. "Geometrical Issues on the Structural Analysis of Transmission Electricity Towers Thanks to Laser Scanning Technology and Finite Element Method" Remote Sensing 7, no. 9: 11551-11569. https://doi.org/10.3390/rs70911551