
Evaluation of Water Use Efficiency Derived from MODIS Products against Eddy Variance Measurements in China


Abstract
:
1. Introduction
2. Data and Methods
2.1. Study Sites

| Sites | Location and Altitude | Mean Annual Temperature (°C) | Mean Annual Precipitation (mm) | Soil Type | Predominant Species |
|---|---|---|---|---|---|
| CBS | 42.40°N, 128.10°E; 738 m | 3.6 | 713 | Upland dark brown forest soil | Pinus koraiensis, Tilia amurensis, Quercus mongolica and Fraxinus mandshurica |
| QYZ | 26.73°N, 115.05°E; 102 m | 17.9 | 1542 | Typical red earth | Pinus elliottii Engelm, Pinus massoniana Lamb and Cunninghamia lanceolate Hook |
| DHS | 23.15°N, 112.50°E; 300 m | 20.9 | 1956 | Lateritic red-earth, yellow-earth and mountain shrubby-meadow soil | Schima superba, Castanopsis chinensis, Pinus massoniana |
| XSBN | 21.90°N, 101.27°E; 756 m | 21.8 | 1493 | Lateritic and red lateratic soil | Pometia tomentosa, Terminalia myriocarpa |
| NM | 44.13°N, 116.30°E; 1189 m | 0.4 | 350.9 | Chernozem soil | Leymus chinensis, Stipagrandis, Koeleria cristata, Agropyron cristatum |
| HBGC | 37.67°, 101.33°E; 3327m | −1.7 | 580 | Alpine meadow soil, alpine scrubby meadow soil and swamp soil | Potentilla fruticosa L., Stipaaliena, Kobresia capillifolia, Kobresia humilis |
| DX | 30°51′N, 91.07°E; 4333 m | −10.4 | 476. 8 | Meadow soil with sandy loam | Blysmus sinocompressus, K. microglochin, K. littledalei K. parva K. humilis and Stipa purpurea |
| YC | 36.96°N, 116.64°E; 28 m | 13.1 | 610 | Alluvial deposit of the Yellow River | Winter wheat and summer maize |
2.2. Flux Data
2.3. MODIS Data
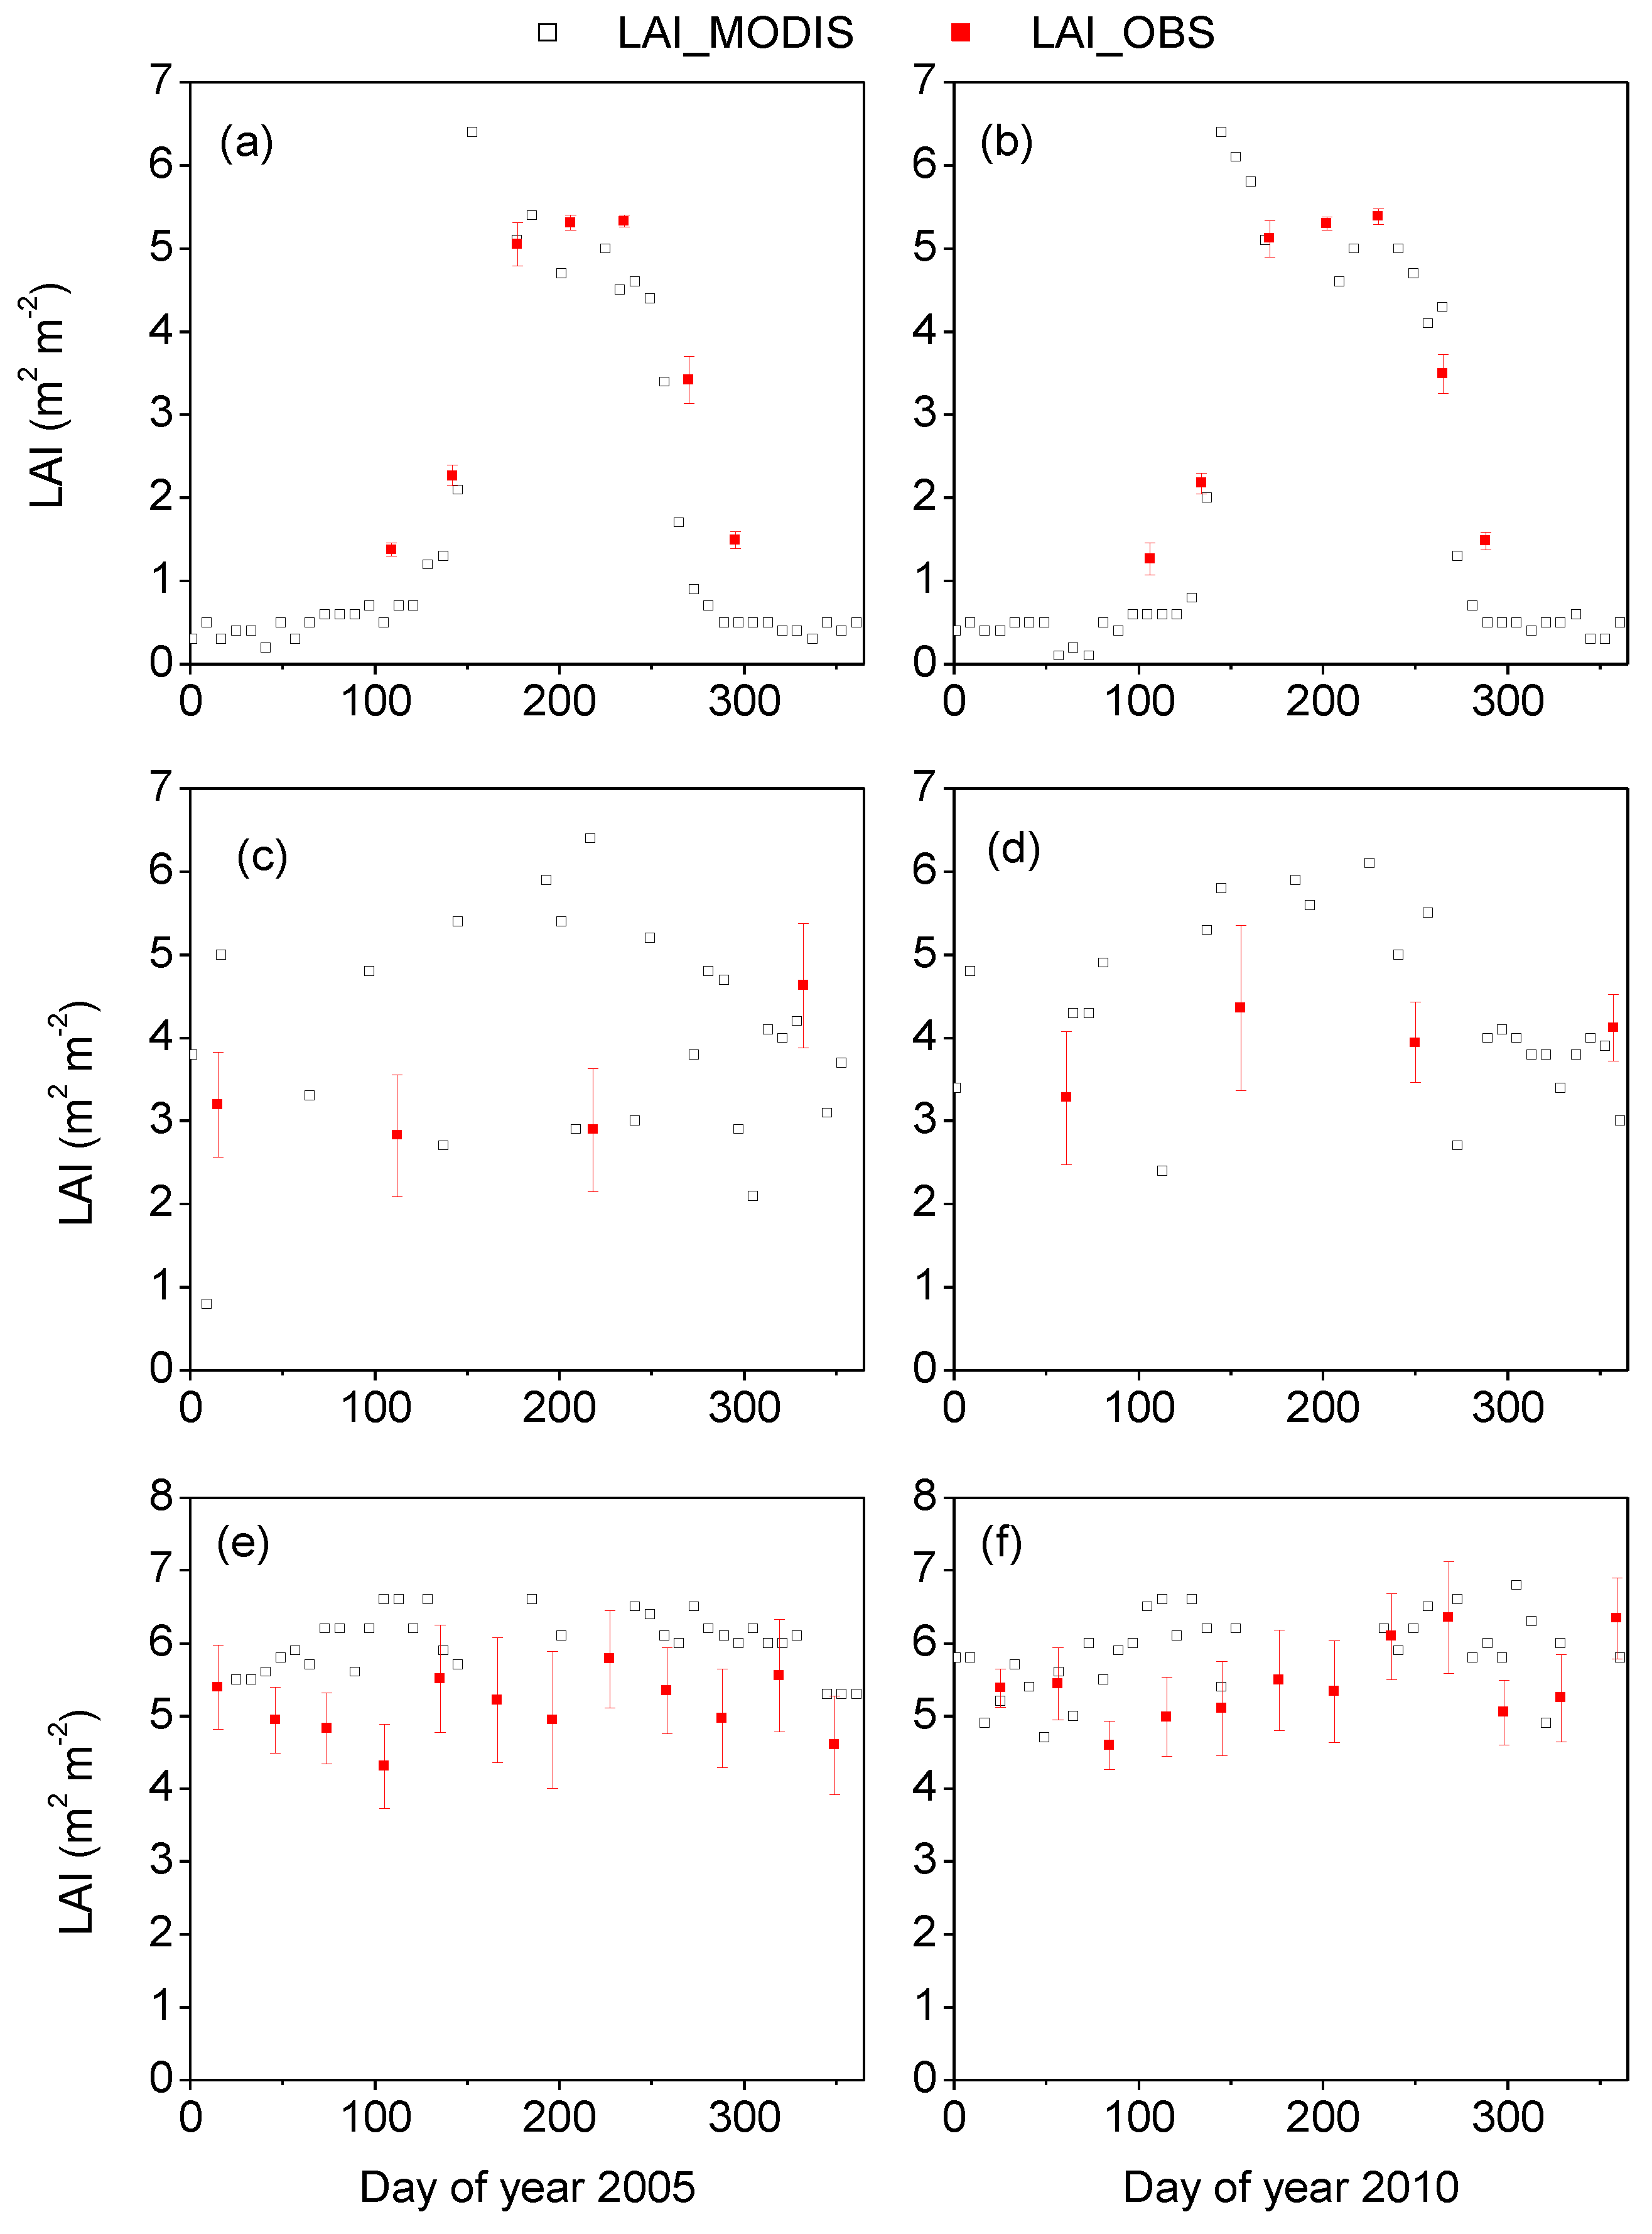
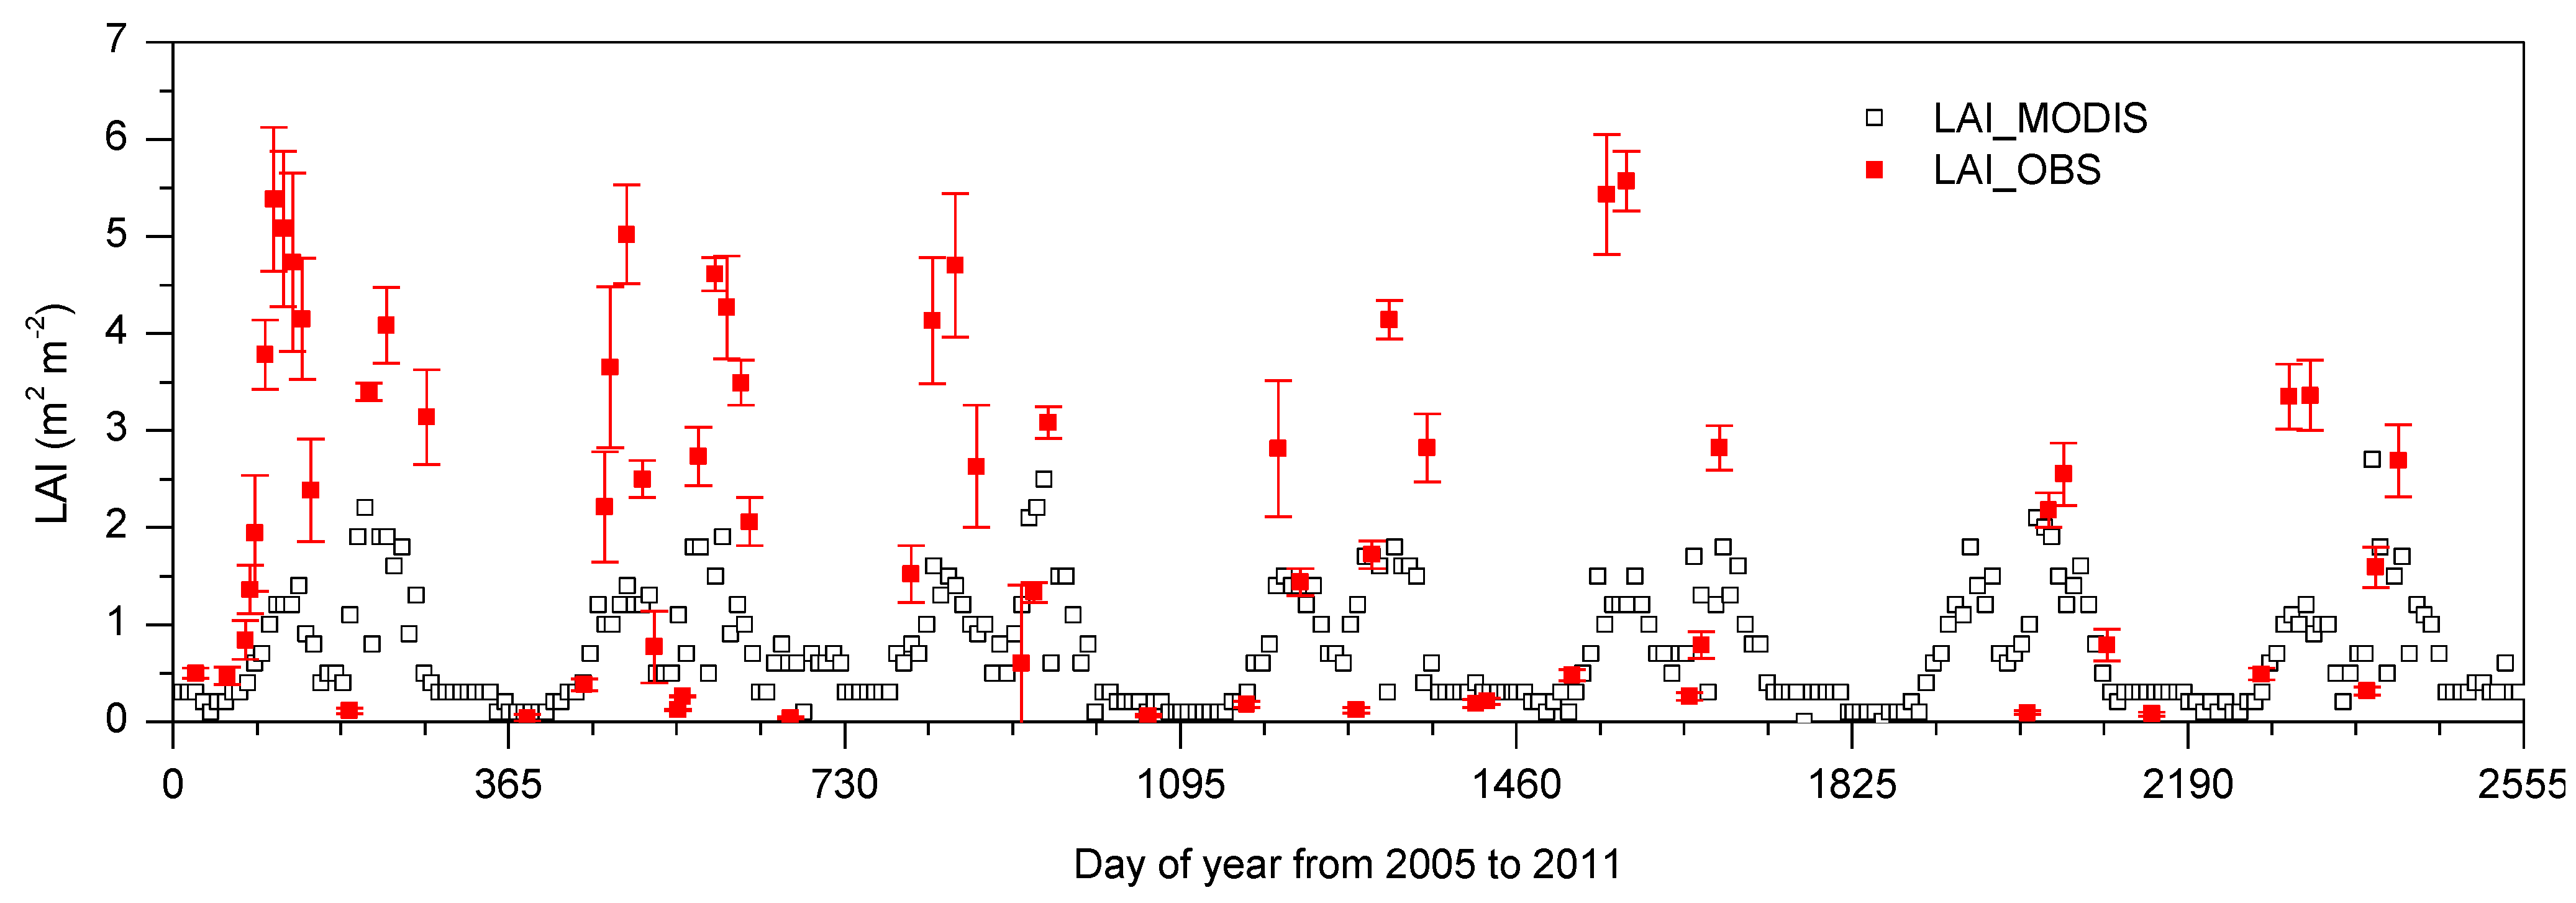
2.4. LAI Data
2.5. Analysis
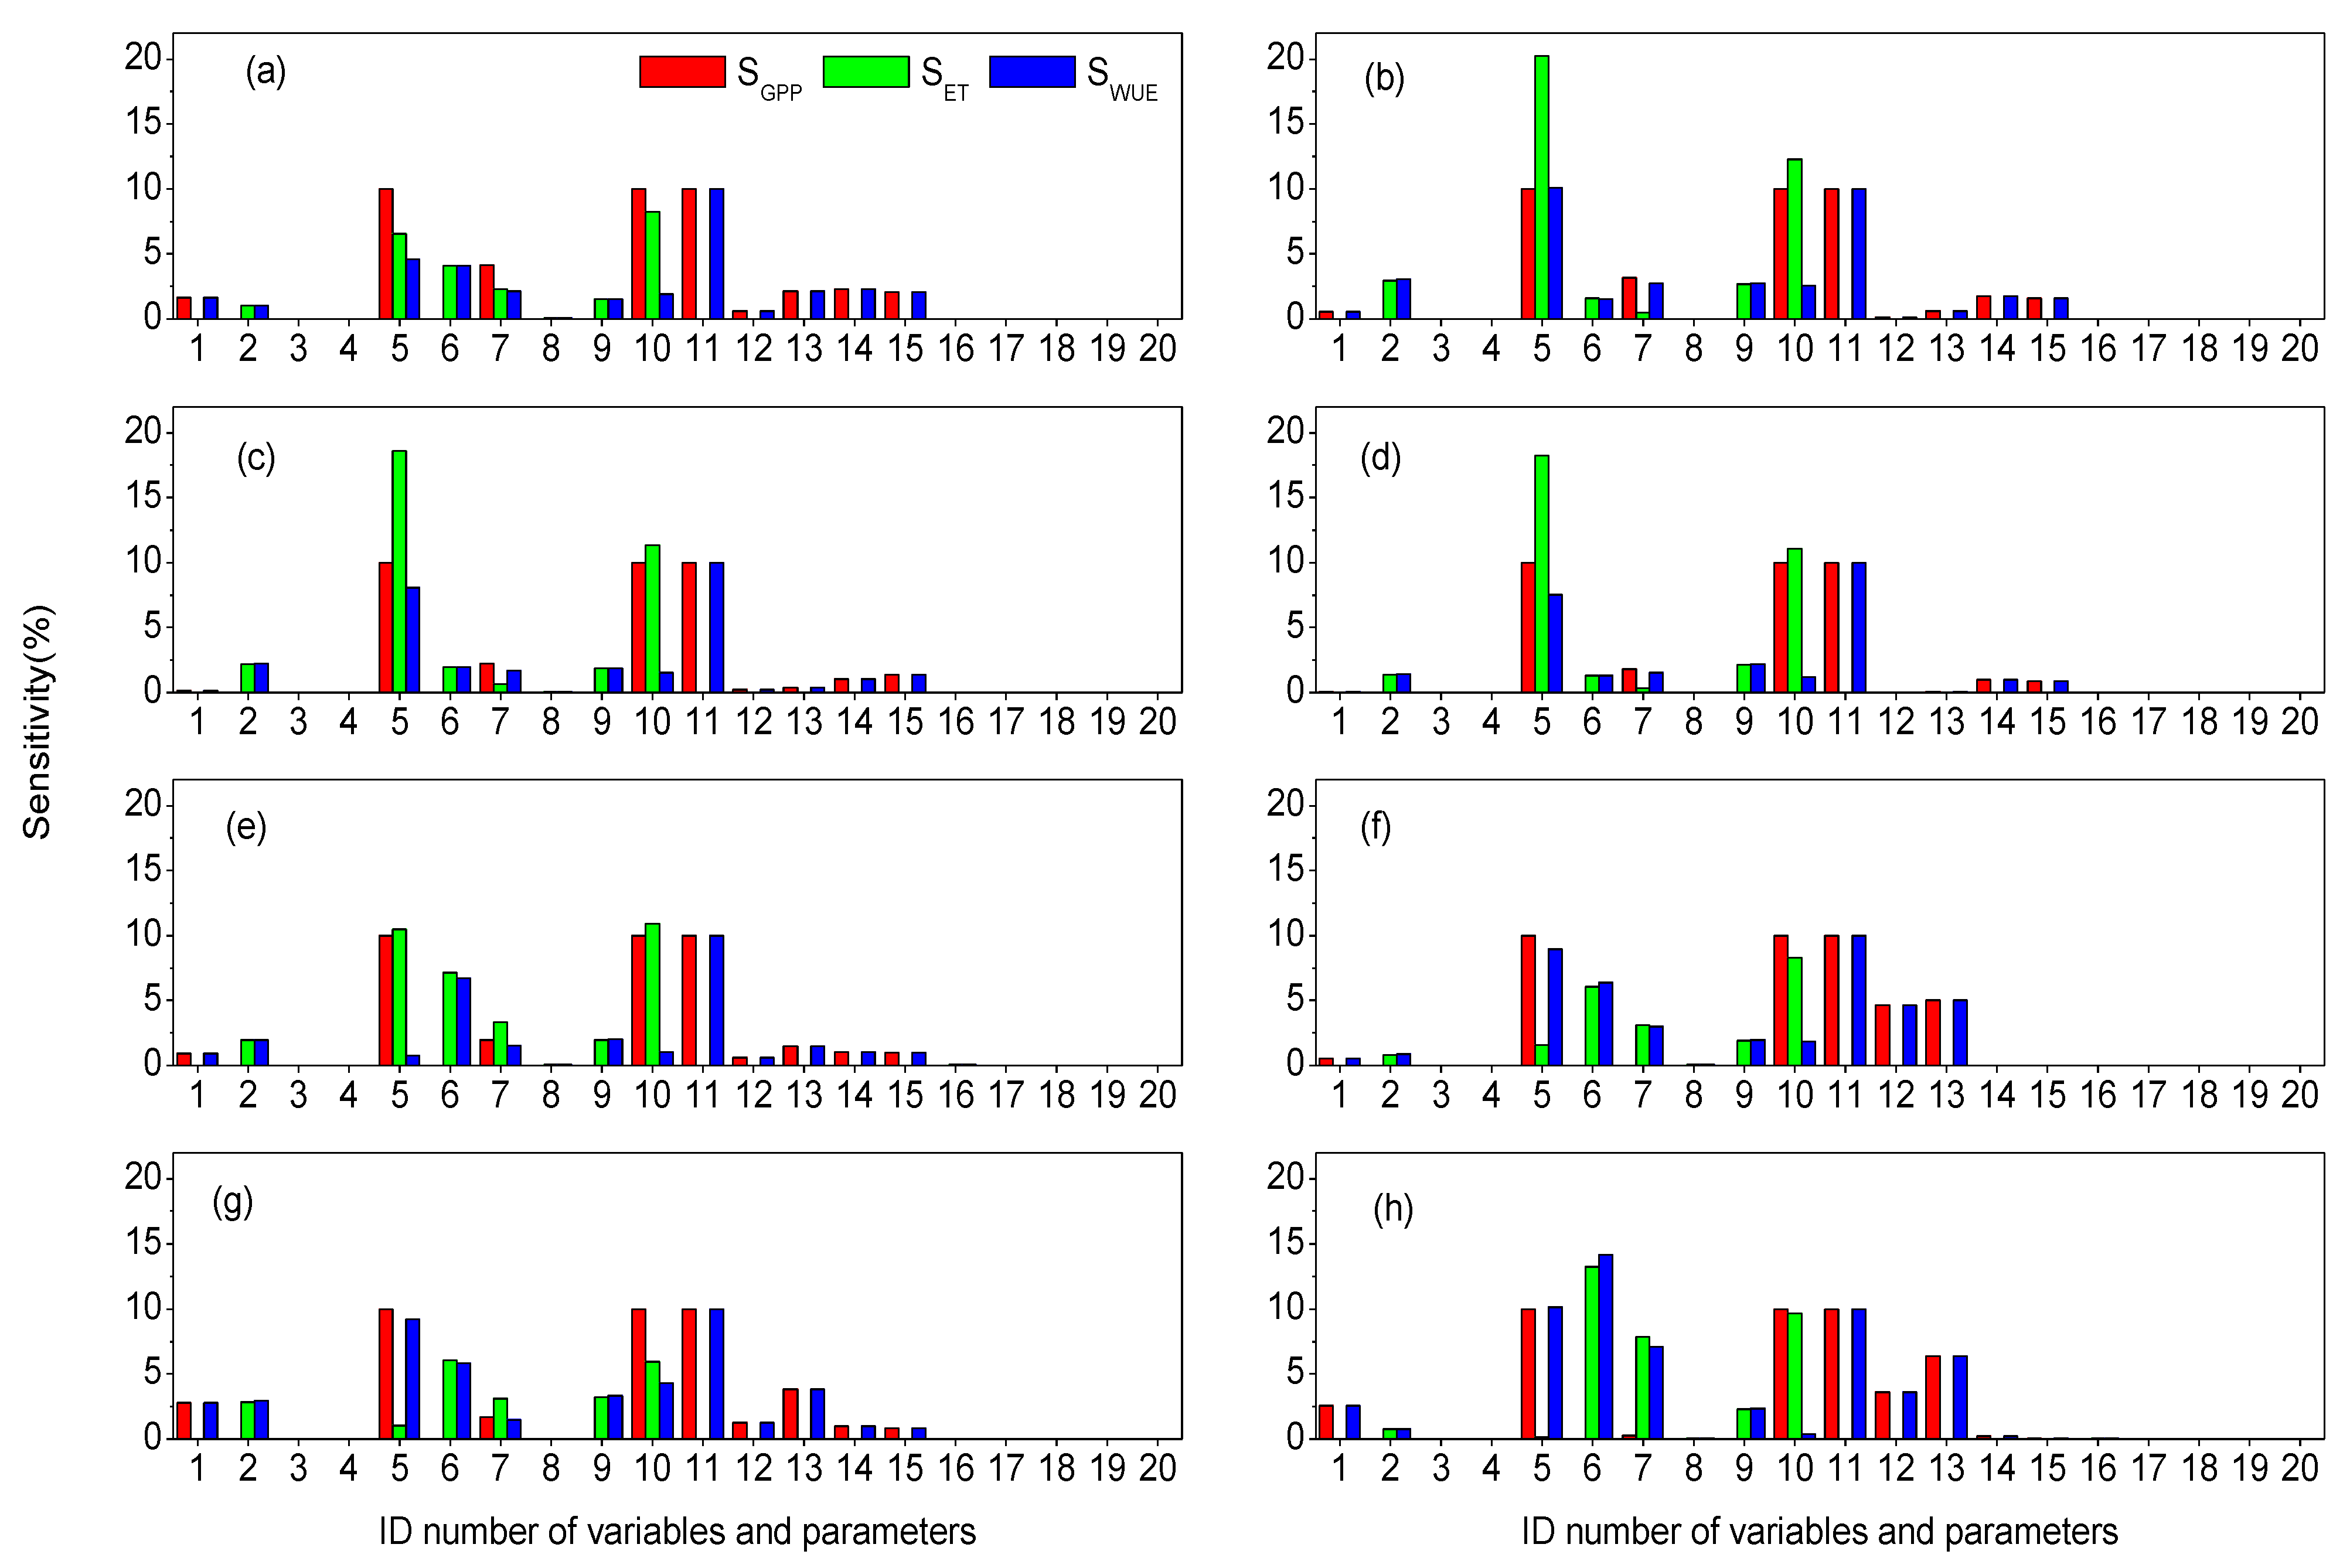
2.6. Sensitivity Analysis
| ID | Symbol | Definition | Units | Used for GPP or ET | ||
|---|---|---|---|---|---|---|
| Driving Variable | ||||||
| 1 | Tmin | minimum air temperature | oC | GPP, ET | ||
| 2 | Tmean | mean air temperature | oC | ET | ||
| 3 | Tday | daytime air temperature | oC | ET | ||
| 4 | Tnight | nighttime air temperature | oC | ET | ||
| 5 | FPAR | fraction of absorbed photosynthetically-active radiation | - | GPP, ET | ||
| 6 | RH | relative humidity | % | ET | ||
| 7 | VPD | water vapor deficit | Pa | GPP, ET | ||
| 8 | LAI | leaf area index | m2·m−2 | ET | ||
| 9 | α | albedo | - | ET | ||
| 10 | Rs↓ | downward shortwave radiation | J·m−2·d−1 | GPP, ET | ||
| Model Parameter | ||||||
| 11 | LUEmax | maximum light use efficiency | kg·C·m−2·d−1·MJ−1 | GPP | ||
| 12 | Tmin_close | threshold value below which the stomatal close completely | oC | GPP, ET | ||
| 13 | Tmin_open | threshold value upon which there will be no temperate stress | oC | GPP, ET | ||
| 14 | VPD_open | threshold value below which the stomatal close completely | Pa | GPP, ET | ||
| 15 | VPD_close | the threshold value upon which there will be no water stress | Pa | GPP, ET | ||
| 16 | gl_sh | leaf conductance to sensible heat per unit LAI | m·s−1 | ET | ||
| 17 | gl_e_wv | leaf conductance to evaporated water vapor per unit LAI | m·s−1 | ET | ||
| 18 | CL | mean potential stomatal conductance per unit leaf area | m·s−1 | ET | ||
| 19 | rbl_min | minimum value of totalaerodynamic resistance to vapor transport | s·m−1 | ET | ||
| 20 | rbl_max | maximum value of total aerodynamic resistance to vapor transport | s·m−1 | ET | ||
3. Results
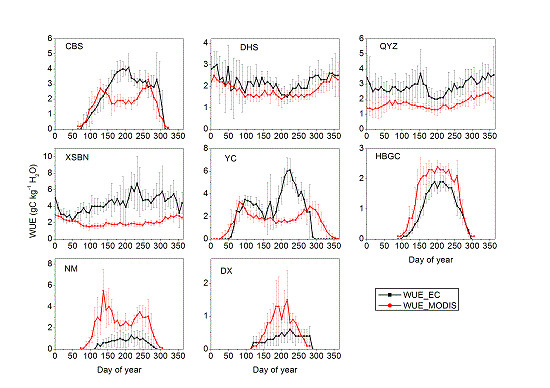
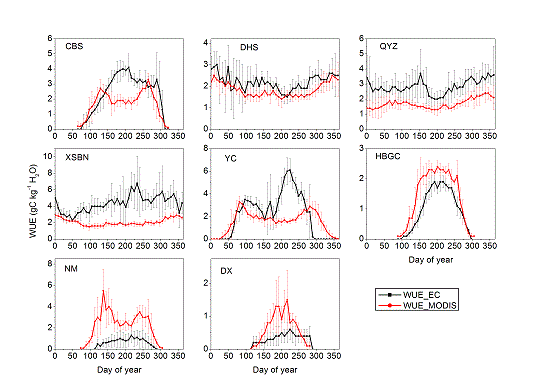
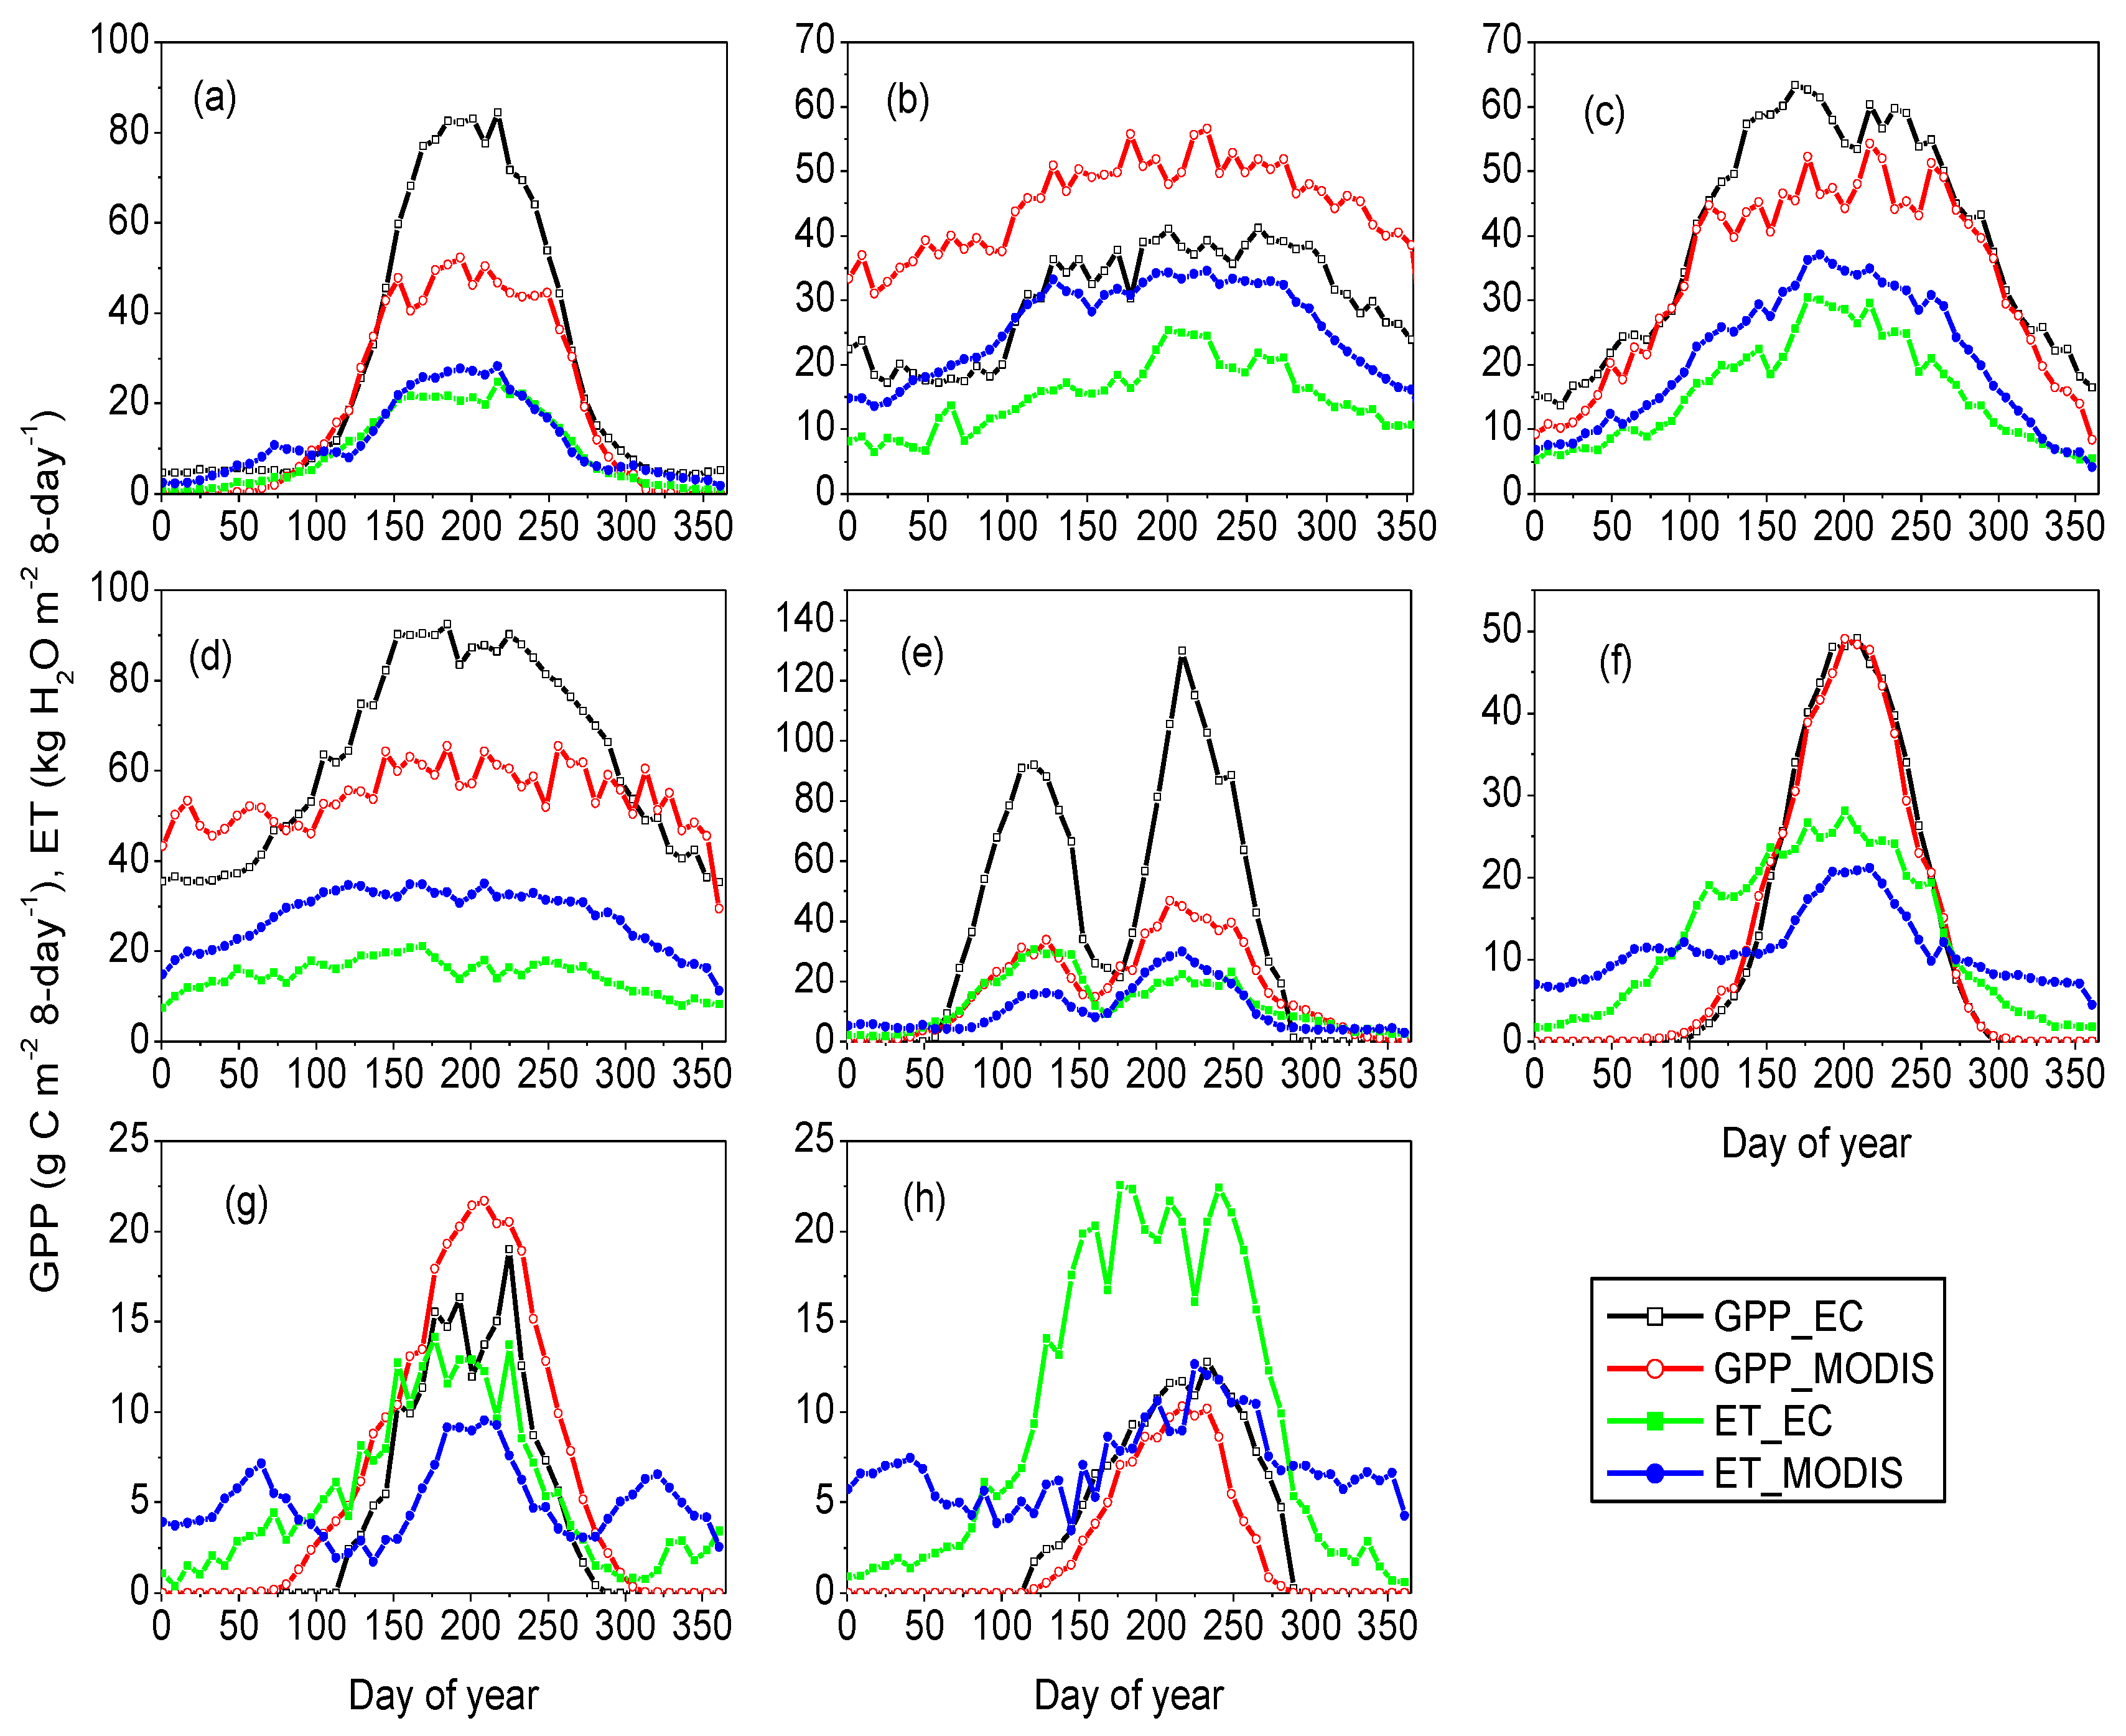
3.1. Evaluation of Seasonal MODIS-Derived WUE
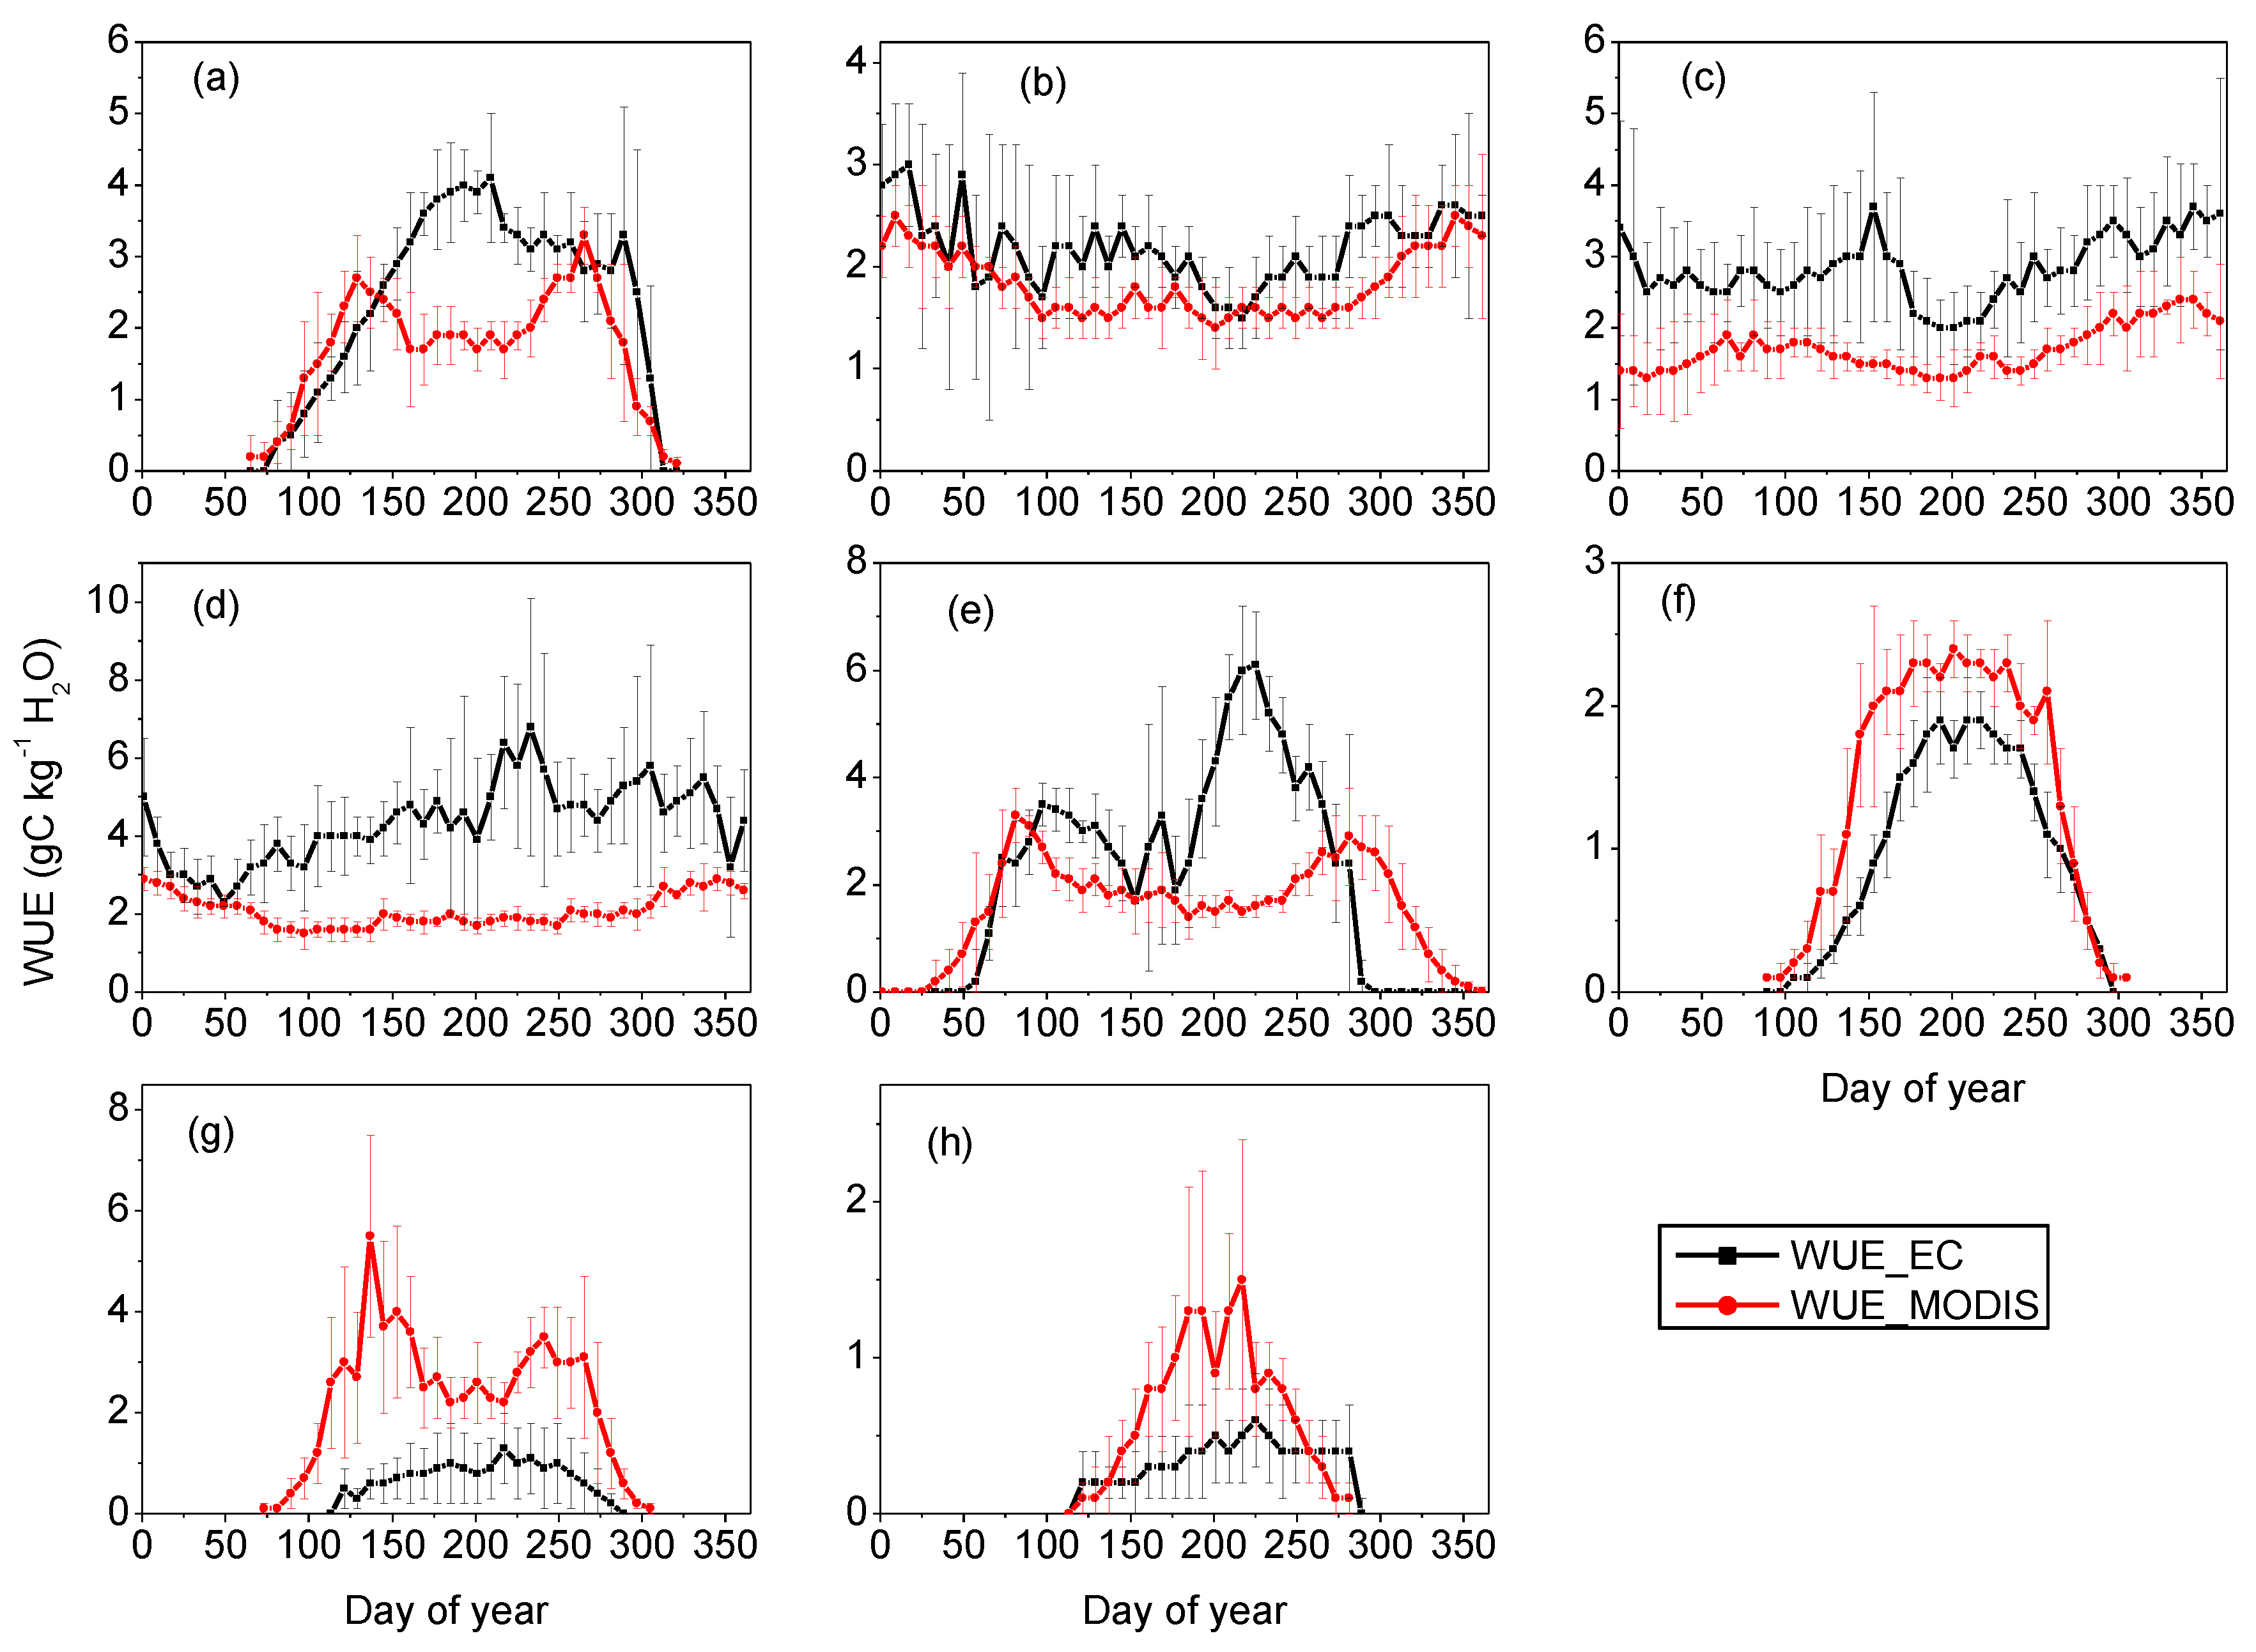
| Site | A | B | R | p | RMSE (g·C·kg−1 H2O) | Bias (g·C·kg−1 H2O) |
|---|---|---|---|---|---|---|
| CBS | 0.25 | 0.58 | 0.85 | <0.0001 | 0.97 | −0.45 |
| DHS | 0.46 | 0.63 | 0.71 | <0.0001 | 0.45 | −0.36 |
| QYZ | 0.43 | 0.45 | 0.64 | <0.0001 | 1.18 | −1.13 |
| XSBN | 2.13 | −0.01 | −0.03 | 0.83 | 2.53 | −2.28 |
| YC | 1.04 | 0.25 | 0.52 | 0.0002 | 1.70 | −0.51 |
| HBGC | 0.10 | 1.30 | 0.96 | <0.0001 | 0.42 | 0.26 |
| NM | 0.45 | 2.88 | 0.80 | <0.0001 | 1.63 | 1.11 |
| DX | 0.00 | 1.87 | 0.82 | <0.0001 | 0.34 | 0.14 |


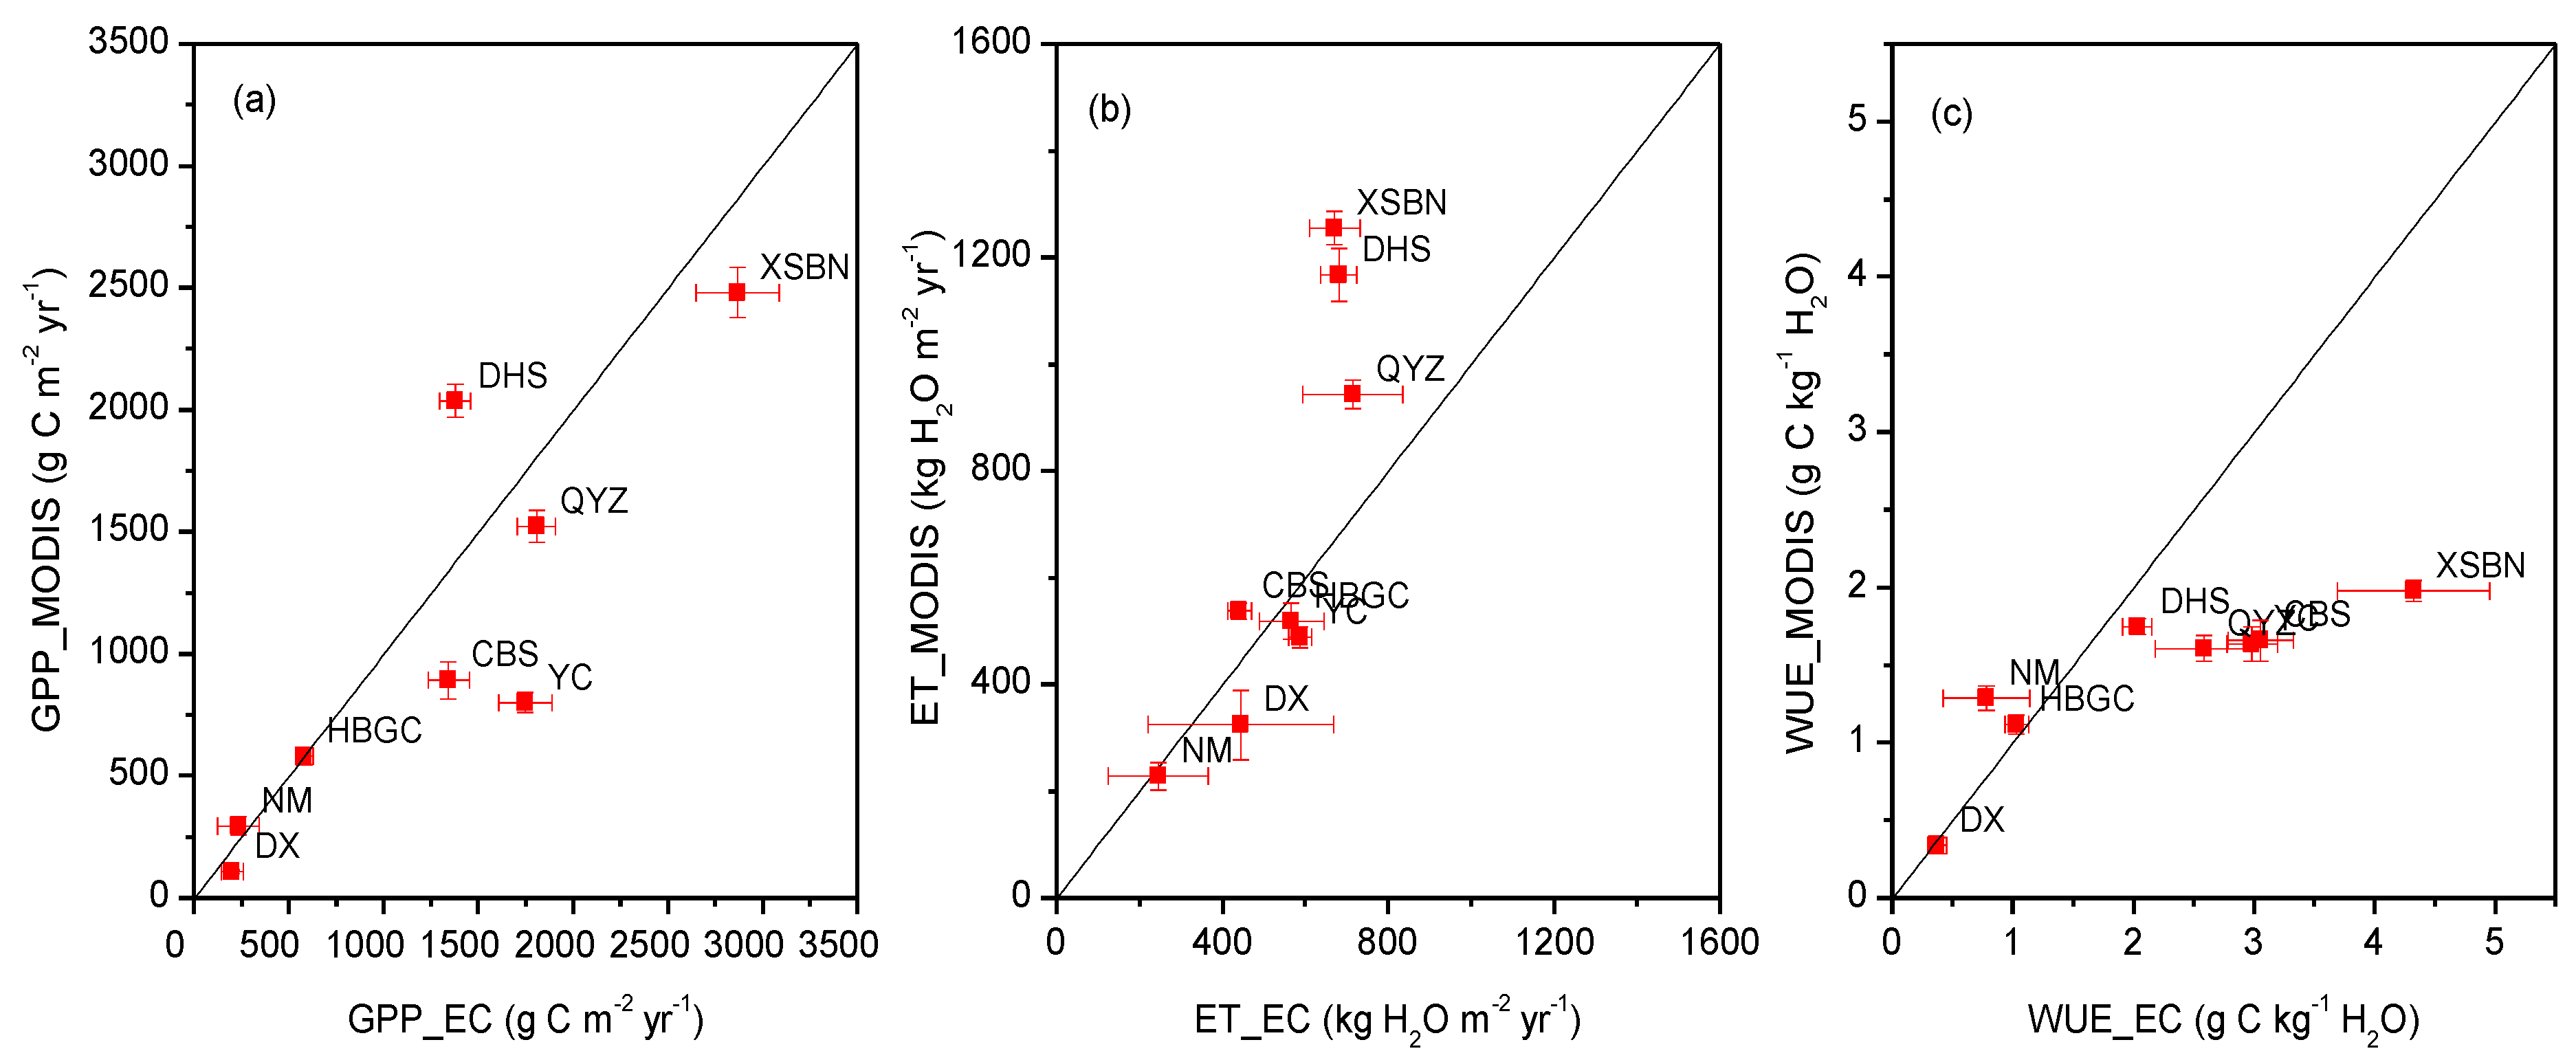
3.2. Evaluation of Annual MODIS-Derived WUE
3.3. Sensitivities of MODIS GPP, ET and WUE to Driving Variables and Model Parameters
| Site | ET_EC | ET_MODISo | ET_MODISm |
|---|---|---|---|
| DHS | 675 | 1051 | 715 |
| QYZ | 510 | 976 | 755 |
| XSBN | 564 | 1287 | 1117 |
4. Discussion
5. Conclusions
Acknowledgments
Author Contributions
Conflicts of Interest
References
- Mo, X.G.; Liu, S.X.; Lin, Z.H.; Xu, Y.Q.; Xiang, Y.; McVicar, T.R. Prediction of crop yield, water consumption and water use efficiency with a svat-crop growth model using remotely sensed data on the North China Plain. Ecol. Model. 2005, 183, 301–322. [Google Scholar] [CrossRef]
- Baldocchi, D.D.; Wilson, K.B. Modeling CO2 and water vapor exchange of a temperate broadleaved forest across hourly to decadal time scales. Ecol. Model. 2001, 142, 155–184. [Google Scholar] [CrossRef]
- Lu, X.L.; Zhuang, Q.L. Evaluating evapotranspiration and water-use efficiency of terrestrial ecosystems in the conterminous united states using MODIS and AMERIFLUX data. Remote Sens. Environ. 2010, 114, 1924–1939. [Google Scholar] [CrossRef]
- Medrano, H.; Flexas, J.; Galmes, J. Variability in water use efficiency at the leaf level among Mediterranean plants with different growth forms. Plant. Soil 2009, 317, 17–29. [Google Scholar] [CrossRef]
- Zhao, F.H.; Yu, G.R.; Li, S.G.; Ren, C.Y.; Sun, X.M.; Mi, N.; Li, J.; Ouyang, Z. Canopy water use efficiency of winter wheat in the North China Plain. Agr. Water Manag. 2007, 93, 99–108. [Google Scholar] [CrossRef]
- Tang, X.G.; Li, H.P.; Desai, A.R.; Nagy, Z.; Luo, J.H.; Kolb, T.E.; Olioso, A.; Xu, X.B.; Yao, L.; Kutsch, W.; et al. How is water-use efficiency of terrestrial ecosystems distributed and changing on earth? Sci. Rep. 2014, 4, 7483. [Google Scholar] [CrossRef] [PubMed]
- Xiao, J.; Sun, G.; Chen, J.; Chen, H.; Chen, S.; Dong, G.; Gao, S.; Guo, H.; Guo, J.; Han, S.; et al. Carbon fluxes, evapotranspiration, and water use efficiency of terrestrial ecosystems in China. Agr. For. Meteor. 2013, 182, 76–90. [Google Scholar] [CrossRef]
- Zhu, X.J.; Yu, G.R.; Wang, Q.F.; Hu, Z.M.; Han, S.J.; Yan, J.H.; Wang, Y.F.; Zhao, L. Seasonal dynamics of water use efficiency of typical forest and grassland ecosystems in China. J. For. Res.. 2014, 19, 70–76. [Google Scholar] [CrossRef]
- Tan, Z.H.; Zhang, Y.P.; Deng, X.B.; Song, Q.H.; Liu, W.J.; Deng, Y.; Tang, J.W.; Liao, Z.Y.; Zhao, J.F.; Song, L.; et al. Interannual and seasonal variability of water use efficiency in a tropical rainforest: Results from a 9 year eddy flux time series. J. Geophys. Res. Atmos. 2015, 120, 464–479. [Google Scholar] [CrossRef]
- Yu, G.R.; Song, X.; Wang, Q.F.; Liu, Y.F.; Guan, D.X.; Yan, J.H.; Sun, X.M.; Zhang, L.M.; Wen, X.F. Water-use efficiency of forest ecosystems in eastern China and its relations to climatic variables. New Phytol. 2008, 177, 927–937. [Google Scholar] [CrossRef] [PubMed]
- Hu, Z.; Yu, G.; Fu, Y.; Sun, X.; Li, Y.; Shi, P.; Wangw, Y.; Zheng, Z. Effects of vegetation control on ecosystem water use efficiency within and among four grassland ecosystems in China. Global Chang. Biol. 2008, 14, 1609–1619. [Google Scholar] [CrossRef]
- Huang, M.T.; Piao, S.L.; Sun, Y.; Ciais, P.; Cheng, L.; Mao, J.F.; Poulter, B.; Shi, X.Y.; Zeng, Z.Z.; Wang, Y.P. Change in terrestrial ecosystem water-use efficiency over the last three decades. Global Chang. Biol. 2015, 21, 2366–2378. [Google Scholar] [CrossRef] [PubMed]
- Liang, S.L. Recent advances in land remote sensing: An overview. In Advances in Land Remote Sensing; Liang, S.L., Ed.; Springer Netherlands: Berlin, Germany, 2008. [Google Scholar]
- Mu, Q.Z.; Zhao, M.S.; Running, S.W. Evolution of hydrological and carbon cycles under a changing climate. Part III: Global change impacts on landscape scale evapotranspiration. Hydrol. Process. 2011, 25, 4093–4102. [Google Scholar] [CrossRef]
- Turner, D.P.; Ritts, W.D.; Cohen, W.B.; Gower, S.T.; Running, S.W.; Zhao, M.S.; Costa, M.H.; Kirschbaum, A.A.; Ham, J.M.; Saleska, S.R.; et al. Evaluation of MODIS NPP and GPP products across multiple biomes. Remote Sens. Environ. 2006, 102, 282–292. [Google Scholar] [CrossRef]
- Wang, X.F.; Ma, M.G.; Li, X.; Song, Y.; Tan, J.L.; Huang, G.H.; Zhang, Z.H.; Zhao, T.B.; Feng, J.M.; Ma, Z.G.; et al. Validation of MODIS-GPP product at 10 flux sites in northern China. Int. J. Remote Sens. 2013, 34, 587–599. [Google Scholar] [CrossRef]
- Liu, Z.; Wang, L.; Wang, S. Comparison of different GPP models in China using MODIS image and Chinaflux data. Remote Sens. 2014, 6, 10215–10231. [Google Scholar] [CrossRef]
- Velpuri, N.M.; Senay, G.B.; Singh, R.K.; Bohms, S.; Verdin, J.P. A comprehensive evaluation of two MODIS evapotranspiration products over the conterminous United States: Using point and gridded FLUXNET and water balance ET. Remote Sens. Environ. 2013, 139, 35–49. [Google Scholar] [CrossRef]
- Ramoelo, A.; Majozi, N.; Mathieu, R.; Jovanovic, N.; Nickless, A.; Dzikiti, S. Validation of global evapotranspiration product (MOD16) using flux tower data in the African savanna, South Africa. Remote Sens. 2014, 6, 7406–7423. [Google Scholar] [CrossRef]
- Tang, R.L.; Shao, K.; Li, Z.L.; Wu, H.; Tang, B.H.; Zhou, G.Q.; Zhang, L. Multiscale validation of the 8-day MOD16 evapotranspiration product using flux data collected in China. IEEE J. Sel. Top. Appl. Earth Obs. Remote Sens. 2015, 8, 1478–1486. [Google Scholar] [CrossRef]
- Liu, Z.J.; Shao, Q.Q.; Liu, J.Y. The performances of MODIS-GPP and -ET products in China and their sensitivity to input data (FPAR/LAI). Remote Sens. 2015, 7, 135–152. [Google Scholar] [CrossRef]
- Heinsch, F.A.; Zhao, M.S.; Running, S.W.; Kimball, J.S.; Nemani, R.R.; Davis, K.J.; Bolstad, P.V.; Cook, B.D.; Desai, A.R.; Ricciuto, D.M.; et al. Evaluation of remote sensing based terrestrial productivity from modis using regional tower eddy flux network observations. IEEE T. Geosci. Remote 2006, 44, 1908–1925. [Google Scholar] [CrossRef]
- Yu, G.R.; Wen, X.F.; Sun, X.M.; Tanner, B.D.; Lee, X.H.; Chen, J.Y. Overview of ChinaFlUX and evaluation of its eddy covariance measurement. Agr. For. Meteor. 2006, 137, 125–137. [Google Scholar] [CrossRef]
- Falge, E.; Baldocchi, D.; Olson, R.; Anthoni, P.; Aubinet, M.; Bernhofer, C.; Burba, G.; Ceulemans, G.; Clement, R.; Dolman, H.; et al. Gap filling strategies for long term energy flux data sets. Agr. For. Meteor. 2001, 107, 71–77. [Google Scholar] [CrossRef]
- Zhang, L.M.; Yu, G.R.; Sun, X.M.; Wen, X.F.; Ren, C.Y.; Song, X.; Liu, Y.F.; Guan, D.X.; Yan, J.H.; Zhang, Y.P. Seasonal variation of carbon exchange of typical forest ecosystems along the eastern forest transect in China. Sci. China Ser. D-Earth Sci. 2006, 49, 47–62. [Google Scholar] [CrossRef]
- Zhao, M.; Running, S.W.; Nemani, R.R. Sensitivity of moderate resolution imaging spectroradiometer (MODIS) terrestrial primary production to the accuracy of meteorological reanalyses. J. Geophys. Res.-Bio. 2006, 111, G01002. [Google Scholar] [CrossRef]
- Mu, Q.Z.; Zhao, M.S.; Running, S.W. Improvements to a MODIS global terrestrial evapotranspiration algorithm. Remote Sens. Environ. 2011, 115, 1781–1800. [Google Scholar] [CrossRef]
- Oneill, R.V.; Gardner, R.H.; Mankin, J.B. Analysis of parameter error in a non-linear model. Ecol. Model. 1980, 8, 297–311. [Google Scholar] [CrossRef]
- Dufrene, E.; Davi, H.; Francois, C.; le Maire, G.; Le Dantec, V.; Granier, A. Modelling carbon and water cycles in a beech forest part I: Model description and uncertainty analysis on modelled NEE. Ecol. Model. 2005, 185, 407–436. [Google Scholar] [CrossRef]
- Zhang, L.; Yu, G.R.; Gu, F.X.; He, H.L.; Zhang, L.M.; Han, S.J. Uncertainty analysis of modeled carbon fluxes for a broad-leaved korean pine mixed forest using a process-based ecosystem model. J. For. Res. 2012, 17, 268–282. [Google Scholar] [CrossRef]
- Mu, Q.; Heinsch, F.A.; Zhao, M.; Running, S.W. Development of a global evapotranspiration algorithm based on MODIS and global meteorology data. Remote Sens. Environ. 2007, 111, 519–536. [Google Scholar] [CrossRef]
- Zhu, X.J.; Yu, G.R.; Wang, Q.F.; Hu, Z.M.; Zheng, H.; Li, S.G.; Sun, X.M.; Zhang, Y.P.; Yan, J.H.; Wang, H.M.; et al. Spatial variability of water use efficiency in China’s terrestrial ecosystems. Global Planet. Chang. 2015, 129, 37–44. [Google Scholar] [CrossRef]
- Gao, Y.; Zhu, X.J.; Yu, G.R.; He, N.P.; Wang, Q.F.; Tian, J. Water use efficiency threshold for terrestrial ecosystem carbon sequestration in China under afforestation. Agr. For. Meteor. 2014, 195, 32–37. [Google Scholar] [CrossRef]
- Yang, F.; Yang, J.; Wang, J.L.; Zhu, Y.Q. Assessment and validation of MODIS and GEOV1 LAI with ground-measured data and an analysis of the effect of residential area in mixed pixel. IEEE J. Sel. Top. Appl. Earth Obs. Remote Sens. 2015, 8, 763–774. [Google Scholar] [CrossRef]
- Jin, H.A.; Li, A.N.; Bian, J.H.; Lei, G.B.; Tan, J.B.; Xia, H.M. Validation of MODIS global LAI products in forested terrain. In 2014 IEEE International Geoscience and Remote Sensing Symposium, Proceedings of the IGARSS, Quebec, QC, Canada, 13–18 July 2014; IEEE: New York, NY, USA, 2014. [Google Scholar]
- Pisek, J.; Chen, J.M. Comparison and validation of MODIS and vegetation GLOBAL LAI products over four bigfoot sites in North America. Remote Sens. Environ. 2007, 109, 81–94. [Google Scholar] [CrossRef]
- Wang, Y.J.; Woodcock, C.E.; Buermann, W.; Stenberg, P.; Voipio, P.; Smolander, H.; Hame, T.; Tian, Y.H.; Hu, J.N.; Knyazikhin, Y.; et al. Evaluation of the MODIS LAI algorithm at a coniferous forest site in Finland. Remote Sens. Environ. 2004, 91, 114–127. [Google Scholar] [CrossRef]
- Fensholt, R.; Sandholt, I.; Rasmussen, M.S. Evaluation of MODIS LAI, fapar and the relation between fapar and NDVI in a semi-arid environment using in situ measurements. Remote Sens. Environ. 2004, 91, 490–507. [Google Scholar] [CrossRef]
- Tripathi, R.; Sahoo, R.N.; Gupta, V.K.; Sehgal, V.K.; Sahoo, P.M. Retrieval of leaf area index using IRS-P6, LISS-III data and validation of MODIS LAI product (MOD15 V5) over trans gangetic plains of India. Indian J. Agr. Sci. 2013, 83, 380–385. [Google Scholar]
- Coops, N.C.; Black, T.A.; Jassal, R.P.S.; Trofymow, J.A.T.; Morgenstern, K. Comparison of MODIS, eddy covariance determined and physiologically modelled gross primary production (GPP) in a douglas-fir forest stand. Remote Sens. Environ. 2007, 107, 385–401. [Google Scholar] [CrossRef]
- Zhang, F.M.; Chen, J.M.; Chen, J.Q.; Gough, C.M.; Martin, T.A.; Dragoni, D. Evaluating spatial and temporal patterns of MODIS GPP over the conterminous us against flux measurements and a process model. Remote Sens. Environ. 2012, 124, 717–729. [Google Scholar] [CrossRef]
- Chasmer, L.; Barr, A.; Hopkinson, C.; McCaughey, H.; Treitz, P.; Black, A.; Shashkov, A. Scaling and assessment of GPP from MODIS using a combination of airborne LIDAR and eddy covariance measurements over jack pine forests. Remote Sens. Environ. 2009, 113, 82–93. [Google Scholar] [CrossRef]
- Shim, C.; Hong, J.; Hong, J.; Kim, Y.; Kang, M.; Thakuri, B.M.; Kim, Y.; Chun, J. Evaluation of MODIS GPP over a complex ecosystem in east Asia: A case study at gwangneung flux tower in Korea. Adv. Space Res. 2014, 54, 2296–2308. [Google Scholar] [CrossRef]
- Alvarez-Taboada, F.; Tammadge, D.; Schlerf, M.; Skidmore, A. Assessing MODIS GPP in non-forested biomes in water limited areas using tower data. Remote Sens. 2015, 7, 3274–3292. [Google Scholar] [CrossRef]
- Wang, H.S.; Jia, G.S.; Fu, C.B.; Feng, J.M.; Zhao, T.B.; Ma, Z.G. Deriving maximal light use efficiency from coordinated flux measurements and satellite data for regional gross primary production modeling. Remote Sens. Environ. 2010, 114, 2248–2258. [Google Scholar] [CrossRef]
- Chen, T.X.; van der Werf, G.R.; Dolman, A.J.; Groenendijk, M. Evaluation of cropland maximum light use efficiency using eddy flux measurements in North America and Europe. Geophys. Res. Lett. 2011, 38, L14707. [Google Scholar] [CrossRef]
- Mi, N.; Yu, G.R.; Wang, P.X.; Wen, X.F.; Sun, X.M. A preliminary study for spatial representiveness of flux observation at ChinaFLUX sites. Sci. China Ser. D-Earth Sci. 2006, 49, 24–35. [Google Scholar] [CrossRef]
- Richardson, A.D.; Hollinger, D.Y.; Burba, G.G.; Davis, K.J.; Flanagan, L.B.; Katul, G.G.; Munger, J.W.; Ricciuto, D.M.; Stoy, P.C.; Suyker, A.E.; et al. A multi-site analysis of random error in tower-based measurements of carbon and energy fluxes. Agri. For. Meteor. 2006, 136, 1–18. [Google Scholar] [CrossRef]
- Saigusa, N.; Li, S.-G.; Kwon, H.; Takagi, K.; Zhang, L.-M.; Ide, R.; Ueyama, M.; Asanuma, J.; Choi, Y.-J.; Chun, J.H.; et al. Dataset of carboeastasia and uncertainties in the CO2 budget evaluation caused by different data processing. J. For. Res. 2013, 18, 41–48. [Google Scholar] [CrossRef]
- Kustas, W.P.; Anderson, M.C.; French, A.N.; Vickers, D. Using a remote sensing field experiment to investigate flux-footprint relations and flux sampling distributions for tower and aircraft-based observations. Adv. Water Res. 2006, 29, 355–368. [Google Scholar] [CrossRef]
- Tian, J.; Zhang, R.H.; Sun, X.M.; Zhu, Z.L.; Zhou, Y.L. Study of a model for correcting the effects of horizontal advection on surface fluxes measurement based on remote sensing. Sci. China Ser. D-Earth Sci. 2006, 49, 273–280. [Google Scholar] [CrossRef]
- Bai, J.; Jia, L.; Liu, S.M.; Xu, Z.W.; Hu, G.C.; Zhu, M.J.; Song, L.S. Characterizing the footprint of eddy covariance system and large aperture scintillometer measurements to validate satellite-based surface fluxes. IEEE Geosci. Remote Sens. 2015, 12, 943–947. [Google Scholar] [CrossRef]
- Li, Z.Q.; Yu, G.R.; Wen, X.F.; Zhang, L.M.; Ren, C.Y.; Fu, Y.L. Energy balance closure at ChinaFlUX sites. Sci. China Ser. D-Earth Sci. 2005, 48, 51–62. [Google Scholar]
© 2015 by the authors; licensee MDPI, Basel, Switzerland. This article is an open access article distributed under the terms and conditions of the Creative Commons Attribution license (http://creativecommons.org/licenses/by/4.0/).
Share and Cite
Zhang, L.; Tian, J.; He, H.; Ren, X.; Sun, X.; Yu, G.; Lu, Q.; Lv, L. Evaluation of Water Use Efficiency Derived from MODIS Products against Eddy Variance Measurements in China. Remote Sens. 2015, 7, 11183-11201. https://doi.org/10.3390/rs70911183
Zhang L, Tian J, He H, Ren X, Sun X, Yu G, Lu Q, Lv L. Evaluation of Water Use Efficiency Derived from MODIS Products against Eddy Variance Measurements in China. Remote Sensing. 2015; 7(9):11183-11201. https://doi.org/10.3390/rs70911183
Chicago/Turabian StyleZhang, Li, Jing Tian, Honglin He, Xiaoli Ren, Xiaomin Sun, Guirui Yu, Qianqian Lu, and Linyu Lv. 2015. "Evaluation of Water Use Efficiency Derived from MODIS Products against Eddy Variance Measurements in China" Remote Sensing 7, no. 9: 11183-11201. https://doi.org/10.3390/rs70911183
APA StyleZhang, L., Tian, J., He, H., Ren, X., Sun, X., Yu, G., Lu, Q., & Lv, L. (2015). Evaluation of Water Use Efficiency Derived from MODIS Products against Eddy Variance Measurements in China. Remote Sensing, 7(9), 11183-11201. https://doi.org/10.3390/rs70911183