1. Introduction
The countries of the Middle East and North Africa region are currently interested in partly meeting their electricity demands from solar powered plants [
1,
2,
3]. In 2014, the government of Egypt established a feed-in tariff scheme for electricity generated from solar and wind powered plants [
4]. The current plan in Egypt is to install a capacity of 2.3 GW of solar powered plants by 2017 [
5].
Knowledge of the solar resource at ground level is a critical issue for developing solar energy. Of particular interest are historical as well as recent estimates of the surface solar irradiance (SSI), i.e., the downwelling broadband solar irradiance received at ground level on a horizontal plane, and its direct and diffuse components, which are important for the feasibility studies of such plants.
Ground stations providing high quality measurements of the SSI are managed by the Egyptian Meteorological Authority (EMA). Though their number exceeds by far the average for Africa, only seven stations have long-standing accurate records and cannot offer a synoptic view of the SSI over Egypt. In such situations where devices measuring solar radiation are scarce, other approaches must be devised for mapping the SSI in an accurate way with long-standing archives. Accurate assessments of SSI can now be drawn from images from the geostationary meteorological satellites such as the Meteosat series [
6,
7,
8], possibly in combination with ground-based measurements [
9,
10].
Other approaches are feasible. For example, the use of empirical models to estimate solar radiation from available meteorological parameters at surface, such as air temperature and pressure, relative humidity, or cloud cover amount, is a common practice. Regarding the specific case of Egypt for monthly means of daily solar irradiation, it was demonstrated that performances of the Meteosat-derived HelioClim-3 (HC3) database are currently similar to or better than those obtained by empirical models [
11]. Another approach is the use of meteorological reanalyses such as the MERRA (Modern-Era Retrospective Analysis for Research and Applications) reanalysis proposed by the NASA Global Modeling and Assimilation Office or the ERA-Interim reanalysis of the ECMWF (European Center for Medium-range Weather Forecasts) which offer estimates of the SSI. The overestimation of the SSI by reanalyses has already been documented and several publications have reported on a tendency of a majority of reanalyses to overestimate the SSI and noted that deficiencies in clear-sky radiative transfer calculations were major contributors to these excessive SSI. In a very detailed study using SSI measured at Egyptian stations among many others, it was found that the MERRA and ERA-Interim reanalyses often predict clear-sky conditions while actual conditions are cloudy and that the opposite is also true though less pronounced: actual clear-sky conditions are predicted as cloudy [
12]. This overestimation of occurrence of clear-sky conditions leads to an overestimation of the SSI by the reanalyses. It was also found that the uncertainty in SSI by reanalyses varies strongly within the same area exhibiting fairly homogeneous SSI, making accuracy of a mapping of the SSI difficult to predict. Furthermore, it was demonstrated that the HelioClim-1 database should be preferred to these reanalyses as it offers better performances. HelioClim-1 is a database derived from images of the first generation series of Meteosat satellites [
13]. It was created within the HelioClim project of the MINES ParisTech [
14] after preliminary works in 1980’s [
15] and is widely used in many domains of application [
16]. In particular, the SSI in the northern African desert climate and its long-term variations were studied by the means of HelioClim-1 [
17].
The HC3 database has been created from images of the second generation series of Meteosat satellites and offers better performances than HelioClim-1 [
14]. The present article deals with HC3. HC3 is widely used by professionals in solar energy and is regularly improved [
14]. Versions HC3v4 and HC3v5 are currently available.
The objective of this article is to present and discuss the results of a validation of these two versions with high quality measurements performed at seven sites located in Egypt. The results will support the selection of the satellite-derived database for mapping the solar resource over Egypt. The validation is performed for all-sky conditions as well as in cloud-free conditions. In the latter case, another comparison is made with the estimates of the McClear database, based on the McClear model which predicts the SSI that should be observed if the sky were cloud-free [
18]. Such a model predicting cloud-free SSI is called clear-sky model in the following.
The article is organized as follows: the study area and available data sets (
Section 2), the presentation of the HC3 database and its versions HC3v4 and HC3v5, and the McClear model (
Section 3), the results (
Section 4), the discussion on the results (
Section 5) and finally the conclusions (
Section 6).
2. Study Area, Ground Stations and Data Sets
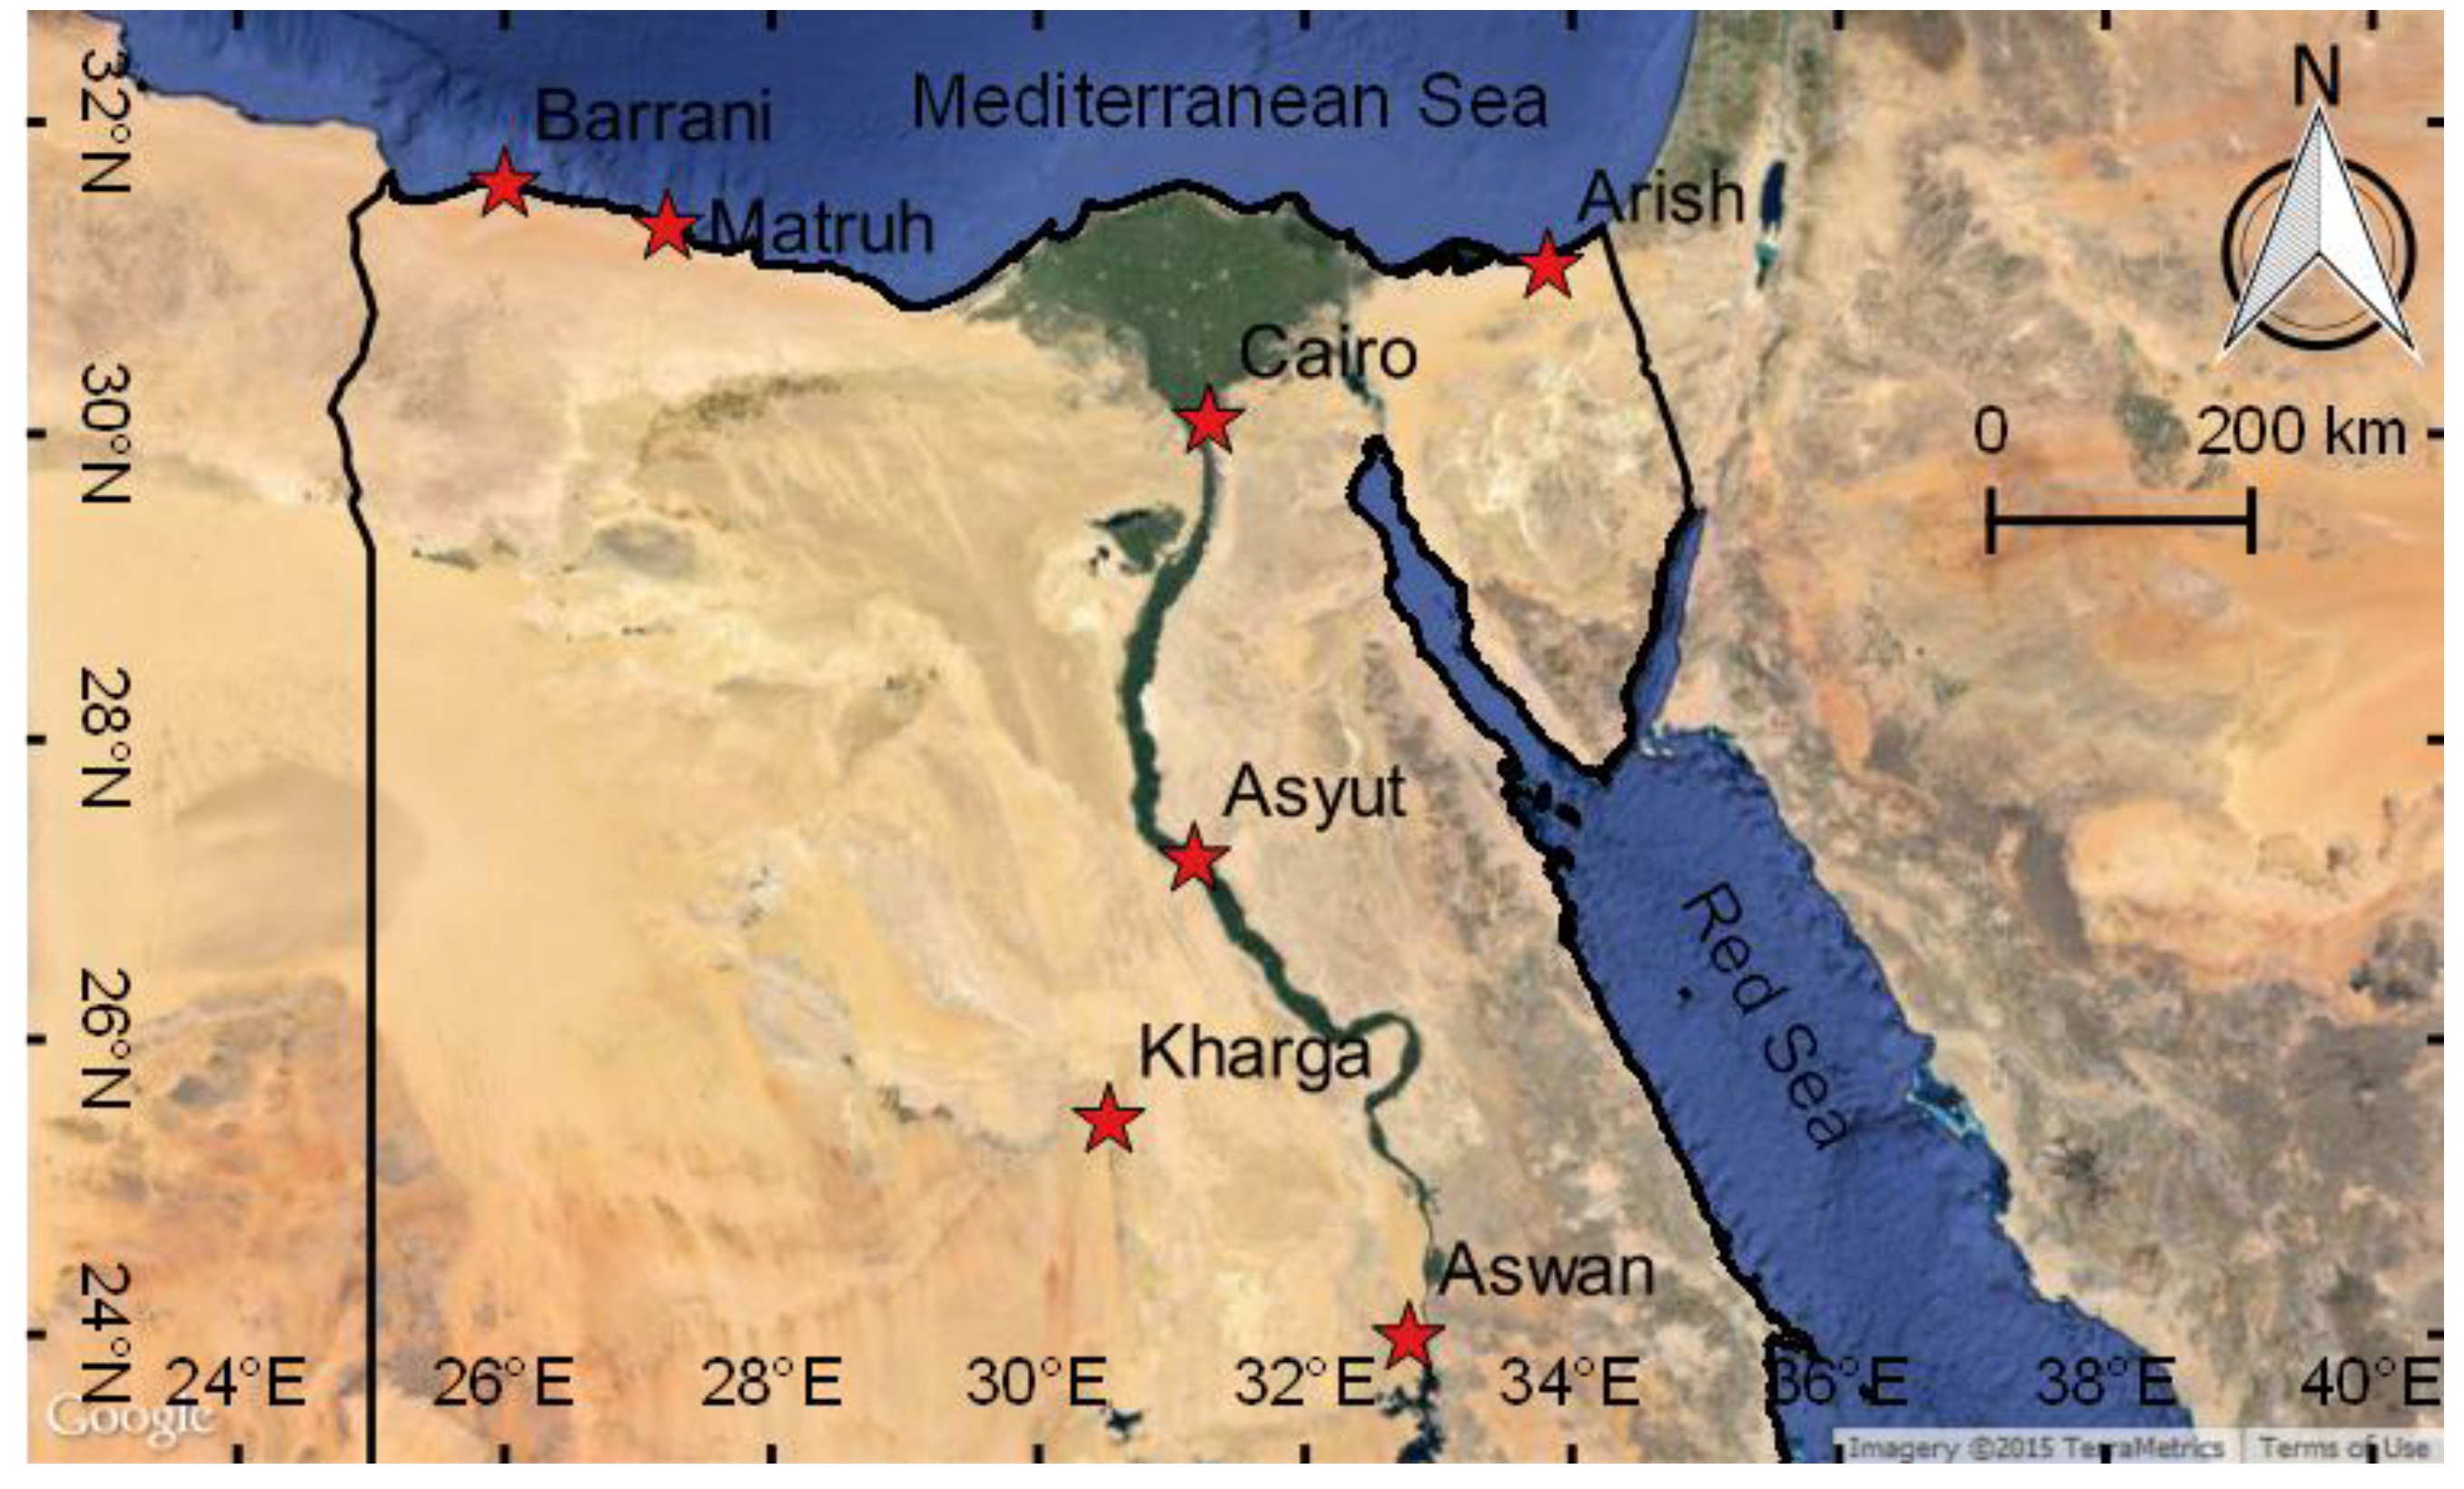
The ground measurements were collected at seven stations scattered throughout Egypt (
Figure 1).
Egypt encompasses urban, desert, coastal and vegetated surface conditions. Its climate is subtropical. Spring and autumn can be considered as transitional seasons. They are characterized by small-scale depressions moving across the Great Sahara. The weather associated with these depressions is generally hot, dry and dusty. In particular, spring is dominated by frequent chained depressions, called the Khamsin phenomenon [
19]. The Nile River and its adjacent narrow cultivated belts have only a limited and local influence on the Egyptian climate [
19]. Four climatic areas with respect to the optical clearness of the sky have been identified [
20]:
the lower Egypt along the north coast (north of 30°N latitude) has a rather Mediterranean climate where precipitation largely occurs in the winter months and a dry, warm and rainless summer. The soil is generally sandy and the measuring stations are surrounded by desert. The Barrani and Matruh stations are respectively 0.5 km and 3 km away from the Mediterranean coast. At Barrani, the instruments are situated on top of a rock close to Sidi Barrani village in an open area. At Matruh, they are on the rooftop of a building in the Marsa Matruh International Airport;
Figure 1.
Map showing the locations and surroundings of the seven stations used in this study.
Figure 1.
Map showing the locations and surroundings of the seven stations used in this study.
the sky in the arid Sinai peninsula is very clear in summer: more than 65% of the solar radiation at the top of the atmosphere reaches the surface as an average. This fraction decreases down to 55% in November and December [
20]. The Arish station is located in the northeast of the Sinai Peninsula. The instruments are on the rooftop of the meteorological office 7 km away from the Mediterranean coast, close to Al Arish International Airport;
the area close to Cairo experiences a semi-arid warmer dry climate. Cairo is an industrialized area with more than 16 million inhabitants and is one of the most important megacities in the world. The instruments are on the rooftop of the headquarters of the EMA. The site is surrounded by high buildings and a heavy traffic load with two major industrial zones located to the north and south of the site;
-
the upper Egypt is the southern part of Egypt and has a dry desert climate. The soil is usually sandy but granite rocks may be present. Variations in cloudiness are more marked in the northern part than in the southern one. Stations Asyut, Kharga and Aswan are located in this area. The instruments of the Aswan station are on the rooftop of a building inside the Aswan Military Airport. The site is surrounded by desert, composed of sandy soil mixed with rocks of varying sizes. The instruments of the Asyut station are on the rooftop of a building of the Asyut University. The site is surrounded by both desert and cultivated fields. The Kharga station is located in the Kharga Oasis in the Western Desert. The instruments are located in the Agricultural Research Center. The site is surrounded by soft desert sand, with some shrubs and trees.
The time period of this study is from February 2004 to December 2009 for all stations, except for Barrani where the measurements started in January 2005. At each station, the data loggers receive the mean, standard deviation, maximum and minimum values of the measurements every minute. However, in order to increase the storage capacity of the data loggers, only hourly averages were stored. The measurements are actually hourly irradiation and were converted in this study into hourly mean of irradiance, and expressed in W·m
−2. The hourly mean of global irradiance received on a horizontal plane, abbreviated in GHI, and noted
G hereafter, was measured at all stations by the Eppley Laboratory Precision Spectral Pyranometer (PSP), in Cairo the measurements were sometimes collected by the Kipp and Zonen CM-11 pyranometer (CM11). The hourly mean of direct irradiance received on a plane normal to the sun rays, abbreviated in DNI, and noted
Bn hereafter, was measured by the Eppley Laboratory Normal Incidence Pyrheliometer (NIP) at only Aswan and Cairo, and some DNI measurements in Cairo were collected by the Kipp and Zonen CH1. For all stations, the hourly mean of diffuse irradiance received on a horizontal plane, abbreviated in DHI, and noted
D hereafter, was measured by the Eppley Laboratory Model 8–48 pyranometers (8/48) with a shading ball.
Table 1 lists the station names, their coordinates, their altitude above mean sea level (a.m.s.l), the number of hours with available data from HC3v4, HC3v5, McClear, and the ground measurements for solar zenith angles less than 75°, the available hours with all the data which have passed the quality check procedures, and the number of hours which are classified as cloud-free and have passed the quality checks.
The pyrheliometer and pyranometer measurements of the EMA network are traceable to the World Radiometric Reference standards for solar data, where spare instruments are calibrated every five years in Davos, Switzerland. The instruments situated at the seven stations are calibrated every year against the spare reference instruments. The accuracy of this calibration is approximately 3% to 4% [
21,
22].
The instruments were regularly cleaned to avoid any soiling on their surfaces. The measurements then underwent a set of quality check procedures based on [
23] to filter out any erroneous reference data. The conditions to pass are:
where
θS denotes the solar zenith angle,
E0 the hourly mean of horizontal irradiance at top of atmosphere and
E0,n the hourly mean of irradiance at top of atmosphere received at normal incidence. As HC3 estimates are not valid for such angles, the ground measurements were filtered out for
θS > 75° for the sake of the validation.
For stations with only GHI and DHI measurements, only hours for which both the GHI and DHI passed the quality check procedures were used in the validation. For the Aswan and Cairo stations with DNI availability, the measurements of the GHI, DNI and DHI satisfying the aforementioned quality check procedures underwent the “consistency check” test, which filters out any measurements for which the measured GHI and computed GHI do not agree with each other within specified limits. The condition to pass is:
The measurements which passed the quality check procedures were then matched in time and space to the irradiance estimates from HC3v4, HC3v5 and McClear. The number of samples available in each station is listed in
Table 1.
Table 1.
The station names, their coordinates, their altitude above mean sea level (a.m.s.l), the number of samples available for solar zenith angles less than 75° before applying the quality checks, the number of samples available after quality check and those available for cloud-free conditions.
Table 1.
The station names, their coordinates, their altitude above mean sea level (a.m.s.l), the number of samples available for solar zenith angles less than 75° before applying the quality checks, the number of samples available after quality check and those available for cloud-free conditions.
| Station | Coordinates | a.m.s.l. | Samples Available for θS ≤ 75° (before Quality Checks) | Samples for All-Sky Condition (Passed Quality Checks) | Samples for Cloud-Free Conditions (Passed Quality Checks) |
|---|
| Arish | 31.080°N 33.820°E | 31 m | 13,196 | 12,892 | 2259 |
| Aswan | 23.970°N 32.780°E | 192 m | 8745 | 4550 | 1319 |
| Asyut | 27.200°N 31.170°E | 52 m | 19,810 | 19,778 | 4385 |
| Barrani | 31.620°N 25.900°E | 24 m | 8834 | 8207 | 454 |
| Cairo | 30.083°N 31.283°E | 33 m | 7198 | 3529 | 734 |
| Kharga | 25.450°N 30.533°E | 78 m | 16,820 | 16,732 | 6890 |
| Matruh | 31.330°N 27.220°E | 24 m | 15,471 | 14,859 | 2004 |
The performances of the HC3v4 and HC3v5 will be assessed for cloud-free and all-sky conditions separately. Therefore, a cloud-screening algorithm needs to be applied on the ground measurements to separate the cloud-contaminated hours from the cloud-free hours. The cloud-screening algorithm of Lefevre
et al. [
18] was employed, but slightly modified to account for the difference in temporal steps since it was designed for measurements available at 1 min, while in this case the step is 1 h. The clearness index
KT, corrected clearness index
KTcor, direct normal clearness index
KTBn and diffuse fraction
KD are respectively defined as:
where
m is the pressure corrected relative optical air mass [
24], computed as:
where
θS is expressed in deg,
p and
p0 are respectively the air pressure at the site under consideration and that at sea level,
Z is the altitude of the station above mean sea level expressed in meters and 8435.2 m is the scale height of the Rayleigh atmosphere near the surface of the Earth [
25,
26].
KTcor exhibits less dependence with
θS than
KT [
27].
An observation for hour
t was considered cloud-free if the following conditions were satisfied:
where σ
KTcor is the standard deviation of
KTcor in the interval [
t + 1 h,
t − 1 h]. A consequence of the calculation of σ
KTcor is that the first and last hours of any given day which have passed the quality check procedures are filtered out.
Table 1 also presents the number of hours which are classified as cloud-free for all stations.
3. The HelioClim-3 Database and the McClear Model
At MINES ParisTech, Meteosat satellite images are routinely processed by means of the Heliosat-2 method [
28] and the estimated irradiation values are stored in the HelioClim databases covering Europe, Africa, the Atlantic Ocean and the Middle East [
14]. The Heliosat-2 method is based on the general fact that the appearance of a cloud over a pixel results in an increase of reflectance in visible imagery, and further on the principle that the attenuation of the downwelling shortwave irradiance by the atmosphere over a pixel is related to the magnitude of change between the reflectance that should be observed under a cloud-free sky and that currently observed [
6,
7]. This magnitude of change is quantified by a cloud index. The Heliosat-2 method and its application to the Meteosat images are well presented in [
13,
28] and the method is not detailed any further. Implementations of the Heliosat-2 method have been used in several places with adaptations [
29,
30,
31]. The influence of uncertainties in input variables on the outcomes of the Heliosat-2 method was discussed by [
13,
32].
The HC3 database has been created and is being updated from images of the second generation series of Meteosat satellites [
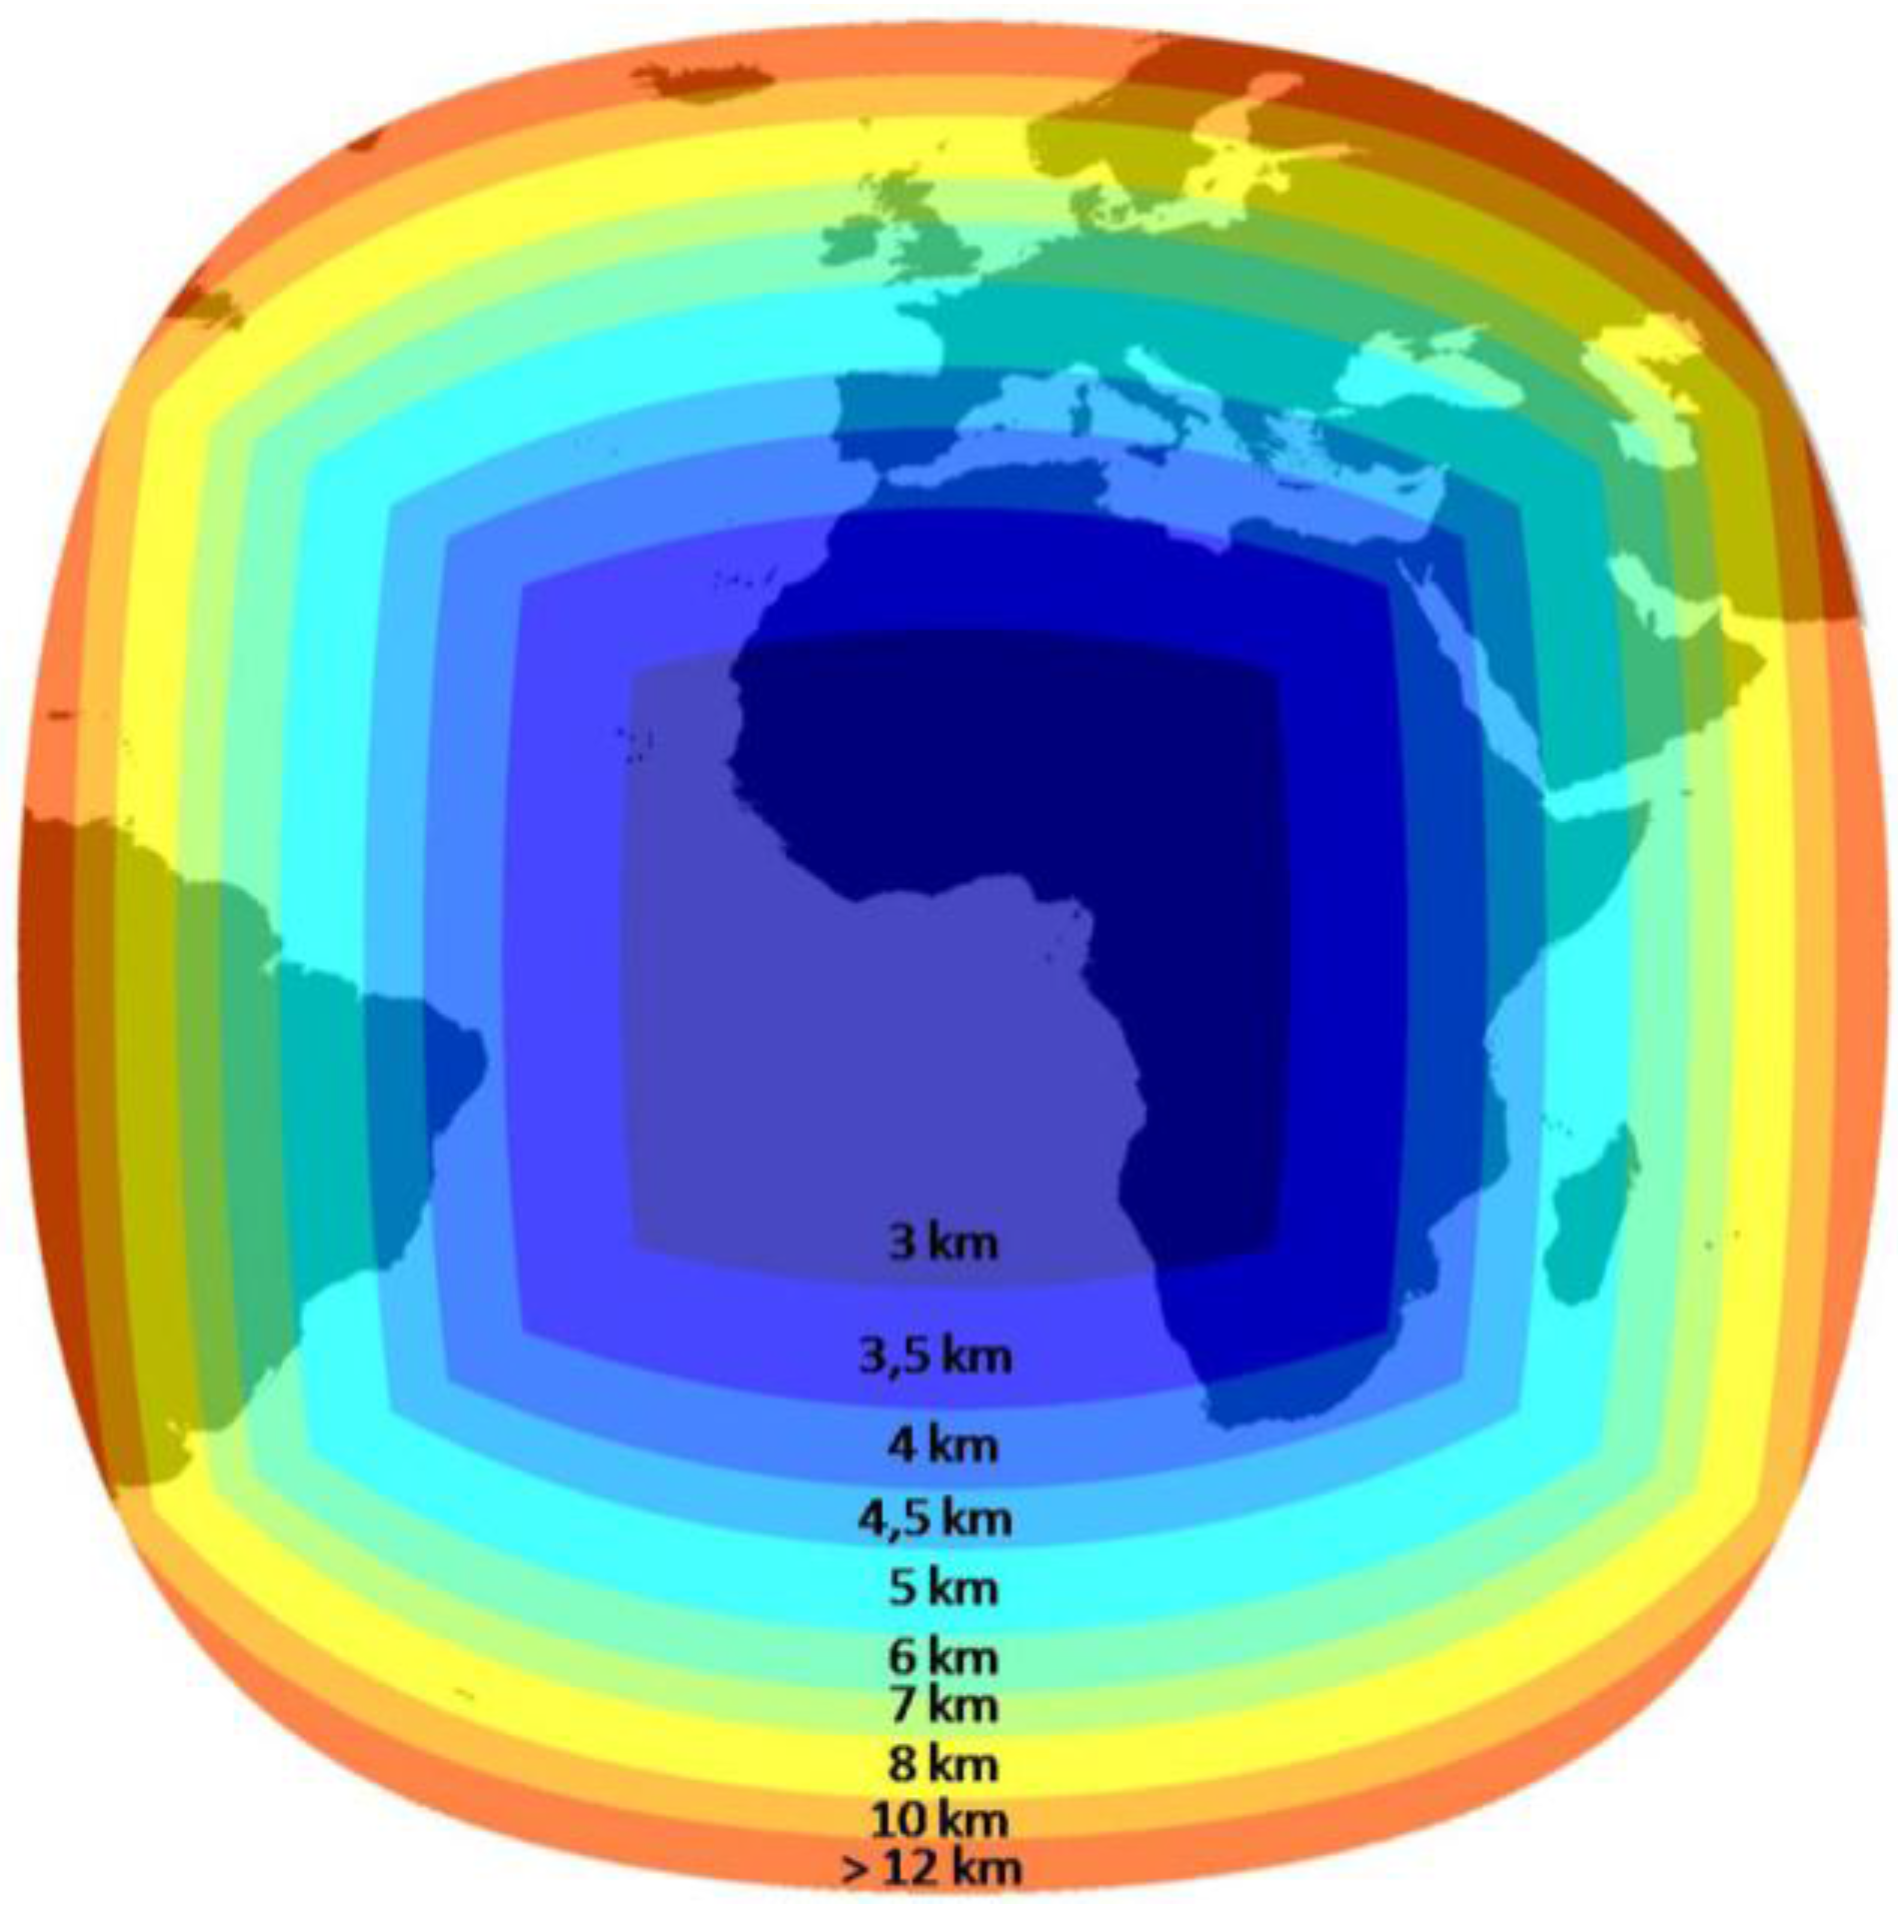
14]. HC3 covers the period from February 2004 to the day before the current day. It is available for any location within the field of view of the SEVIRI (Spinning Enhanced Visible and InfraRed Imager) instrument on board the Meteosat Second Generation satellite. The field of view and spatial resolution of the SEVIRI instrument are shown in
Figure 2. It is evident from
Figure 2 that the spatial resolution of SEVIRI over Egypt is between 3.5 km and 4 km. The shortest temporal step is that of SEVIRI,
i.e., 15 min. The HC3 estimates are also provided at integration periods of 1 h, 1 day and 1 month.
The HC3 database can be accessed by the means of a Web service, i.e. an application that can be invoked
via the Web [
33,
34]. The Heliosat-2 method provides estimates of the GHI only. As a consequence, a post-processing step is applied to estimate the other components: DHI and DNI. The DHI is computed using the decomposition model of Ruiz-Arias [
35]. Knowing the solar zenith angle, the DNI is computed from the GHI and DHI.
The post-processing also includes improvements and corrections to the original HC3 database. The strategy to account for improvements in HC3 was to leave the original database unchanged because it would have required several re-processing of the whole set of images dating back to 2004 and to include changes in the post-processing. Versions HC3v4 and HC3v5 are currently available and are used in this study. The difference between both versions lies in the inclusion of the McClear clear-sky model in HC3v5 as follows. The method Heliosat-2 exploits the ESRA clear-sky model described in [
25], where ESRA stands for European Solar Radiation Atlas [
36]. The ESRA model uses climatological monthly values of the Linke turbidity factor as the main input to describe attenuation of the solar radiation passing through the clear atmosphere [
25,
26]. In HC3v5, the GHI is firstly computed as in HC3v4, then divided by the ESRA clear-sky GHI and eventually multiplied by the McClear clear-sky GHI using the method described in [
37].
Figure 2.
Spatial resolution and coverage of the SEVIRI instrument [
33].
Figure 2.
Spatial resolution and coverage of the SEVIRI instrument [
33].
McClear is a clear-sky model [
18] based on look-up-tables and interpolation functions established with the radiative transfer model libRadtran [
38,
39]. One main advantage of McClear is that it runs 10
5 times faster than libRadtran. McClear exploits the data sets of atmospheric composition provided by the MACC (Monitoring Atmospheric Composition and Climate) projects on a global scale [
40,
41], comprising the aerosol optical depth (AOD) at 550 nm and 1240 nm, and the total column content in water vapor and ozone. For this study period, the MACC AODs and total column content in water vapor and ozone are available at a temporal step of 3 h and a spatial resolution of 1.125°. In the operational version of McClear, an interpolation is applied in space and time to provide such values at any location at a 1 min temporal resolution. McClear denotes also the Web service providing estimates of the cloud-free GHI, DNI and DHI [
33]. It covers the whole world for the time period beginning in 2004 up to current day
d–2.
4. Results
The validation of the estimates of GHI and DNI made by respectively HC3v4, HC3v5 and McClear was made by comparing them to the aforementioned 1 h measurements. Following the ISO (International Organization for Standardization) standard [
42], the deviations were computed by subtracting measurements for each instant from the estimates for each database and they were summarized by the bias, the root mean square error (RMSE), and the squared correlation coefficient, also known as the coefficient of determination (
R2). Relative values are expressed with respect to the mean observed value. The validations of
KT and
KTBn are also included, as they are stricter measures of the performance of a model with respect to the optical state of the atmosphere.
The 2-D histograms between measured and estimated values, also called scatter density plots [
43], are presented for selected cases. Red, respectively dark blue, dots correspond to regions with great, respectively very low, densities of samples. The plots also present the number of samples, the mean reference value, the bias, the RMSE, the correlation coefficient (CC) and the 1:1 line (
y =
x).
4.1. Cloud-Free Conditions
The results of the comparisons for cloud-free cases are presented in
Table 2. It is observed that
R2 is large, greater than 0.80 in most cases with a minimum value of 0.673 for HC3v4 in Kharga. McClear always exhibits greater
R2 than HC3v4 and HC3v5 by large, except for Asyut for which HC3v4 exhibits a similar
R2.
Table 2.
Validation of the global horizontal irradiance (GHI) under cloud-free conditions, the best values for each station are in bold.
Table 2.
Validation of the global horizontal irradiance (GHI) under cloud-free conditions, the best values for each station are in bold.
| Station | Database | # of Samples | Mean W·m−2 | Bias | RMSE | R2 |
|---|
| W·m−2 | % | W·m−2 | % |
|---|
| Arish | HC3v4 | 2259 | 741.4 | +0.8 | 0 | 75.9 | 10 | 0.830 |
| HC3v5 | 2259 | 741.4 | +30.6 | +4 | 75.6 | 10 | 0.832 |
| McClear | 2259 | 741.4 | +91.2 | +12 | 105.2 | 14 | 0.885 |
| Aswan | HC3v4 | 1319 | 855.6 | −47.0 | −5 | 66.6 | 8 | 0.852 |
| HC3v5 | 1319 | 855.6 | −21.8 | −3 | 65.7 | 8 | 0.743 |
| McClear | 1319 | 855.6 | +33.0 | +4 | 48.3 | 6 | 0.922 |
| Asyut | HC3v4 | 4385 | 801.4 | +19.4 | +2 | 52.6 | 7 | 0.898 |
| HC3v5 | 4385 | 801.4 | +30.9 | +4 | 59.9 | 7 | 0.865 |
| McClear | 4385 | 801.4 | +49.4 | +6 | 66.3 | 8 | 0.897 |
| Barrani | HC3v4 | 454 | 644.4 | −59.1 | −9 | 93.2 | 14 | 0.768 |
| HC3v5 | 454 | 644.4 | −20.1 | −3 | 77.6 | 12 | 0.758 |
| McClear | 454 | 644.4 | +85.9 | +13 | 95.9 | 15 | 0.913 |
| Cairo | HC3v4 | 734 | 833.8 | −4.8 | −1 | 65.7 | 8 | 0.853 |
| HC3v5 | 734 | 833.8 | +34.4 | +4 | 79.6 | 10 | 0.800 |
| McClear | 734 | 833.8 | +36.7 | +4 | 52.0 | 6 | 0.918 |
| Kharga | HC3v4 | 6890 | 752.6 | −39.7 | −5 | 97.9 | 13 | 0.673 |
| HC3v5 | 6890 | 752.6 | +33.0 | +4 | 59.3 | 8 | 0.893 |
| McClear | 6890 | 752.6 | +85.7 | +11 | 92.4 | 12 | 0.949 |
| Matruh | HC3v4 | 2004 | 769.5 | −34.9 | −5 | 76.0 | 10 | 0.871 |
| HC3v5 | 2004 | 769.5 | +8.0 | +1 | 61.0 | 8 | 0.899 |
| McClear | 2004 | 769.5 | +72.2 | +9 | 78.1 | 10 | 0.965 |
The bias differs from one database to the other. It is most often negative (underestimation) for HC3v4 and ranges between −59.1 W·m−2 (−9%) and +19.4 W·m−2 (+2%). It is always positive for McClear that overestimates the irradiance: it ranges from +33.0 W·m−2 (+4%) to + 91.2 W·m−2 (+12%). The case of HC3v5 is in-between, with a bias ranging from −21.8 W·m−2 (−3%) to +34.4 W·m−2 (+4%).
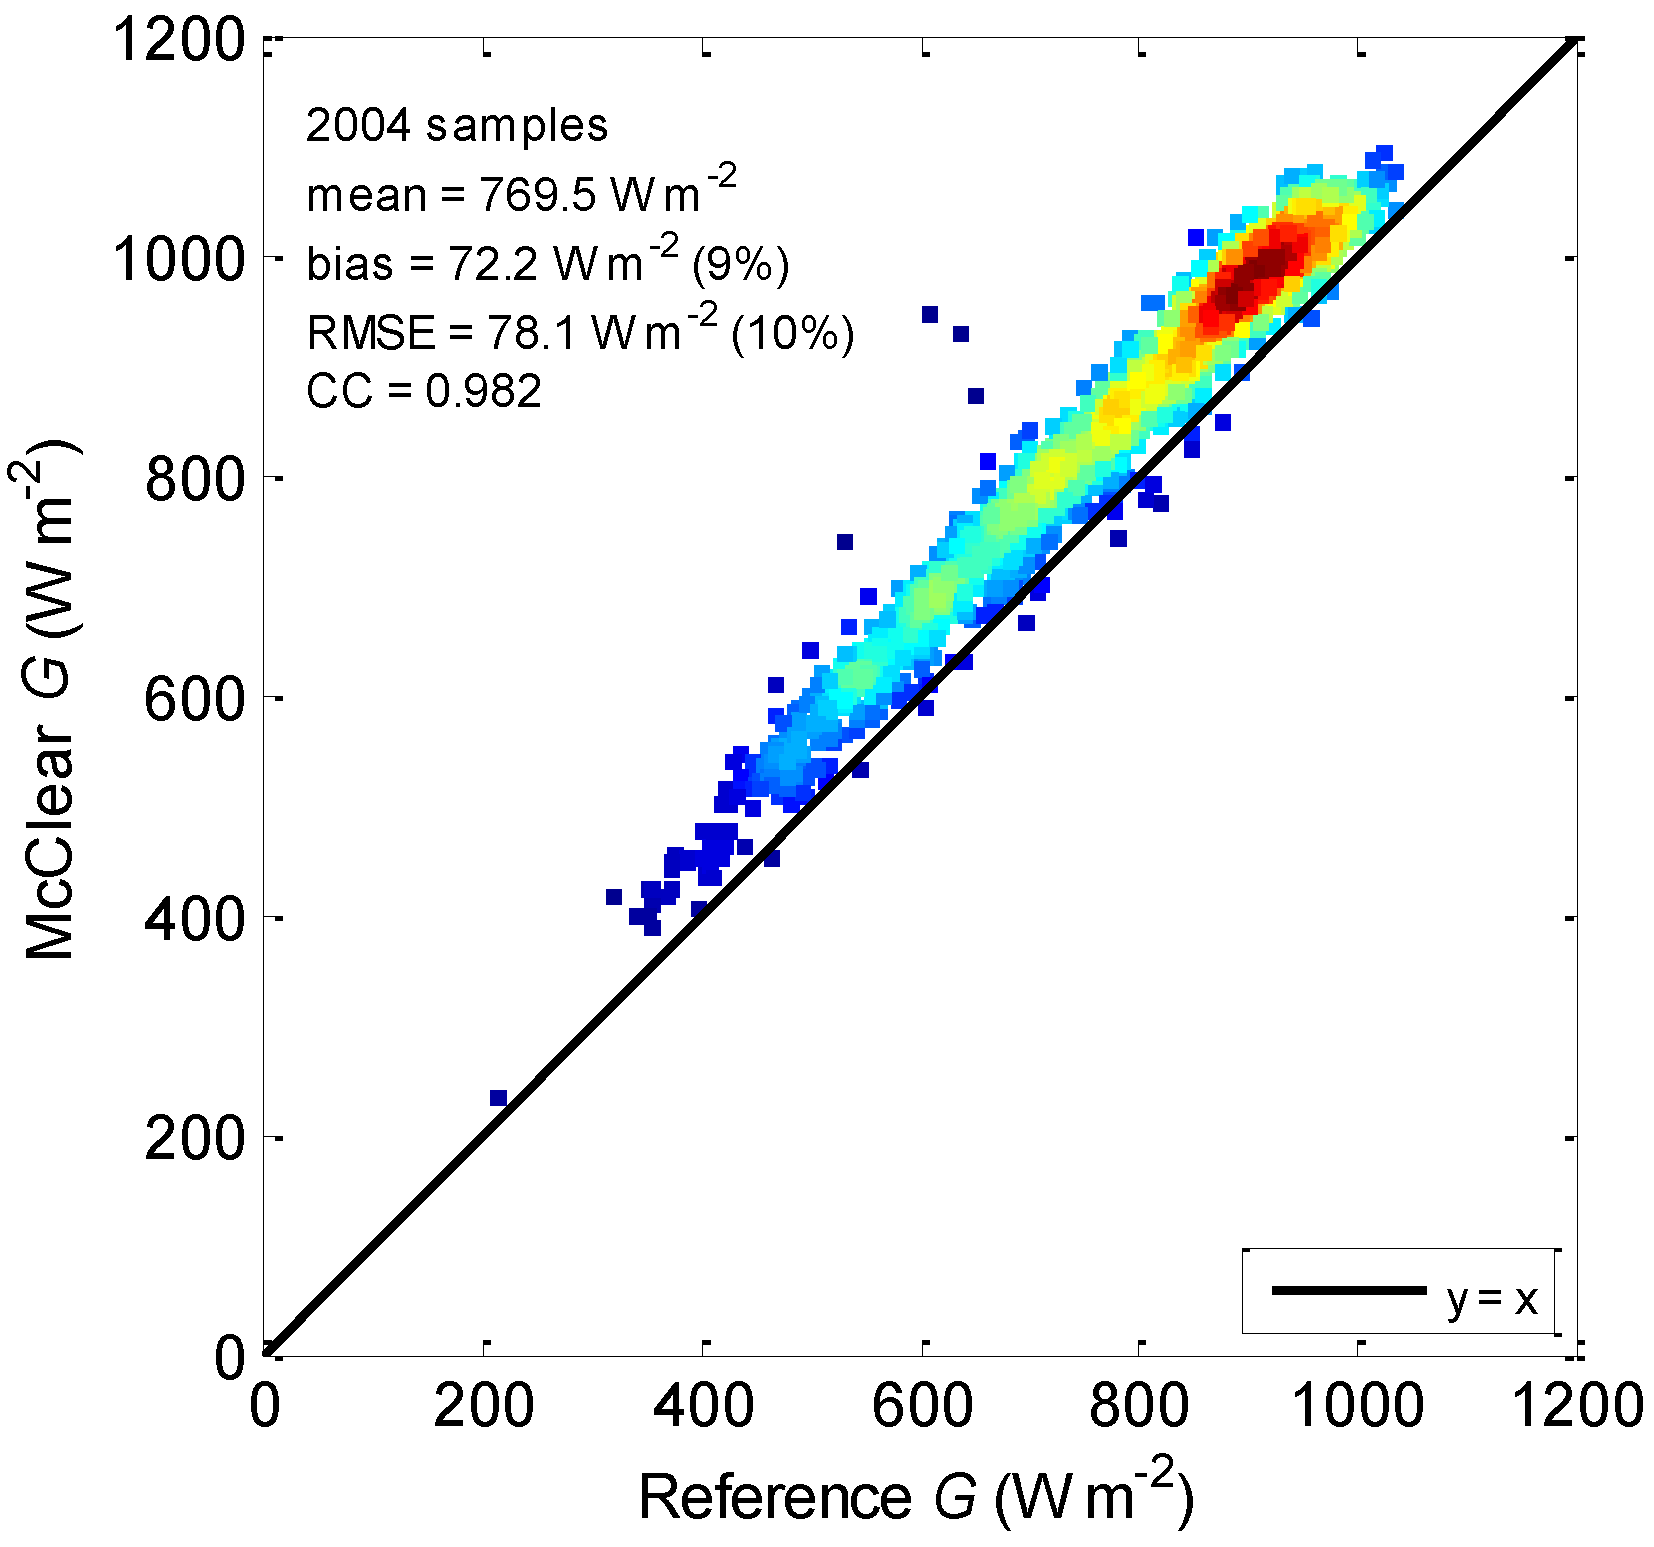
The RMSE depends on the bias as it is the square root of the sum of the bias and the standard deviation. It exhibits fairly constant relative values, ranging between 6% and 15%. HC3v5 exhibits the smallest range, from 59.3 W·m−2 (7%) to 79.6 W·m−2 (12%). The standard deviation, not reported, is always the lowest for McClear. The highest correlation coefficient and the lowest standard deviation of differences implies that McClear is better able to reproduce the temporal variations of the GHI, albeit with a noticeable overestimation.
Figure 3.
Scatter density plot between measurements of GHI and McClear estimates under cloud-free conditions at Matruh.
Figure 3.
Scatter density plot between measurements of GHI and McClear estimates under cloud-free conditions at Matruh.
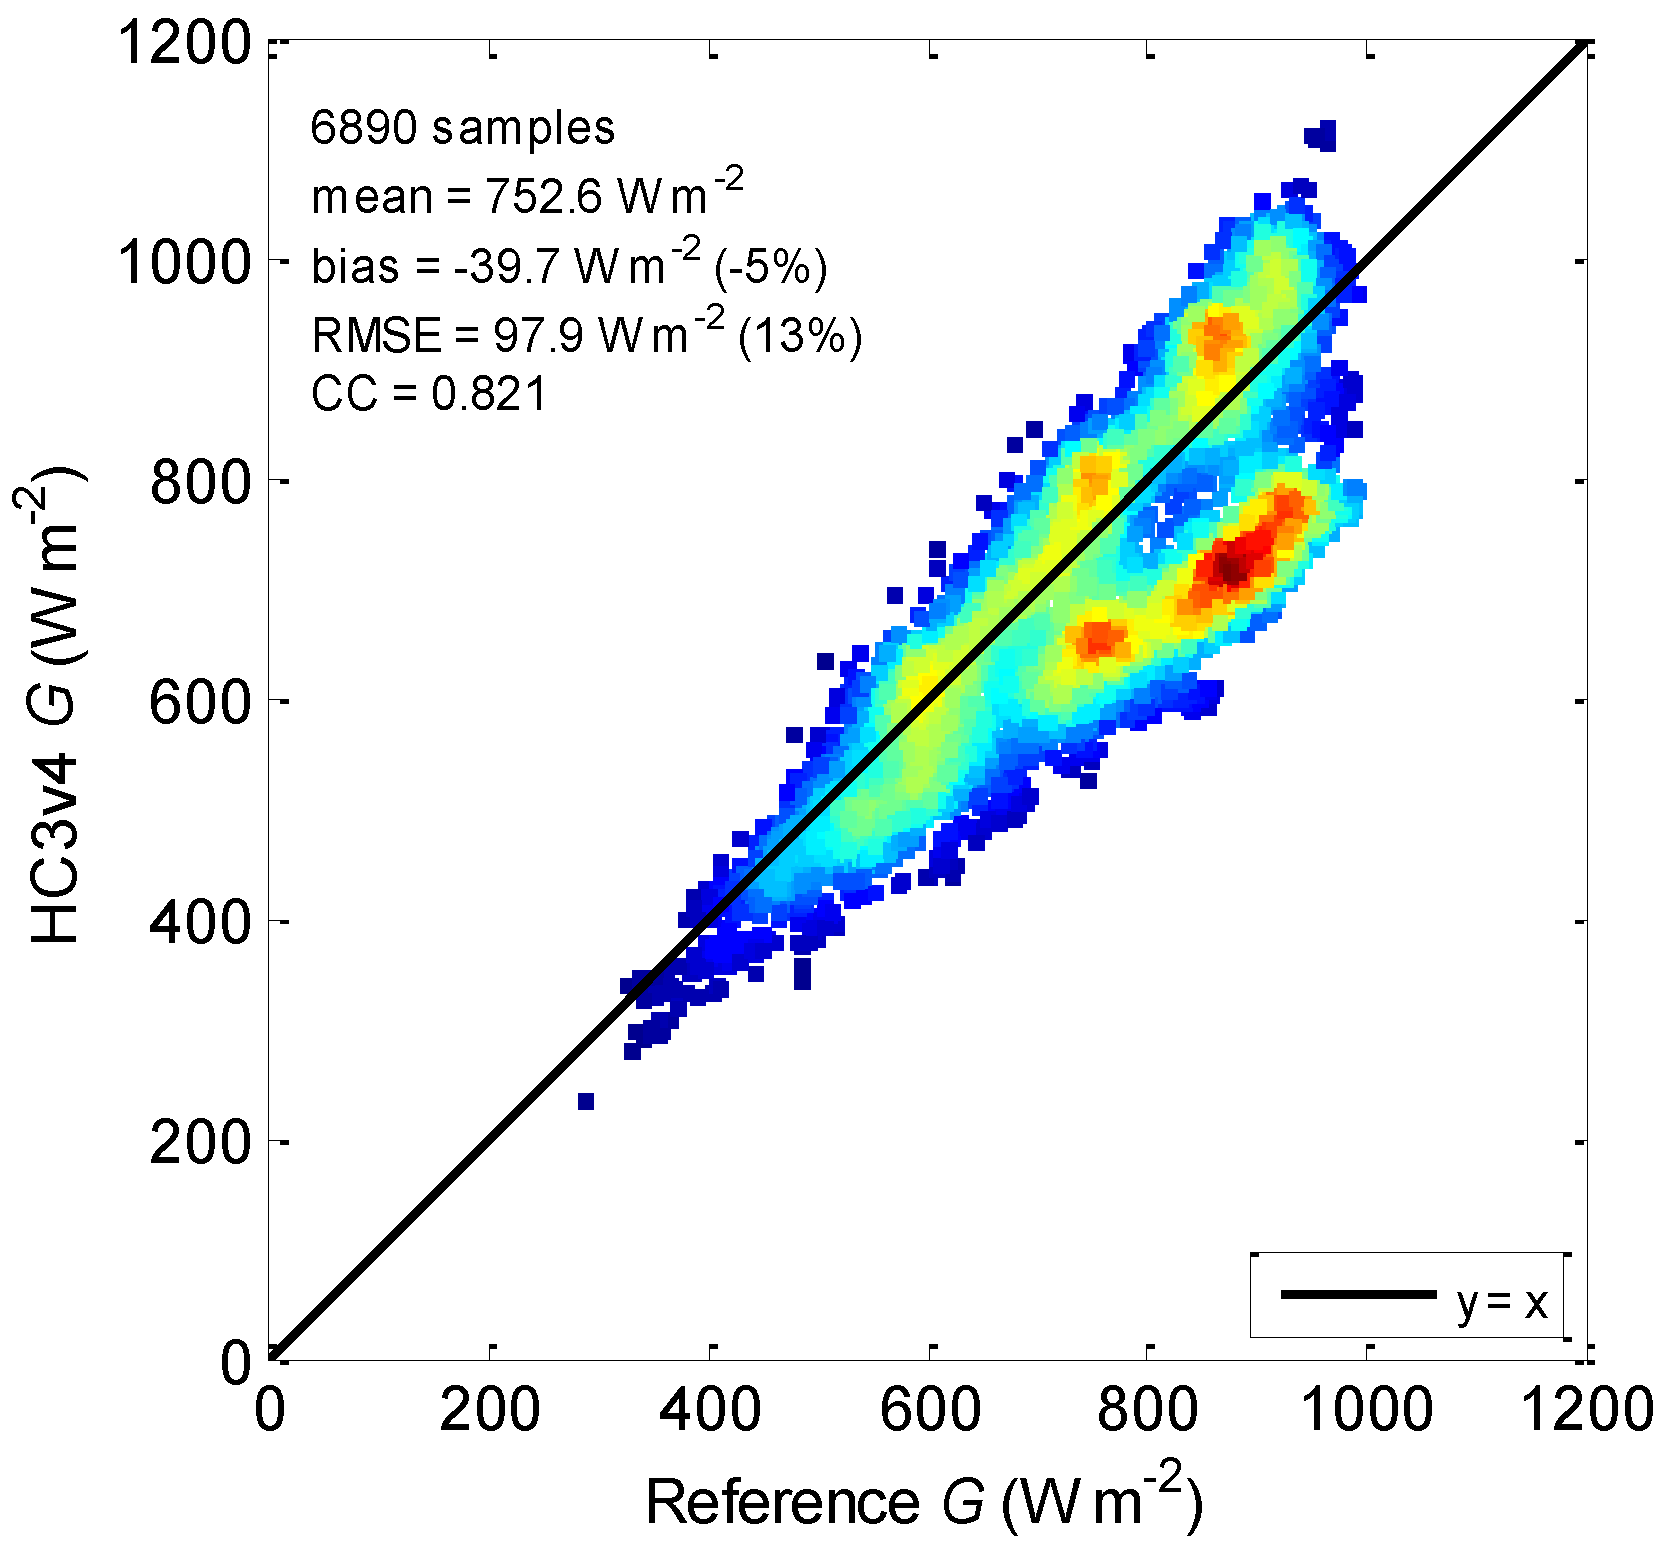
Figure 4.
Scatter density plot between measurements of GHI and HC3v4 estimates under cloud-free conditions at Kharga.
Figure 4.
Scatter density plot between measurements of GHI and HC3v4 estimates under cloud-free conditions at Kharga.
The density scatter plots for the cases exhibiting the greatest and lowest
R2 values, respectively Matruh (McClear) and Kharga (HC3v4), are shown in
Figure 3 and
Figure 4.
Figure 3 illustrates that the temporal variability of the GHI is very well captured by McClear despite a bias of +72 W·m
−2. In
Figure 4, two regions with high densities of samples are observed for reference, slightly above and below 800 W·m
−2. HC3v4 is not reproducing well this situation: it produces both over- and underestimations in both regions. Possible causes are investigated in
Section 5.
Table 3.
Validation of the clearness index KT under cloud-free conditions, the best values for each station are in bold.
Table 3.
Validation of the clearness index KT under cloud-free conditions, the best values for each station are in bold.
| Station | Database | # of Samples | Mean | Bias | RMSE | R2 |
|---|
| | % | | % |
|---|
| Arish | HC3v4 | 2259 | 0.69 | −0.01 | −1 | 0.07 | 10 | 0.124 |
| HC3v5 | 2259 | 0.69 | +0.03 | +4 | 0.07 | 10 | 0.123 |
| McClear | 2259 | 0.69 | +0.09 | +13 | 0.10 | 14 | 0.168 |
| Aswan | HC3v4 | 1319 | 0.74 | −0.04 | −5 | 0.06 | 8 | 0.064 |
| HC3v5 | 1319 | 0.74 | −0.02 | −2 | 0.06 | 8 | 0.032 |
| McClear | 1319 | 0.74 | +0.03 | +4 | 0.05 | 6 | 0.158 |
| Asyut | HC3v4 | 4385 | 0.72 | +0.02 | +2 | 0.05 | 6 | 0.192 |
| HC3v5 | 4385 | 0.72 | +0.03 | +4 | 0.06 | 8 | 0.090 |
| McClear | 4385 | 0.72 | +0.05 | +6 | 0.06 | 9 | 0.116 |
| Barrani | HC3v4 | 454 | 0.67 | −0.06 | −10 | 0.10 | 15 | 0.059 |
| HC3v5 | 454 | 0.67 | −0.02 | −3 | 0.08 | 12 | 0.050 |
| McClear | 454 | 0.67 | +0.09 | +14 | 0.10 | 15 | 0.195 |
| Cairo | HC3v4 | 734 | 0.72 | −0.01 | −1 | 0.07 | 9 | 0.068 |
| HC3v5 | 734 | 0.72 | +0.03 | +4 | 0.08 | 11 | 0.035 |
| McClear | 734 | 0.72 | +0.03 | +4 | 0.05 | 6 | 0.112 |
| Kharga | HC3v4 | 6890 | 0.69 | −0.04 | −5 | 0.09 | 12 | 0.028 |
| HC3v5 | 6890 | 0.69 | +0.03 | +4 | 0.06 | 8 | 0.151 |
| McClear | 6890 | 0.69 | +0.08 | +12 | 0.09 | 13 | 0.235 |
| Matruh | HC3v4 | 2004 | 0.71 | +0.04 | −5 | 0.08 | 11 | 0.215 |
| HC3v5 | 2004 | 0.71 | 0.00 | +1 | 0.06 | 8 | 0.278 |
| McClear | 2004 | 0.71 | +0.07 | +10 | 0.07 | 11 | 0.452 |
Table 4.
Validation of the direct normal irradiance (DNI) under cloud-free conditions, the best values for each station are in bold.
Table 4.
Validation of the direct normal irradiance (DNI) under cloud-free conditions, the best values for each station are in bold.
| Station | Database | # of Samples | Mean W·m−2 | Bias | RMSE | R2 |
|---|
| W·m−2 | % | W·m−2 | % |
|---|
| Aswan | HC3v4 | 1319 | 830.2 | −116.9 | −14 | 147.4 | 18 | 0.098 |
| HC3v5 | 1319 | 830.2 | −42.9 | −5 | 121.1 | 15 | 0.280 |
| McClear | 1319 | 830.2 | −20.6 | −2 | 62.5 | 8 | 0.529 |
| Cairo | HC3v4 | 734 | 766.4 | −49.9 | −7 | 128.9 | 17 | 0.000 |
| HC3v5 | 734 | 766.4 | +64.9 | +8 | 151.4 | 20 | 0.008 |
| McClear | 734 | 766.4 | +31.2 | +4 | 95.9 | 13 | 0.042 |
The results of the comparisons for
KT are presented in
Table 3. The relative bias and RMSE are always very close to those of the corresponding GHI.
R2 is always lower because unlike the GHI which varies greatly with
θS, but such temporal variation is well reproduced by the models, the
KT varies much less with
θS and has a narrow range of values around 0.7 since only cloud-free cases are dealt with here. The
KT is a stricter indicator with regards to the ability of the model to estimate the optical state of the atmosphere. Except for Asyut, McClear estimates exhibit the highest
R2 values and lowest standard deviation of differences, while the bias is always better for HC3v4 or HC3v5.
The results of the comparisons of DNI for cloud-free cases are presented in
Table 4, for the two stations with DNI measurements, Aswan and Cairo. The McClear estimates always perform better than HC3v4 and HC3v5 in terms of bias, RMSE and
R2. For Aswan, shown in
Figure 5, the relative bias is −2%, the relative RMSE is 8% and
R2 is 0.529. For Cairo, even though the McClear estimates outperform those of HC3v4 and HC3v5, the
R2 is very low at 0.042. This is due to the selected cloud-free cases which have a very narrow range for the DNI values, as illustrated in
Figure 6. The results of the comparison for
KTBn are given in
Table 5, where the relative errors and
R2 values are very close to those of
Table 4 indicating the ability of McClear to reproduce the optical state of the atmosphere in terms of the transmittance of the beam radiation.
Figure 5.
Scatter density plot between measurements of DNI and McClear estimates under cloud-free conditions at Aswan.
Figure 5.
Scatter density plot between measurements of DNI and McClear estimates under cloud-free conditions at Aswan.
Figure 6.
Scatter density plot between measurements of DNI and McClear estimates under cloud-free conditions at Cairo.
Figure 6.
Scatter density plot between measurements of DNI and McClear estimates under cloud-free conditions at Cairo.
Table 5.
Validation of the direct normal clearness index KTBn under cloud-free conditions, the best values for each station are in bold.
Table 5.
Validation of the direct normal clearness index KTBn under cloud-free conditions, the best values for each station are in bold.
| Station | Database | # of Samples | Mean | Bias | RMSE | R2 |
|---|
| | % | | % |
|---|
| Aswan | HC3v4 | 1319 | 0.61 | −0.09 | −14 | 0.11 | 18 | 0.030 |
| HC3v5 | 1319 | 0.61 | −0.03 | −5 | 0.09 | 15 | 0.136 |
| McClear | 1319 | 0.61 | −0.02 | −3 | 0.05 | 8 | 0.445 |
| Cairo | HC3v4 | 734 | 0.57 | −0.04 | −6 | 0.09 | 16 | 0.015 |
| HC3v5 | 734 | 0.57 | +0.05 | +9 | 0.11 | 19 | 0.015 |
| McClear | 734 | 0.57 | +0.02 | +4 | 0.07 | 12 | 0.042 |
4.2. All-Sky Conditions
The results of the comparisons for the all-sky GHI from HC3v4 and HC3v5 are presented in
Table 6. It is observed that, as a whole, both versions exhibit satisfactory results. However, results from Barrani are not in line with the others; possible causes are investigated further in
Section 5. Except for this site,
R2 is large, greater than 0.80 in all cases and both versions provide more or less the same
R2.
The bias differs between HC3v4 and HC3v5 though the extrema are reached for the same stations. Like for the cloud-free cases, the bias is most often negative (underestimation) for HC3v4 and ranges between −23.3 W·m−2 (−3%) and +24.0 W·m−2 (+4%). On the contrary, it is positive for all stations but one for HC3v5 that overestimates the irradiance: it ranges from −9.2 W·m−2 (−1%) to +29.4 W·m−2 (+5%). The RMSE is very similar for both versions and all stations. Since the biases are different, it means that there are compensations by the standard deviation which is low when the bias is large.
Table 6.
Validation of the GHI under all-sky conditions, the best values for each station are in bold.
Table 6.
Validation of the GHI under all-sky conditions, the best values for each station are in bold.
| Station | Database | # of Samples | Mean W·m−2 | Bias | RMSE | R2 |
|---|
| W·m−2 | % | W·m−2 | % |
|---|
| Arish | HC3v4 | 12,892 | 504.6 | +2.8 | +1 | 87.9 | 17 | 0.878 |
| HC3v5 | 12,892 | 504.6 | +20.9 | +4 | 90.1 | 18 | 0.883 |
| Aswan | HC3v4 | 4550 | 692.4 | −23.3 | −3 | 66.4 | 10 | 0.923 |
| HC3v5 | 4550 | 692.4 | −9.2 | −1 | 68.4 | 10 | 0.909 |
| Asyut | HC3v4 | 19,778 | 572.3 | +24.0 | +4 | 72.6 | 13 | 0.925 |
| HC3v5 | 19,778 | 572.3 | +29.4 | +5 | 76.6 | 13 | 0.922 |
| Barrani | HC3v4 | 8207 | 512.3 | −16.4 | −3 | 153.6 | 30 | 0.673 |
| HC3v5 | 8207 | 512.3 | +1.3 | 0 | 151.7 | 30 | 0.680 |
| Cairo | HC3v4 | 3529 | 590.4 | −2.1 | 0 | 77.7 | 13 | 0.913 |
| HC3v5 | 3529 | 590.4 | +27.9 | +5 | 89.8 | 15 | 0.906 |
| Kharga | HC3v4 | 16,732 | 586.0 | −15.9 | −3 | 100.9 | 17 | 0.827 |
| HC3v5 | 16,732 | 586.0 | +23.6 | +4 | 78.0 | 13 | 0.914 |
| Matruh | HC3v4 | 14,859 | 521.9 | −10.3 | −2 | 117.0 | 22 | 0.798 |
| HC3v5 | 14,859 | 521.9 | +16.6 | +3 | 116.9 | 22 | 0.809 |
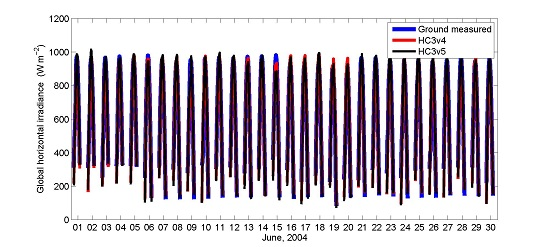
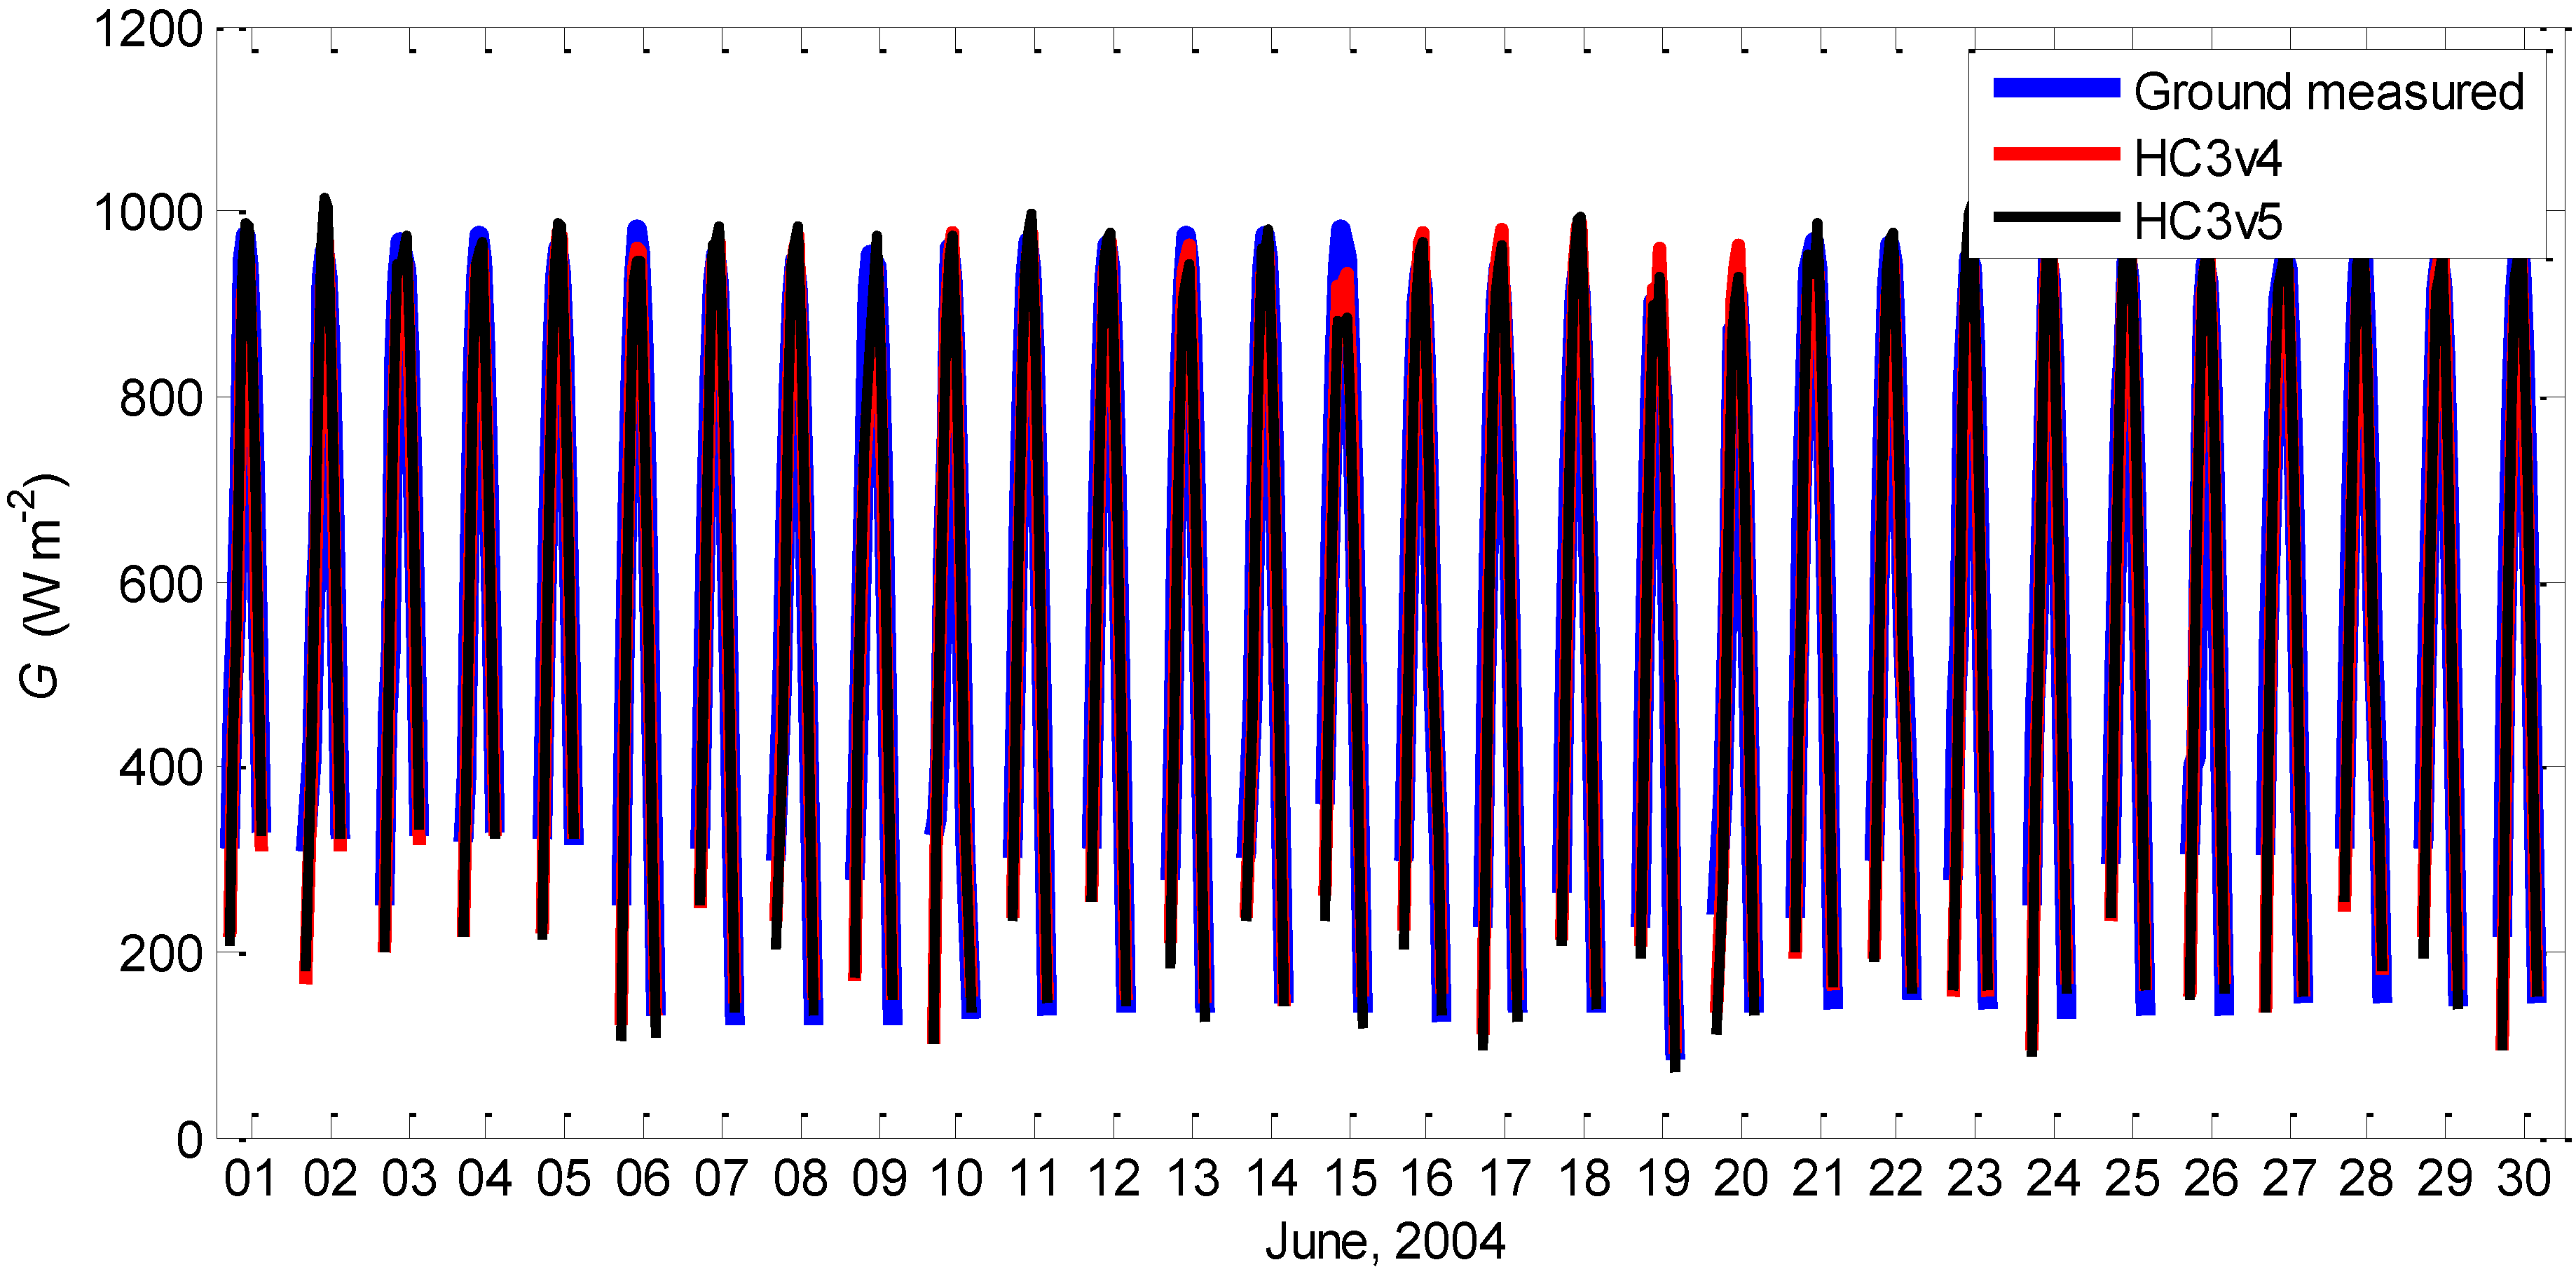
Figure 7 exhibits a time series of the ground measured, HC3v4 and HC3v5 GHI for the month of June 2004 for the Arish station. This specific month and station were selected based on the temporally continuous ground data which have passed the quality control procedures. It is evident from
Figure 7 that both databases capture the temporal variability and the absolute values of the GHI very well.
Figure 7.
Time series of the ground measured, HC3v4 and HC3v5 GHI under all-sky conditions for the month of June, 2004 for the Arish station.
Figure 7.
Time series of the ground measured, HC3v4 and HC3v5 GHI under all-sky conditions for the month of June, 2004 for the Arish station.
Table 7.
Validation of the clearness index KT under all-sky conditions, the best values for each station are in bold.
Table 7.
Validation of the clearness index KT under all-sky conditions, the best values for each station are in bold.
| Station | Database | # of Samples | Mean | Bias | RMSE | R2 |
|---|
| | % | | % |
|---|
| Arish | HC3v4 | 12,892 | 0.57 | −0.01 | −1 | 0.11 | 20 | 0.488 |
| HC3v5 | 12,892 | 0.57 | +0.01 | +3 | 0.11 | 20 | 0.510 |
| Aswan | HC3v4 | 4550 | 0.69 | −0.02 | −3 | 0.07 | 10 | 0.488 |
| HC3v5 | 4550 | 0.69 | −0.01 | −1 | 0.07 | 11 | 0.500 |
| Asyut | HC3v4 | 19,778 | 0.63 | +0.03 | +4 | 0.10 | 16 | 0.447 |
| HC3v5 | 19,778 | 0.63 | +0.03 | +5 | 0.11 | 17 | 0.446 |
| Barrani | HC3v4 | 8207 | 0.56 | −0.02 | −4 | 0.19 | 33 | 0.207 |
| HC3v5 | 8207 | 0.56 | 0.00 | 0 | 0.19 | 33 | 0.217 |
| Cairo | HC3v4 | 3529 | 0.62 | −0.01 | −1 | 0.09 | 15 | 0.575 |
| HC3v5 | 3529 | 0.62 | +0.03 | +4 | 0.10 | 17 | 0.567 |
| Kharga | HC3v4 | 16,732 | 0.63 | −0.02 | −3 | 0.11 | 18 | 0.180 |
| HC3v5 | 16,732 | 0.63 | +0.02 | +3 | 0.10 | 16 | 0.394 |
| Matruh | HC3v4 | 14,859 | 0.59 | −0.02 | −3 | 0.16 | 28 | 0.283 |
| HC3v5 | 14,859 | 0.59 | +0.01 | +2 | 0.16 | 28 | 0.304 |
The results of the comparison for the all-sky
KT are presented in
Table 7. Like for GHI, it is observed that as a whole, both versions exhibit satisfactory results, except for Barrani. The bias and RMSE exhibit similar figures than for the GHI. As pointed out earlier, the
R2 is always smaller than those of the GHI estimates.
R2 indicates how much of the information contained in the measurements is reproduced by a model. It appears that in most cases, only half of this information on atmospheric transmittance is conveyed by HC3v4 or HC3v5.
R2 is very low for HC3v4 over Kharga; this is discussed in
Section 5.
The results of the comparisons of the DNI under all-sky conditions are presented in
Table 8 and in
Table 9 for
KTBn. HC3v5 estimates perform notably better over Aswan in terms of bias and RMSE, while over Cairo HC3v4 performs notably better in terms of bias and RMSE. HC3v5 performs better for
R2.
Table 8.
Validation of the DNI under all-sky conditions, the best values for each station are in bold.
Table 8.
Validation of the DNI under all-sky conditions, the best values for each station are in bold.
| Station | Database | # of Samples | Mean W·m−2 | Bias | RMSE | R2 |
|---|
| W·m−2 | % | W·m−2 | % |
|---|
| Aswan | HC3v4 | 4550 | 691.7 | −44.8 | −6 | 169.2 | 24 | 0.364 |
| HC3v5 | 4550 | 691.7 | −1.7 | 0 | 159.7 | 23 | 0.480 |
| Cairo | HC3v4 | 3529 | 525.4 | +35.9 | +7 | 166.3 | 32 | 0.534 |
| HC3v5 | 3529 | 525.4 | +112.6 | +21 | 213.2 | 41 | 0.545 |
Table 9.
Validation of the direct normal clearness index KTBn under all-sky conditions, the best values for each station are in bold.
Table 9.
Validation of the direct normal clearness index KTBn under all-sky conditions, the best values for each station are in bold.
| Station | Database | # of Samples | Mean | Bias | RMSE | R2 |
|---|
| | % | | % |
|---|
| Aswan | HC3v4 | 4550 | 0.51 | −0.03 | −7 | 0.12 | 24 | 0.345 |
| HC3v5 | 4550 | 0.51 | 0.00 | −1 | 0.12 | 23 | 0.454 |
| Cairo | HC3v4 | 3529 | 0.39 | +0.03 | +7 | 0.12 | 31 | 0.545 |
| HC3v5 | 3529 | 0.39 | +0.08 | +21 | 0.16 | 40 | 0.553 |
5. Discussion
In the results section, the results of the HC3v4, HC3v5, and McClear GHI and DNI estimates were validated by comparison with the quality checked surface measurements. In this validation, the cloud-free conditions were studied first and separately from the all-sky ones. The criteria used for discriminating the cloud-free conditions, Equations (14) and (15), are very strict in the sense that they do not only eliminate all the cloud-contaminated situations, they also most certainly reject some episodes of heavy aerosol loadings (e.g., due to dust storms or pollution) during which the DNI is severely reduced and KD becomes larger than 0.3. This severity of the cloud screening is the price to be paid to ensure that only the impact of the aerosols is taken into account in the examination of the so-called cloud-free cases.
The first effect of the high aerosol loading situations leads to a pronounced reduction in the DNI. The second effect is the scattering of the incoming radiation in other directions than the one of incidence and this corresponds to an increase in the diffuse fraction. Regarding the first effect, the fact that McClear outperforms both HC3v4 and HC3v5 in terms of bias (−2% for Aswan and +4% for Cairo), RMSE and R2 for the cases of the cloud-free DNI estimates, along with the lower standard deviation of differences, illustrates the ability of McClear to predict accurately the temporal and spatial variability of the DNI. These are good indicators of the general quality of the MACC AOD products.
Regarding the second effect, the results of the comparison for the cloud-free GHI for all stations also reveal that the McClear estimates always have the smallest standard deviation of differences, and the largest
R2, except for Asyut where it is very similar to that of HC3v4. This shows that as for the DNI, McClear is better able than HC3v4 and HC3v5 to predict the temporal variability of the GHI. However, the bias of the McClear GHI estimates is always worse than those of HC3v4 or HC3v5. This bias is also positive, which indicates that in spite of the correct estimation of the DNI, the GHI is overestimated by McClear. In turn, this means that the diffuse component is overestimated. This could be explained by errors made when estimating the types of aerosols in McClear [
18]. For instance an overestimation of the fine, strongly diffusing pollution particles associated with an underestimation of the coarse, not so diffusing, mineral dust particles would not affect the DNI but certainly the DHI and consequently the GHI. It should be added that the MACC data on aerosols have a temporal resolution of 3 h and a spatial resolution of 1.125° which makes it difficult to capture the exact atmospheric effects on the incident solar radiation over a specific site.
This difficulty of MACC to reproduce the spatial and temporal complexity of the aerosol mixture could also explain the observation that the deviations of the McClear products from the reference surface measurements are not the same at all stations (see
Table 2,
Table 3,
Table 4 and
Table 5) and also depend on the season. For instance, several stations such as Arish, Asyut and Matruh do not exhibit any particular dependence to
θS, the solar azimuth angle
φS or the season for the residuals of the McClear GHI, whereas others such as Aswan (shown in
Figure 8), and to a lesser extent Kharga, do. In these last two stations, the overestimation of the GHI is largest during the winter season and is almost negligible during the summer season, as shown in
Figure 8 for Aswan. This is also observed in the residuals with respect to
φS, where the bias is negligible for
φS < 120° or
φS > 250° which occur during the summer months and overestimated elsewhere. Again, this suggests that the MACC AOD estimates exhibit a bias characterized by a seasonal dependency, which has also been observed in [
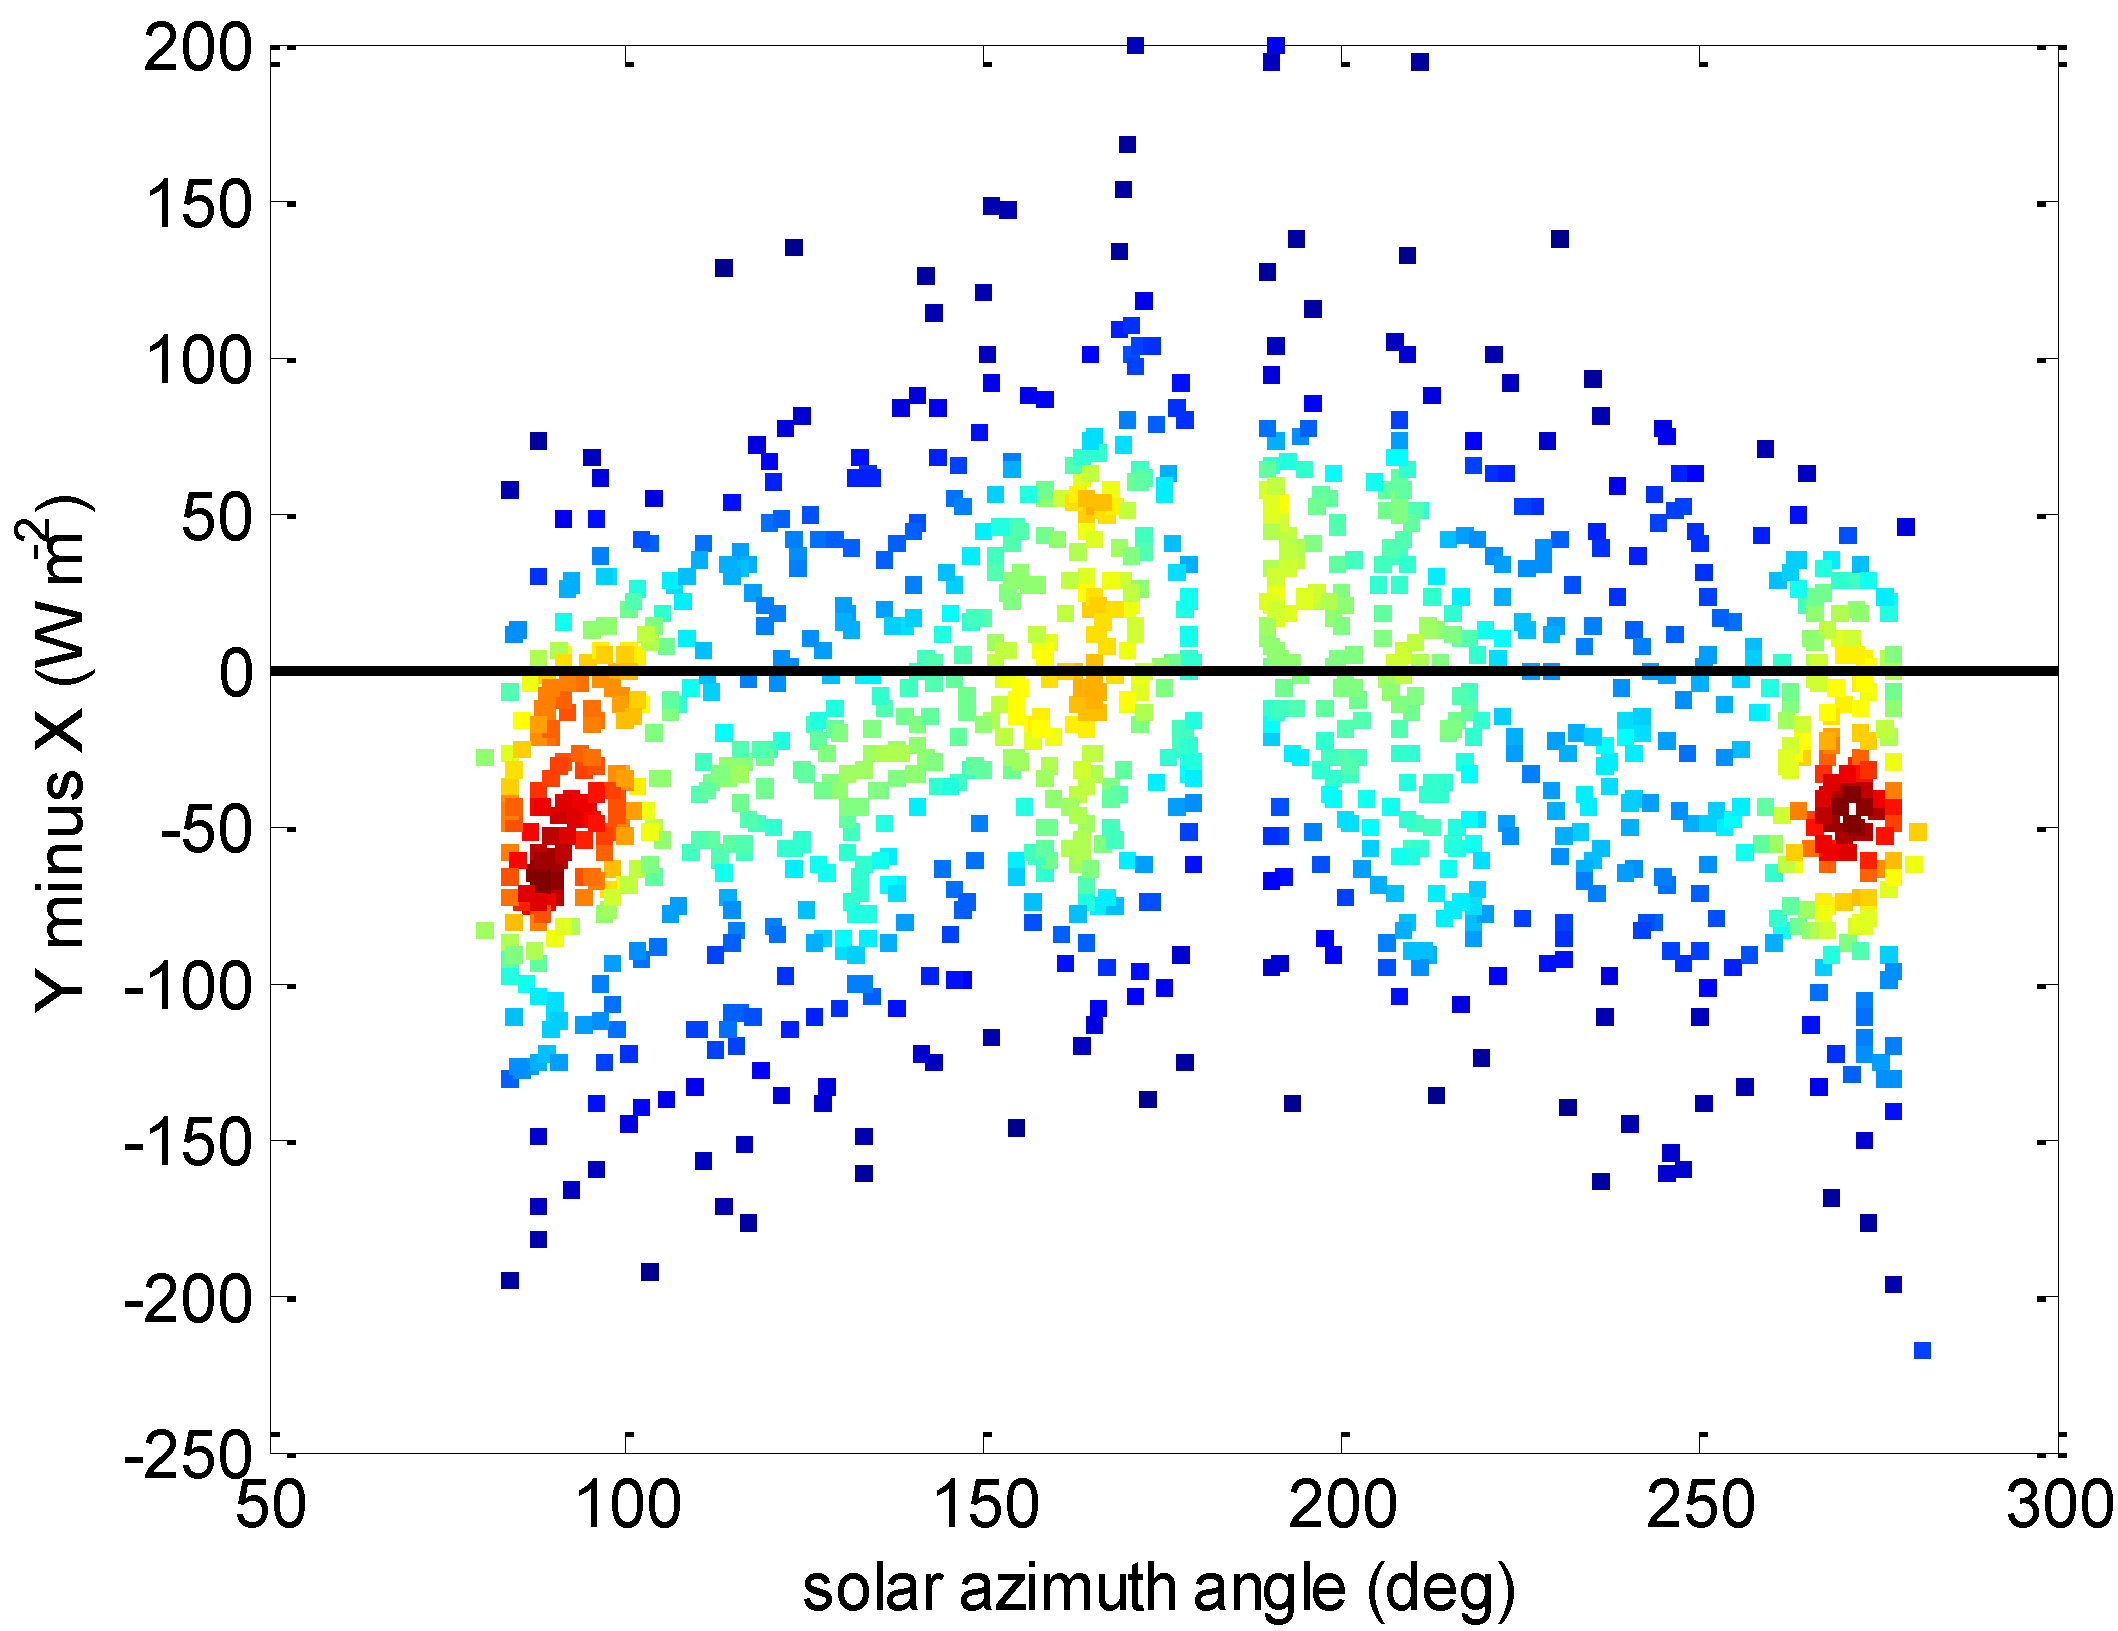
44]. To further support this claim, the residuals of the McClear DNI
versus φS for Aswan are exhibited in
Figure 9, where an underestimation for
φS < 120° or
φS > 250° is evident. Such cases occur during the summer months. This implies an overestimation of the MACC AOD during the summer months over Aswan, and a negligible bias for the other months of the year. Considering the patterns observed in Aswan for the McClear GHI and DNI estimates, this indicates that the McClear DHI exhibits an overestimation for all months. In other words, an overestimation of the DHI and underestimation of DNI for
φS < 120° and
φS > 250° correspond to negligible bias in the GHI for the summer months, and an overestimation of the DHI and negligible bias in the DNI elsewhere correspond to an overestimation in the GHI for the remaining months.
This fairly large overestimation of the GHI by McClear, from +4% to +13% for all stations, has not been observed in other similar works. A slight overestimation of +1 and +2% respectively for Tamanrasset and Sede Boqer has been reported [
18], and a bias ranging from −1% to +6% has been reported for seven sites in the United Arab Emirates [
45]. Unfortunately, the number of stations measuring the DNI is rather small and this makes it difficult to analyze thoroughly the causes of the overestimation of the GHI by McClear. Interestingly, the bias of +31 W·m
−2 (+4%) in the DNI in Cairo is similar to the one of the GHI: +37 W·m
−2 (+4%), which suggests that the bias in the GHI is induced by that in DNI and this may be explained by an underestimation of the AOD in the MACC database. On the contrary, the bias of −21 W·m
−2 (−2%) in the DNI in Aswan is opposed to that in the GHI: +33 W·m
−2 (+4%), which, as discussed earlier, is due to an overestimation in the DHI.
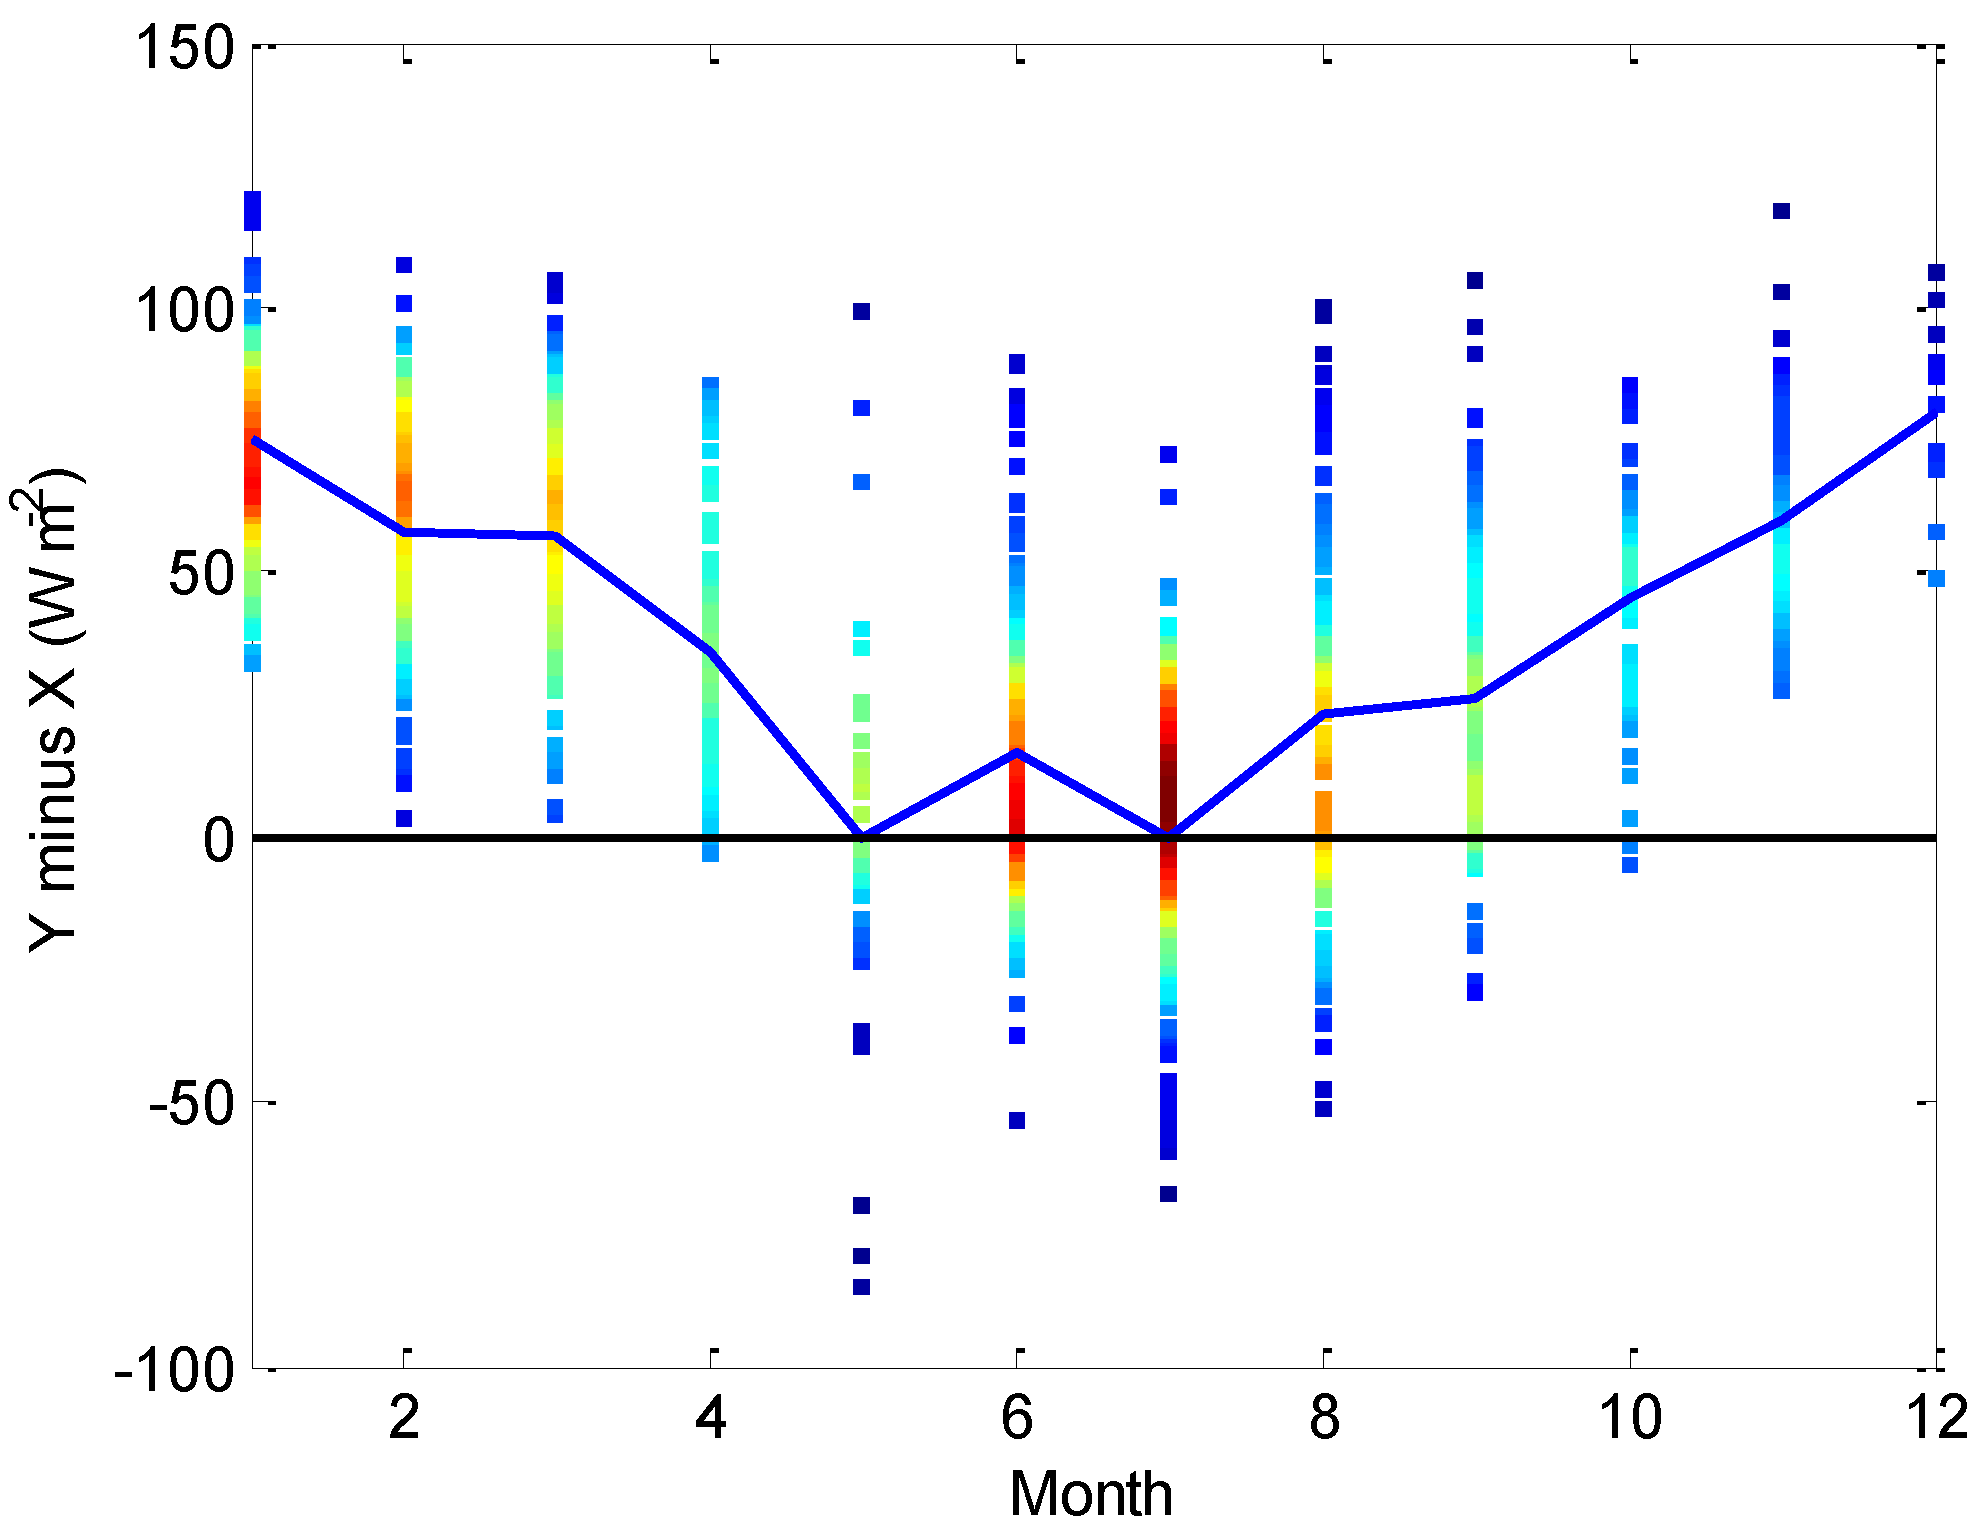
Figure 8.
Residuals (McClear GHI minus ground measured GHI) versus the month for Aswan under cloud-free conditions. The blue line presents the monthly mean of the residuals.
Figure 8.
Residuals (McClear GHI minus ground measured GHI) versus the month for Aswan under cloud-free conditions. The blue line presents the monthly mean of the residuals.
Figure 9.
Residuals (McClear DNI minus ground measured DNI) versus the solar azimuth angle for Aswan under cloud-free conditions.
Figure 9.
Residuals (McClear DNI minus ground measured DNI) versus the solar azimuth angle for Aswan under cloud-free conditions.
One conclusion to be drawn for this variety of figures and situations is that errors in the DNI and GHI estimates by McClear depend on the location of the station and may vary with the season of the year. Another observation is that the bias in the McClear GHI is largest for the Arish (+12%), Matruh (+9%) and Barrani (+13%) stations, which are all coastal stations. In order to understand why, the ability of MACC to simulate the exact composition of the aerosol in the area of study must be investigated further.
The second conclusion is that both HC3 versions provide very similar performances for the cloud-free cases in spite of the fact that the HC3v4 version depends on the simplified ESRA clear-sky model, which uses the monthly climatological value of the Linke turbidity factor as the sole variable to describe all the attenuating factors present in the atmosphere. For instance, in Arish the relative bias is better for HC3v4 (0%) but the relative RMSE is better for HC3v5 (10%). In Cairo, HC3v4 also presents the best relative bias at −1%. In Asyut the HC3v4 estimates provide the better statistical indicators, with a relative bias of +2%, a relative RMSE of 7% and
R2 of 0.898. For Kharga, the very low correlation attained by the HC3v4 cloud-free GHI estimates, shown in
Figure 4, is due to a sudden underestimation in the GHI for
φS < 120° or
φS > 240°. This underestimation may be caused by an overestimation in the Heliosat-2 cloud index due to misclassifications of cloud-free conditions as cloudy, which may occur in the cases of abnormally high albedo at certain Sun positions.
Similarly, neither HC3v4 nor HC3v5 stand out in terms of providing the best estimates for the all-sky GHI. It varies for the different locations. One interesting observation is that the RMSE and R2 are always worse for Arish, Barrani and Matruh than for the other stations. The common feature is that these stations are all coastal stations. This may be caused as a result of the spatial resolution of the SEVIRI instrument over those stations which is ~4 km, implying that the pixels of the coastal stations exhibit both water and land cover characteristics which causes errors in the cloud index. For Barrani, which is only 0.5 km away from the Mediterranean coast, the relative RMSE is the highest, being 30% for both HC3v4 and HC3v5, and the R2 is the lowest, being 0.673 for HC3v4 and 0.680 for HC3v5. The residuals with respect to φS for both HC3v4 and HC3v5 reveal a great overestimation for φS < 120° and great underestimation for φS > 270°. Because for the vast majority of cases, the estimated all-sky GHI is proportional to 1 minus the cloud index, this implies that during the summer months the cloud index of the Heliosat-2 method is greatly underestimated during the morning hours, and greatly overestimated during the afternoon hours. No dependency of the residuals is observable with respect to the season; for the summer months cases the errors cancel out and do not show.
As for the all-sky DNI, HC3v4 performs better over Cairo and HC3v5 performs better over Aswan. The residuals of HC3v4 over Cairo present no observable bias with respect to θS, φS or the seasons. The residuals of HC3v5 over Aswan present a similar pattern to those of McClear, previously discussed.
6. Conclusions
In this article, the performances of HC3v4 and HC4v5, and of McClear for cloud-free cases, were assessed over seven sites located in Egypt. For the cloud-free skies, the McClear GHI estimates always provide the largest R2 comprised between 0.885 to 0.965 and the smallest standard deviation of differences between 4% to 7% of the mean reference values, whereas the bias is better for either the HC3v4 or HC3v5 estimates, with the best values ranging from −3% to +4% for the seven stations. For the cloud-free DNI estimates, McClear provides an overall better performance for the two stations with available DNI measurements. The relative bias, relative RMSE and R2 are respectively −2%, 8% and 0.529 for Aswan and +4%, 13% and 0.042 for Cairo.
For the all-sky GHI and DNI, the performances of HC3v4 and HC3v5 are very similar. For both versions, greater errors are observed in the estimated GHI for the three near-coastal stations than for the others; this is attributed to errors in the Heliosat-2 cloud index due to the coarse spatial resolution of the SEVIRI instrument over those stations.
Since McClear is a physical model, the errors attributed to its estimates are expected to be predominantly the results of errors in its inputs. Therefore, higher quality inputs to McClear would improve its estimates. Oumbe
et al. [
46] and Eissa
et al. [
45] have shown a +26% overestimation in average of the MACC AOD at 550 nm for 16 stations located in the desert environment of the United Arab Emirates. A study is underway to validate the MACC AOD and total column content in water vapor estimates with respect to reference values from the AERONET [
47] stations of the countries of the North Africa and Arabian Peninsula regions. Although McClear is able to better capture the temporal variability of the irradiance estimates, the bias is in many cases non-negligible. Therefore, an in-depth analysis on the errors of the MACC products could help identify patterns, if any, on the errors of the McClear estimates, and further of the HC3v5 estimates, to perhaps improve them further.
A further step in the mapping of solar resource in Egypt will be to perform a similar study but with a model dedicated to desert areas [
8] and the new Heliosat-4 method. The latter is based on the approximation of Oumbe
et al. [
48] and employs the McClear clear-sky estimates and the physical model McCloud model [
49,
50] that estimates the attenuation of solar radiation due to the presence of clouds to estimate the irradiance under all-sky conditions. The results of the two studies will be compared; possible improvements of one method may be performed to obtain accurate maps of solar resource.


