
Validation of Land Cover Products Using Reliability Evaluation Methods


Abstract
:
1. Introduction
2. Methodology
2.1. Result Reliability Evaluation
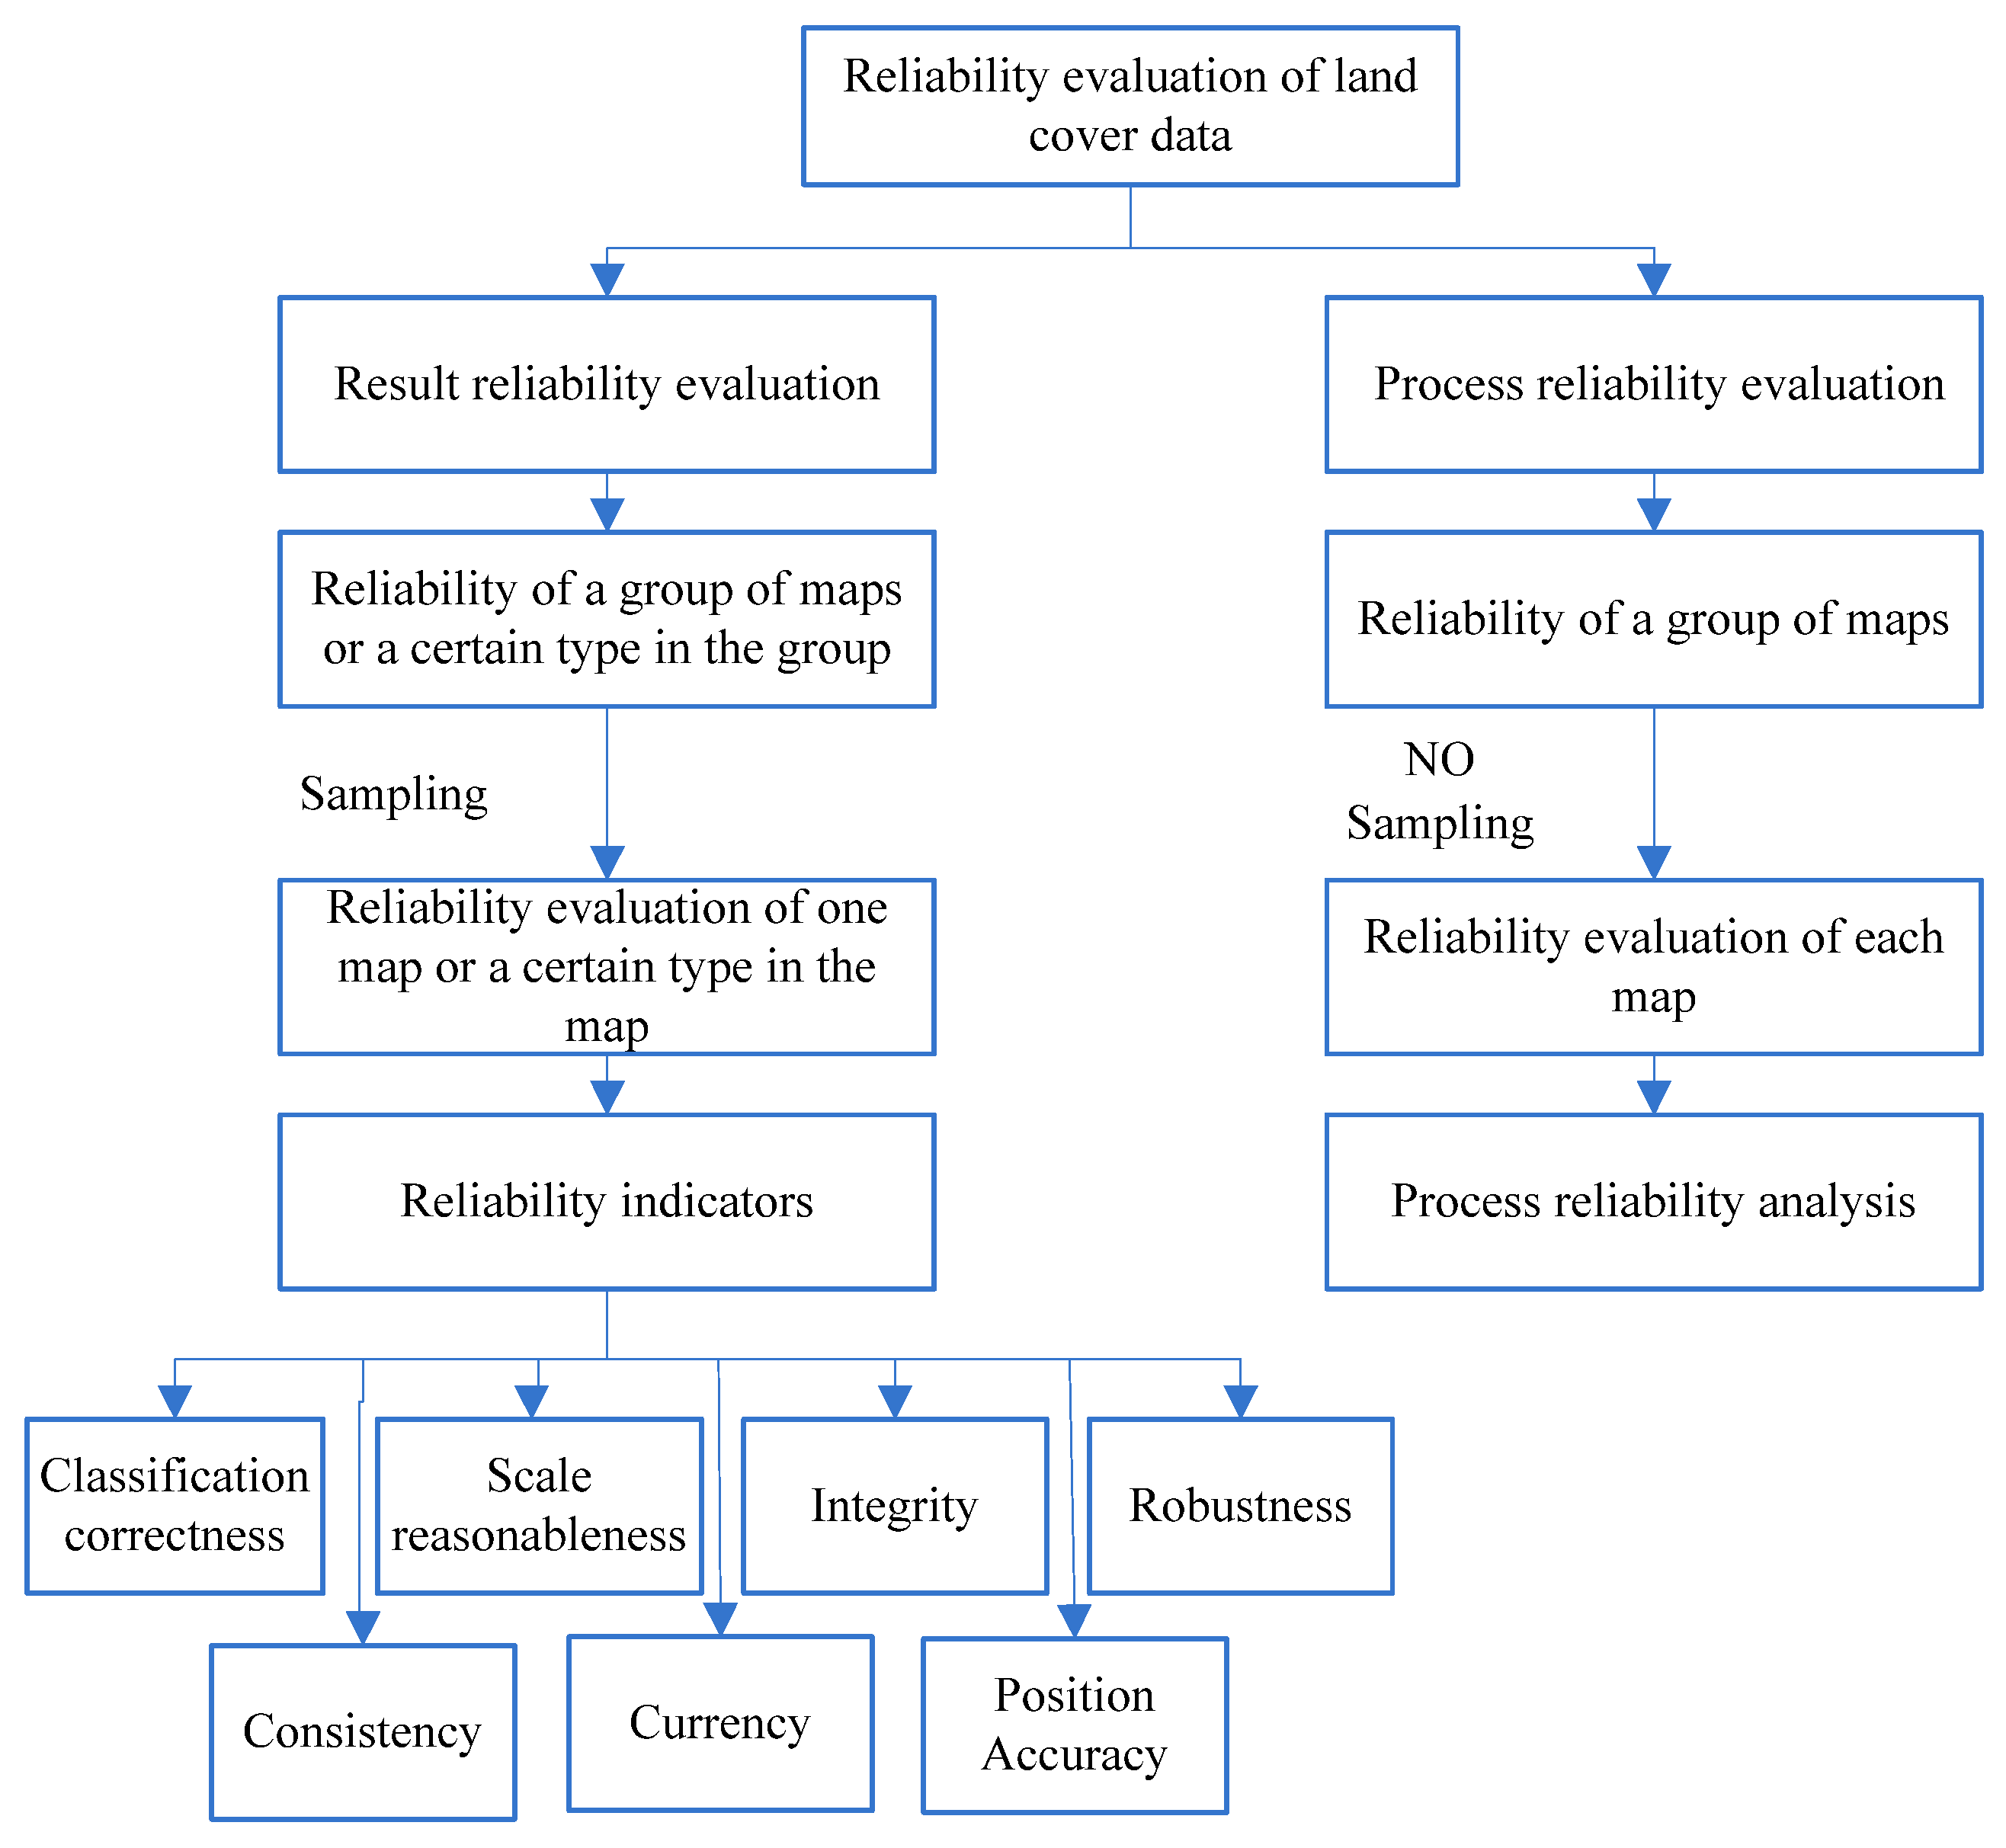
2.2. Process Reliability Evaluation
2.2.1. Construction of Process Reliability Analysis Model
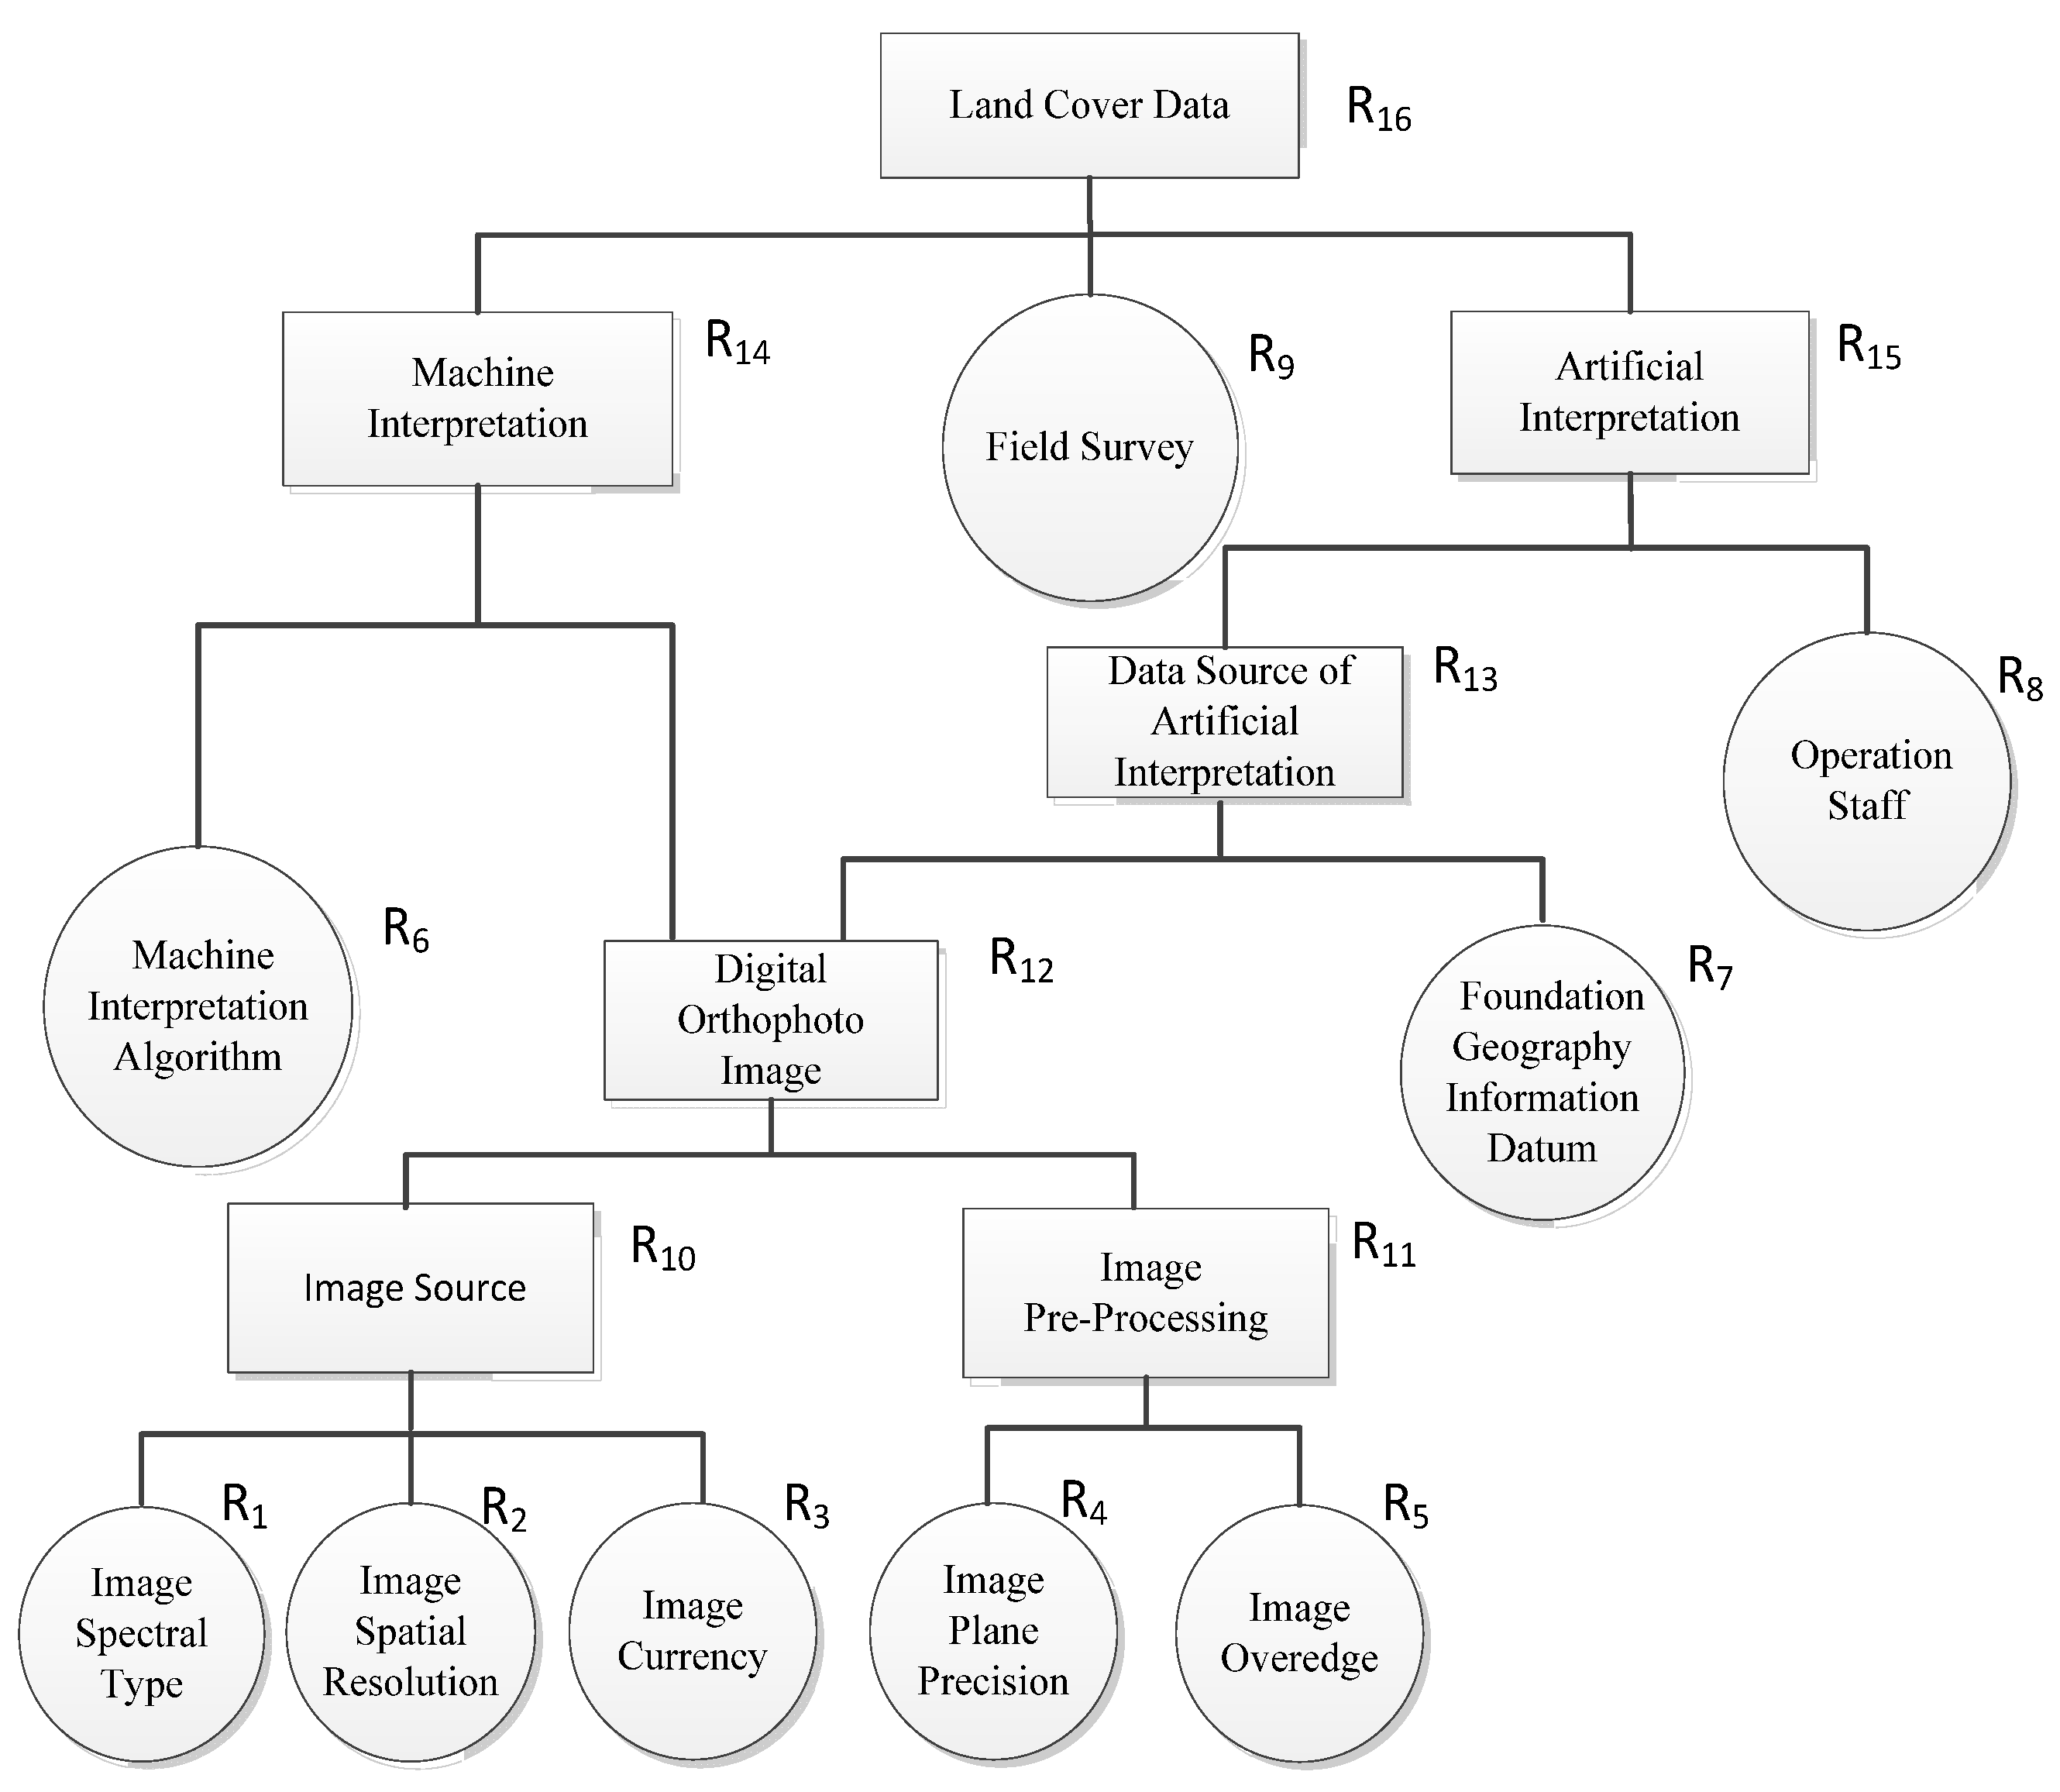
2.2.2. Reliabilities of Basic Events
2.2.3. Reliability Interval of Top Event
3. Case Study
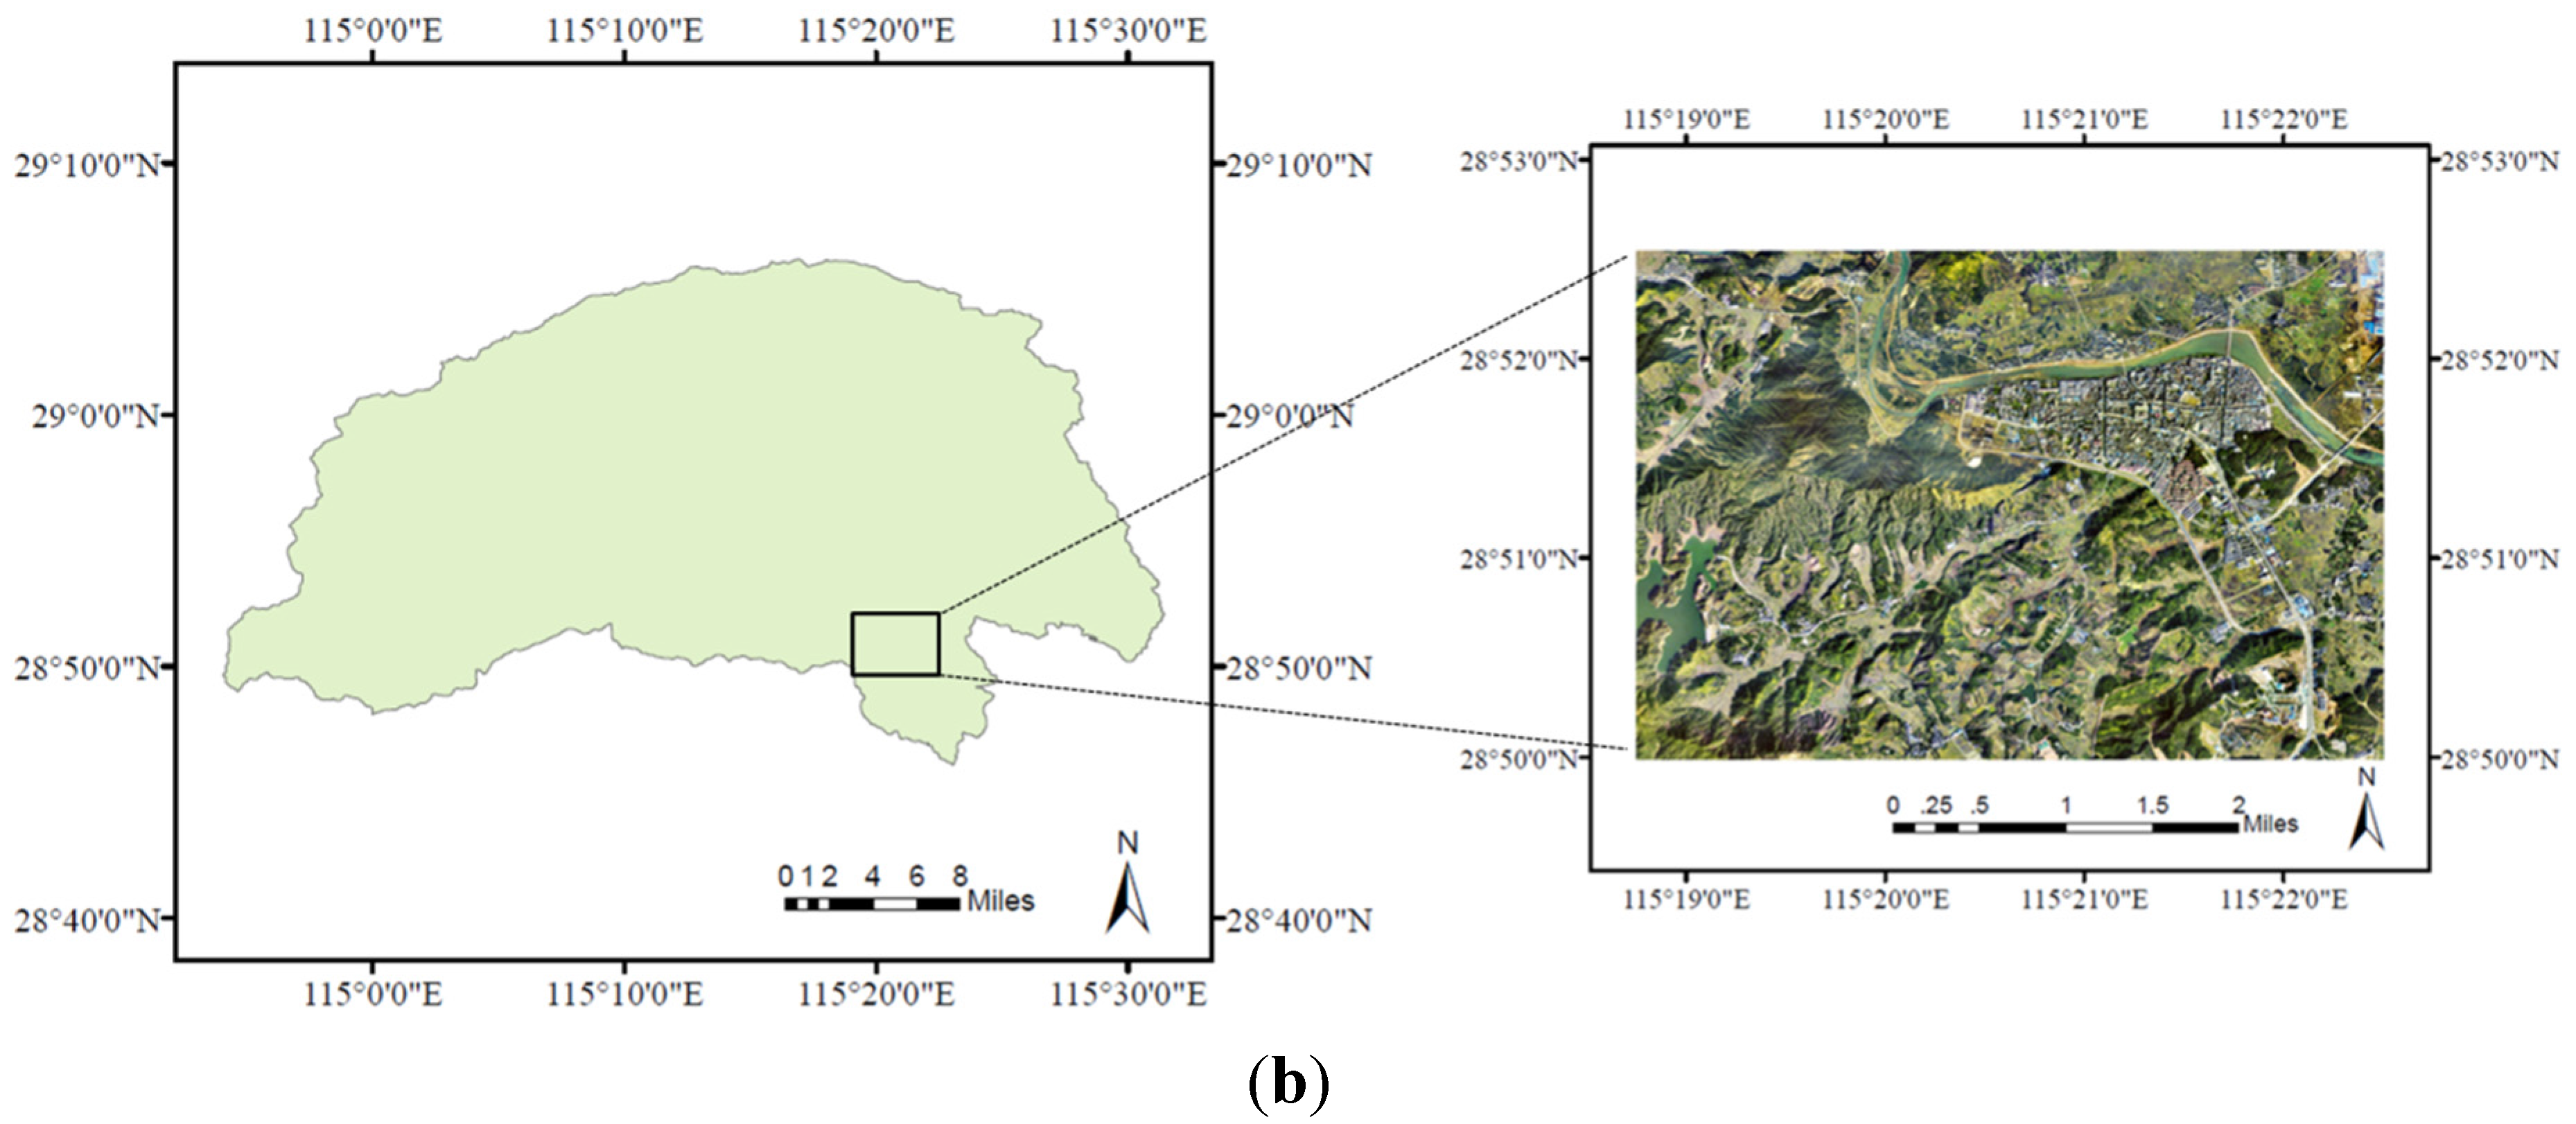
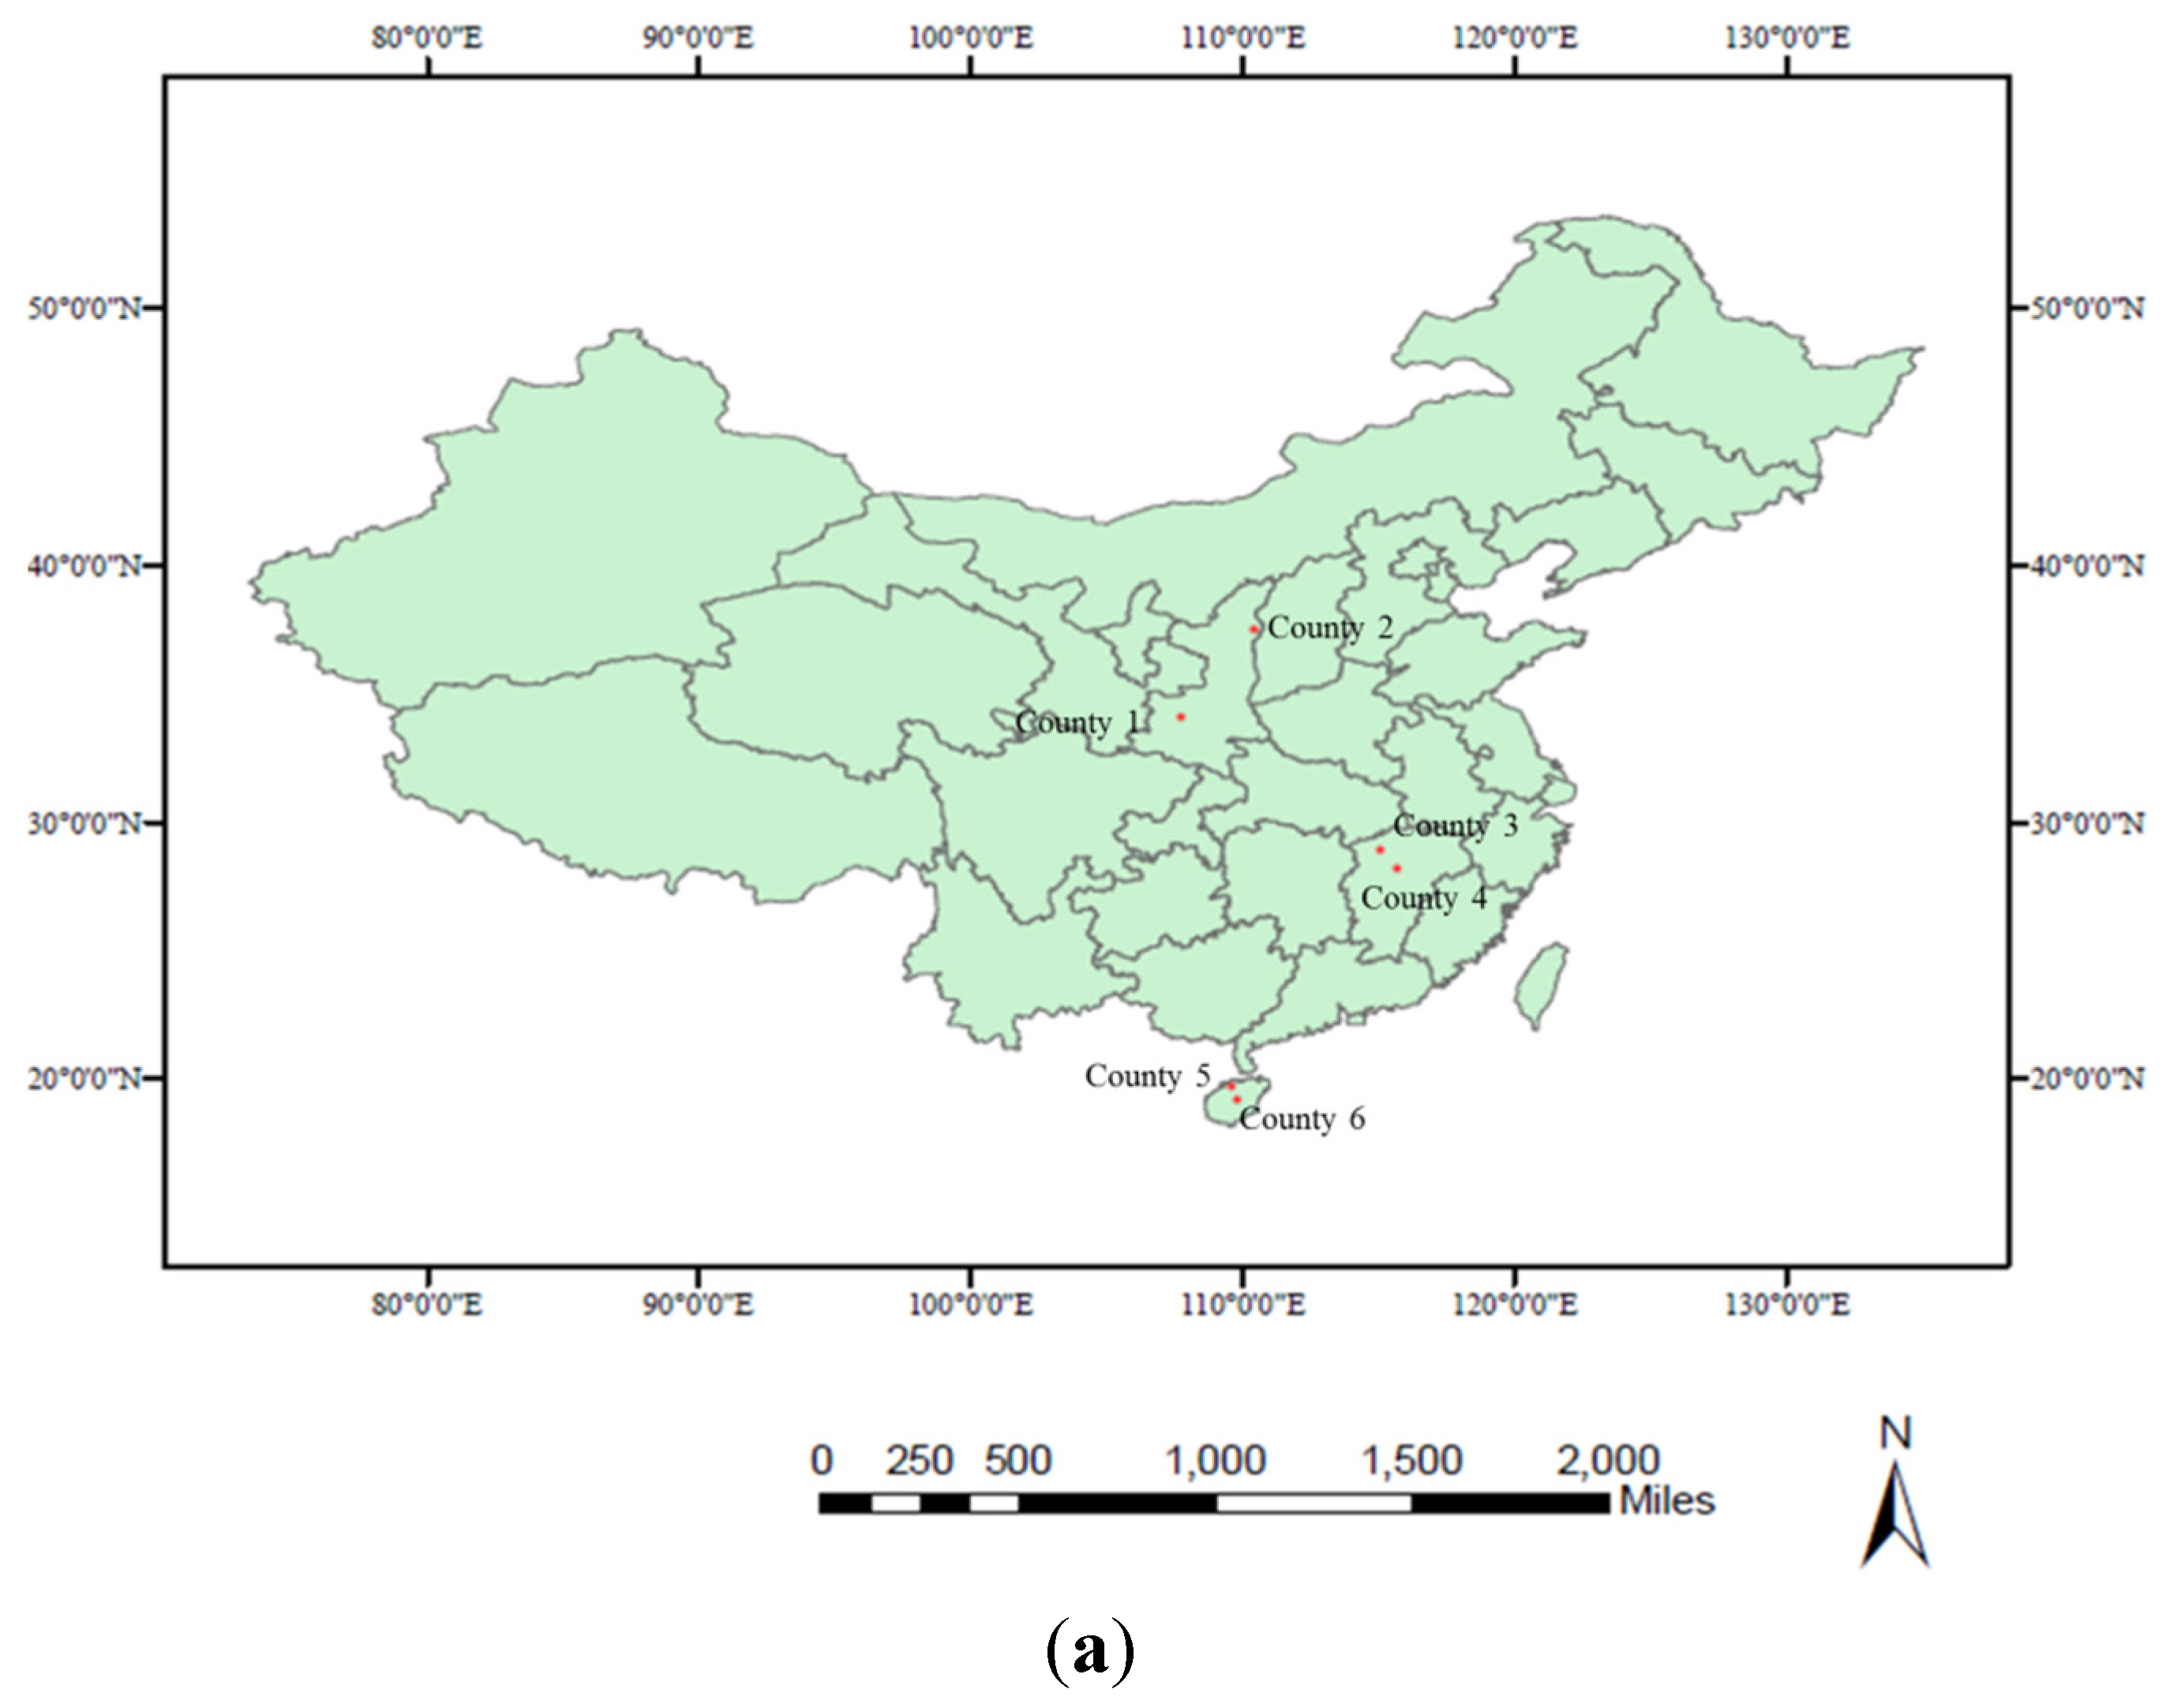
3.1. Area and Data

| Study Area | Location | Area (km2) | Landform |
|---|---|---|---|
| County 1 | Midwest of Shaanxi Province | 720 | Rich types of landforms, such as hilly, river terrace, and loess tableland |
| County 2 | Northeast of Shaanxi Province | 428 | Mainly ravine regions |
| County 3 | Northwest of Jiangxi Province | 1377.49 | Mainly mountainous regions |
| County 4 | Middle of Jiangxi Province | 2439.33 | Mainly hilly regions and river valleys |
| County 5 | Northwest of Hainan Province | 1317 | Mainly flat regions |
| County 6 | South Central of Hainan Province | 1169 | Mainly mountains and valleys |

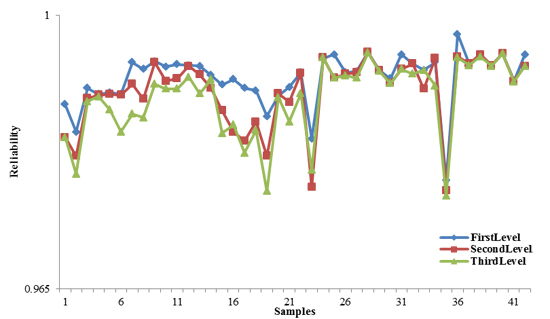
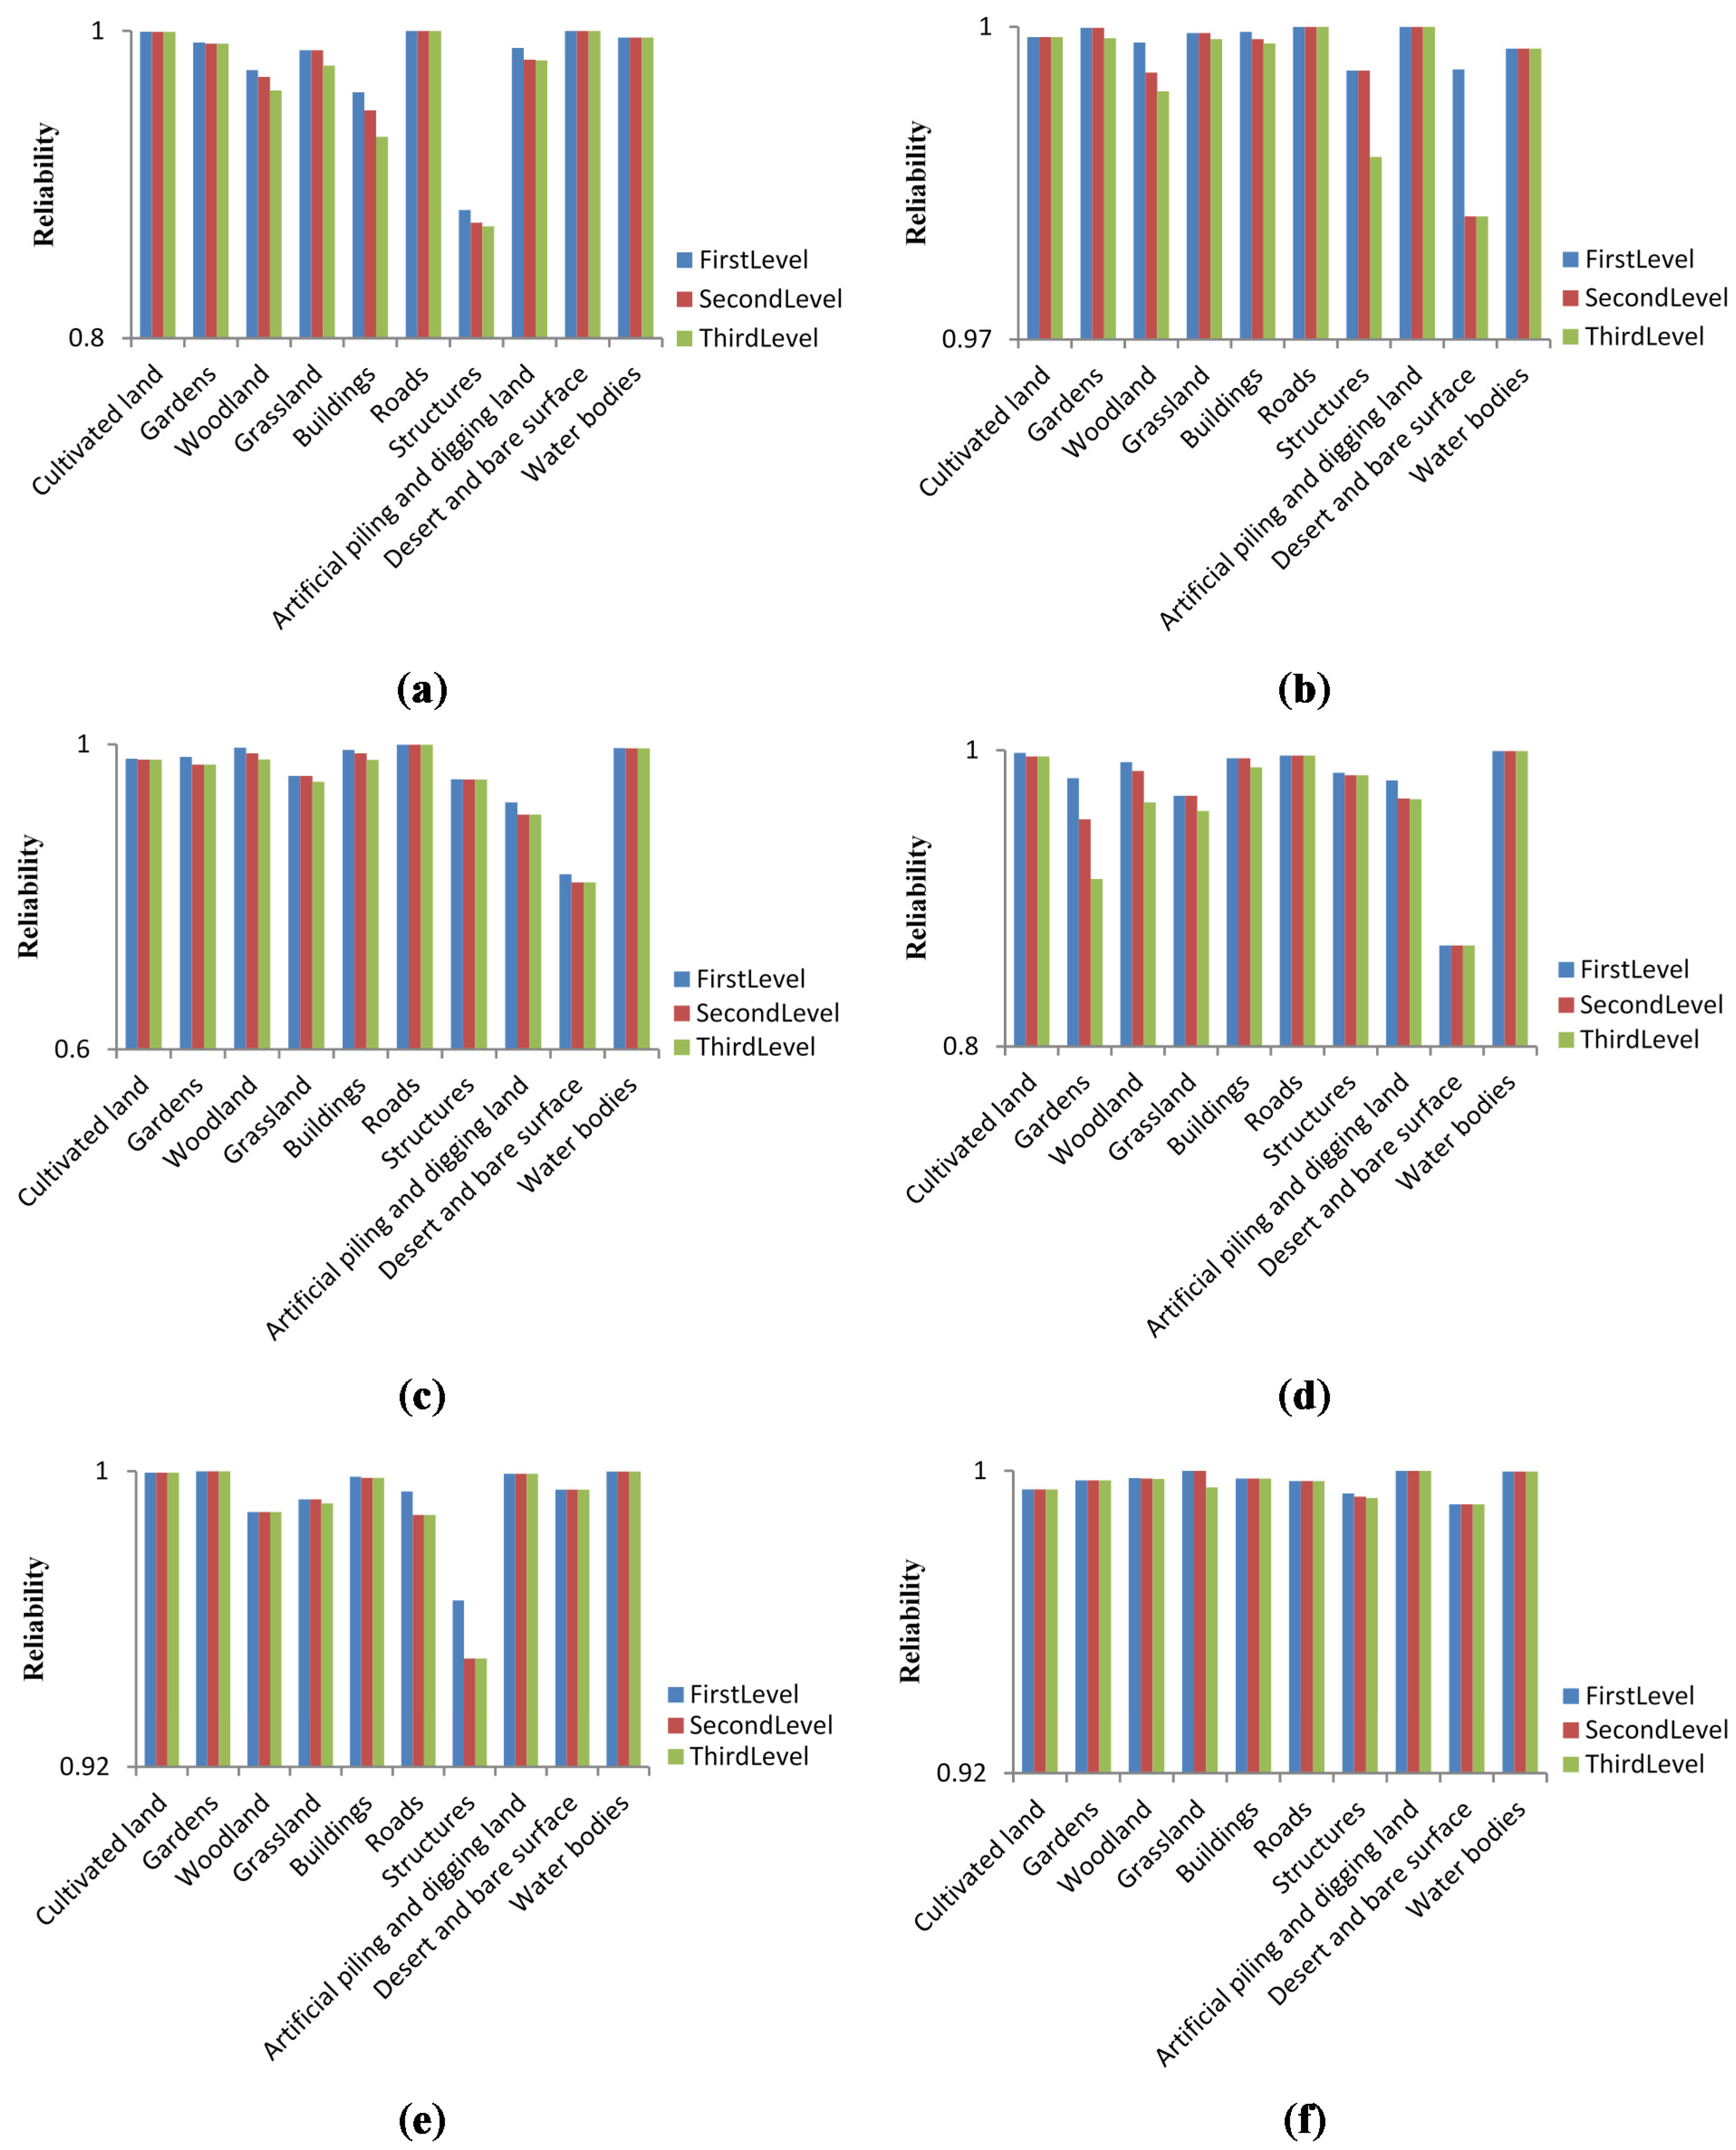
3.2. Reliability Evaluation Results
| Reliability Level | County 1 | County 2 | County 3 | County 4 | County 5 | County 6 |
|---|---|---|---|---|---|---|
| First level | 0.98813 | 0.98997 | 0.98937 | 0.99307 | 0.99229 | 0.99337 |
| Second level | 0.98527 | 0.98983 | 0.98597 | 0.99075 | 0.99216 | 0.99289 |
| Third level | 0.98437 | 0.98753 | 0.98447 | 0.98915 | 0.9916 | 0.99289 |
3.3. Classification Correctness Analysis

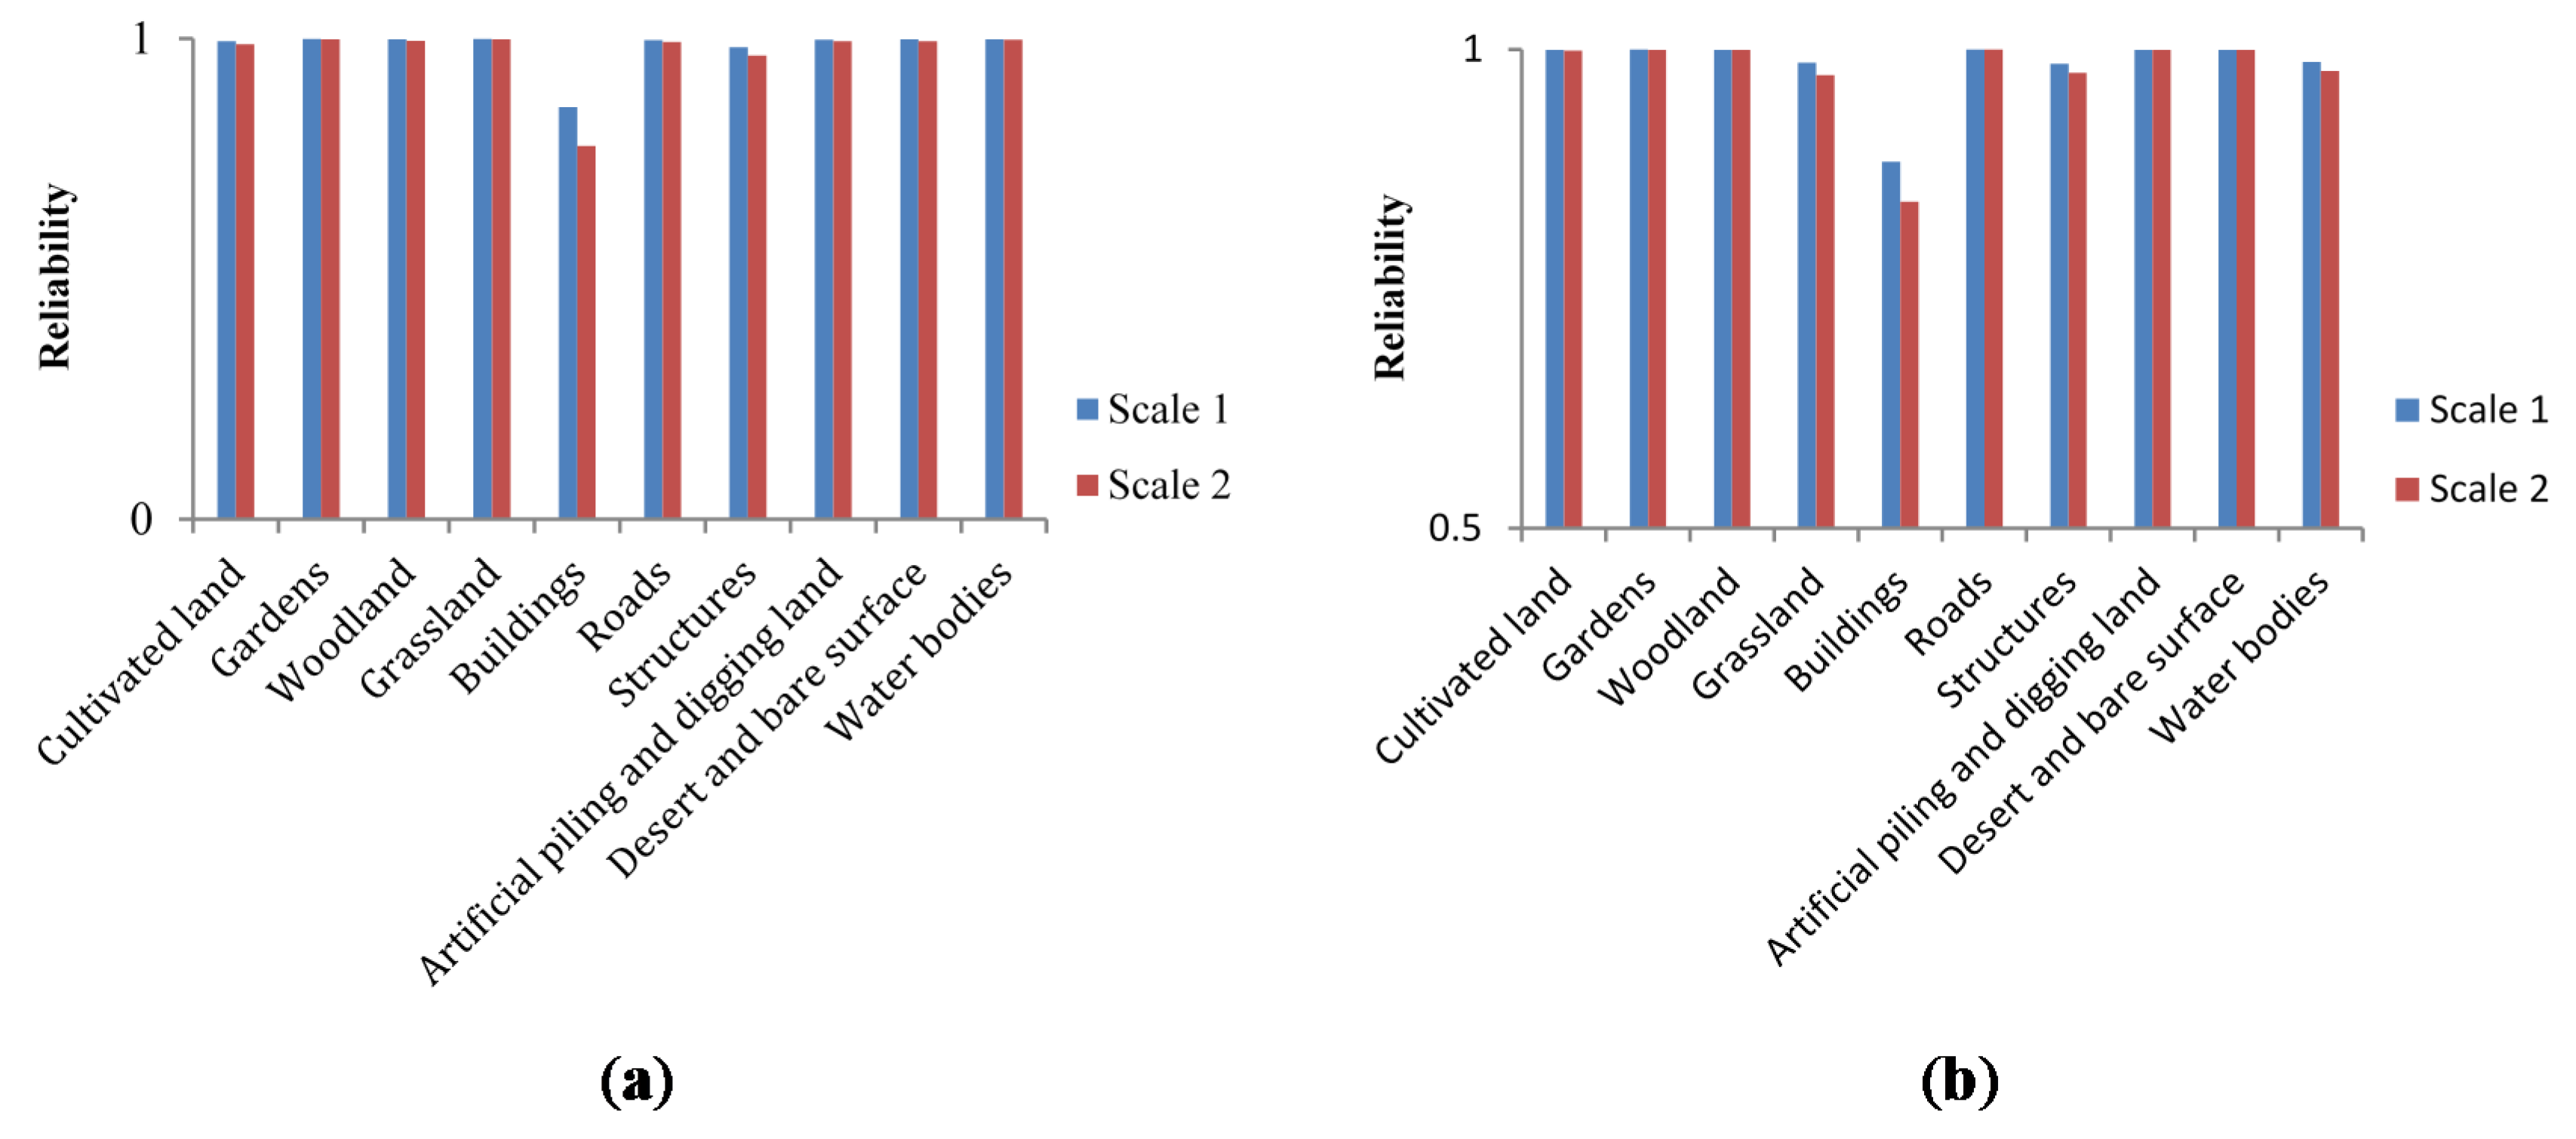
3.4. Scale Reasonableness Analysis

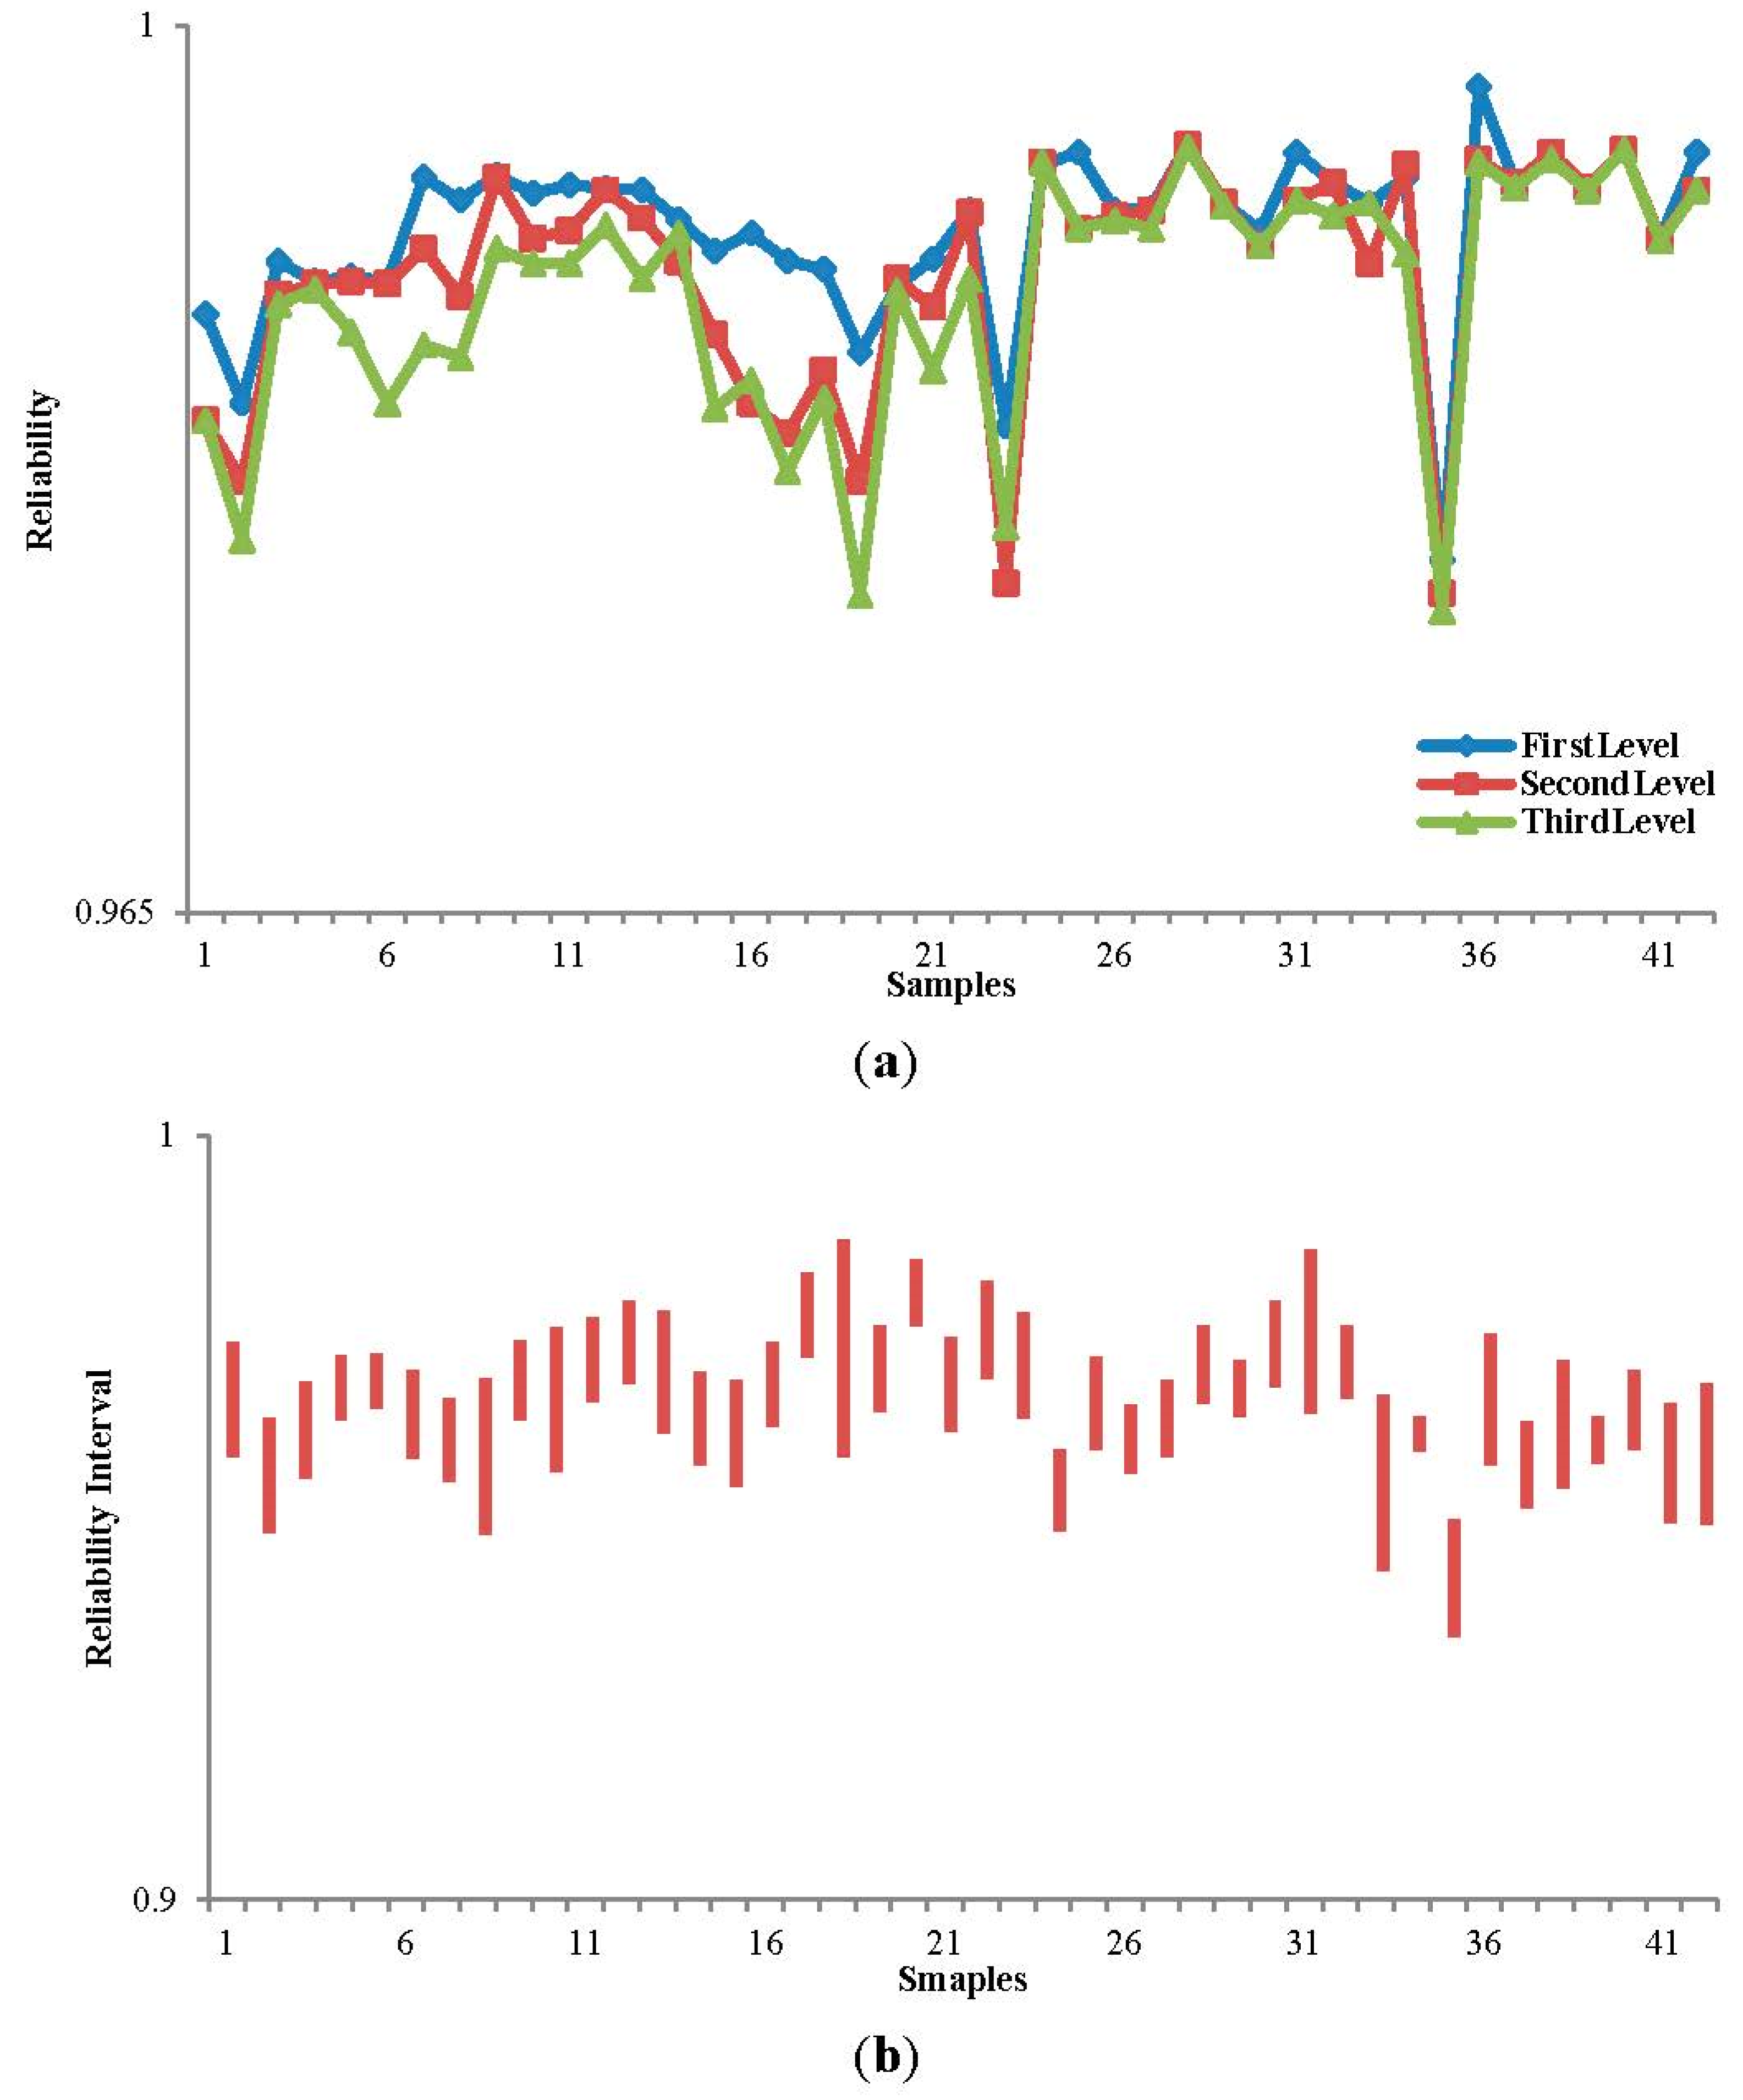
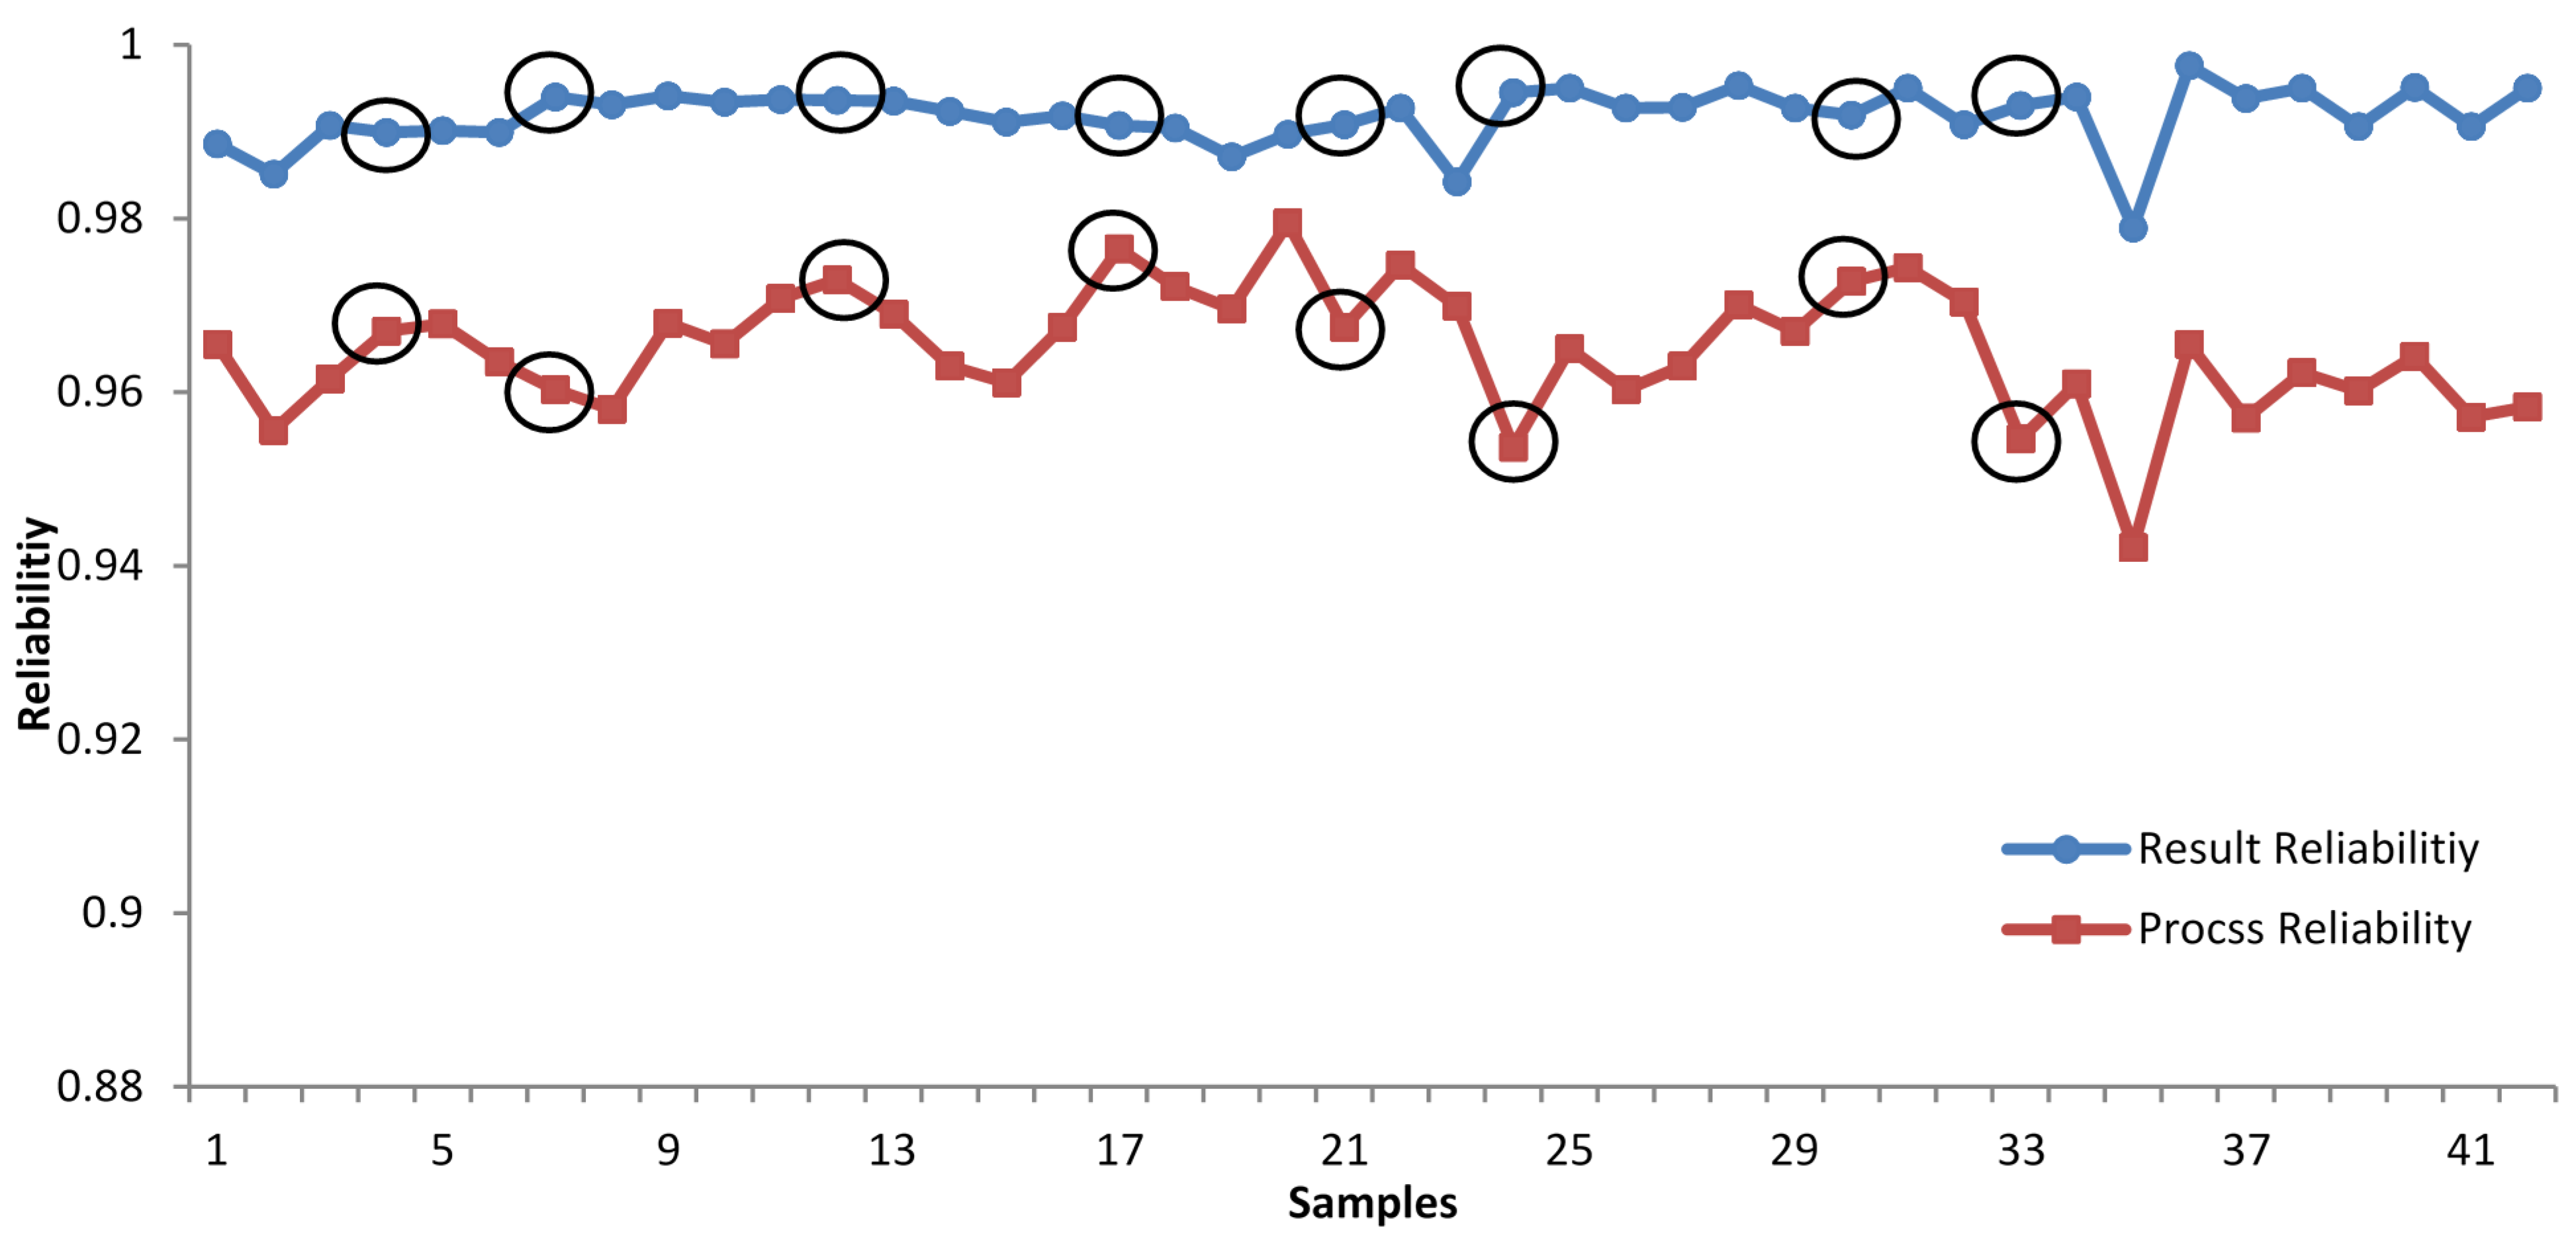
3.5. Consistency Analysis between Result Reliability and Process Reliability
4. Discussion
5. Conclusions
Acknowledgments
Author Contributions
Conflicts of Interest
References
- Sellers, P.; Dickinson, R.; Randall, D.; Betts, A.; Hall, F.; Berry, J.; Collatz, G.; Denning, A.; Mooney, H.; Nobre, C. Modeling the exchanges of energy, water, and carbon between continents and the atmosphere. Science 1997, 275, 502–509. [Google Scholar] [CrossRef] [PubMed]
- Stehman, S.V.; Czaplewski, R.L. Design and analysis for thematic map accuracy assessment: Fundamental principles. Remote Sens. Environ. 1998, 64, 331–344. [Google Scholar] [CrossRef]
- Stehman, S.V. Sampling designs for accuracy assessment of land cover. Int. J. Remote Sens. 2009, 30, 5243–5272. [Google Scholar] [CrossRef]
- Mayaux, P.; Eva, H.; Gallego, J.; Strahler, A.H.; Herold, M.; Agrawal, S.; Naumov, S.; de Miranda, E.E.; Di Bella, C.M.; Ordoyne, C. Validation of the global land cover 2000 map. IEEE Trans. Geosci. Remote Sens. 2006, 44, 1728–1739. [Google Scholar] [CrossRef]
- Stehman, S.V.; Olofsson, P.; Woodcock, C.E.; Herold, M.; Friedl, M.A. A global land-cover validation data set, II: Augmenting a stratified sampling design to estimate accuracy by region and land-cover class. Int. J. Remote Sens. 2012, 33, 6975–6993. [Google Scholar] [CrossRef]
- Lunetta, R.S.; Iiames, J.; Knight, J.; Congalton, R.G.; Mace, T.H. An assessment of reference data variability using a virtual field reference database. Photogramm. Eng. Remote Sens. 2001, 67, 707–715. [Google Scholar]
- Foody, G.M.; Boyd, D.S. Using volunteered data in land cover map validation: Mapping west african forests. IEEE J. Sel. Top. Appl. Earth Obs. Remote Sens. 2013, 6, 1305–1312. [Google Scholar] [CrossRef]
- Foody, G.M. The impact of imperfect ground reference data on the accuracy of land cover change estimation. Int. J. Remote Sens. 2009, 30, 3275–3281. [Google Scholar] [CrossRef]
- Wulder, M.A.; White, J.C.; Magnussen, S.; McDonald, S. Validation of a large area land cover product using purpose-acquired airborne video. Remote Sens. Environ. 2007, 106, 480–491. [Google Scholar] [CrossRef]
- Foody, G.M. Status of land cover classification accuracy assessment. Remote Sens. Environ. 2002, 80, 185–201. [Google Scholar] [CrossRef]
- Wickham, J.; Stehman, S.; Fry, J.; Smith, J.; Homer, C. Thematic accuracy of the NLCD 2001 land cover for the conterminous united states. Remote Sens. Environ. 2010, 114, 1286–1296. [Google Scholar] [CrossRef]
- Wickham, J.D.; Stehman, S.V.; Gass, L.; Dewitz, J.; Fry, J.A.; Wade, T.G. Accuracy assessment of NLCD 2006 land cover and impervious surface. Remote Sens. Environ. 2013, 130, 294–304. [Google Scholar] [CrossRef]
- Elsayed, E.A. Reliability Engineering; John Wiley & Sons: Hoboken, NJ, USA, 2012. [Google Scholar]
- Amirat, A.; Mohamed-Chateauneuf, A.; Chaoui, K. Reliability assessment of underground pipelines under the combined effect of active corrosion and residual stress. Int. J. Press. Vessel. Pip. 2006, 83, 107–117. [Google Scholar] [CrossRef]
- Goševa-Popstojanova, K.; Trivedi, K.S. Architecture-based approach to reliability assessment of software systems. Perform. Eval. 2001, 45, 179–204. [Google Scholar] [CrossRef]
- Soszynska, J. Reliability and risk evaluation of a port oil pipeline transportation system in variable operation conditions. Int. J. Press. Vessel. Pip. 2010, 87, 81–87. [Google Scholar] [CrossRef]
- Zhang, P.; Li, W.; Li, S.; Wang, Y.; Xiao, W. Reliability assessment of photovoltaic power systems: Review of current status and future perspectives. Appl. Energy 2013, 104, 822–833. [Google Scholar] [CrossRef]
- Zhang, P.; Shi, W.; Wong, M.S.; Chen, J. A reliability-based multi-algorithm fusion technique in detecting changes in land cover. Remote Sens. 2013, 5, 1134–1151. [Google Scholar] [CrossRef]
- Shi, W. Principles of Modeling Uncertainties in Spatial Data and Spatial Analyses; CRC Press: Boca Raton, FL, USA, 2009. [Google Scholar]
- Shi, W.; Chen, J.; Zhan, Q.; Shu, H. Reliable spatial analysis. Geomat. Inf. Sci. Wuhan Univ. 2012, 37, 883–887. (In Chinese) [Google Scholar]
- Cihlar, J. Land cover mapping of large areas from satellites: Status and research priorities. Int. J. Remote Sens. 2000, 21, 1093–1114. [Google Scholar] [CrossRef]
- Smits, P.; Dellepiane, S.; Schowengerdt, R. Quality assessment of image classification algorithms for land-cover mapping: A review and a proposal for a cost-based approach. Int. J. Remote Sens. 1999, 20, 1461–1486. [Google Scholar] [CrossRef]
- Chang, J.-R.; Chang, K.-H.; Liao, S.-H.; Cheng, C.-H. The reliability of general vague fault-tree analysis on weapon systems fault diagnosis. Soft Comput. 2006, 10, 531–542. [Google Scholar] [CrossRef]
- Yuhua, D.; Datao, Y. Estimation of failure probability of oil and gas transmission pipelines by fuzzy fault tree analysis. J. Loss Prev. Process Ind. 2005, 18, 83–88. [Google Scholar] [CrossRef]
- Suresh, P.; Babar, A.; Raj, V.V. Uncertainty in fault tree analysis: A fuzzy approach. Fuzzy Sets Syst. 1996, 83, 135–141. [Google Scholar] [CrossRef]
- Singer, D. A fuzzy set approach to fault tree and reliability analysis. Fuzzy Sets Syst. 1990, 34, 145–155. [Google Scholar] [CrossRef]
- Zhang, Z.; Wang, X.; Zhao, X.; Liu, B.; Yi, L.; Zuo, L.; Wen, Q.; Liu, F.; Xu, J.; Hu, S. A 2010 update of national land use/cover database of China at 1:100000 scale using medium spatial resolution satellite images. Remote Sens. Environ. 2014, 149, 142–154. [Google Scholar] [CrossRef]
- Haarla, L.; Pulkkinen, U.; Koskinen, M.; Jyrinsalo, J. A method for analysing the reliability of a transmission grid. Reliab. Eng. Syst. Saf. 2008, 93, 277–287. [Google Scholar] [CrossRef]
- Bobbio, A.; Portinale, L.; Minichino, M.; Ciancamerla, E. Improving the analysis of dependable systems by mapping fault trees into bayesian networks. Reliab. Eng. Syst. Saf. 2001, 71, 249–260. [Google Scholar] [CrossRef]
© 2015 by the authors; licensee MDPI, Basel, Switzerland. This article is an open access article distributed under the terms and conditions of the Creative Commons Attribution license (http://creativecommons.org/licenses/by/4.0/).
Share and Cite
Shi, W.; Zhang, X.; Hao, M.; Shao, P.; Cai, L.; Lyu, X. Validation of Land Cover Products Using Reliability Evaluation Methods. Remote Sens. 2015, 7, 7846-7864. https://doi.org/10.3390/rs70607846
Shi W, Zhang X, Hao M, Shao P, Cai L, Lyu X. Validation of Land Cover Products Using Reliability Evaluation Methods. Remote Sensing. 2015; 7(6):7846-7864. https://doi.org/10.3390/rs70607846
Chicago/Turabian StyleShi, Wenzhong, Xiaokang Zhang, Ming Hao, Pan Shao, Liping Cai, and Xuzhe Lyu. 2015. "Validation of Land Cover Products Using Reliability Evaluation Methods" Remote Sensing 7, no. 6: 7846-7864. https://doi.org/10.3390/rs70607846