1. Introduction
Diverse scene stitching from a large-scale aerial video dataset is highly desired in the field of remote sensing. Different from single scene stitching, diverse scene stitching simultaneously processes data from multiple scenes. For each scene, the data may come from revisited observations of the same aerial platform at different times or from co-observations of multiple aerial platforms. The purpose of diverse scene stitching is to combine all observations with various times, illuminations, viewpoints and even platforms together to generate scene oriented panoramas. The biggest advantage is the ability to automatically explore multiple scenes and to generate panoramas from large-scale aerial surveillance data. Further, the results also provide useful inputs for high-level scene understanding.
Image stitching has been well studied over the past decade [
1–
10]. We refer the readers to the comprehensive survey [
11] for a background. In the field of remote sensing, image stitching or image mosaicking is one of the main tasks, and there are many relevant works, such as environmental monitoring, land, water or marine resources survey, aerial video surveillance,
etc. Here, we mainly focus on stitching methods related to aerial video surveillance, and the related stitching methods [
1,
5,
6,
9,
12] can be classified into two categories, including sequential stitching and retrieval stitching.
Sequential stitching algorithms [
1,
5,
12] are based on the assumption that the input data are ordered. Small baseline algorithm, such as optical flow [
13,
14], can then be used to efficiently estimate the image transformation between consecutive frames. Assuming the time consistency cannot be broken, these sequential methods require that the input data should be taken on a stable aerial platform without sudden viewpoint changes or large motion blurs. Otherwise, no time consistency can be used to align these sequential images, resulting in discontinuous panoramas. While advanced methods based on wide baseline image matching techniques, such as the well-known scale-invariant feature transform [
15] and speeded-Up robust features (SURF) [
16], can reduce these artifacts, they cannot handle large changes of aerial data. For example,
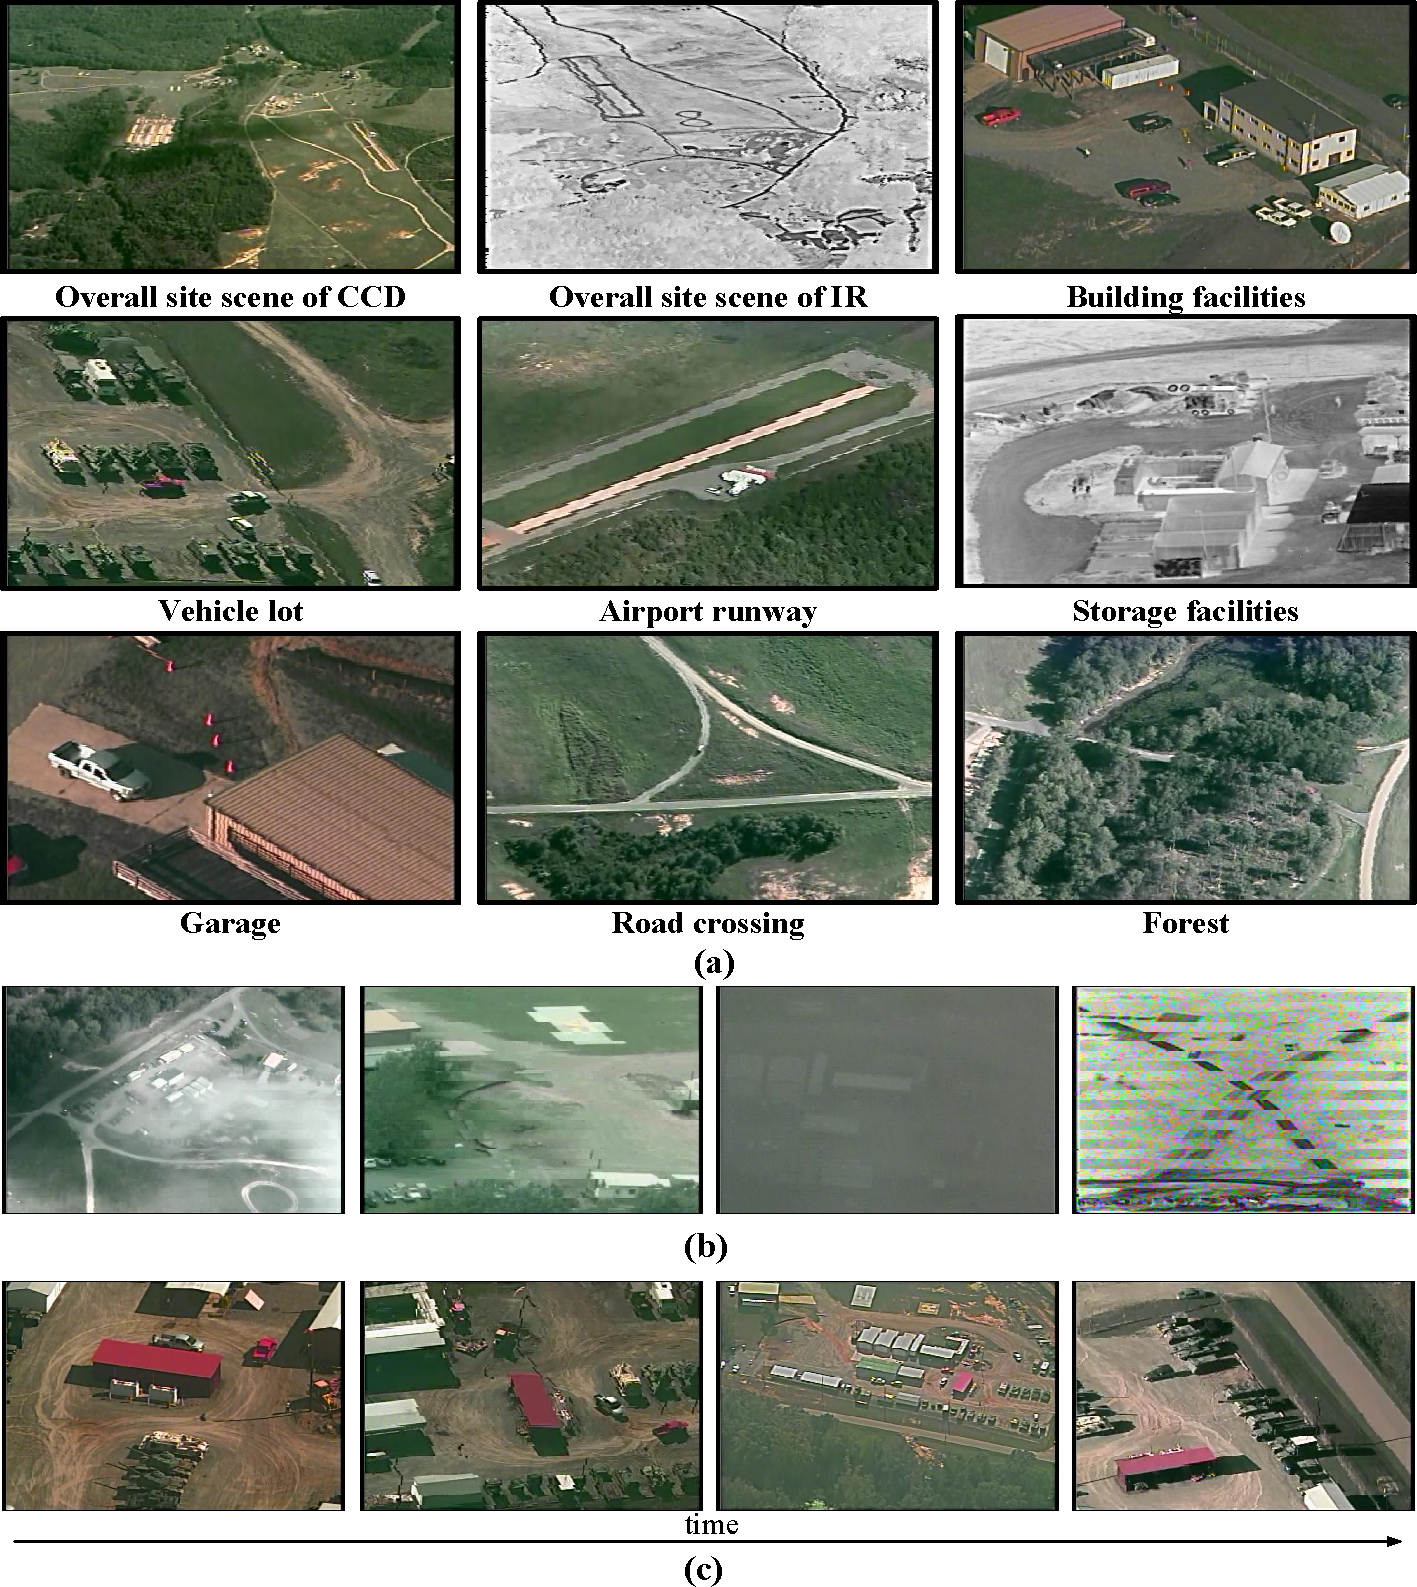
Figure 1 shows samples from the benchmark VIRATdataset [
17] of a diverse scene (as shown in
Figure 1a). Motion blurs, low contrast and significant viewpoint changes (as shown in
Figure 1b,c) are common in the acquired images. The continuity assumption hence is not valid in this case.
The stitching problem can also resort to image matching techniques. Techniques, such as [
2,
4,
6,
18–
20], assume that the input data are completely unordered. Brown
et al. [
4,
19] formulate stitching as a multi-image matching problem and use brute-force searching to find the overlapping relationships among all images. These methods can recognize multiple panoramas from a small-scale image dataset.
However, given a dataset with n images, this results in n(n − 1)/2 possible image pairs and, hence, leads to O(n2) complexity. Consequently, the computational cost of these approaches is generally very high and becomes a bottleneck in real-time surveillance.
There is also an emerging trend for using retrieval techniques [
6,
18,
20] to find one-to-many image matches. These solutions then apply two-view matching on all selected image pairs. The retrieval stitching method is based on feature indexing. Although using indexing is much less expensive than matching, it requires sufficient distinctive image features. If the observed scene lacks enough unique features, the variance of different images is not enough for the method to reliably find correct matches. As a result, the retrieval stitching method cannot find all overlapping aerial images from the same scene and yields low performance: typically about 80% correct matches can be found [
18]. For instance, a large number of indistinctive or self-similar scenes in the VIRAT dataset (as shown in
Figure 1b) will lead to retrieval failure.
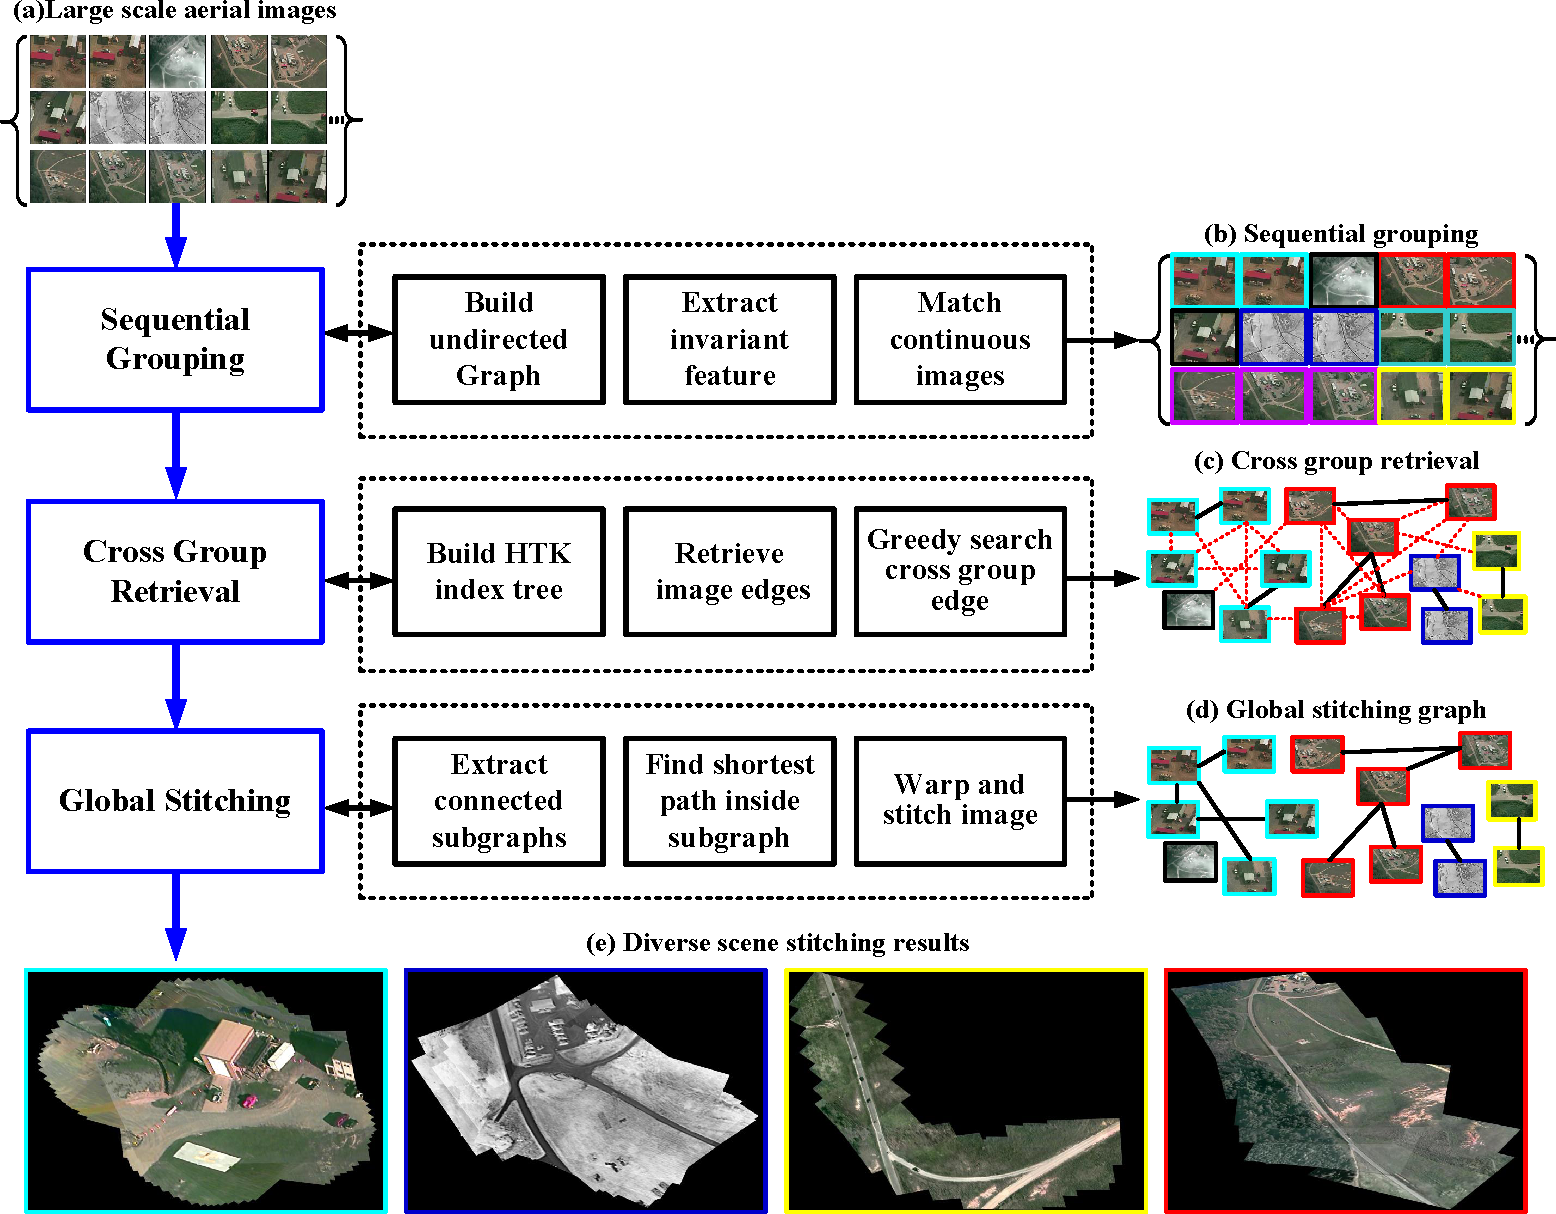
The main contribution of this paper is a hybrid stitching method that unifies the temporal continuity and spatial repeatability of aerial videos in a graph-based framework. The heart of our method is built on the observation that aerial videos captured in diverse realistic scene are neither totally ordered nor completely unordered. Even though the aerial videos are corrupted by large motion blurs, sudden scene changes, low contrast and high camera noise, we observe that for each scene, there always exists short continuous videos from different times. We therefore adopt sequential grouping to first roughly partition the entire video into small continuous groups and then present a cross-group retrieval method to efficiently find spatially overlapping images among different groups. Finally, a graph-based method is applied to find global optimal paths for stitching the images into panoramas. Experiments show that our method can robustly stitch VIRAT aerial surveillance video and achieve a few orders of magnitude accelerations over the state-of-the-art stitching systems, such as PTGui [
21], AutoStitch [
19] and the most recent scheme by Autopano [
22].
2. Hybrid Stitching Model
2.2. Sequential Grouping
In this section, we will introduce the method to generate initial small groups or sequential subgraphs. As mentioned above, we do not expect to use sequence information to handle all challenges of the VIRAT aerial video, because many kinds of disturbances, such as sudden viewpoint changes and large motion blur, can cause failure of sequential stitching. Moreover, sequential methods cannot deal with repeated observation of the same scene at different times.
However, we observe that sequential information often exists in aerial video sequence. Even if not providing a complete global picture of the entire surveillance scene, small sequential fragments are very valuable for further cross-group retrieval.
Standard optical flow tracker [
13,
14] or wide baseline matching methods [
15,
16] can be used to get frame-to-frame alignment between continuous image pairs. In this work, we select scale-invariant feature transform (SIFT) [
15] features for the following two reasons: First, compared against other local invariant features, SIFT is proven to have the most robust features under geometric and illumination changes. Second, the extracted SIFT features are also used for further feature indexing and retrieval.
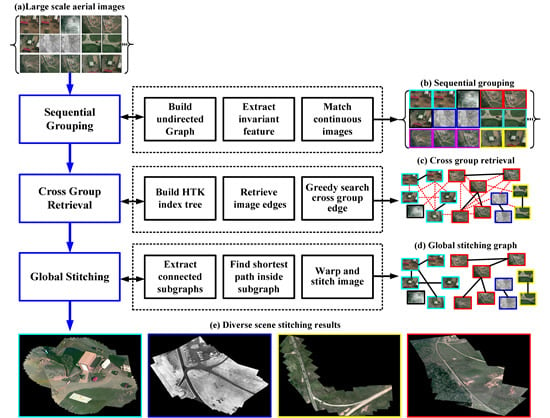
Given a set of VIRAT images
I = {
I1,
I2, …,
In} (as shown in
Figure 2a), we firstly extract the SIFT features
F = {
f1,
f2, …,
fm} from the entire image set. Then, for each continuous image pair, we apply SIFT matching and outlier removal [
24] to check if they are overlapped. After that, new edges are added into
G = (
V,
E) between overlapped image vertices. Finally, the original isolate notes are classified as many small sequential subgraphs
(As shown in
Figure 2(b) with the same color).
With the sequential stitching, we can quickly set up the relationships between successive overlapping images. More importantly, we can transfer the problem from complicated image-to-image matching into group-to-group retrieval, which means that even if only one connected edge between two sequential groups is found, the big panorama will be generated completely without breaks. Thus, we can significantly improve the probability of finding all overlapping images, meanwhile reducing the most time-consuming part of image stitching, which is feature matching between candidate image pairs.
2.3. Cross-Group Retrieval
In this section, we propose a novel cross-group retrieval method to find an optimal edge between candidate groups quickly. Our method contains two steps: (1) feature indexing; and (2) greedy searching-based optimal edge selection.
In the first step, the hierarchical K-means tree (HKT) is adopted to find the overlapping image pairs from the unordered image set. HKT has proven to be powerful in image recognition, image classification and retrieval [
25], demonstrating that the searching hierarchical tree can speed the matching of high-dimensional vectors by up to several orders of magnitude compared to a linear search.
Given a set of SIFT features F = {f1, f2, …, fm} from the entire image set, HKT is constructed by splitting the SIFT feature points at each level into k distinct clusters using a k-means clustering. We apply the same method recursively to the points in each cluster. The recursion will be stopped when the number of feature points in a cluster is smaller than k. Finally, we save the index correspondences between the feature points and images in a look-up table for efficient retrieval. In all experiments, the k used for the hierarchical k-means tree is 32; the maximum number of iterations to use in the k-means clustering stage when building the k-means tree is 100; and we pick the initial cluster centers randomly when performing k-means clustering.
To find the relationships between two groups, we define a
n ×
n accumulator matrix
A, which is initialized by zeros. For each query feature point
f in image
Ii, we search for the HKT to find
k closest points in the high-dimensional feature space, then we check the look-up table to find the index set
ℓ = {
ℓ1,
ℓ2, …,
ℓt} of corresponding images and increase the accumulator matrix
Ai,c by one, where
c ∈
ℓ. After querying all feature points, image pairs <
Ii,
Ij > with sufficient high matching times as
will be labeled as candidate edge (as shown in
Figure 2c, red dotted lines).
Given two sequential subgraphs
and
, we use the following greedy searching to find the optimal edge Θ efficiently. For all vertices
and
, we firstly select the candidate image pairs Θ
0 with maximal retrieval score
Ai,j by
Equation (1), and then, we use feature matching and random sample consensus (RANSAC) [
24] to verify the edge between
Vi and
Vj.
If sufficient inliers have been found, we keep this edge and remove all other retrieval edges between sequential subgraphs
and
. Otherwise, we select and check the second optimal edge from the rest of the candidate edges between the two subgraphs. This process is repeated until all existing candidate edges between two groups have been checked. Actually, in our experiments, we find that image pairs connected by the first selected optimal edge usually contains sufficient correct feature correspondences. As a result, our approach only needs to apply one feature matching to connect two sequential groups in most cases. This characteristic is essential for reducing the heavy computational cost of feature matching on redundant edges.
Here, we make a brief discussion about the relationship and advantage of cross-group retrieval compared to traditional single image retrieval.
For a given retrieval sampling with one image, we use Sw to represent the probability of finding correct overlapping images from the entire dataset. To extract panorama with enough confidence from a large-scale aerial dataset, the probability value should be as high as possible. However, due to the challenges of realistic aerial video with similar background or low texture regions, the probability Sw of a traditional single image retrieval is usually low.
Given
Sw, the probability of retrieval failure for one image is 1 −
Sw. For a giving image group
Gs with λ sample images, the probability of all retrieval results being wrong is (1 −
Sw)
λ. Finally, the probability that at least one sample image of group
Gs can find correct overlapping images is:
Thus, through integrating the sequential grouping and crossing group retrieval in one framework, we can greatly increase the probability to find panoramas completely by
Equation (2).
2.4. Graph-Based Global Panorama Rendering
After finding the cross-group edges, we have generated a undirected graph G = (V, E) to represent the pairwise image relations of the dataset. With this undirected graph, it is convenient to identify image relations that have not been explicitly established by the pairwise image matching.
Since the number of panoramas is unknown in the original image set, we have to extract all of the connected subgraphs in the graph firstly and then compute the image transforms inside each component, respectively.
A connected component of a undirected graph is a subgraph in which any two vertices are connected to each other by paths. In this paper, we use the depth-first search [
26] to compute the connected components of a graph in linear time. A search begins at a particular vertex
Vj, and each new vertex reached is marked. When no more vertices can be reached along edges from marked vertices, a connected component has been found. An unmarked vertex is then selected, and the process is repeated until the entire graph is explored. For each connected component, we need to find a homography
Hr,j between reference image vertices
Vr and other vertices
Vj,
j = 1, …,
l. In this work, we pick the image vertices with the maximal number of connected edges as the reference vertices
Vr. Although the
Hr,j may be calculated by chaining together the homography on any path between vertices
Vr and
Vj, to reduce the accumulation error of long chains, we find a shortest path from
Vj to
Vr with the Dijkstra algorithm (as shown in
Figure 2d, black solid lines).
Finally, images of the same group are warped together with the homography model, which is estimated by the shortest path in the previous graph. This strategy is very quick, but may retain seams in the scene with large depth variation, such as buildings or trees. In these cases, we can employ graph cuts [
27] to minimize the total squared difference between two images, and the chosen seam is through those pixels where the image colors are similar. The pseudocode of the proposed hybrid stitching approach is shown in
Algorithm 1.
Algorithm 1.
Pseudocode for diverse scene stitching.
Algorithm 1.
Pseudocode for diverse scene stitching.
| Input: |
| The large-scale aerial video dataset. |
| Algorithm: |
| 1: Build an undirected graph G = (V, E). |
| 2: Extract SIFT features of all input images. |
| 3: Generate sequential groups
by matching continuous images. |
| 4: Build an HTK tree with all SIFT features. |
| 5: Retrieve edges for each image vertices. |
| 6: for each sequential group pairs
do |
| 7: Select optimal edge (u, v) by Equation (1). |
| 8: Match candidate image pairs with SIFT features. |
| 9: Remove outliers with RANSAC. |
| 10: Estimate homography with correct inliers. |
| 11: If (u, v) is a connected edge with enough inliers, remove all other edges between
and
compare the next group pairs. |
| 12: Otherwise, remove (u, v), and repeat Step 7 until all existing edges between
and
have been checked. |
| 13: end for |
| 14: Extract all connected subgraphs
by depth-first search in global group G |
| 15: for each group g ∈
do |
| 16: for each image vertices Vj of group g do |
| 17: Find the shortest path between image vertices Vj and reference image vertices Vr |
| 18: Warp corresponding image Ij by homography on the shortest path. |
| 19: Seam cutting and stitching between downsampled warped image and previous panorama. |
| 20: end for |
| 21: end for |
| 22: Output complete panorama image set {P1, P2, …, Pτ}. |
3. Experiments
In this section, we will present a comparative performance evaluation of the proposed method.
We use VIRAT benchmark aerial video dataset [
17] with huge diversity in the scene. The VIRAT dataset contains 24 videos, which are selected from 25-h original videos recorded at various times with a CCD and IR camera on an aerial platform. Each selected video is 5 min long with an image size of 640 × 480. The VIRAT dataset is highly realistic, natural and challenging for aerial video stitching (as shown in
Figure 1b,c). Given the input aerial images, we label images from the same scene and take the total number of image groups at the ground truth for evaluation (as shown in
Table 1, third column). For instance, if the input aerial images are captured from two scenes, then the ground truth will be set as the scene Number 2 in this case.
We implement our algorithm with C++. The experiments in this paper are all performed on a laptop computer with Intel i5 1.6 GHz CPU and 12 G RAM. For sequential grouping, we apply a distinctive SIFT [
15] descriptor to get the feature correspondence between images. For cross-group retrieval, we build the hierarchical K-means tree [
28] for feature indexing. The only input parameter of our method is the total number of correct feature correspondences, which determines whether a valid homography transformation can be found between two images or not. This parameter is set as 20 in all of our experiments.
We use the standard ground truth (GT), true positive (TP), false positive (FP) and processing time to evaluate the robustness and efficiency of different algorithms.
Ground truth scene numbers are provided by our manually labeling results. For each output panorama, we define two criteria to identify whether it is a true positive or false positive. One is the label consistency, and another is scene integrity. Label consistency means all images in one panorama must have the same scene label. Scene integrity describes the matching ratio between the output panorama and the corresponding scene, which can be calculated by the image number of output panorama divided by the total image number of the corresponding scene. Only the panorama whose image label is consistent and the scene integrity is higher than 90% can be identified a true positive panorama. Otherwise, it is a false positive. Finally, the processing time is the total time from loading images to stitching all panorama results in our experiments.
First, we compare our method to the sequential stitching and retrieval stitching. We choose them as the baseline results, since the sequential stitching model is widely used for aerial video stitching, and retrieval stitching shares the similar goal of finding overlapping images efficiently without brute-force matching. For a fair comparison, we use standard SIFT [
15] for sequential stitching and combine SIFT [
15] and bag-of-words (BOW) [
6,
29] for retrieval stitching. In this experiment, we extract 3 frames every second from VIRAT video. Thus, there are 932 images in each video.
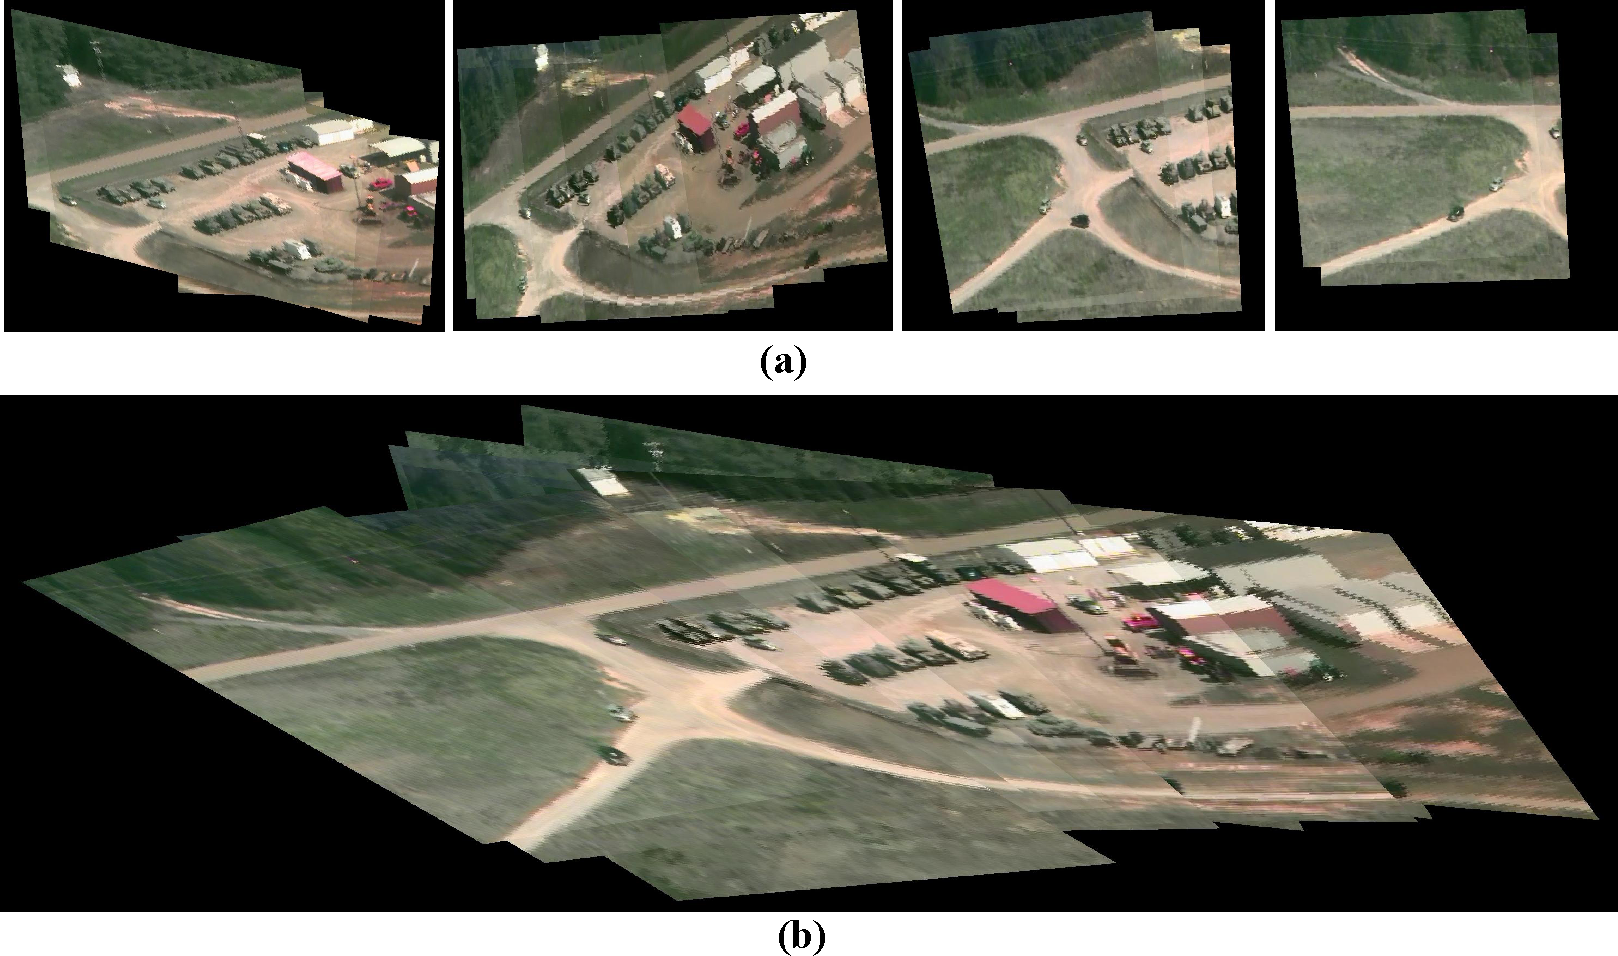
Figure 3a shows an example of sequential stitching. The sequential stitching methods are based on the assumption that the input aerial images is continuous in time, and they usually require the input data to be taken on a stable platform without sudden changes between consecutive frames. However, in the realistic VIRAT aerial dataset, challenges, such as motion blur, sudden scene or view point changes, are common in the aerial images, and the continuity assumption of the sequential stitching method hence is not valid in this case. As a result, although SIFT is more robust for wide baseline image matching, it still cannot handle those image changes between consecutive frames. The panorama of sequential stitching is split into 4 fragments (as shown in
Figure 3a). In contrast, our approach recovers the panorama completely (as shown in
Figure 3b).
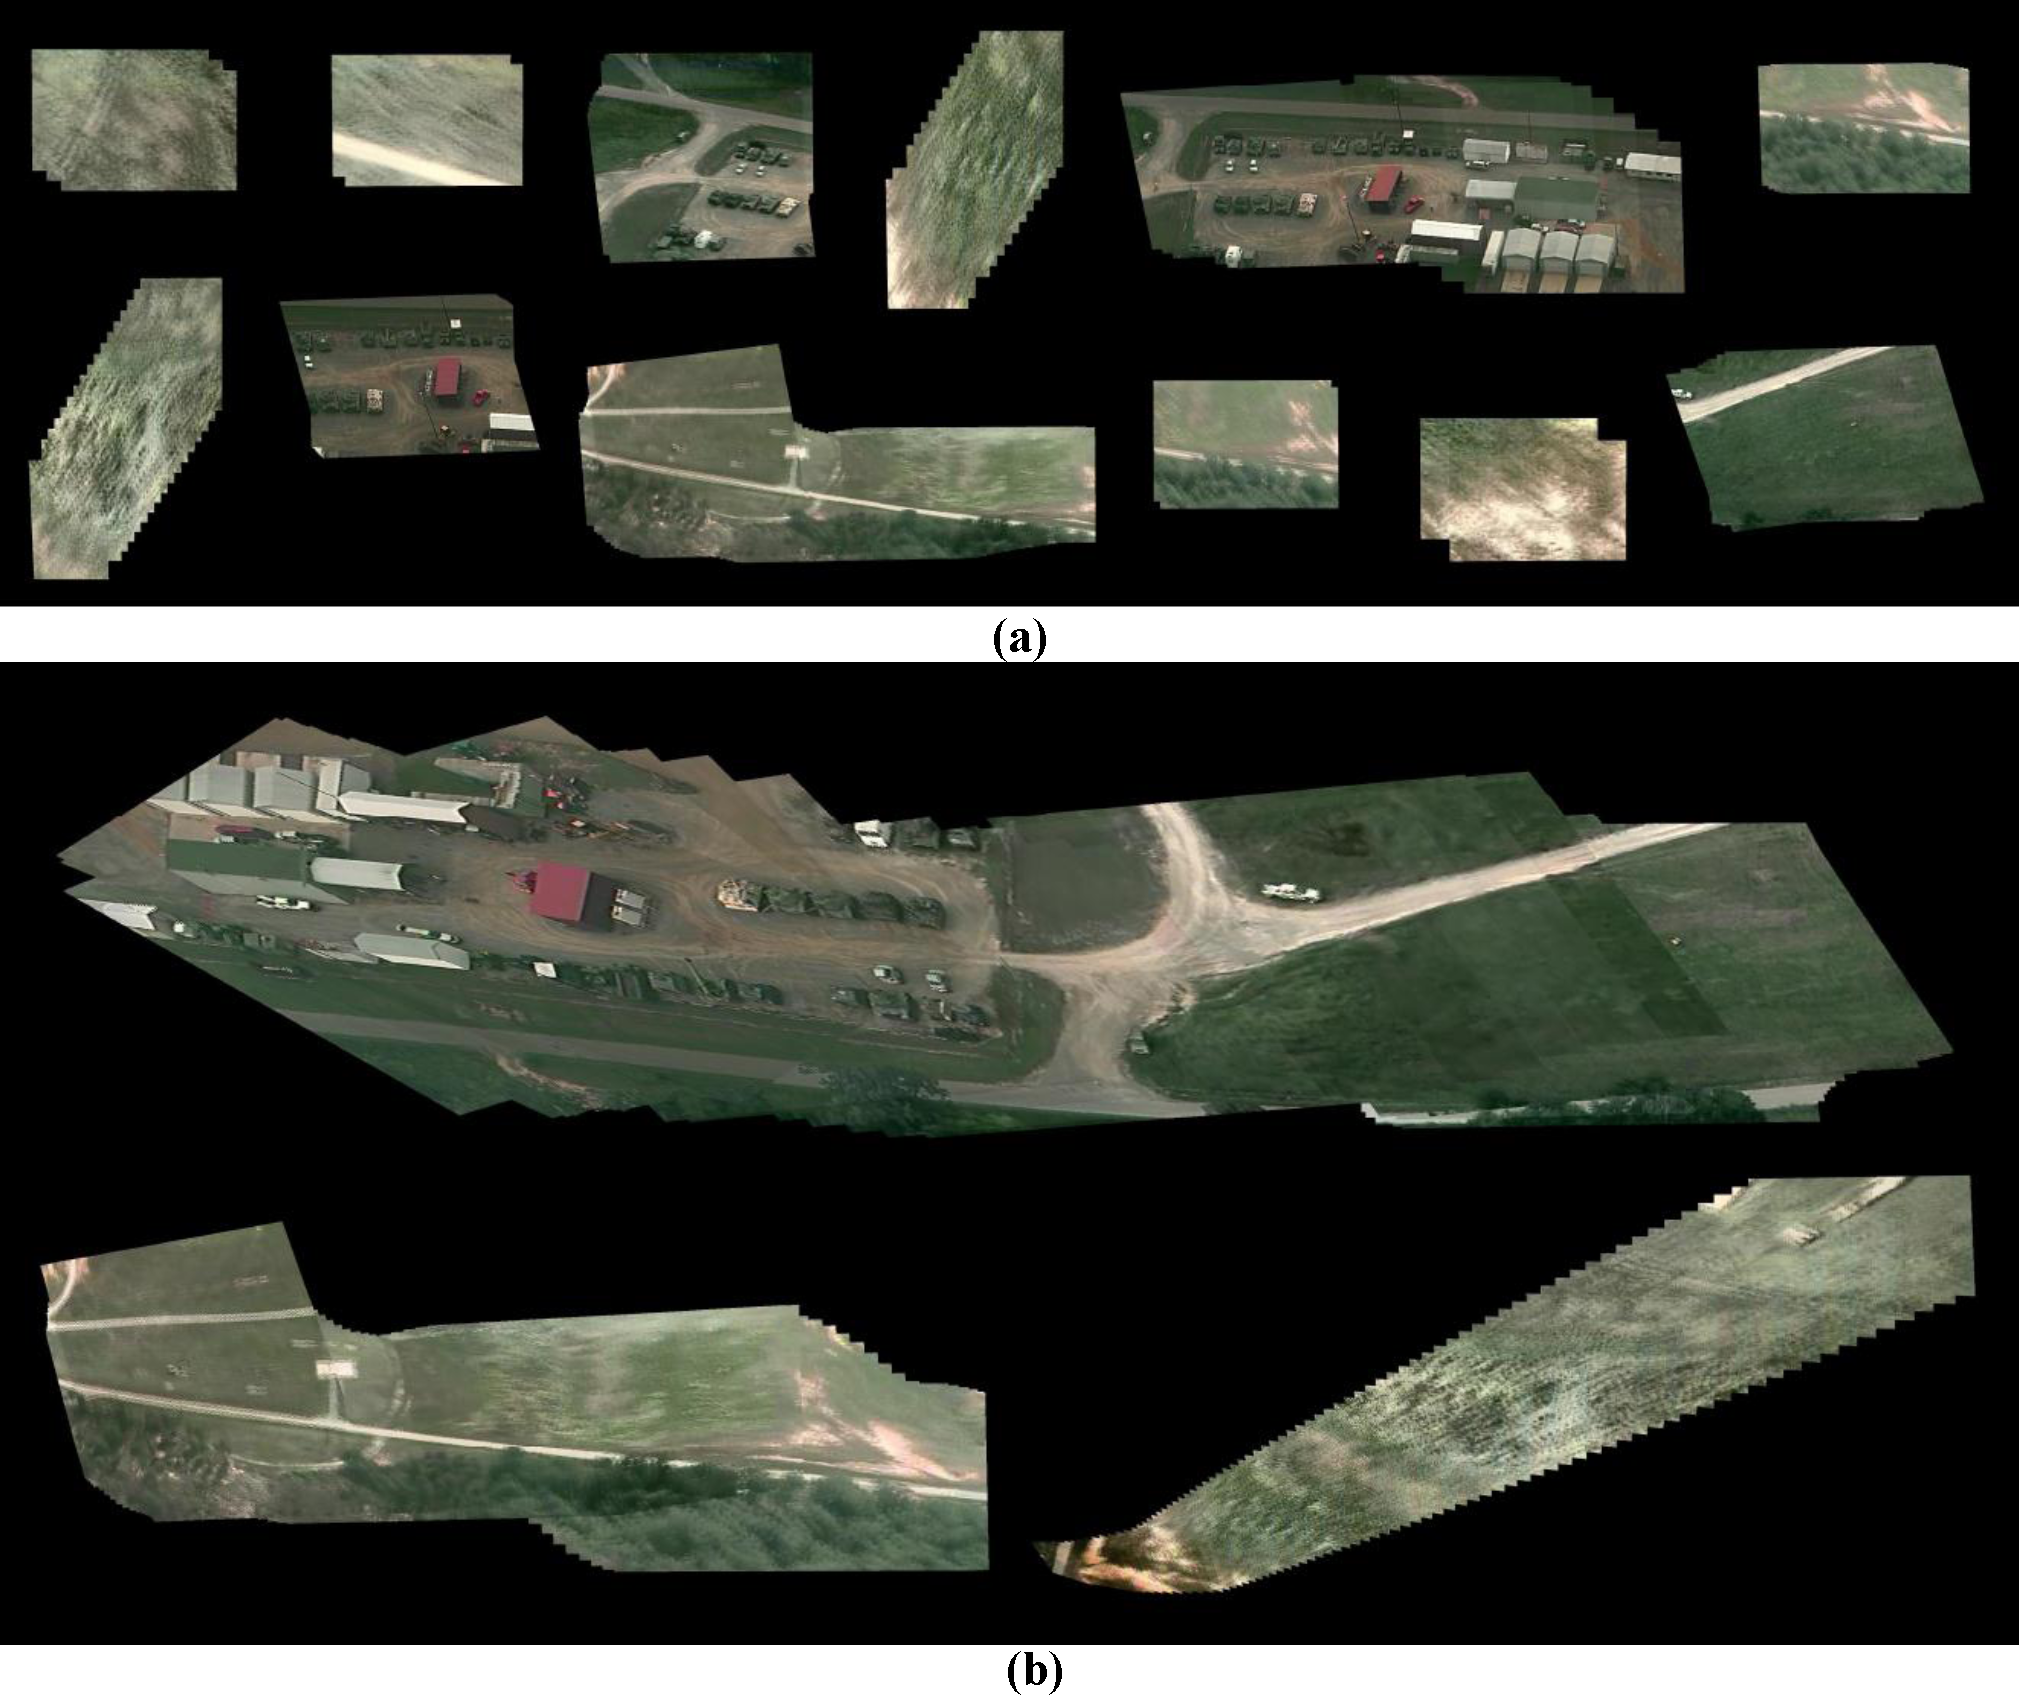
Figure 4 shows an example of retrieval stitching and our approach. The retrieval stitching method is based on feature indexing, and it requires sufficient distinctive image features. If the scene lacks enough unique features, the variance of different images is not enough for the method to reliably find correct matches. In
Figure 4a, in the low texture and self-similar grassland scene, retrieval stitching outputs 12 small scene fragments from 3 scenes. Through exploring the sequential groups firstly, our method significantly reduces the risk of retrieval failure by cross-group retrieval and completely generates three panoramas (as shown in
Figure 4b).
Further, we see that retrieval stitching achieves similar TP and FP as hybrid stitching only in two videos (
Table 1, VIRAT 02 and 10). In all of the other 22 videos, hybrid stitching outperforms retrieval stitching in all metrics. In addition, the processing time of hybrid stitching is only half of retrieval stitching, and this advantage becomes more apparent as the increase of continuity inside the video (
Table 1, VIRAT 10 and 17).
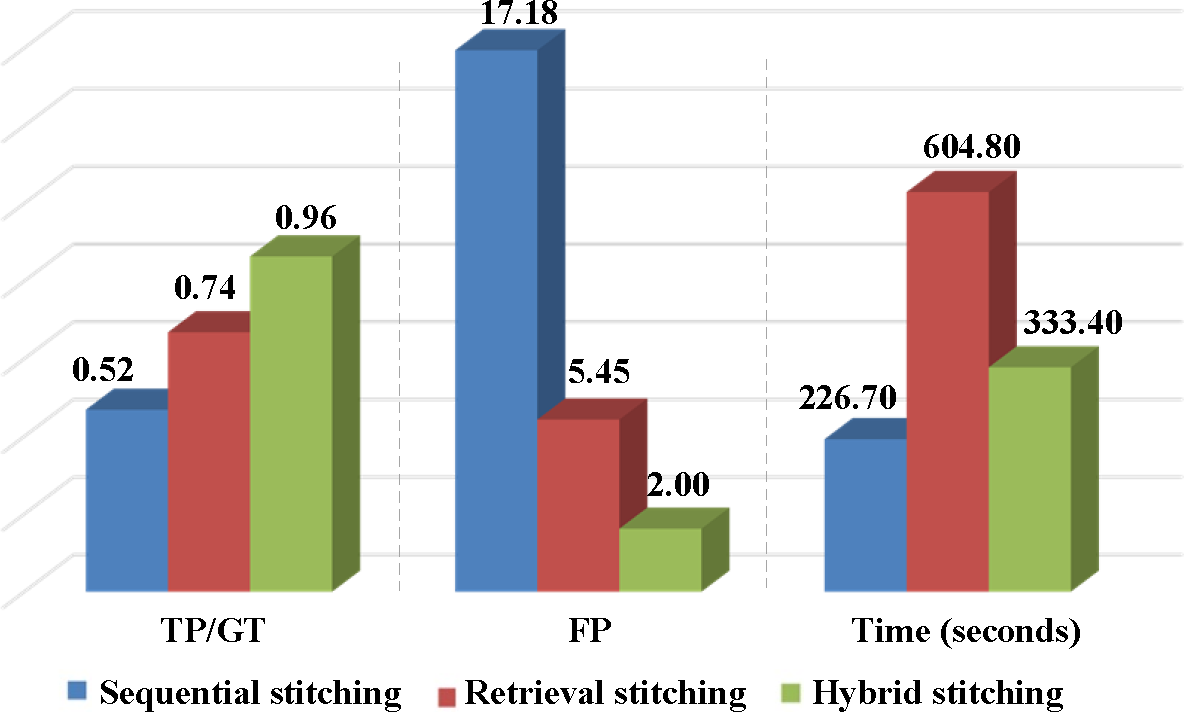
Figure 5 compares the statistic performance of 24 VIRAT videos. Our hybrid stitching achieves the highest TP and lowest FP, and its processing speed is even comparable with the fastest sequential stitching approach. On average, our method only costs 333.4 s to find 96% panoramas with 2 false positives. The significant improvements over retrieval stitching show the utility of combing temporal sequential grouping and cross-group retrieval in one hybrid stitching framework.
The previous experiments show two sample results between sequential stitching, retrieval stitching and our approach. Next, we compare the three methods on all 24 VIRAT videos.
Table 1 shows the quantitative comparison results on 24 VIRAT videos. The first column is the video indexing; the second column shows the image number of each VIRAT video. The manually-labeled ground truth (GT) is shown in the third column. The TP, FP and processing time of sequential stitching, retrieval stitching and our hybrid stitching are shown in the other columns.
Although the processing speed of sequential stitching is the the fastest, it is easily broken by diverse changes of aerial videos. As a result, we observe that both retrieval stitching and hybrid stitching significantly outperform sequential stitching in every video with higher TP and lower FP.
Second, we compare our system with state-of-the-art stitching systems, including PTGui [
21], AutoStitch [
19] and the very recent scheme by Autopano [
22]. In order to compare the performance on the entire VIRAT dataset, we extract one image of every two seconds from the 24 VIRAT videos, and the total number of images is 2312.
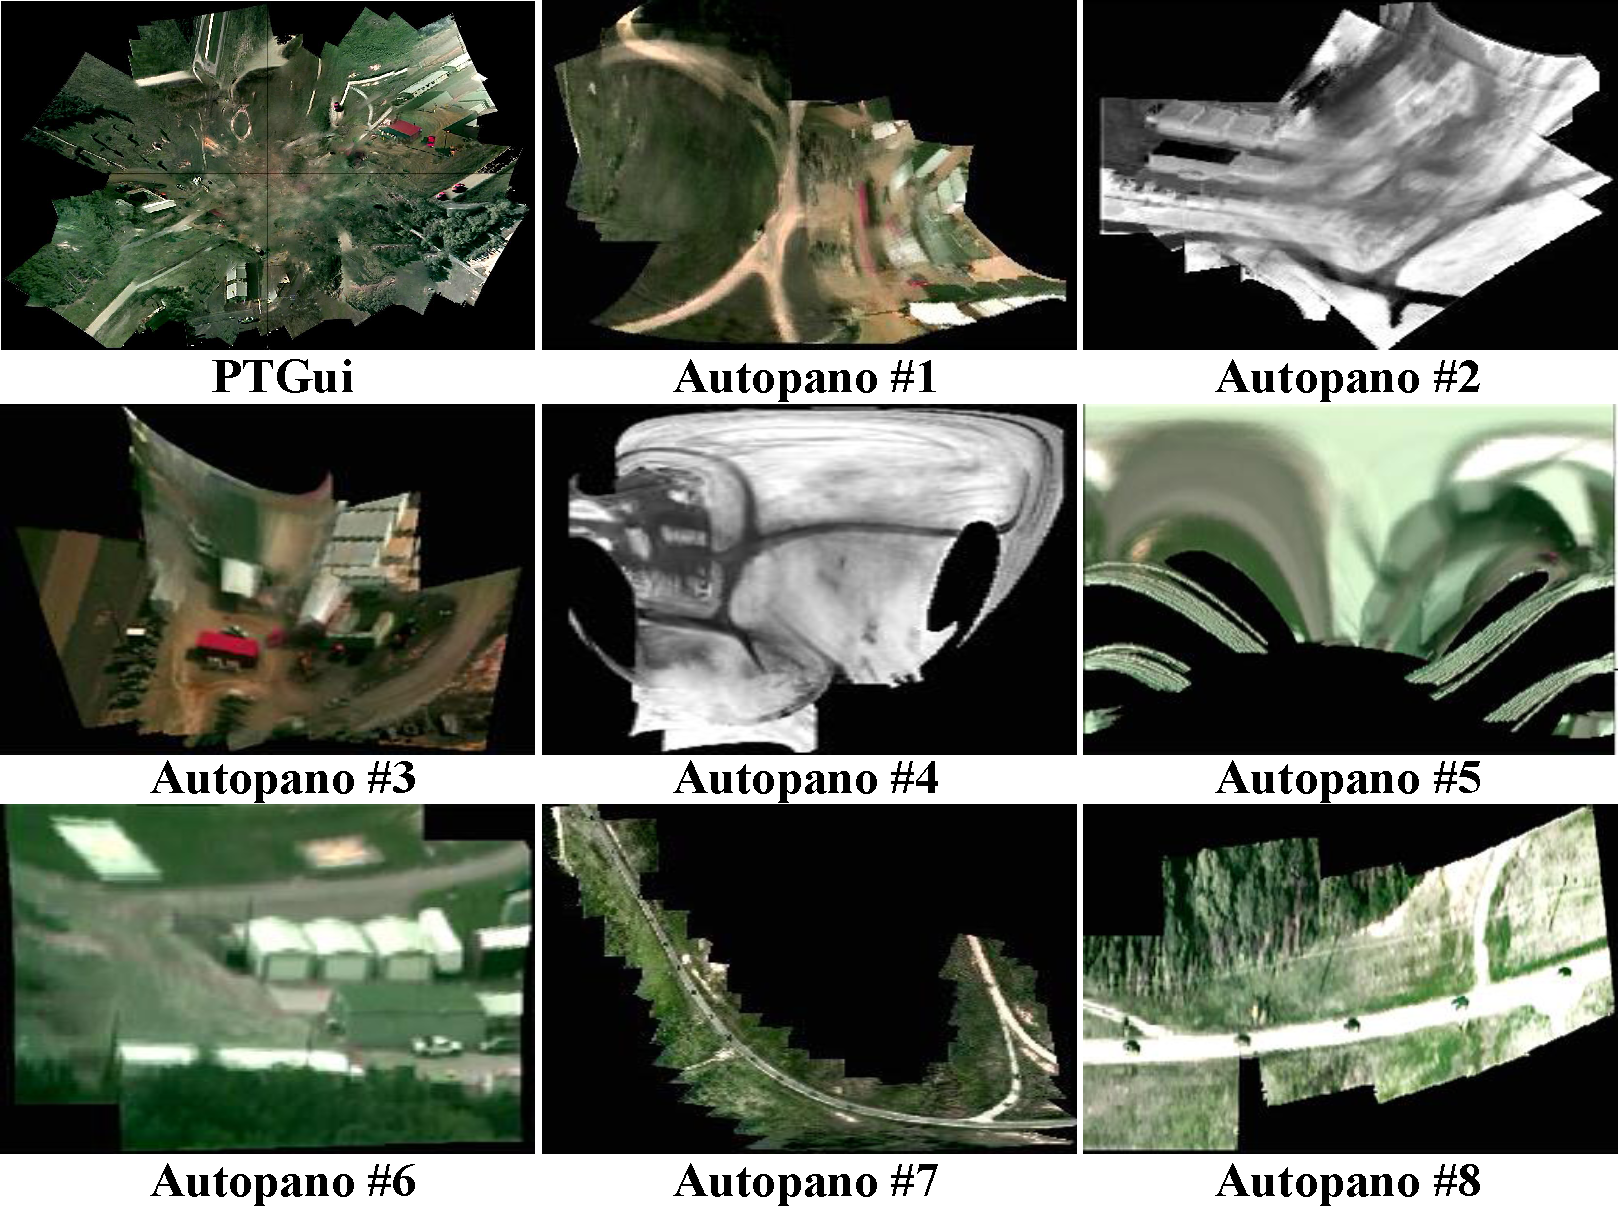
Figure 6 shows the results of the state-of-the-art systems. Due to the lack of the ability for scene recognition, PTGui cannot automatically find overlapping image groups from the input video. It costs 2 h, 18 min and 52 s to generate one false panorama with enormous artifacts (as shown in
Figure 6). Although AutoStitch [
19] can recognize a scene from a small-scale image dataset, it cannot generate a panorama even after 10 h for the large-scale dataset of this experiment. The most recent Autopano [
22] is the only system that can generate multiple panoramas from the large-scale input data. However, it costs over 10 h to create 38 panoramas, in which 18 panoramas contain significant artifacts (samples are shown in
Figure 6, Autopano 1–5), and only 20 panoramas have reasonable visual effects (samples are shown in
Figure 6, Autopano 6–8).
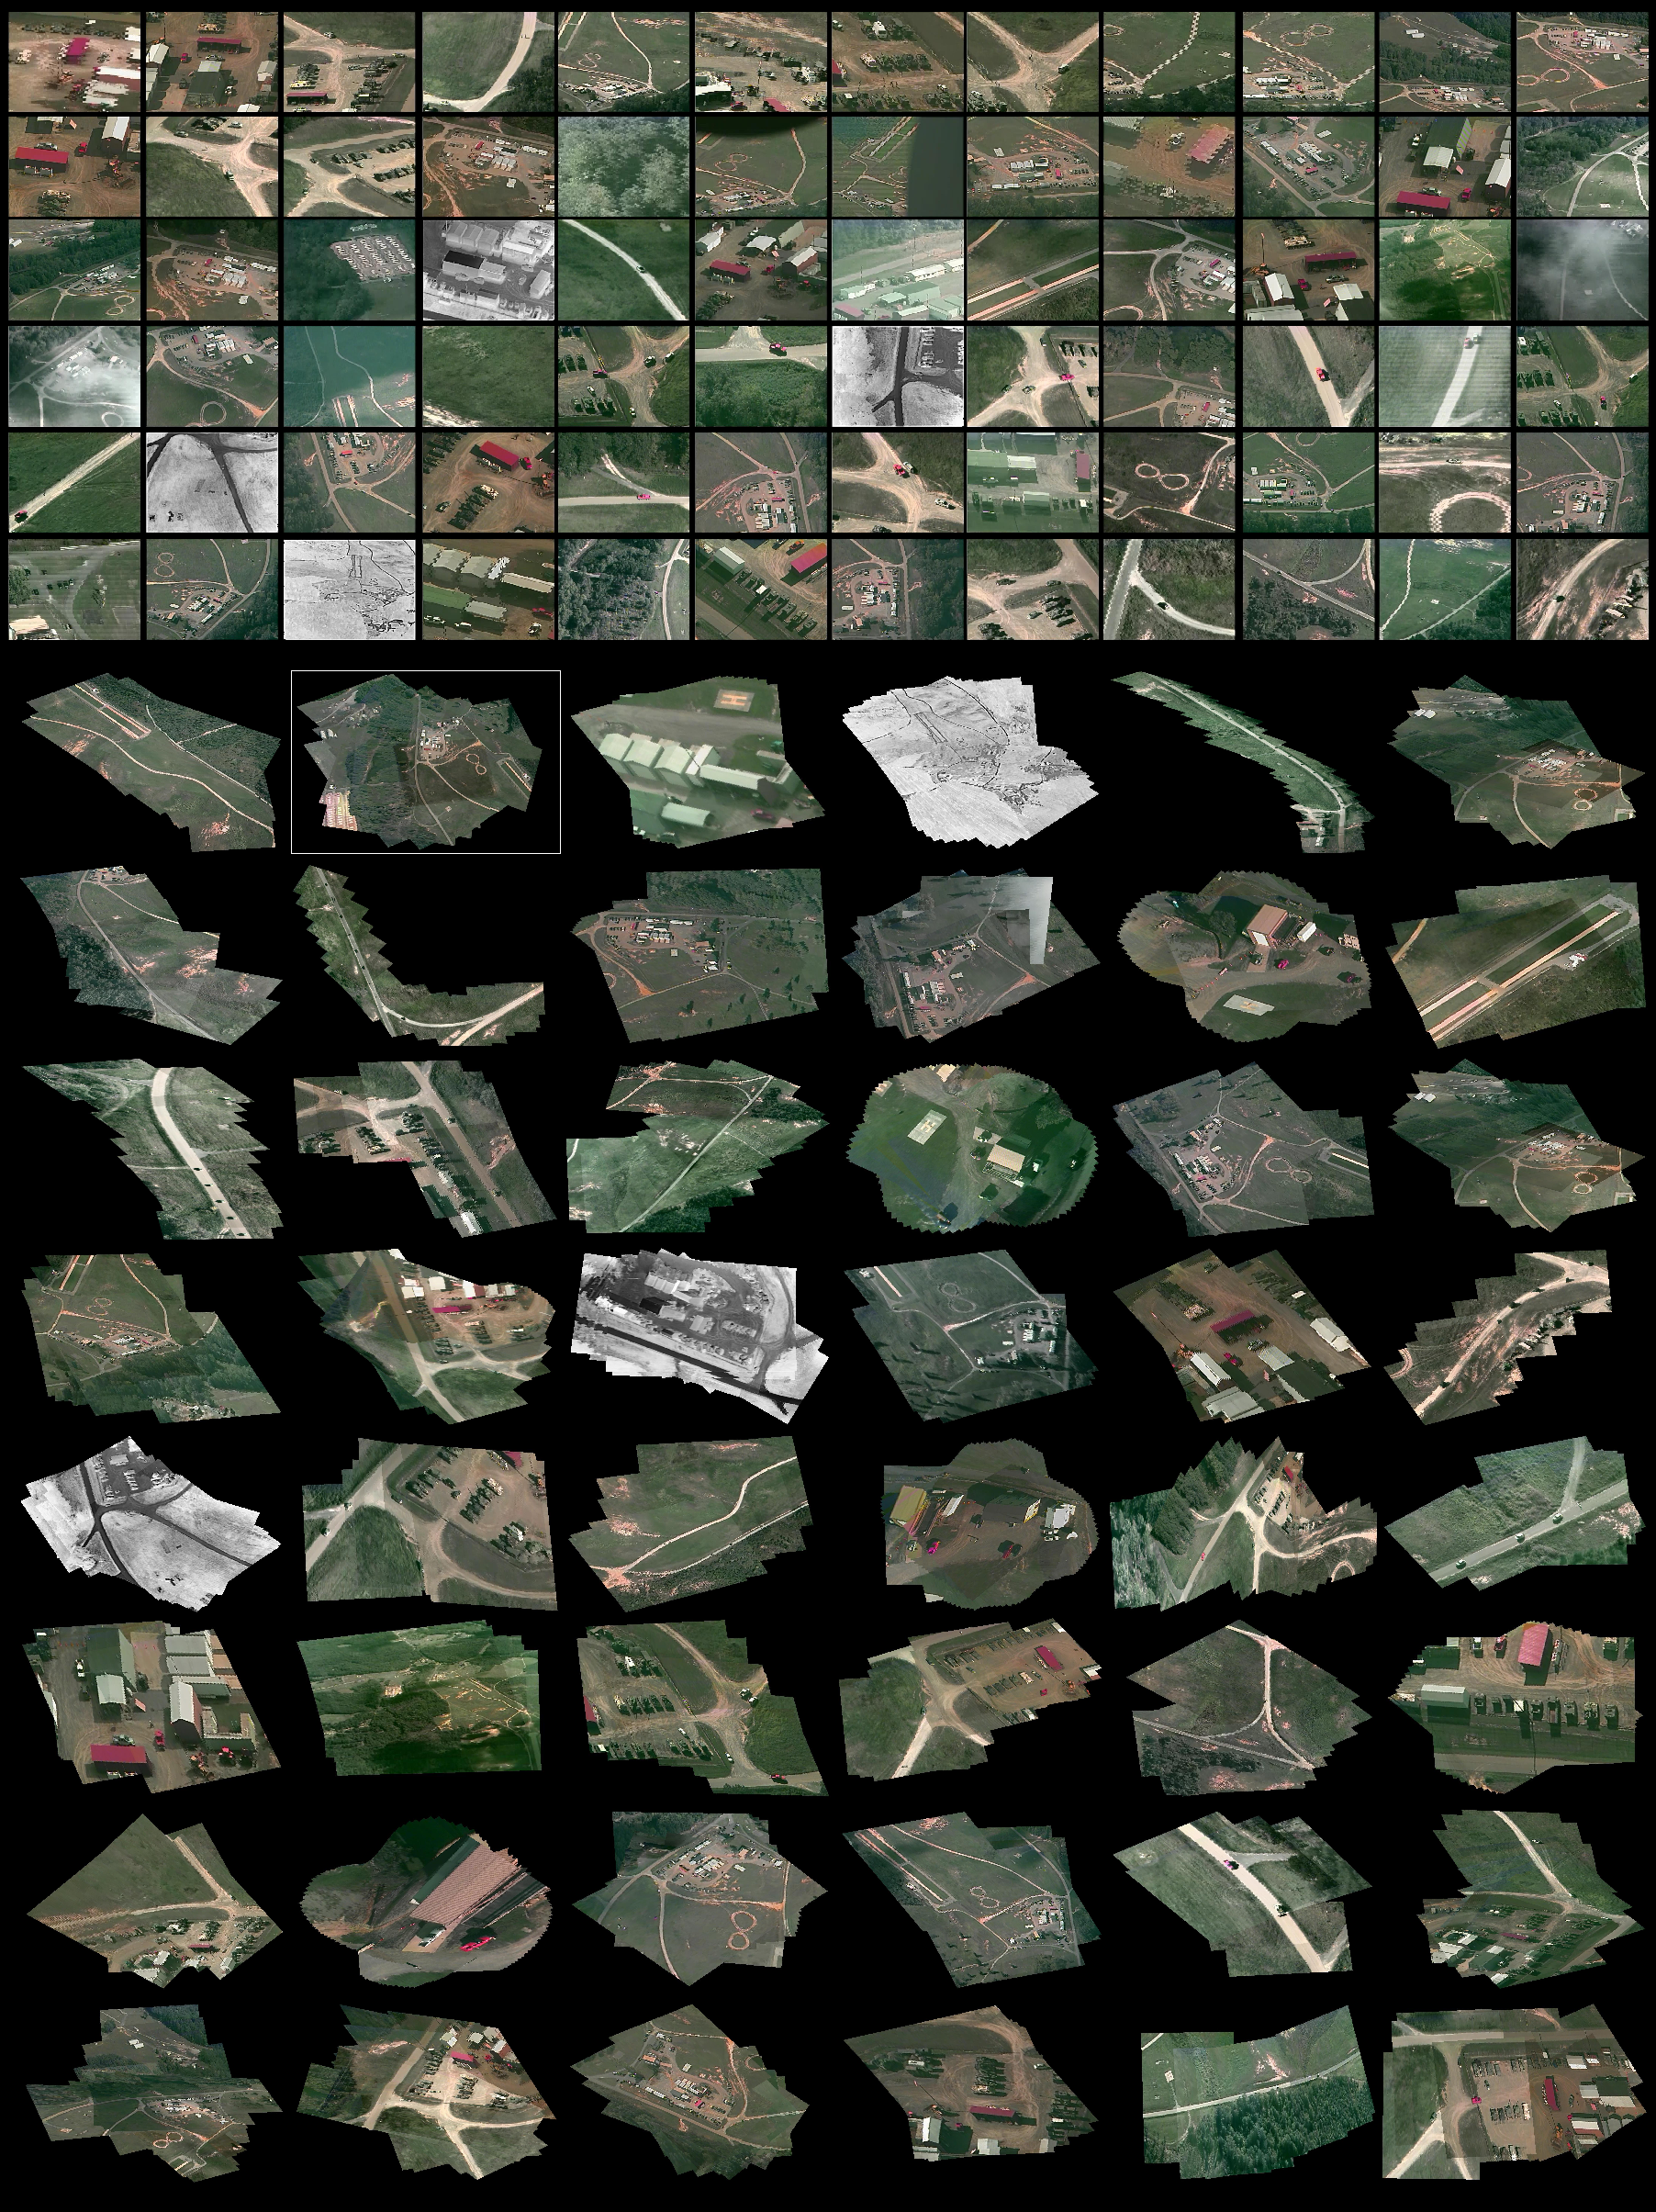
In contrast, our approach costs only 15 min and 33 s to output panoramas of 48 scenes (as shown in
Figure 7), which is much faster than the above state-of-the-art systems. Specifically, our approach firstly spends 136.112 s for feature detection and description and 160.049 s for feature indexing. Then, it uses 389.115 s for sequential grouping and cross-group retrieval. Finally, it costs 0.625 s for finding optimal paths in the entire graph, and 247.238 s for panorama stitching. As can be seen in
Figure 7, the quality of our panoramas is much better than the state-of-the-art systems with less artifacts.
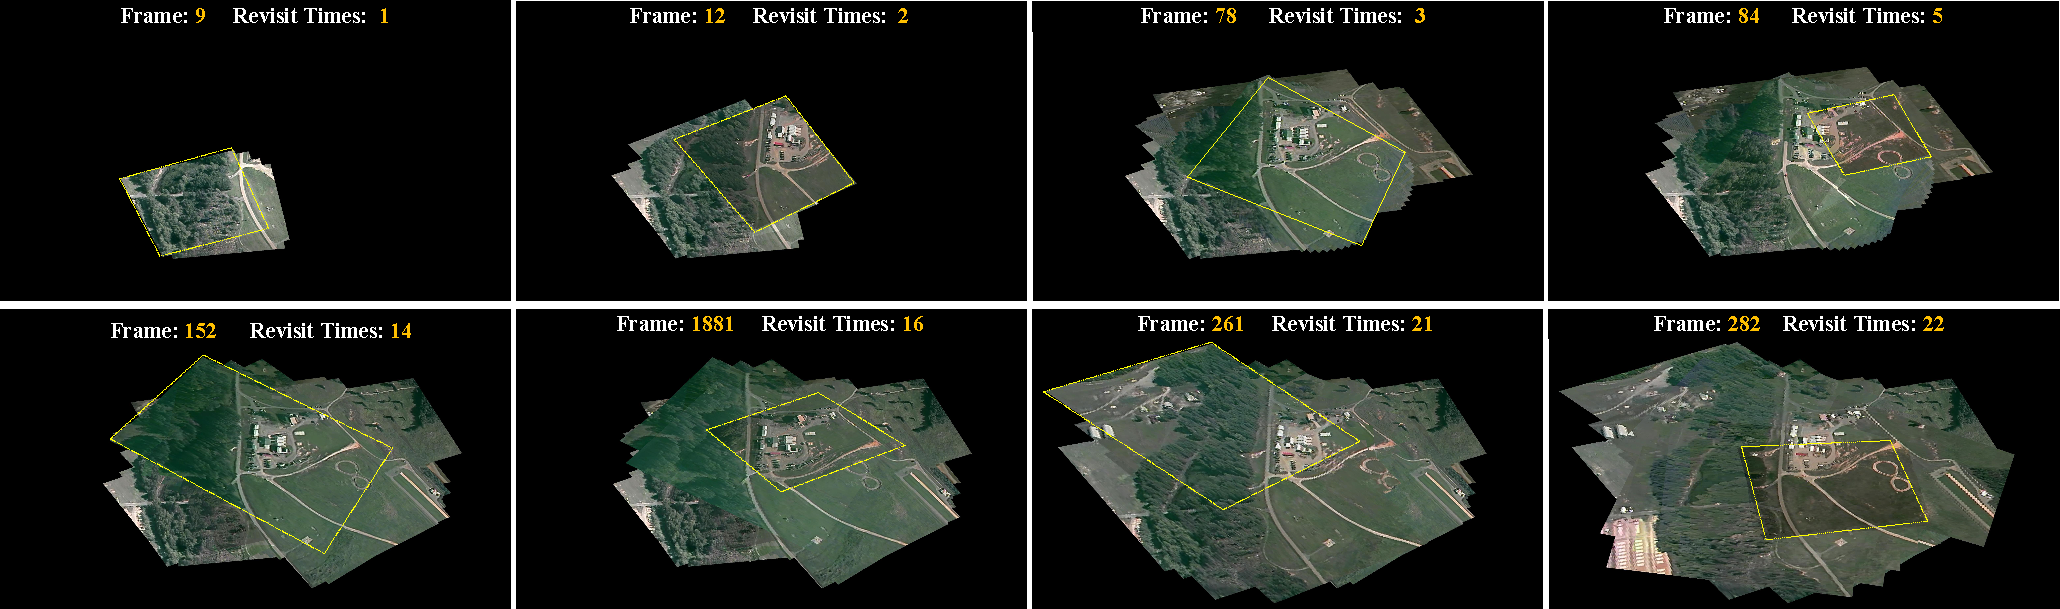
We also show a sample stitching result in
Figure 8, which illustrates the dynamic stitching process of the overall site of VIRAT dataset (as shown in
Figure 7, white bounding box). Our approach successfully extracts 22 revisits of this scene and generates a dynamic panorama with images captured at various times and viewpoints. We believe this reorganized scene panorama is particularly helpful for long-term surveillance and high level scene understanding. Experiments demonstrate the superiority of the proposed method.
4. Conclusions and Future Works
In this paper, we have proposed a powerful hybrid model for diverse scene stitching. The proposed method is based on the main findings that a large-scale aerial dataset has a close relationship to the human operators’ monitoring behavior. For the same area of interest, human operators often apply continuous monitoring and repeated monitoring, which yield short, successive video clips that overlap in time or space.
Inspired by the temporal continuity and spatial repeatability of aerial surveillance video, our model integrates the sequential grouping and cross-group retrieval into a graph-based framework. We experiment with our method on the large-scale VIRAT aerial dataset [
17], which is much more challenging than many other aerial datasets, due to its heterogeneity in image quality and diversity of the scene. To the best of our knowledge, this is the first stitching work on VIRAT. Experimental results show that our method can explicitly explore multiple panoramas from this challenging dataset. Moreover, our approach achieves a few orders of magnitude accelerations over the state-of-the-art stitching systems.
One limitation of the proposed method is that we use the homography model for vertical image stitching. Currently, most of the aerial images in our experiments are vertical images. However, For oblique aerial images, such as images taken parallel to the surface of the Earth, artifacts may appear with the homography model. For instance, for a three-dimensional building in an urban environment, the oblique images taken from different points of view are quite different. As a result, in order to generate a good panorama, highly accurate interior and exterior camera parameter extraction and 3D scene reconstruction may be required, which is more complicated compared with homography-based vertical image stitching. We would like to extend our work to diverse scene stitching with oblique aerial images in the future.
The current work is a pure image-based method for exploring diverse scenes from a large-scale aerial dataset. This image-based design makes our system very convenient to be used in many remote sensing tasks, even without any other sensor information. Considering that many aerial images may contain GPS/INS information, it is possible to embed the GPS information to further improve the robustness and efficiency of the diverse scene stitching. For instance, the GPS/INS information may be used to filter image pairs without overlapping area before feature matching or it can be used to split the entire aerial images into several groups with a similar GPS location. We would also like to consider integrating the GPS/INS information in our future work.


