
Hydrodynamic and Inundation Modeling of China’s Largest Freshwater Lake Aided by Remote Sensing Data

 , , and
Abstract
:
1. Introduction
2. Study Area and Available Data
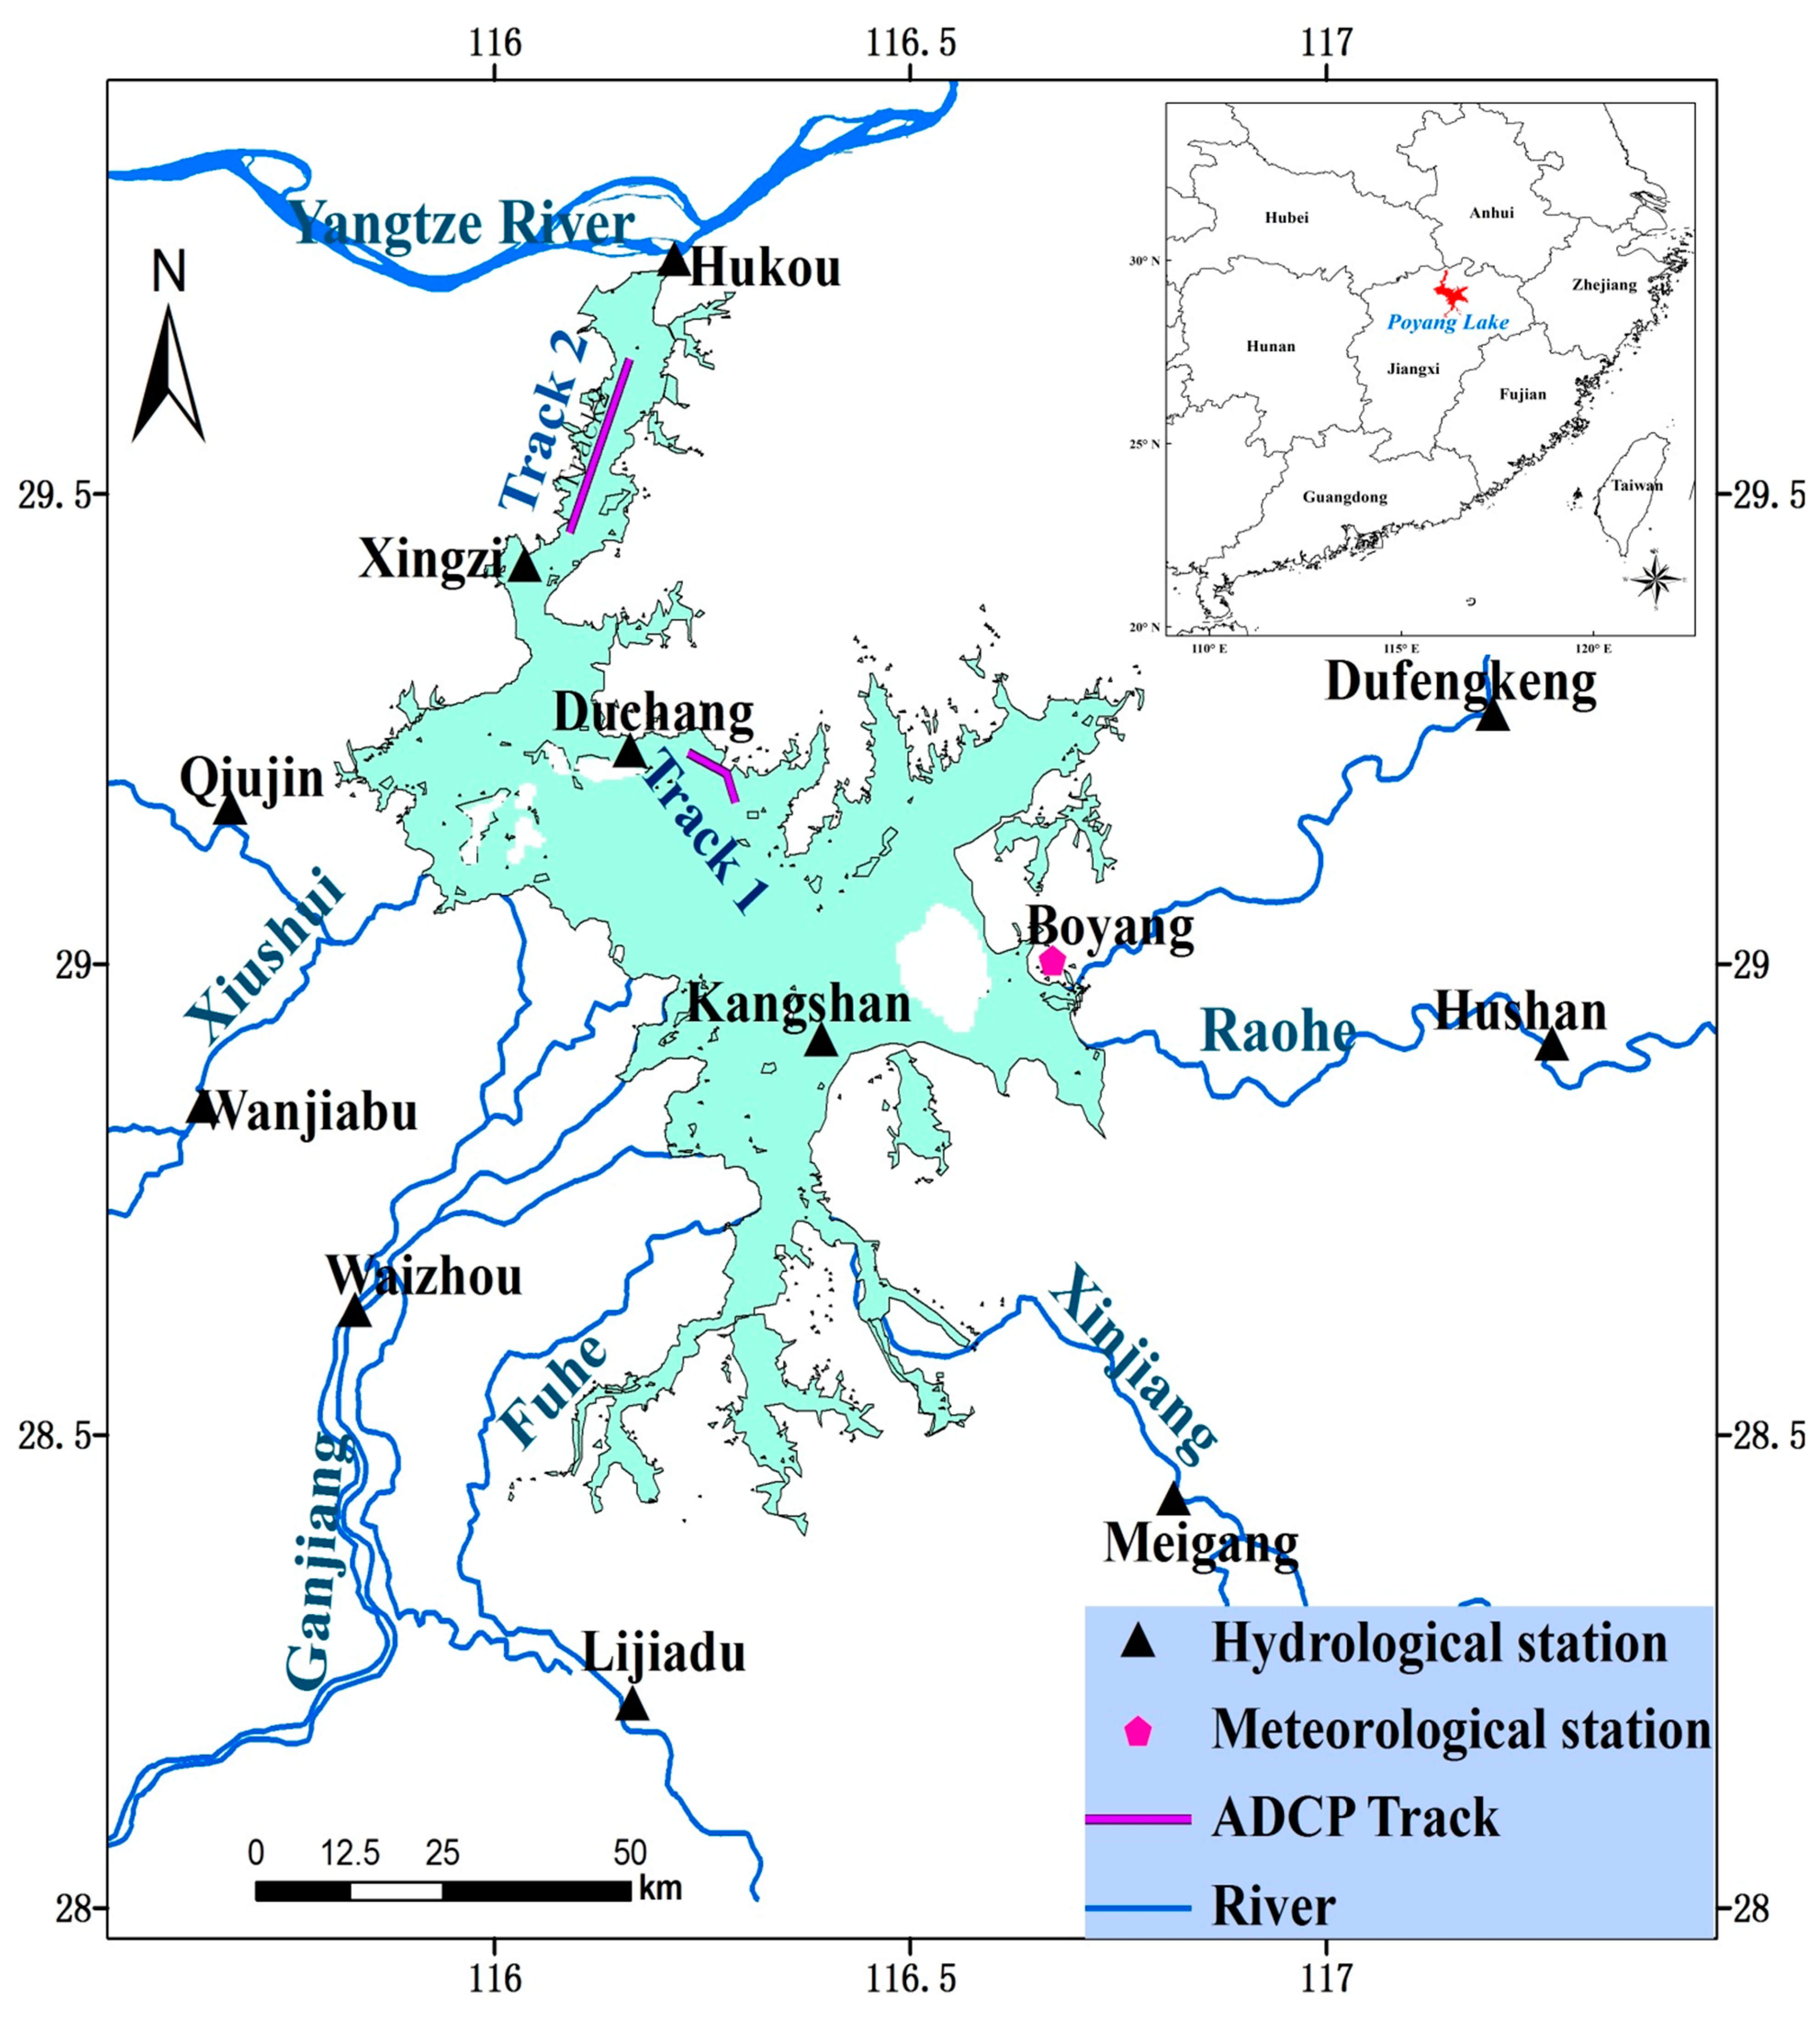
2.1. Study Area
2.2. Data Preparation

| Month | 2001 | 2002 | 2003 | 2004 | 2005 | 2006 | 2007 | 2008 | 2009 | 2010 |
|---|---|---|---|---|---|---|---|---|---|---|
| Jan | 2 | 5 | 6 | 2 | 2 | 6 | 8 | 6 | 9 | 3 |
| Feb | 1 | 1 | 4 | 5 | 1 | 1 | 8 | 6 | 4 | 3 |
| Mar | 2 | 1 | 3 | 5 | 3 | 2 | 3 | 6 | 4 | 5 |
| Apr | 1 | 2 | 3 | 5 | 7 | 3 | 3 | 4 | 8 | 2 |
| May | 3 | 2 | 4 | 3 | 1 | 3 | 6 | 5 | 9 | 8 |
| Jun | 1 | 1 | 1 | 2 | 6 | 1 | 1 | 1 | 1 | 1 |
| Jul | 5 | 9 | 6 | 4 | 2 | 2 | 2 | 2 | 4 | 3 |
| Aug | 1 | 3 | 4 | 3 | 1 | 3 | 3 | 2 | 5 | 9 |
| Sep | 5 | 5 | 7 | 7 | 8 | 9 | 7 | 5 | 5 | 4 |
| Oct | 4 | 11 | 14 | 12 | 10 | 4 | 8 | 4 | 11 | 9 |
| Nov | 7 | 5 | 9 | 10 | 5 | 6 | 13 | 15 | 10 | 11 |
| Dec | 2 | 1 | 7 | 12 | 12 | 10 | 3 | 9 | 4 | 4 |
| Total | 34 | 46 | 68 | 70 | 58 | 50 | 65 | 65 | 74 | 62 |
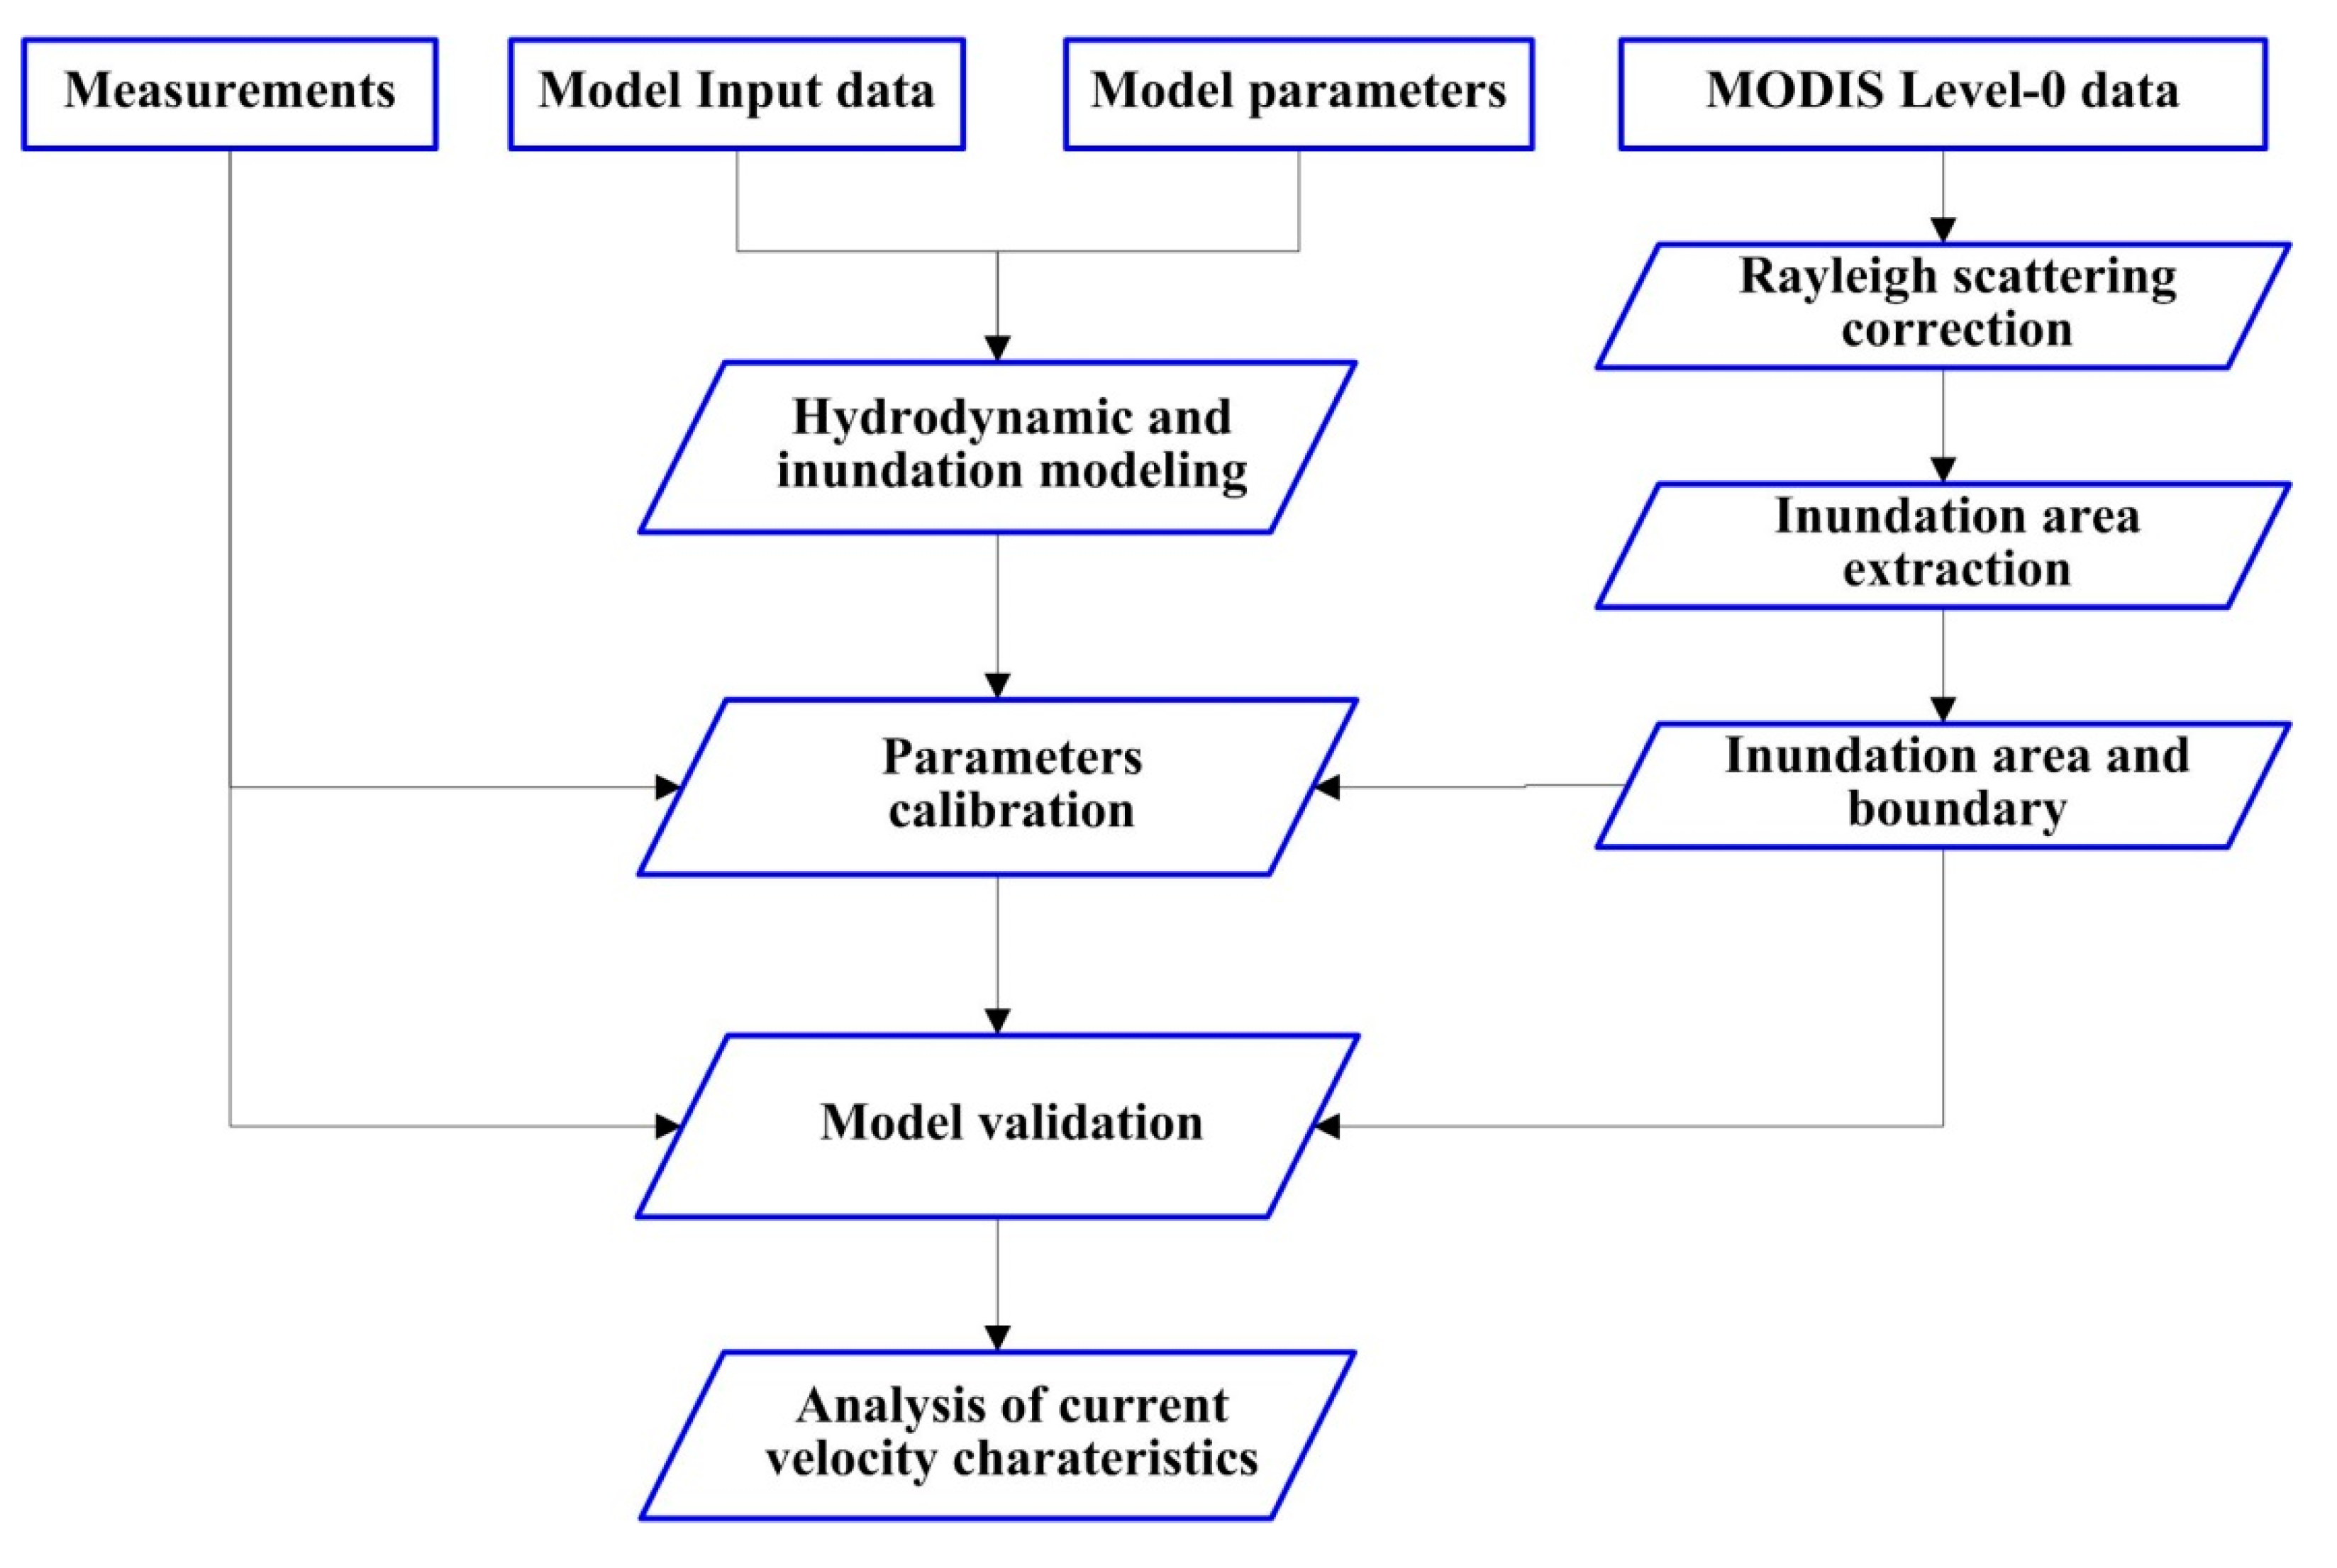
3. Methods

3.1. Extraction of the Inundation Area
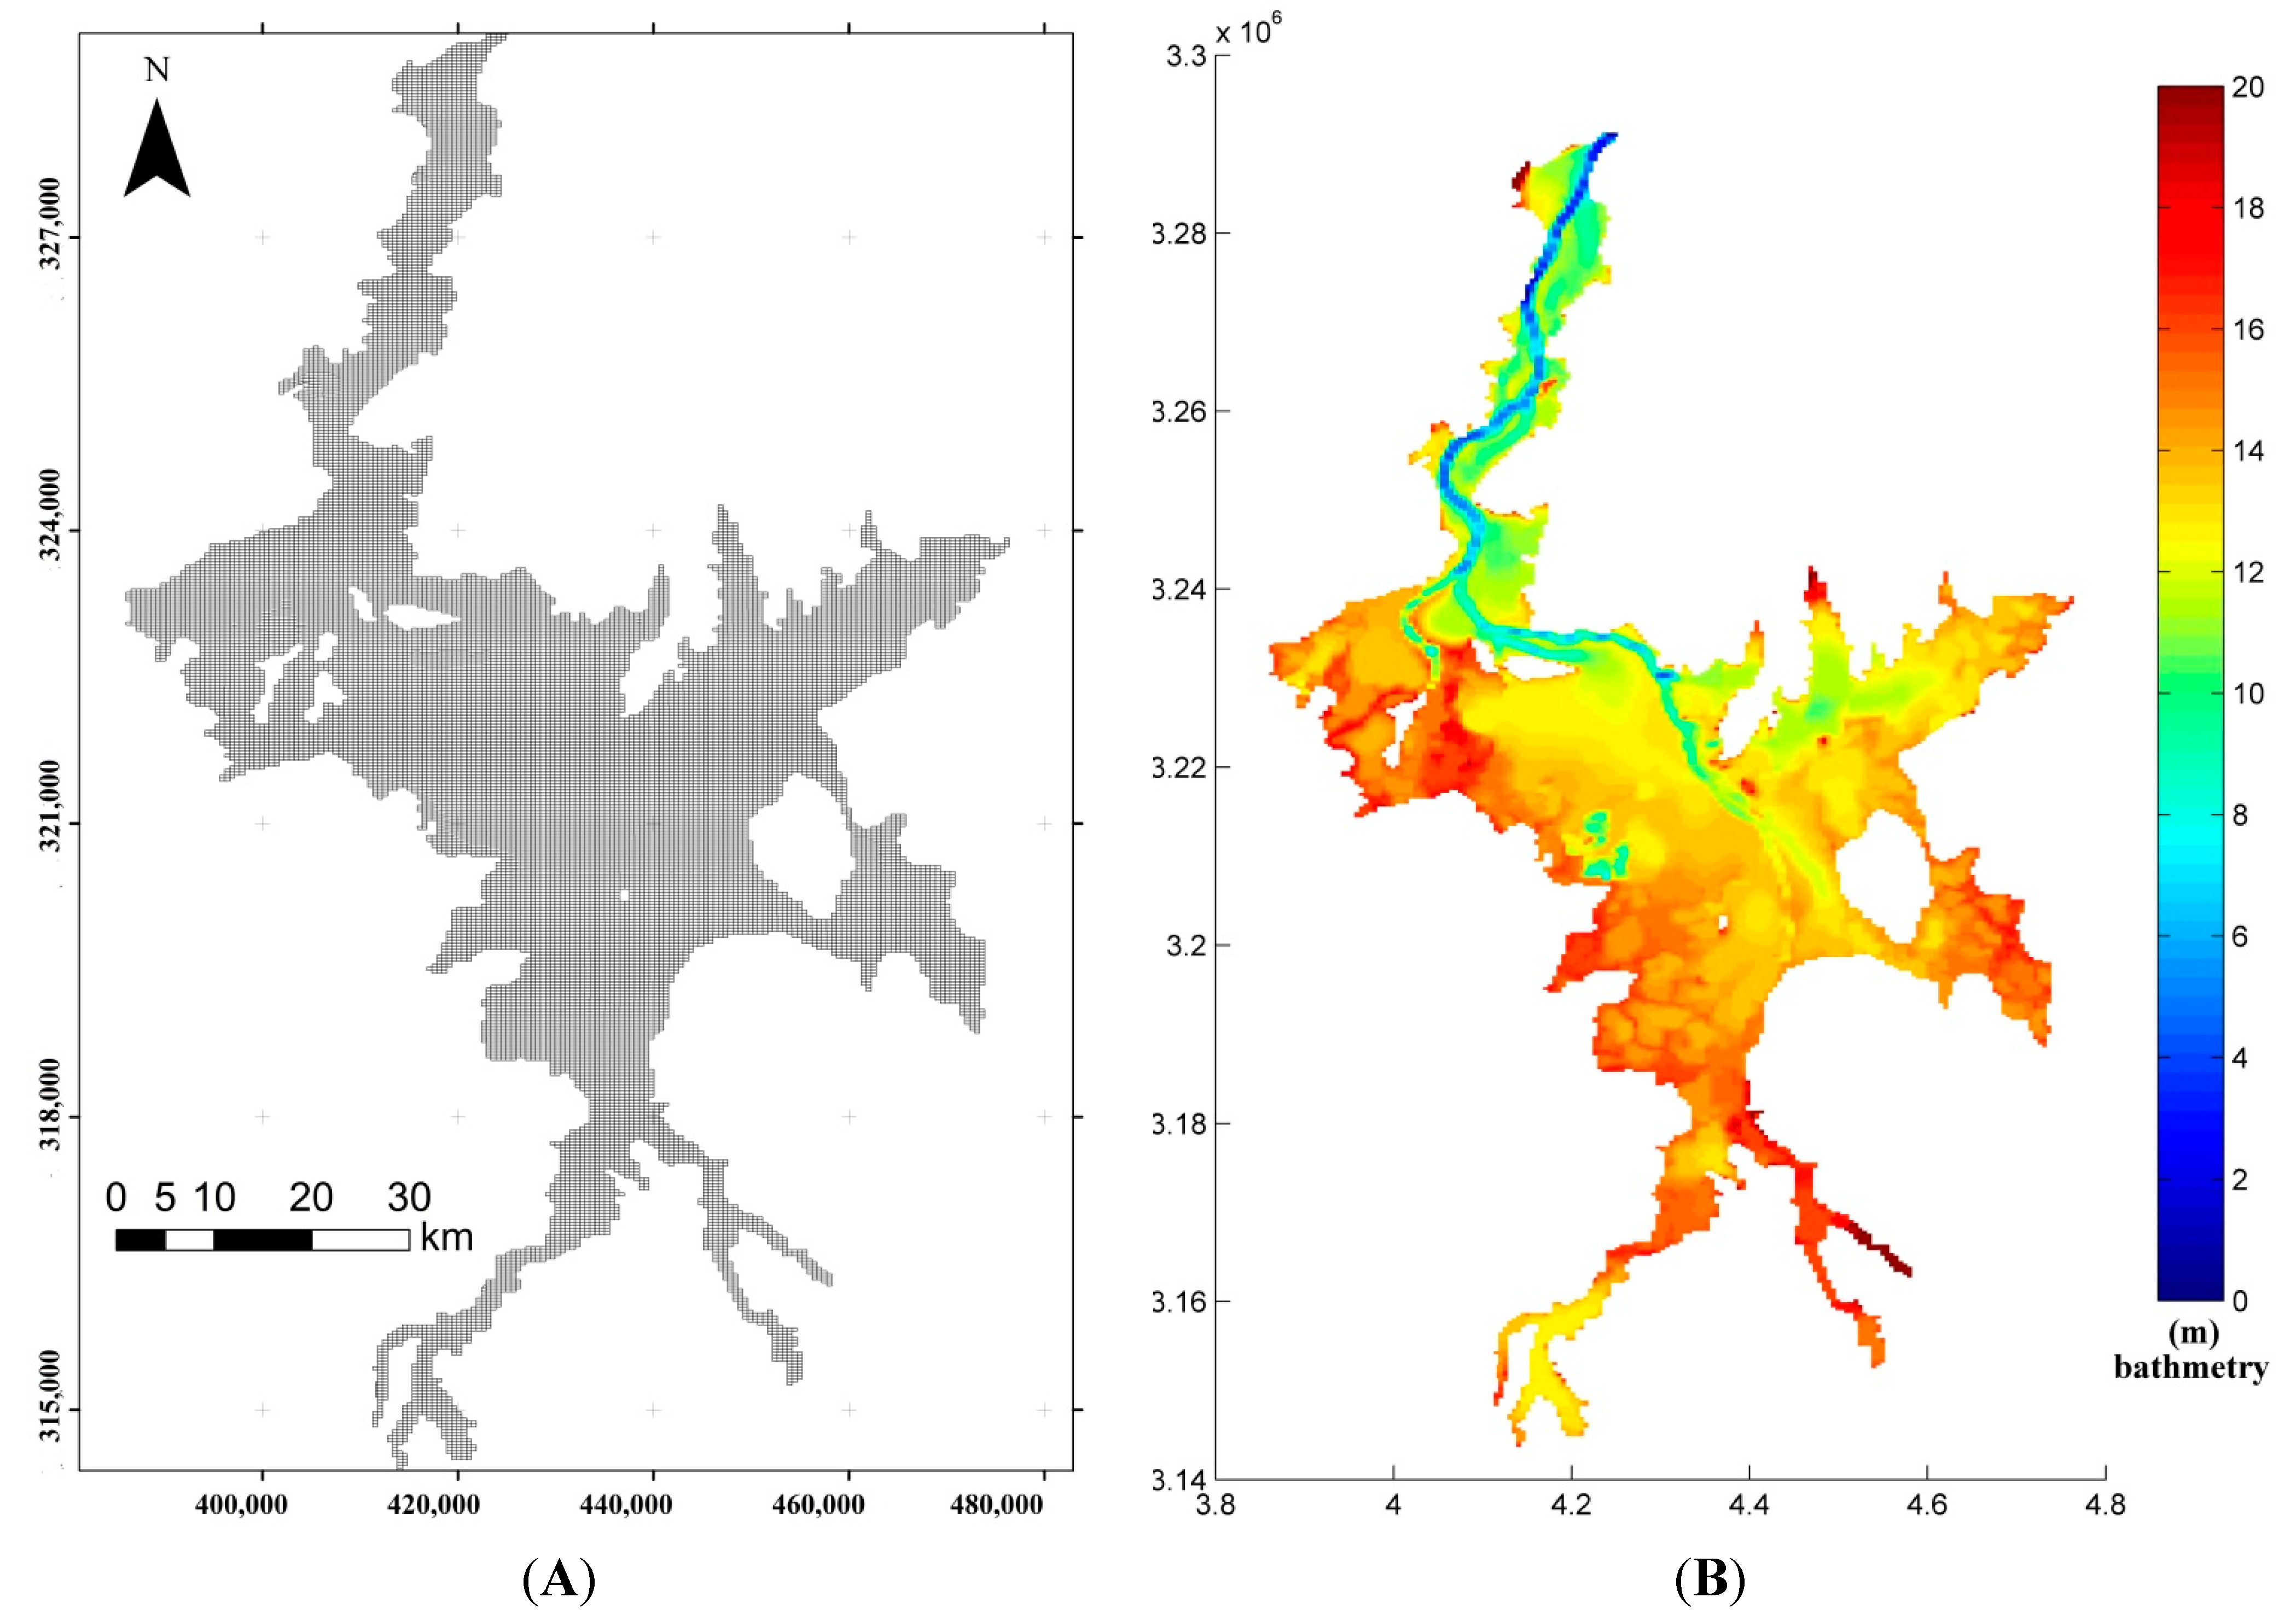
3.2. Establishment of the Poyang Lake Hydrodynamic Model

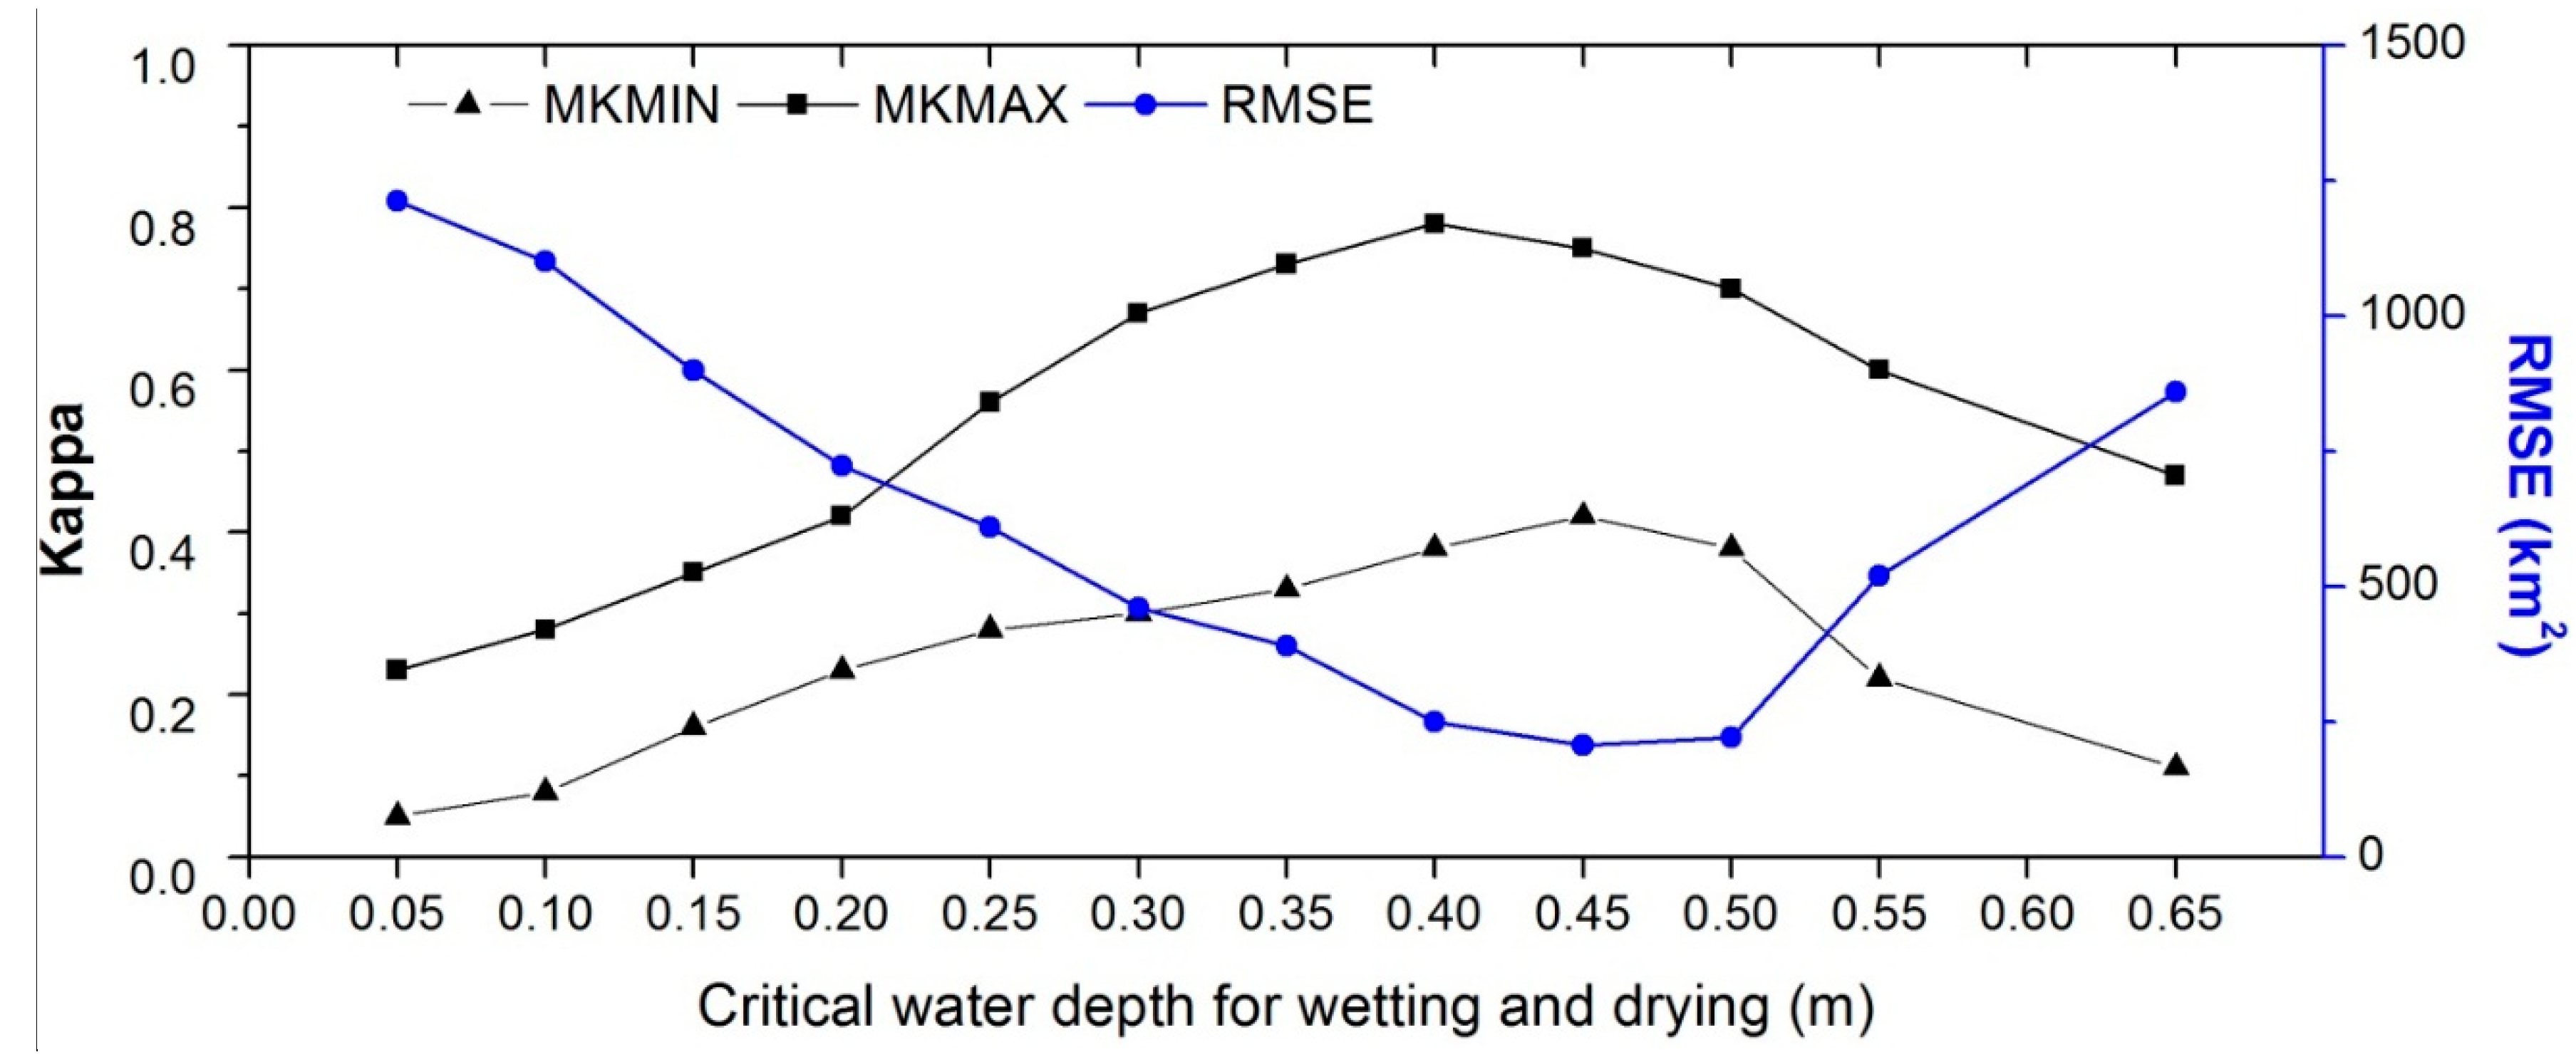
3.3. Model Parameter Calibration
3.4. Model Evaluation
4. Results and Discussion
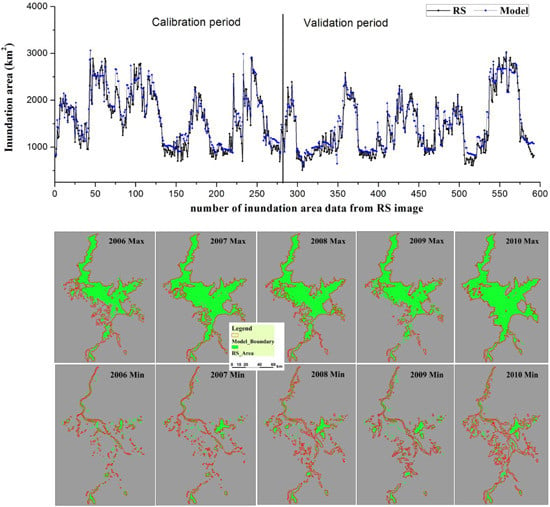
4.1. Model Calibration and Validation Results
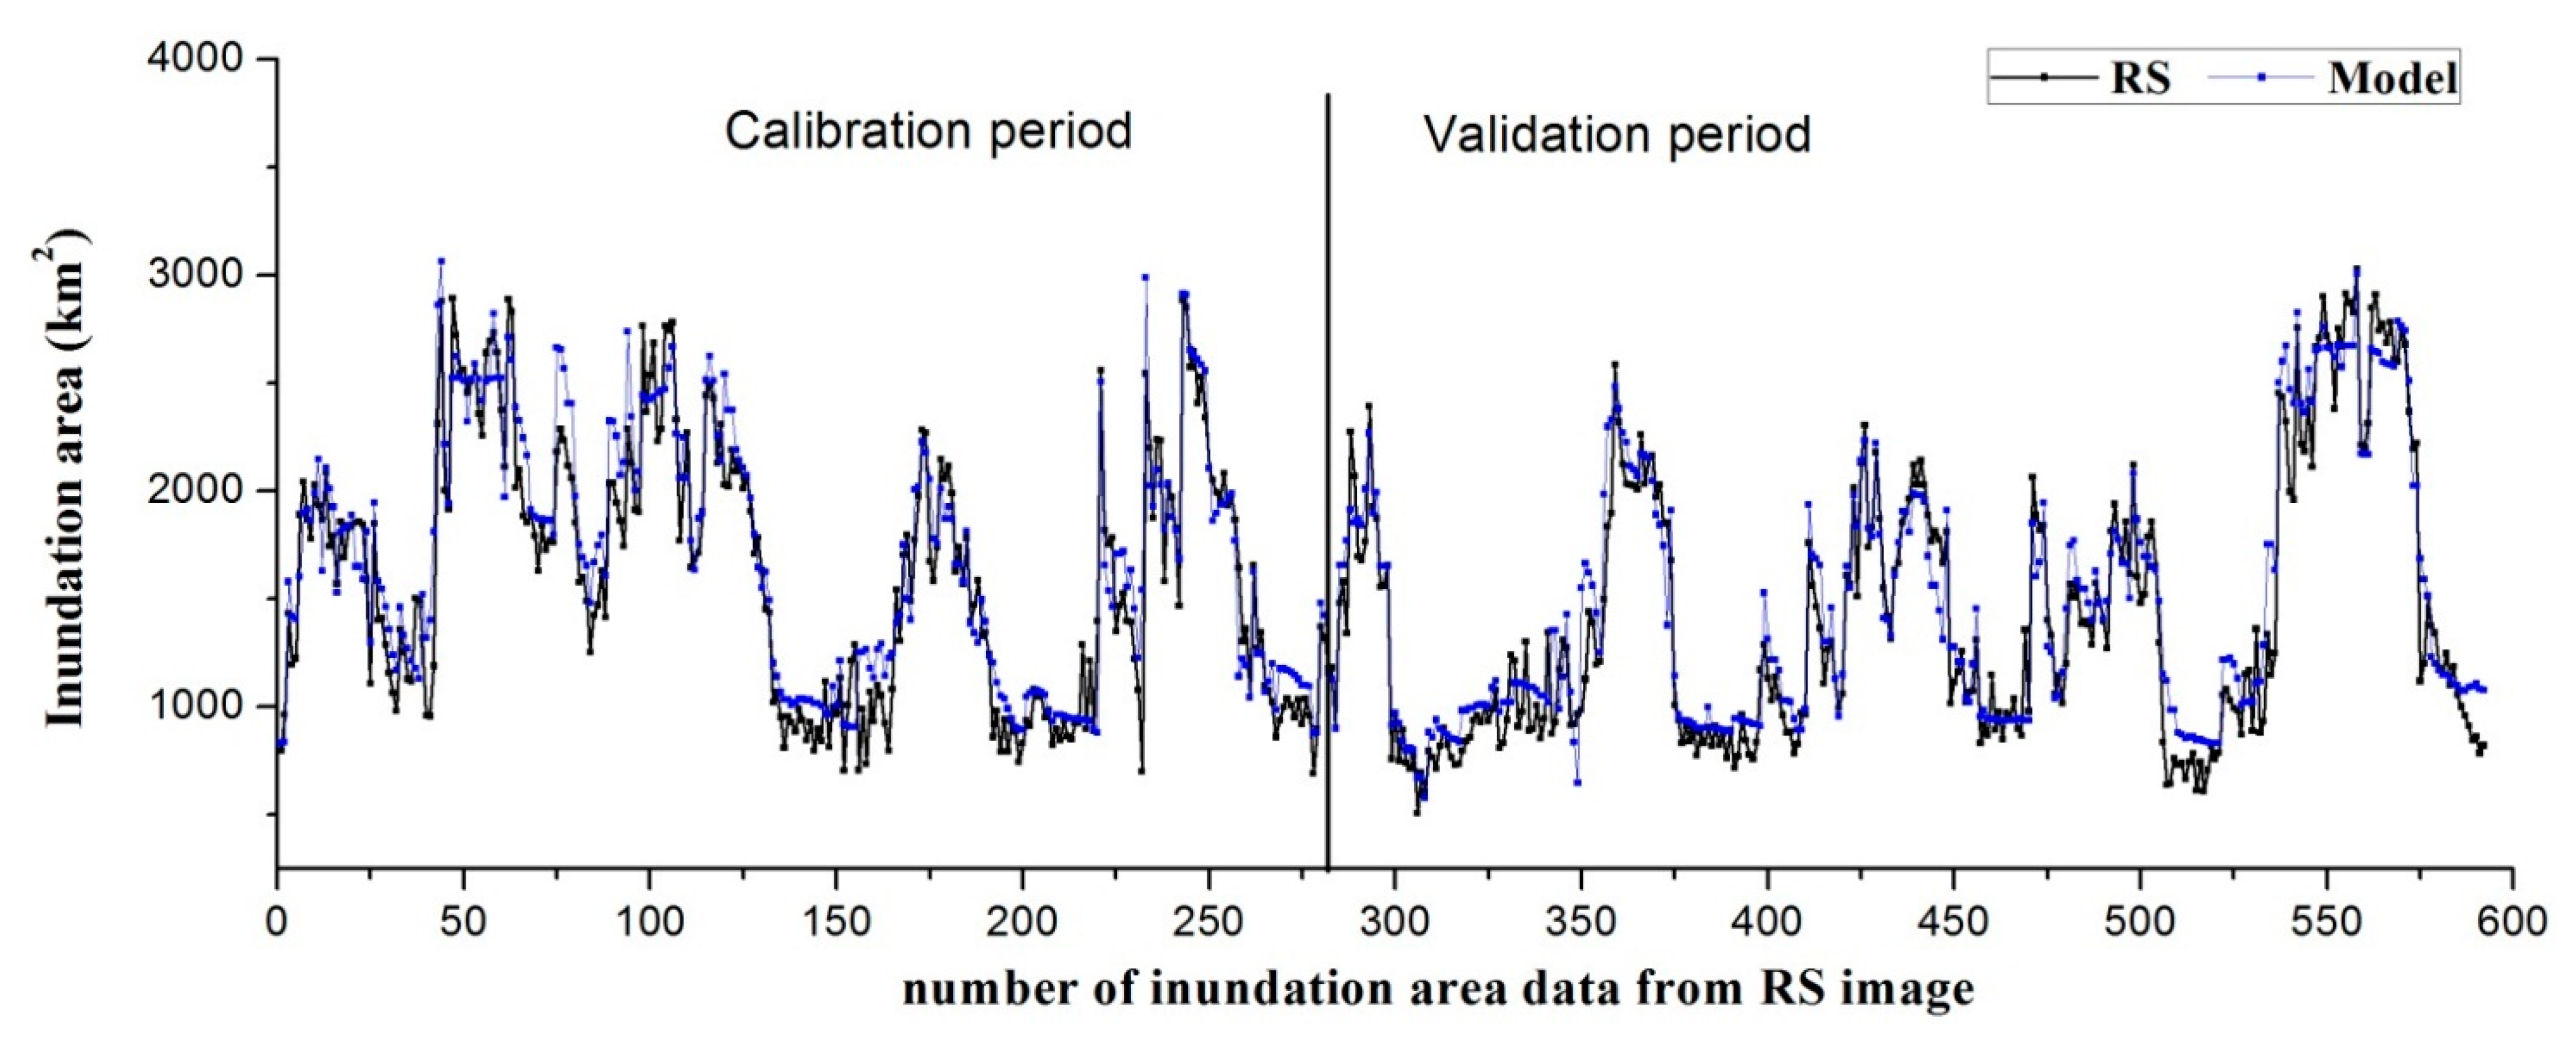
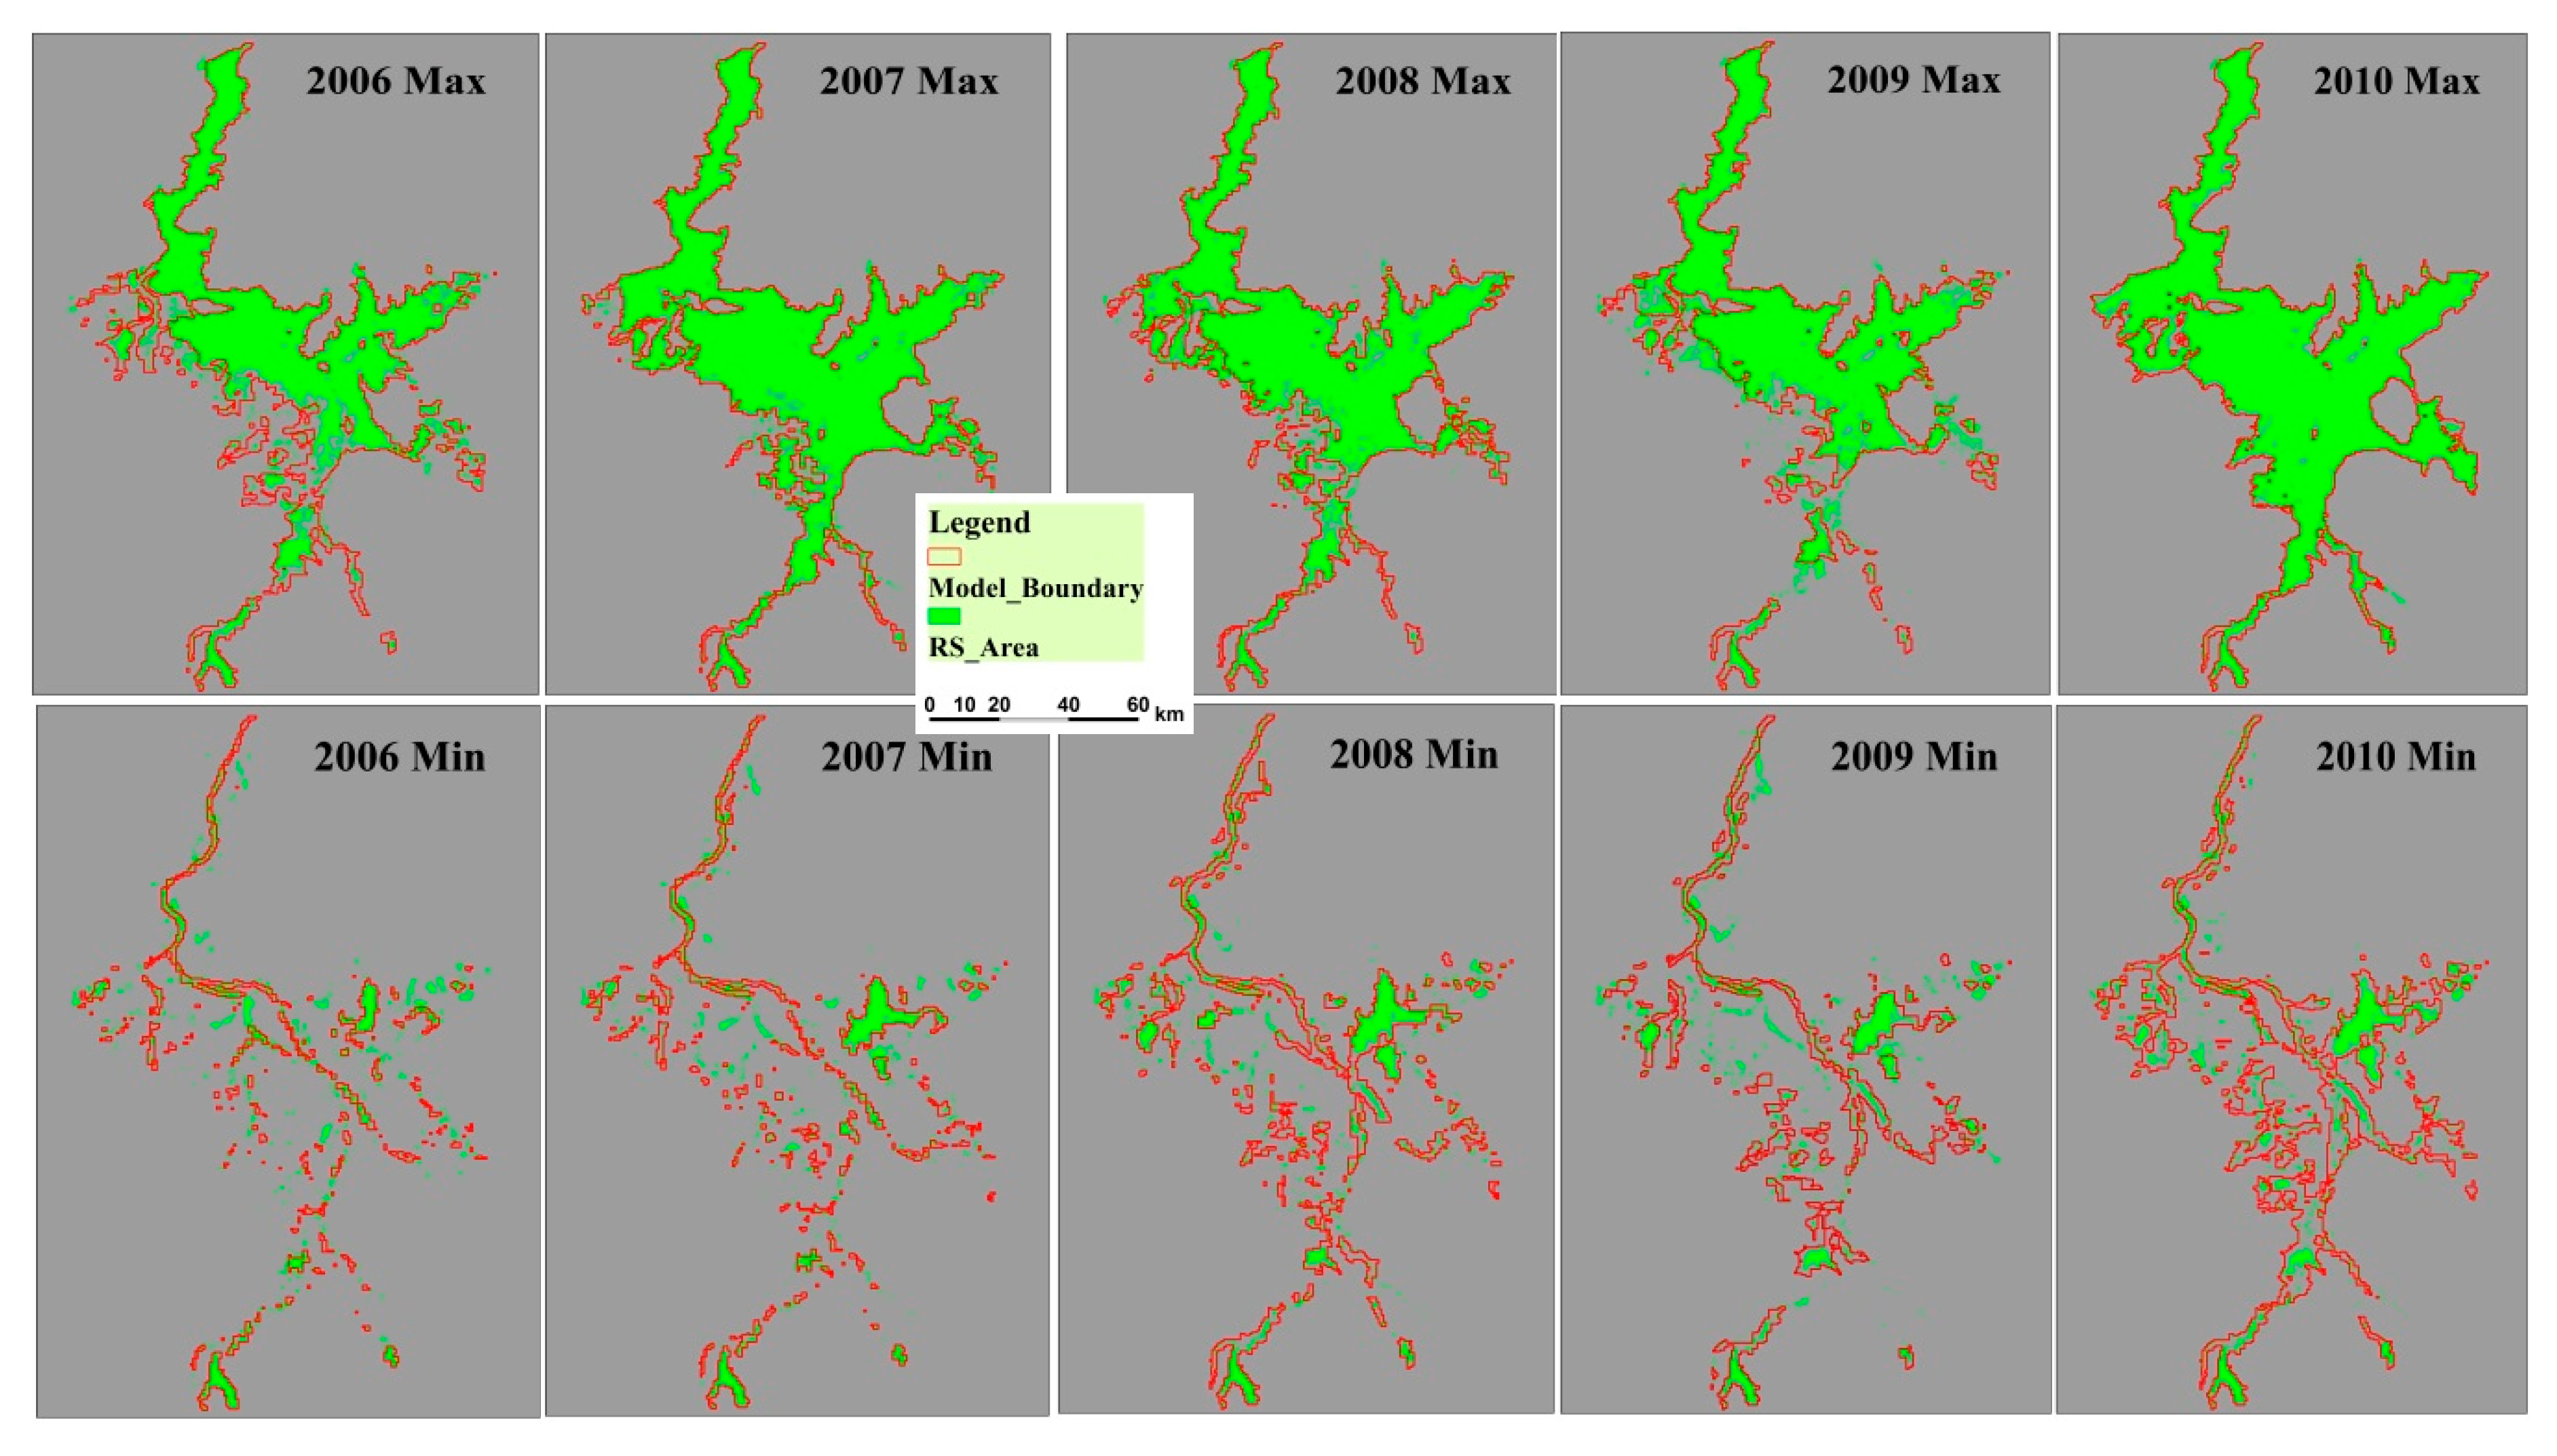
4.1.1. Inundation Modeling


| Statistical Index | Inundation Area | Water Level | Hukou Discharge | ||||
|---|---|---|---|---|---|---|---|
| Xingzi | Duchang | Tangyin | Longkou | ||||
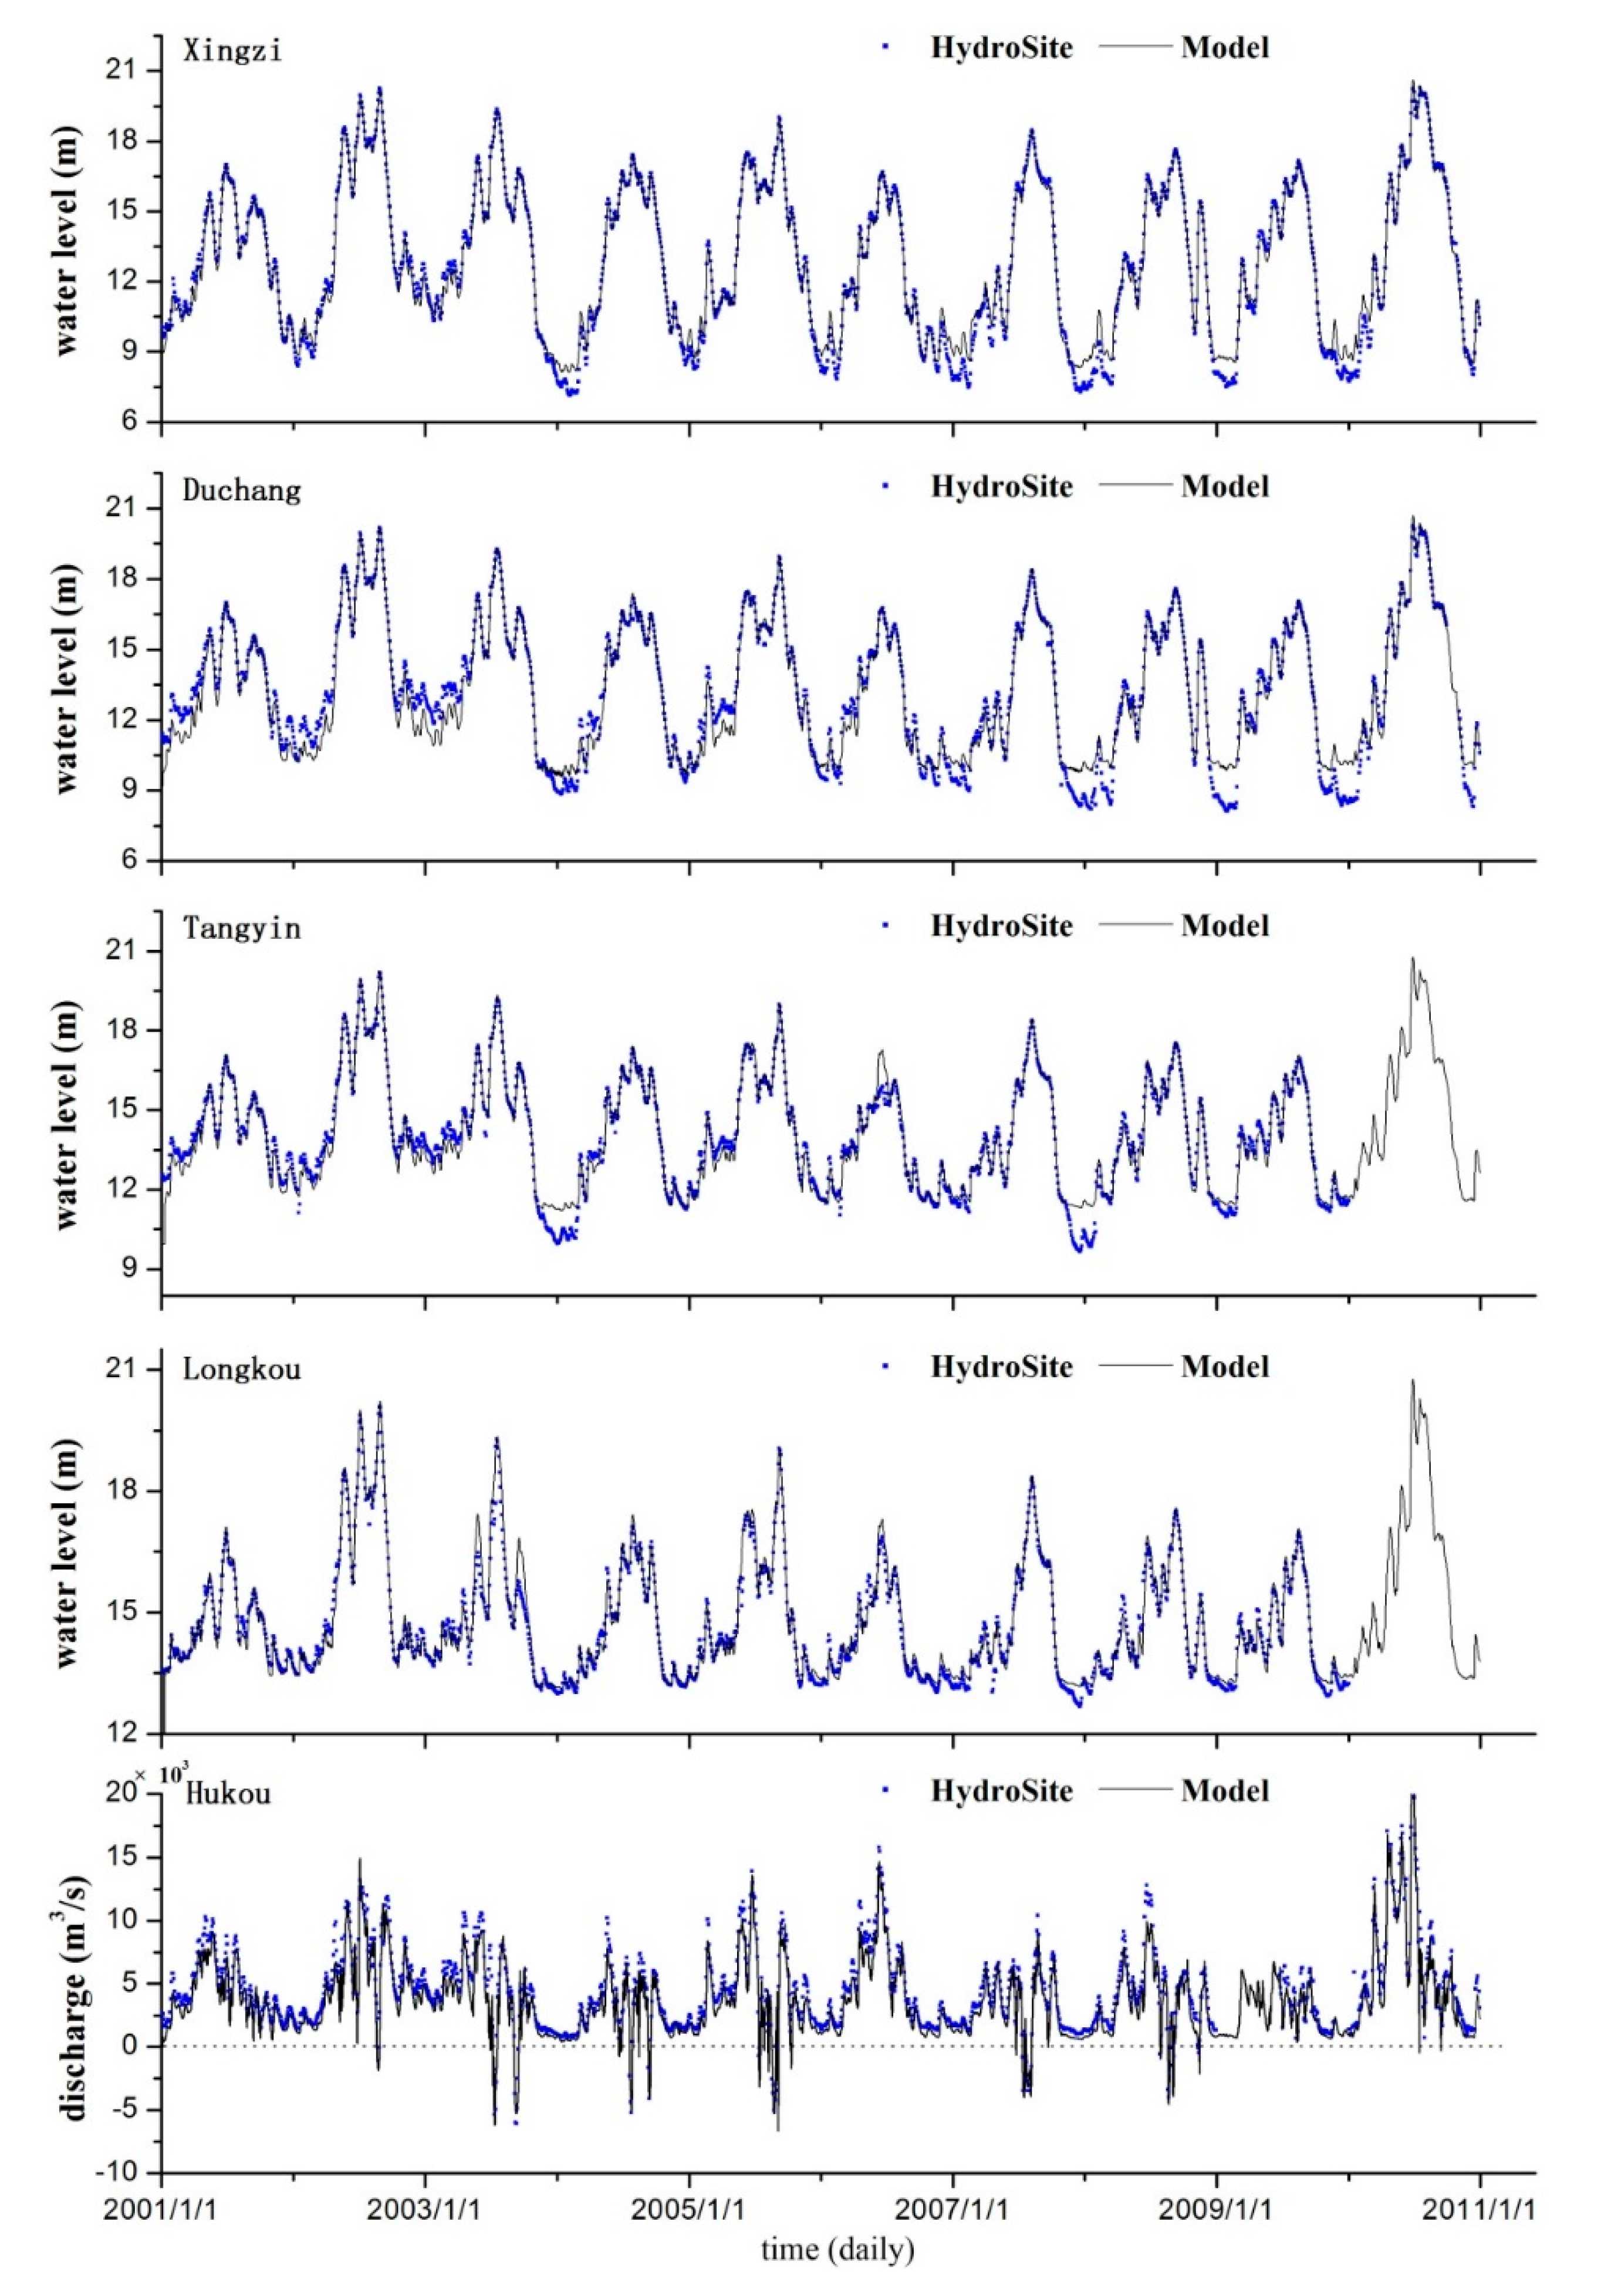
| Calibration period | RMSE | 206.2 | 0.32 | 0.59 | 0.42 | 0.25 | 530.6 |
| NSE | 0.87 | 0.99 | 0.95 | 0.96 | 0.97 | 0.83 | |
| R2 | 0.90 | 0.99 | 0.97 | 0.96 | 0.98 | 0.89 | |
| PBIAS | −0.04 | 0.002 | 0.02 | 0.01 | 0.002 | 0.15 | |
| RSR | 0.36 | 0.10 | 0.23 | 0.20 | 0.17 | 0.38 | |
| Validation period | RMSE | 183.6 | 0.53 | 0.67 | 0.42 | 0.22 | 398.9 |
| NSE | 0.91 | 0.98 | 0.95 | 0.95 | 0.97 | 0.90 | |
| R2 | 0.92 | 0.99 | 0.97 | 0.96 | 0.97 | 0.95 | |
| PBIAS | −0.04 | −0.02 | −0.02 | −0.01 | −0.004 | 0.13 | |
| RSR | 0.30 | 0.15 | 0.22 | 0.21 | 0.18 | 0.27 | |
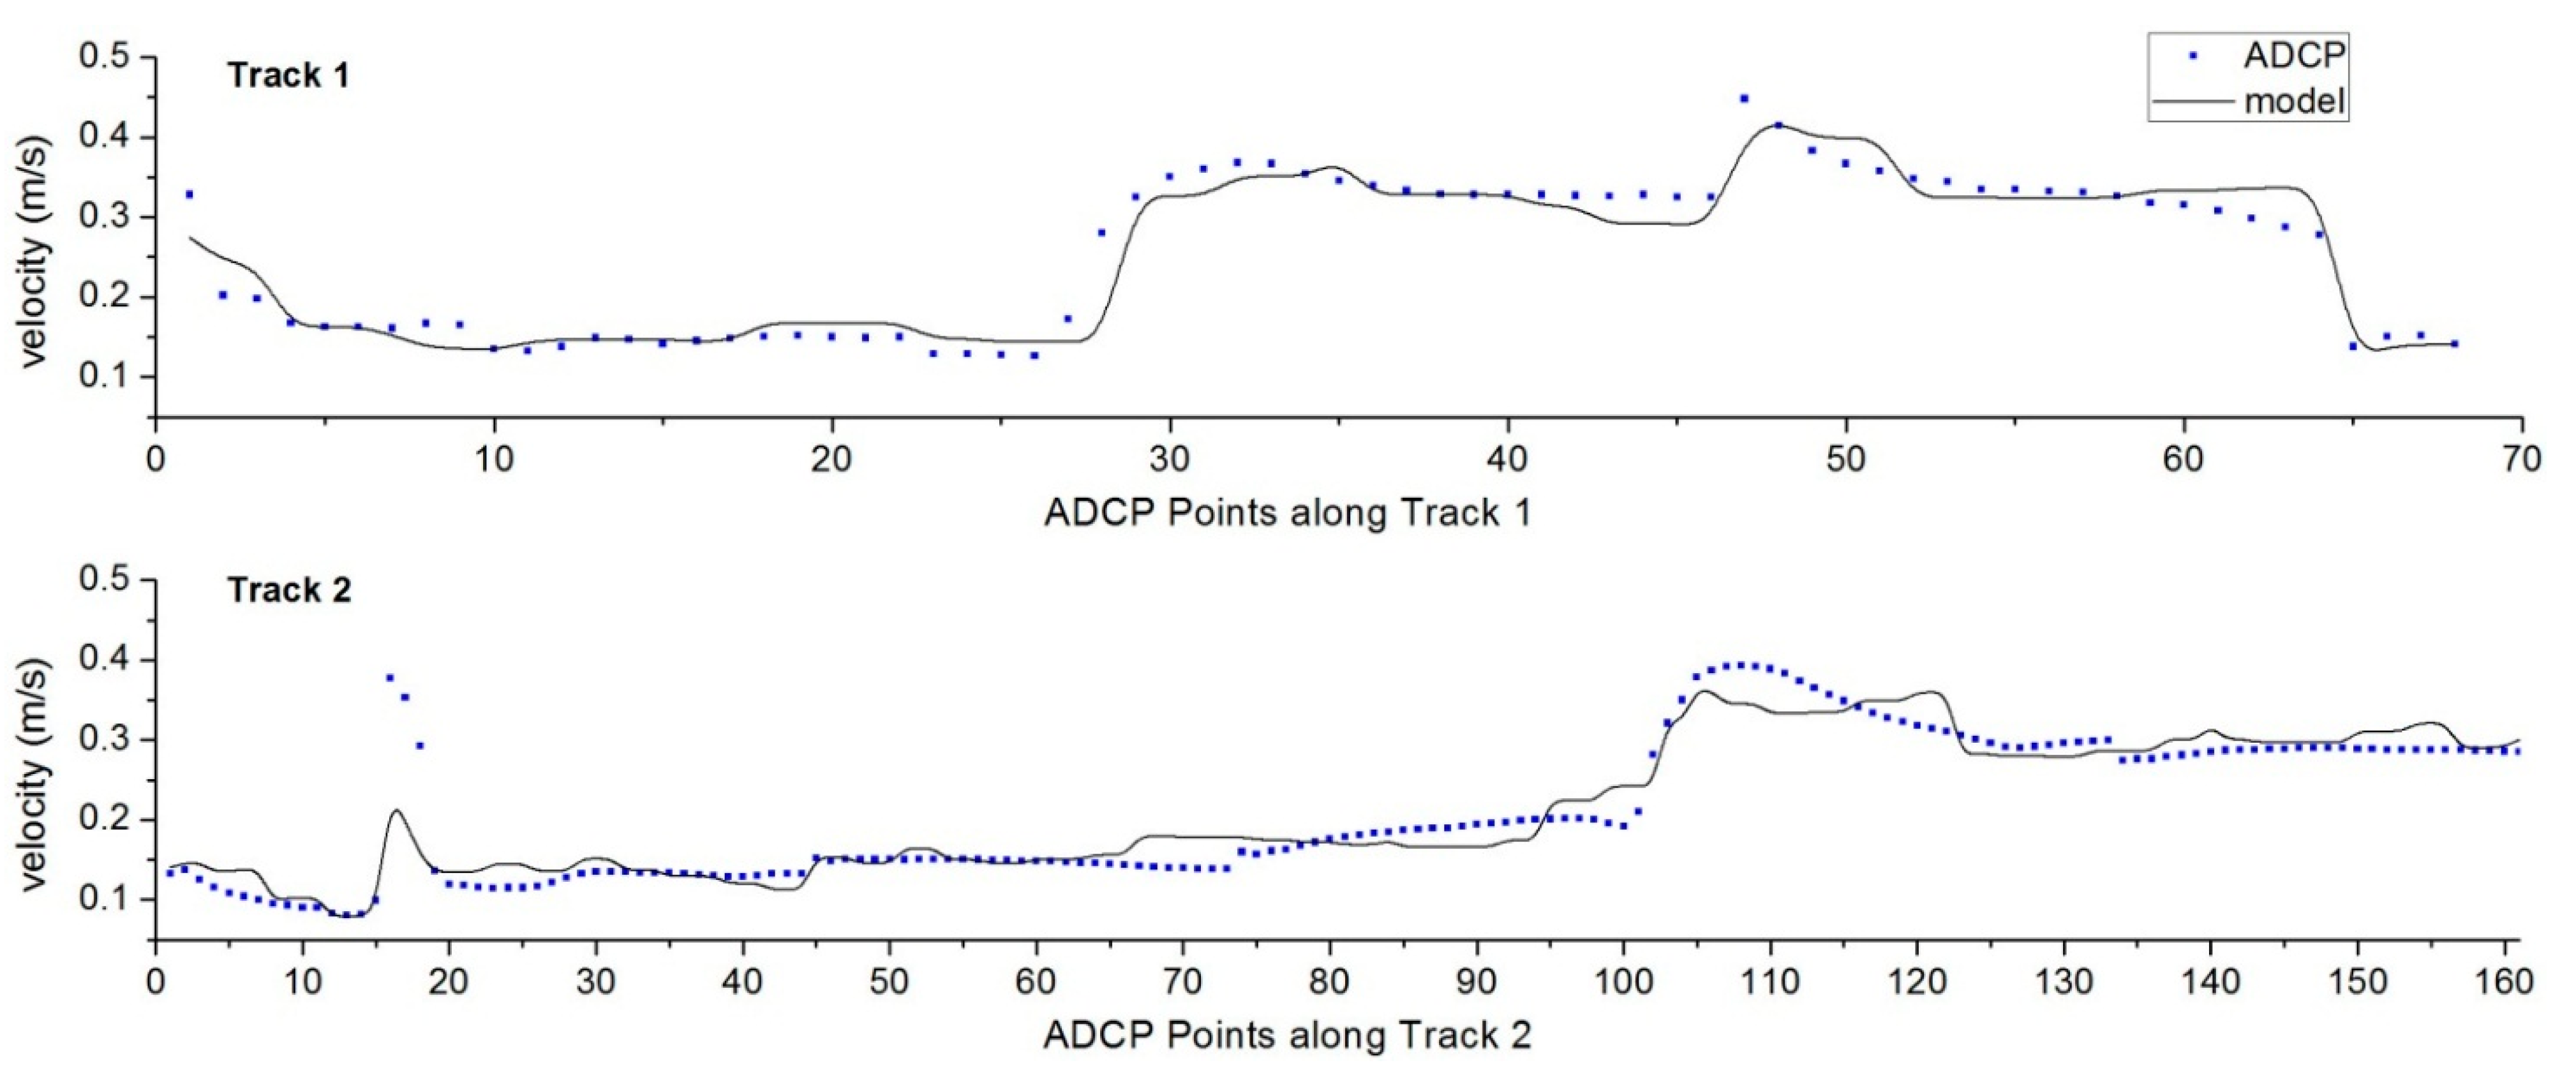
4.1.2. Hydrodynamic Modeling

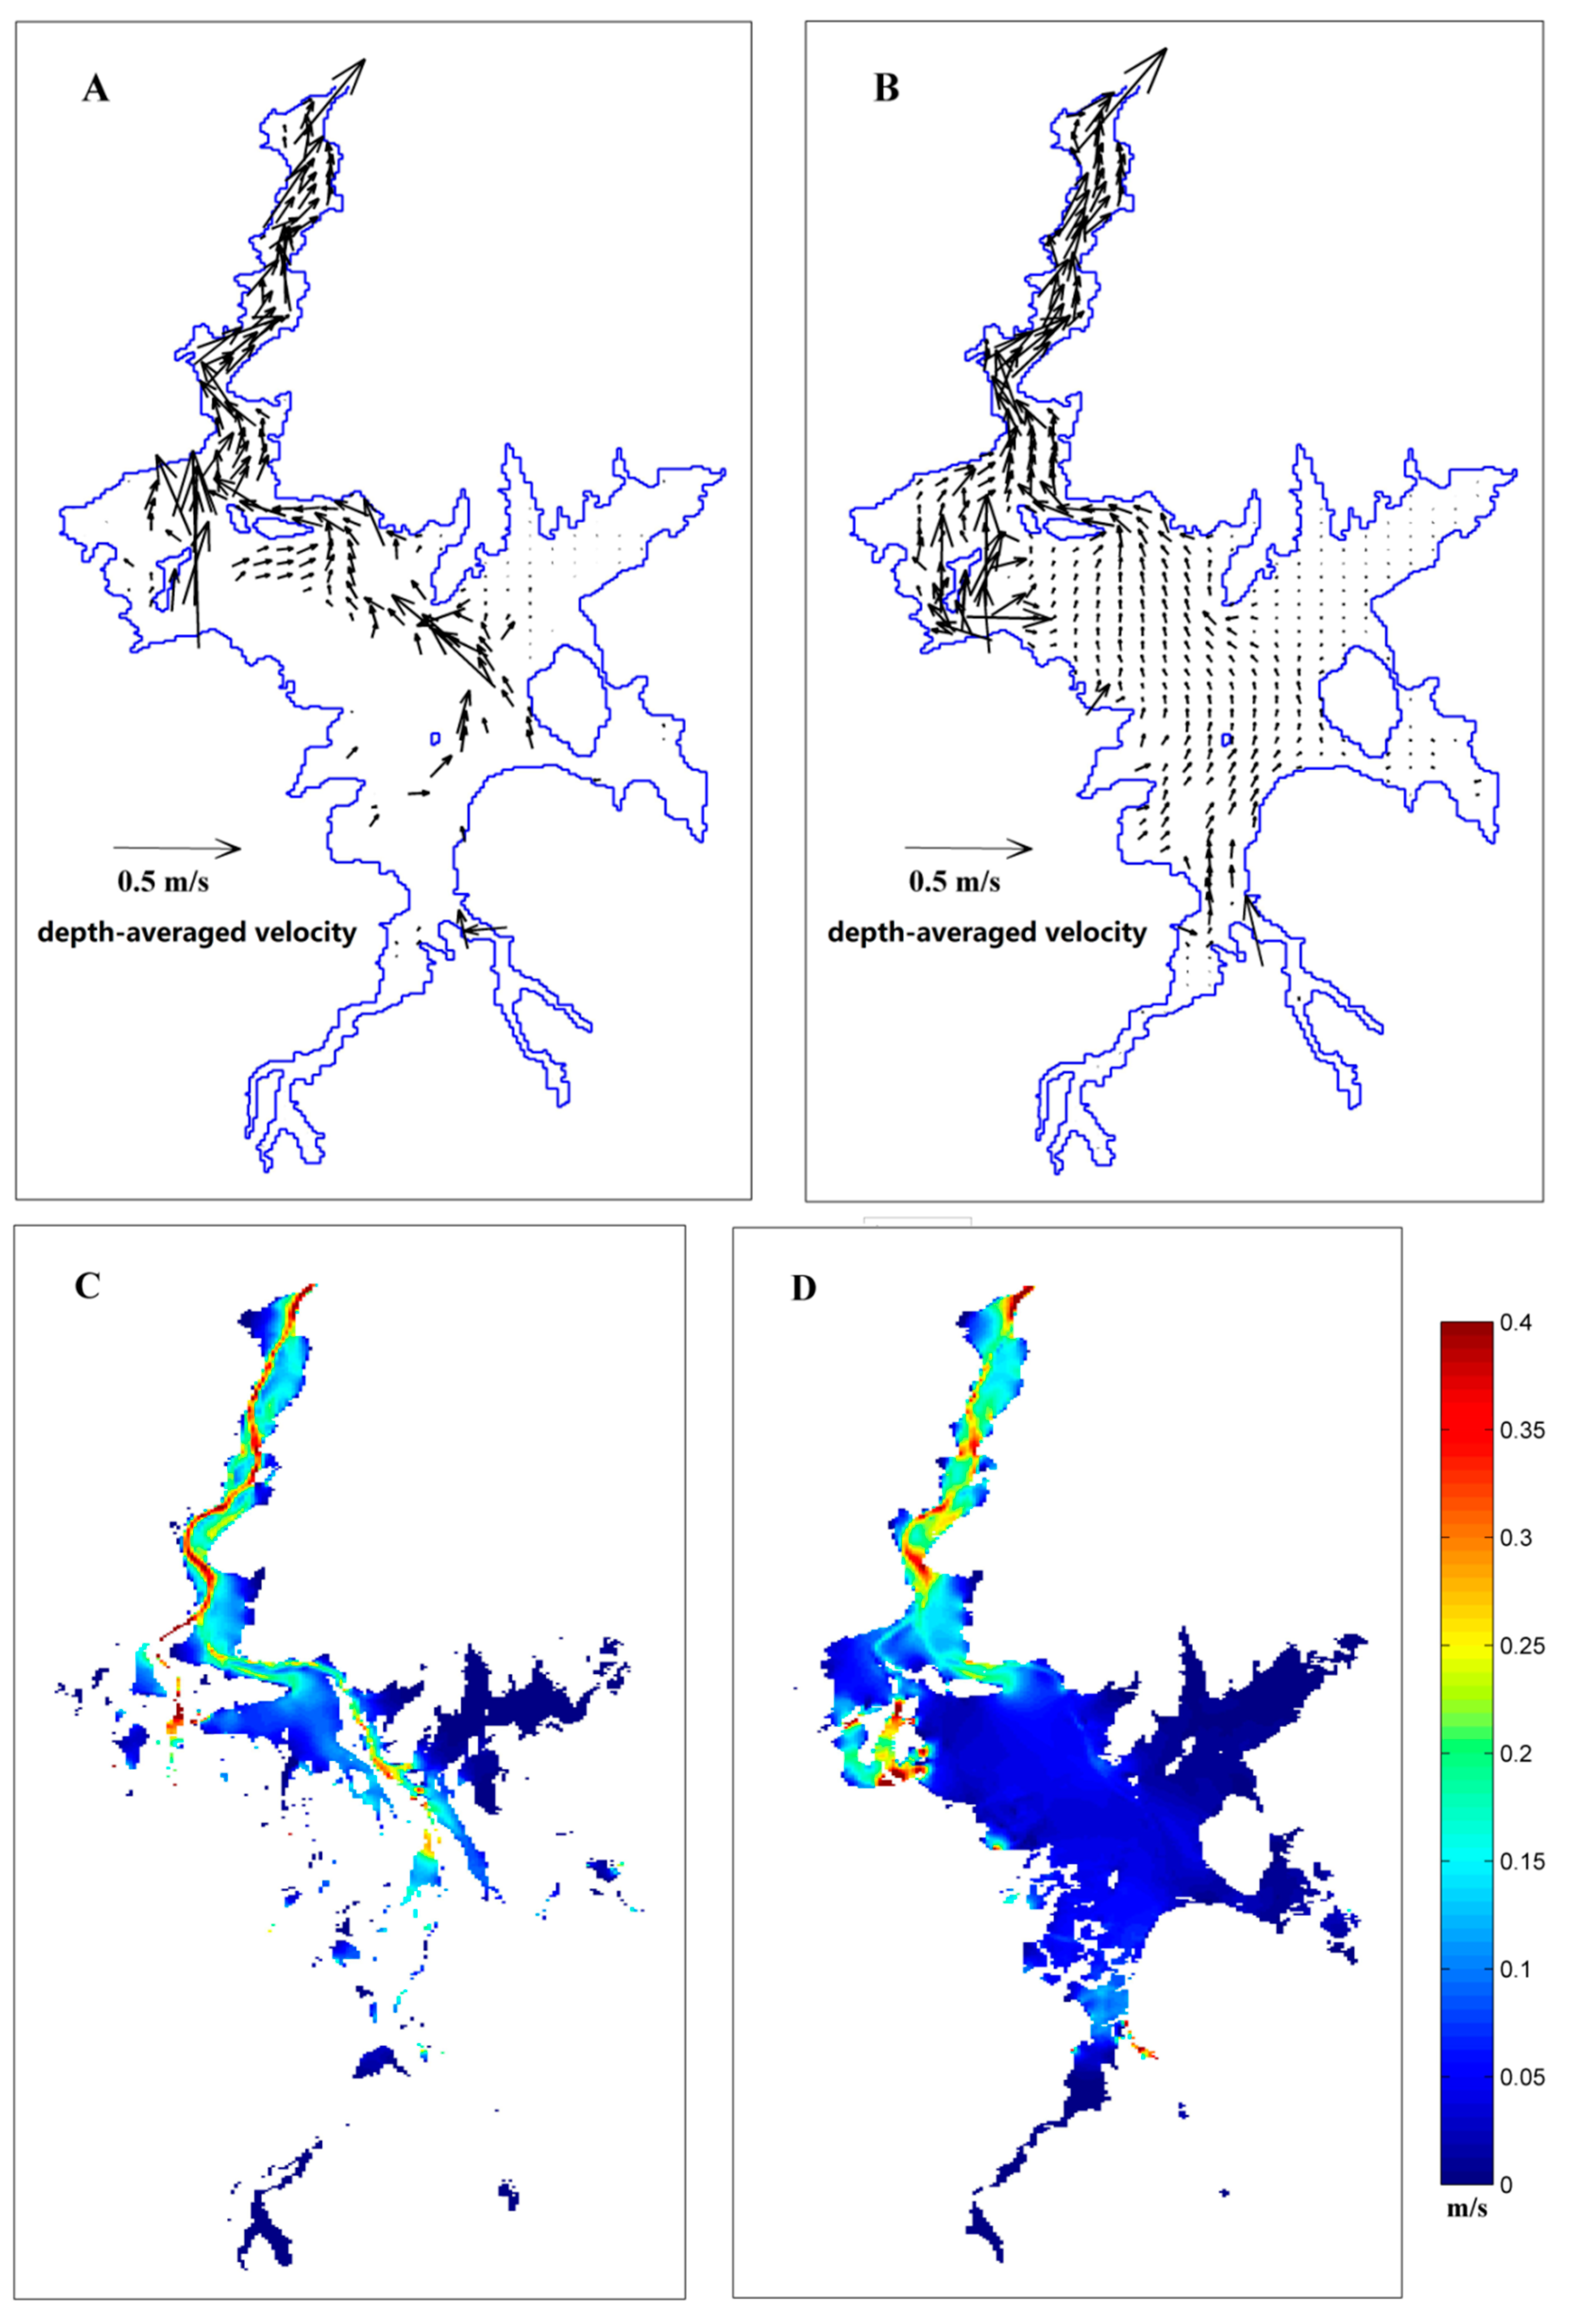
4.2. The Current Velocity Characteristics

5. Conclusions
Acknowledgments
Author Contributions
Conflicts of Interest
References
- Jones, R.; McMahon, T.; Bowler, J. Modelling historical lake levels and recent climate change at three closed lakes, Western Victoria, Australia (c. 1840–1990). J. Hydrol. 2001, 246, 159–180. [Google Scholar]
- Ye, X.; Zhang, Q.; Liu, J.; Li, X.; Xu, C. Distinguishing the relative impacts of climate change and human activities on variation of streamflow in the Poyang Lake catchment, China. J. Hydrol. 2013, 494, 83–95. [Google Scholar] [CrossRef]
- Ye, X.; Zhang, Q.; Bai, L.; Hu, Q. A modeling study of catchment discharge to Poyang Lake under future climate in China. Quatern. Int. 2011, 244, 221–229. [Google Scholar] [CrossRef]
- Chen, X.; Zhang, Y.; Zhang, L.; Chen, L.; Lu, J. Distribution characteristic of nitrogen and phosphorus in Poyang Lake during high water periods. J. Lake Sci. 2013, 25, 643–648. [Google Scholar]
- Feng, L.; Hu, C.; Chen, X.; Tian, L.; Chen, L. Human induced turbidity changes in Poyang Lake between 2000 and 2010: Observations from MODIS. J. Geophys. Res.: Oceans 2012, 117. [Google Scholar] [CrossRef]
- Yin, H.; Li, C. Human impact on floods and flood disasters on the Yangtze River. Geomorphology 2001, 41, 105–109. [Google Scholar] [CrossRef]
- León, L.F.; Imberger, J.; Smith, R.E.; Hecky, R.E.; Lam, D.C.; Schertzer, W.M. Modeling as a tool for nutrient management in lake erie: A hydrodynamics study. J. Great Lakes Res. 2005, 31, 309–318. [Google Scholar] [CrossRef]
- Lai, X.; Huang, Q.; Zhang, Y.; Jiang, J. Impact of lake inflow and the yangtze river flow alterations on water levels in Poyang Lake, China. Lake Reserv. Manage. 2014, 30, 321–330. [Google Scholar] [CrossRef]
- Feng, L.; Hu, C.; Chen, X.; Cai, X.; Tian, L.; Gan, W. Assessment of inundation changes of Poyang Lake using modis observations between 2000 and 2010. Remote Sens. Environ. 2012, 121, 80–92. [Google Scholar] [CrossRef]
- Cheng, S.; Ru, B. The characteristics of the lake current of Poyang Lake. Jiangxi Hydraul. Sci. Technol. 2003, 29, 105–108. [Google Scholar]
- Zhang, Z.; Beletsky, D.; Schwab, D.J.; Stein, M.L. Assimilation of current measurements into a circulation model of lake michigan. Water Resour. Res. 2007, 43. [Google Scholar] [CrossRef]
- Stroud, J.R.; Lesht, B.M.; Schwab, D.J.; Beletsky, D.; Stein, M.L. Assimilation of satellite images into a sediment transport model of Lake Michigan. Water Resour. Res. 2009, 45. [Google Scholar] [CrossRef]
- Hurdowar-Castro, D.; Tsanis, I.; Simanovskis, I. Application of a three-dimensional wind driven circulation model to assess the locations of new drinking water intakes in Lake Ontario. J. Great Lakes Res. 2007, 33, 232–252. [Google Scholar] [CrossRef]
- Preston, A.; Hannoun, I.A.; List, E.J.; Rackley, I.; Tietjen, T. Three-dimensional management model for Lake Mead, Nevada, Part 1: Model calibration and validation. Lake Reserv. Manage. 2014, 30, 285–302. [Google Scholar] [CrossRef]
- Preston, A.; Hannoun, I.A.; List, E.J.; Rackley, I.; Tietjen, T. Three-dimensional management model for Lake Mead, Nevada, Part 2: Findings and applications. Lake Reserv. Manage. 2014, 30, 303–319. [Google Scholar] [CrossRef]
- Lai, X.; Jiang, J.; Liang, Q.; Huang, Q. Large-scale hydrodynamic modeling of the middle Yangtze River basin with complex river–lake interactions. J. Hydrol. 2013, 492, 228–243. [Google Scholar] [CrossRef]
- Li, Y.; Zhang, Q.; Yao, J.; Werner, A.; Li, X. Hydrodynamic and hydrological modeling of the Poyang Lake catchment system in China. J. Hydrol. Eng. 2013, 19, 607–616. [Google Scholar] [CrossRef]
- Medeiros, S.C.; Hagen, S.C. Review of wetting and drying algorithms for numerical tidal flow models. Int. J. Numer. Methods Fluids 2013, 71, 473–487. [Google Scholar] [CrossRef]
- Modis web. Available online: http://modis.gsfc.nasa.gov/ (accessed on 20 April 2015).
- Hu, C. A novel ocean color index to detect floating algae in the global oceans. Remote Sens. Environ. 2009, 113, 2118–2129. [Google Scholar] [CrossRef]
- Hu, C.; Lee, Z.; Ma, R.; Yu, K.; Li, D.; Shang, S. Moderate resolution imaging spectroradiometer (MODIS) observations of cyanobacteria blooms in Taihu Lake, China. J. Geophys. Res.: Oceans 2010, 115. [Google Scholar] [CrossRef]
- Ocean color sedas. Available online: http://seadas.Gsfc.Nasa.Gov/installers/ (accessed on 20 April 2015).
- Vermote, E.F.; Tanré, D.; Deuze, J.-L.; Herman, M.; Morcette, J.-J. Second simulation of the satellite signal in the solar spectrum, 6s: An overview. IEEE Trans. Geosci. Remote Sens. 1997, 35, 675–686. [Google Scholar] [CrossRef]
- Razmi, A.M.; Barry, D.A.; Bakhtyar, R.; le Dantec, N.; Dastgheib, A.; Lemmin, U.; Wüest, A. Current variability in a wide and open lacustrine embayment in lake geneva (Switzerland). J. Great Lakes Res. 2013, 39, 455–465. [Google Scholar] [CrossRef]
- Kuang, C.; He, L.; Xing, F.; Deng, L.; Gu, J. Numerical study on the evolution process of polluted water cluster in gonghu, taihu lake. In Proceedings of the 3rd International Conference on Bioinformatics and Biomedical Engineering,2009 (ICBBE 2009), Beijing, China, 11–13 June 2009; pp. 1–4.
- El-Adawy, A.; Negm, A.; Elzeir, M.; Saavedra, O.; El-Shinnawy, I.; Nadaoka, K. Modeling the hydrodynamics and salinity of El-Burullus Lake (Nile Delta, noRthern Egypt). J. Clean Energy Technol. 2013, 1. [Google Scholar] [CrossRef]
- Razmi, A.M.; Barry, D.A.; Lemmin, U.; Bonvin, F.; Kohn, T.; Bakhtyar, R. Direct effects of dominant winds on residence and travel times in the wide and open lacustrine embayment: Vidy Bay (Lake Geneva, Switzerland). Aquat. Sci. 2014, 76, 59–71. [Google Scholar] [CrossRef]
- Kaçıkoç, M.; Beyhan, M. Hydrodynamic and water quality modeling of Lake Eğirdir. Clean Soil Air Water 2014, 42, 1573–1582. [Google Scholar] [CrossRef]
- Xing, F.; Kettner, A.; Syvitski, J.; Ye, Q.; Bevington, A.; Twilley, R.; Atkinson, J. Impact of Vegetation on the Hydrodynamics and Morphological Changes of the Wax Lake Delta during Hurricanes. In Proceedings of American Geophysical Union Fall Meeting, San Francisco, CA, USA, 9–13 December 2013.
- Lesser, G.; Roelvink, J.; van Kester, J.; Stelling, G. Development and validation of a three-dimensional morphological model. Coast. Eng. 2004, 51, 883–915. [Google Scholar] [CrossRef]
- Jiangxi hydrology. Available online: http://www.Jxsw.Cn/item/6811.Aspx (accessed on 20 April 2015). (in Chinese).
- Changjiang water resources commission of china. Available online: http://www.cjw.gov.cn/ (accessed on 20 April 2015). (in Chinese)
- Hydraulics, D. Delft3D-Flow, Simulation of Multi-Dimensional Hydrodynamic Flows and Transport Phenomena, Including Sediments; User Manual; Deltares: Rotterdamseweg, The Netherlands, 2006. [Google Scholar]
- Congalton, R.G. A review of assessing the accuracy of classifications of remotely sensed data. Remote Sens. Environ. 1991, 37, 35–46. [Google Scholar] [CrossRef]
- Zhang, L.; Chen, X.; Zhang, Y.; Chen, L.; Zhang, P. Spatial distribution of water quality and its impacting factor in the wet season of Poyang Lake using the hydro-geomorphological partitions. China Environ. Sci. 2014, 34, 2637–2645. [Google Scholar]
- Hu, C. The Water Environmental Charateristics and Its Evolutionary Trends of Poyang Lake. Ph.D. Thesis, Nanchang University, Nanchang, China, 2010. [Google Scholar]
- Li, Y.; He, R. Spatial and temporal variability of sst and ocean color in the gulf of maine based on cloud-free SST and chlorophyll reconstructions in 2003–2012. Remote Sens. Environ. 2014, 144, 98–108. [Google Scholar] [CrossRef]
© 2015 by the authors; licensee MDPI, Basel, Switzerland. This article is an open access article distributed under the terms and conditions of the Creative Commons Attribution license (http://creativecommons.org/licenses/by/4.0/).
Share and Cite
Zhang, P.; Lu, J.; Feng, L.; Chen, X.; Zhang, L.; Xiao, X.; Liu, H. Hydrodynamic and Inundation Modeling of China’s Largest Freshwater Lake Aided by Remote Sensing Data. Remote Sens. 2015, 7, 4858-4879. https://doi.org/10.3390/rs70404858
Zhang P, Lu J, Feng L, Chen X, Zhang L, Xiao X, Liu H. Hydrodynamic and Inundation Modeling of China’s Largest Freshwater Lake Aided by Remote Sensing Data. Remote Sensing. 2015; 7(4):4858-4879. https://doi.org/10.3390/rs70404858
Chicago/Turabian StyleZhang, Peng, Jianzhong Lu, Lian Feng, Xiaoling Chen, Li Zhang, Xiongwu Xiao, and Honggao Liu. 2015. "Hydrodynamic and Inundation Modeling of China’s Largest Freshwater Lake Aided by Remote Sensing Data" Remote Sensing 7, no. 4: 4858-4879. https://doi.org/10.3390/rs70404858