5.1. Comparison of Mangrove Extent and Change with Other Research
There has been a wide range in estimates of mangrove extent in the Zambezi River Delta (
Table 7, [
2,
9,
22]), with greater than three-fold difference between highest and lowest estimates [
1,
2,
6,
8,
9,
14].
The large discrepancy among estimates of mangrove area can be attributed to differences in data and analytical methods, and inadequate or lack of field validation. A comparison among recent assessments illustrates the importance of consistent analyses and the challenges of comparing area estimates among different methods despite the use of a common sensor (
Table 7). Giri
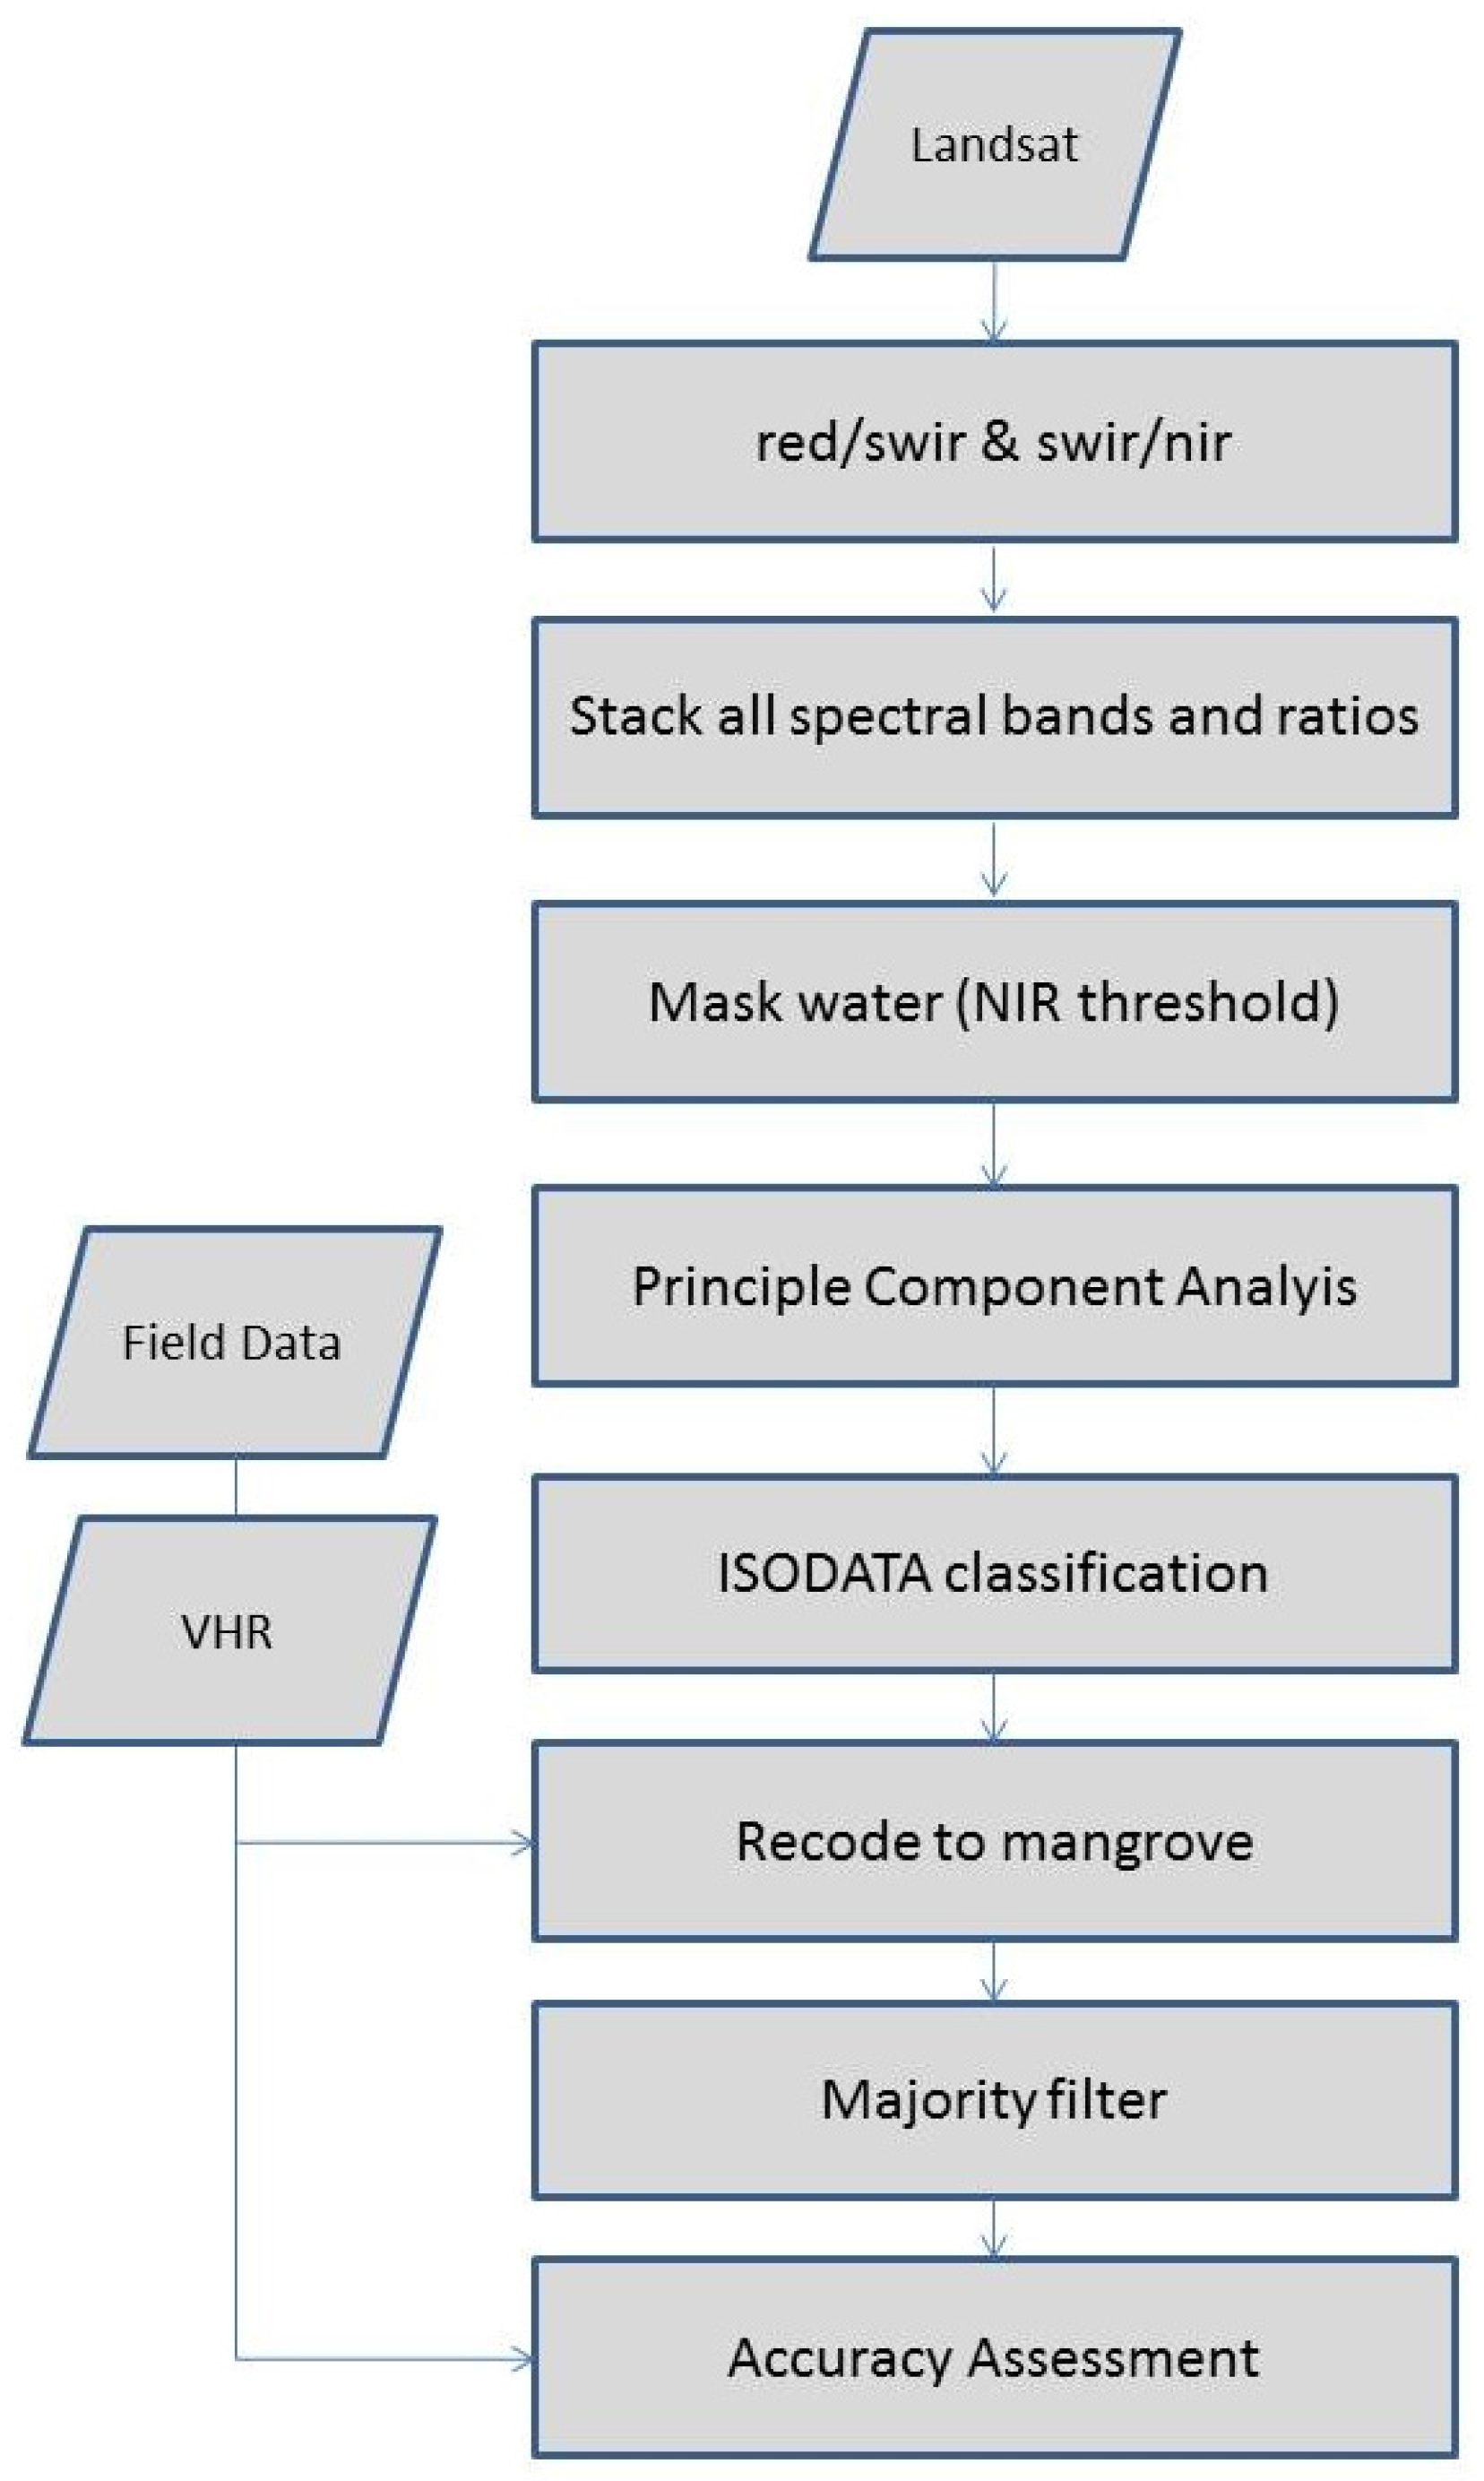
et al. [
2] used similar methods of clustering and recoding, with the principal difference being our use of band ratios and PCA. However, the authors were unable to produce statistically robust validation for their large global dataset so the results are difficult to precisely compare. The differences in area reported by [
22] are likely attributable to the scene selection, classification approach and data filtering. In contrast the data from [
9] appears to be a combination of classification and hand-editing yielding coarse generalized vectors, which have much less complexity at mangrove edges, include water in the margins, or lump patches; this approach may result in an over estimation of mangrove cover. This study likely underestimates mangrove cover due to lower producer accuracy, meaning larger errors of omission, so that in this case mangrove area may actually be underestimated by this analysis, and the actual area is more likely to be in between this study and the RCMD published values. Further highlighting difficulties in large scale assessments for specific locales, Coleman
et al. [
23] reported that the land conversion of wetlands in the Zambezi Delta average 2400 ha yr
−1. While that study was not specific to mangroves, it identified little anthropogenic change in the lower delta, where most mangroves are located. Consversion of wetlands to agricultural use is primarily in the upper delta area, and likely targets non-mangrove ecosystems.
Table 7.
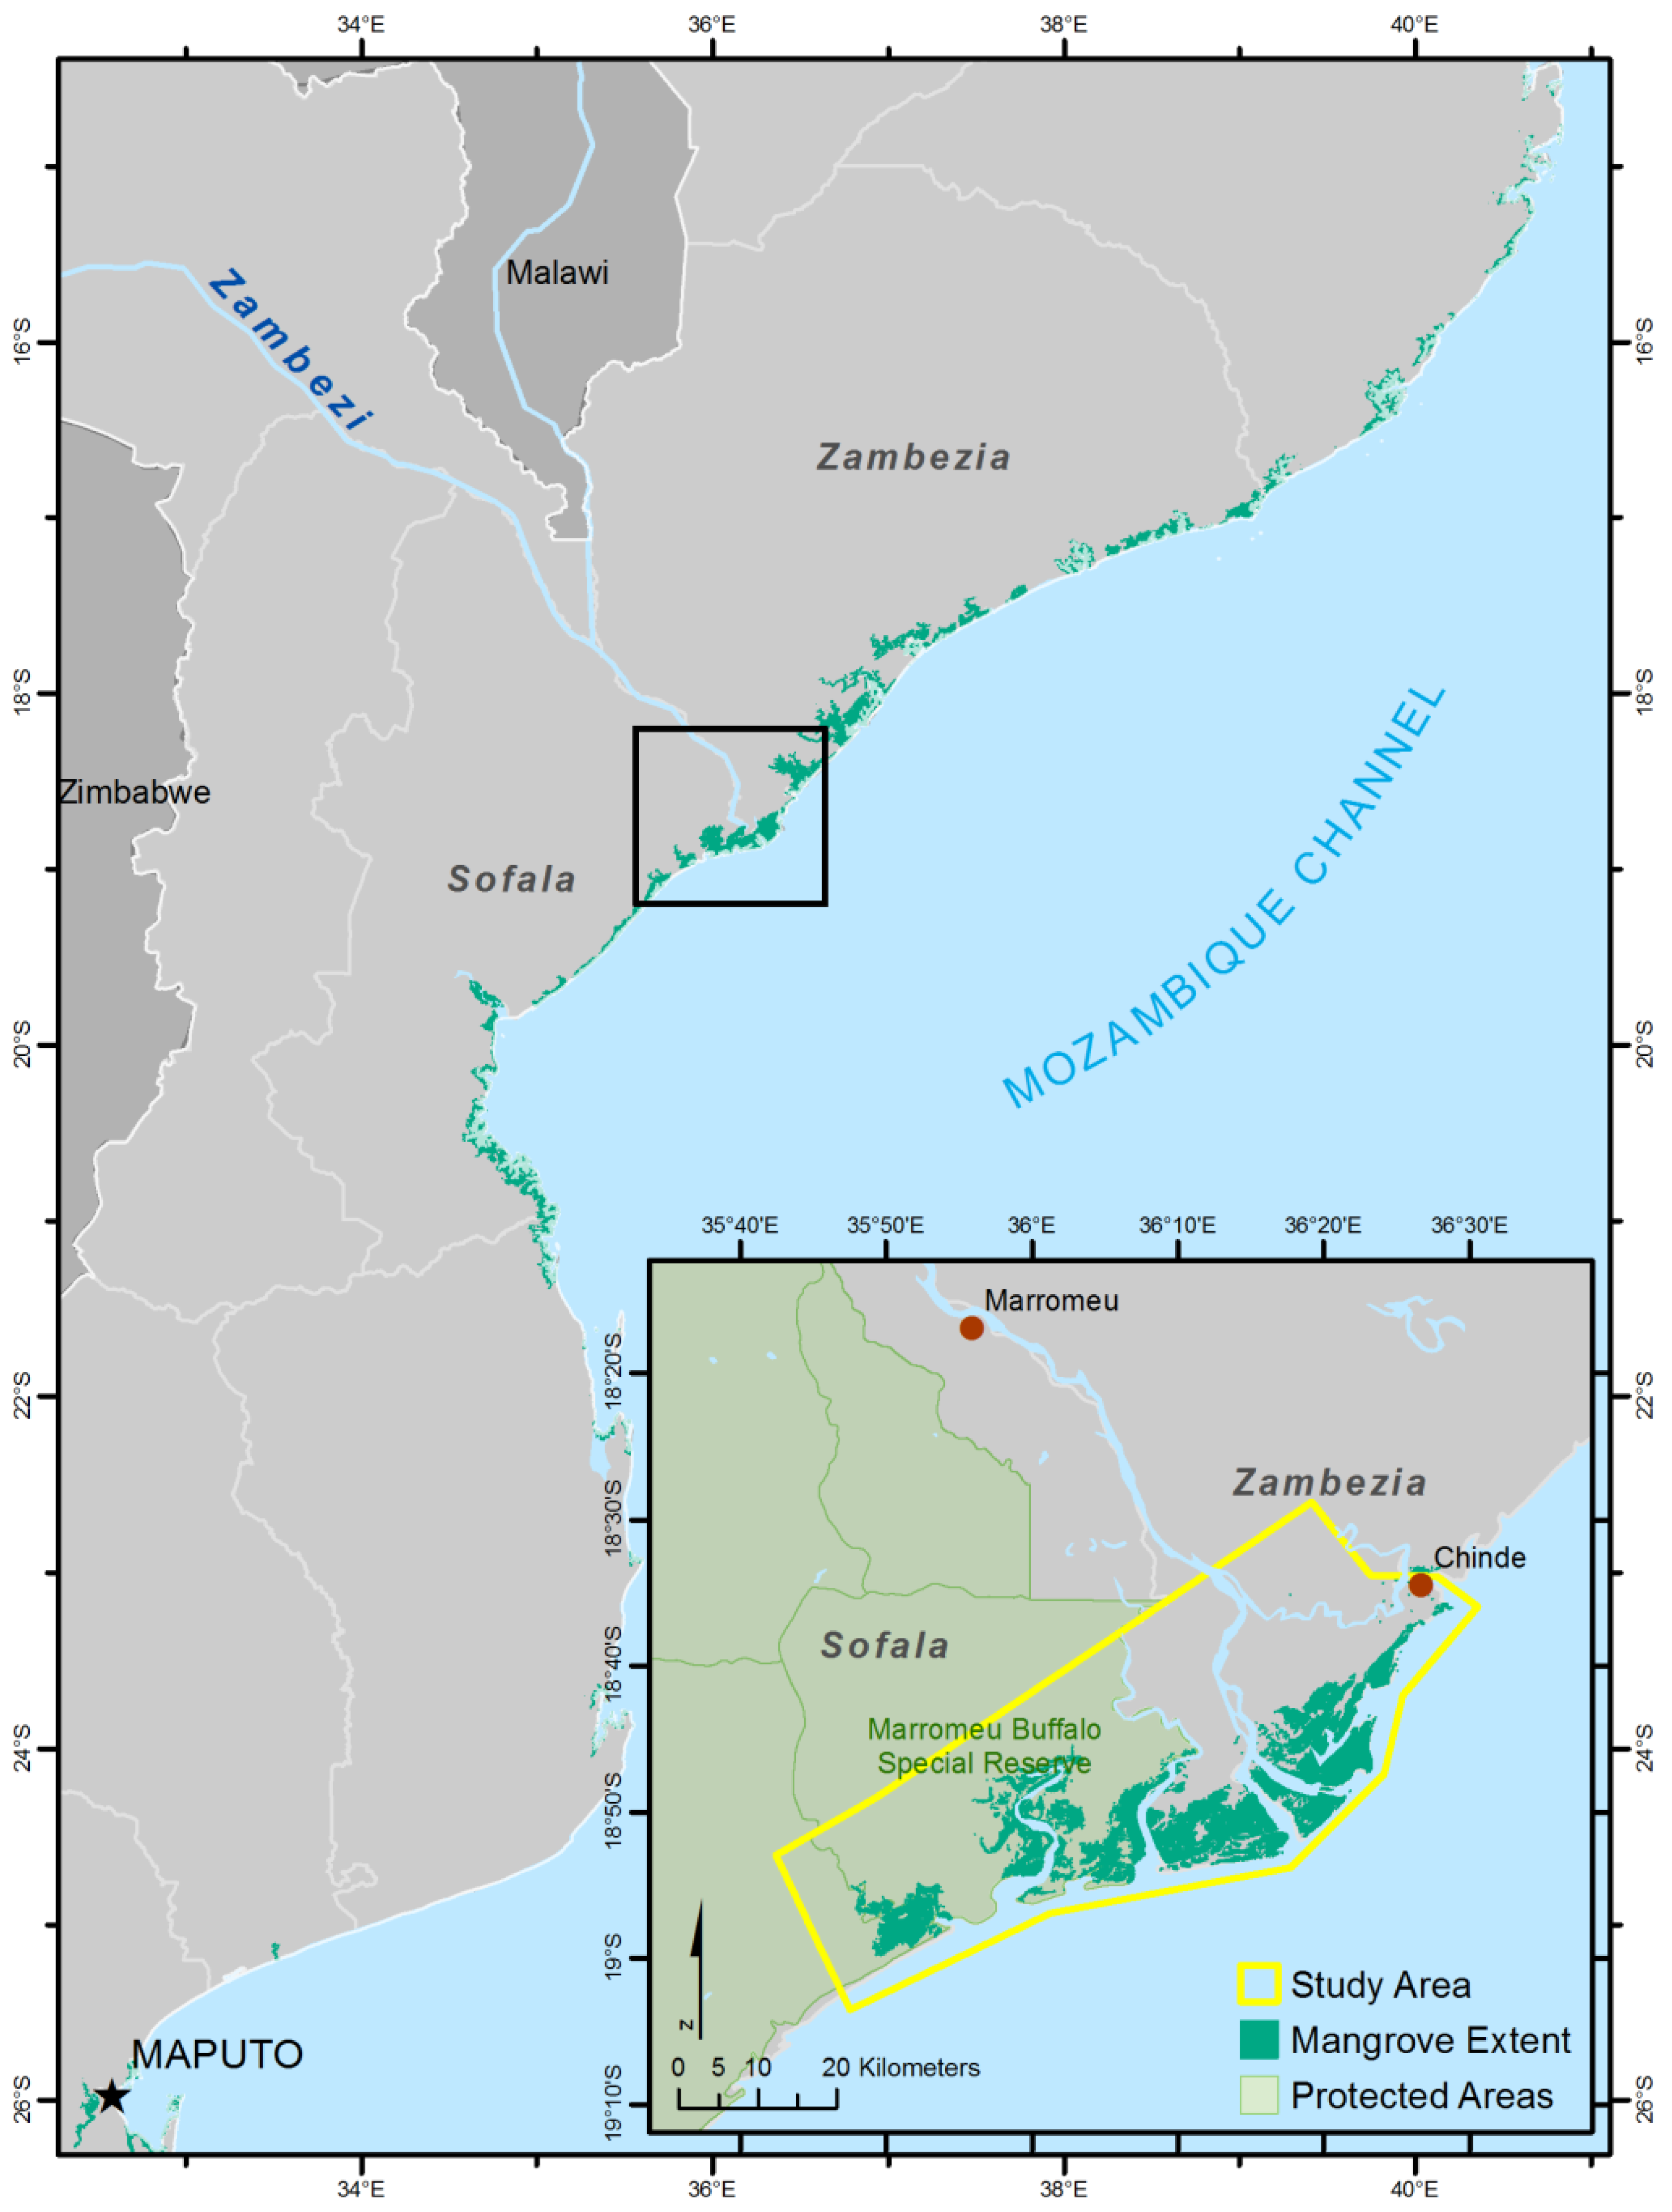
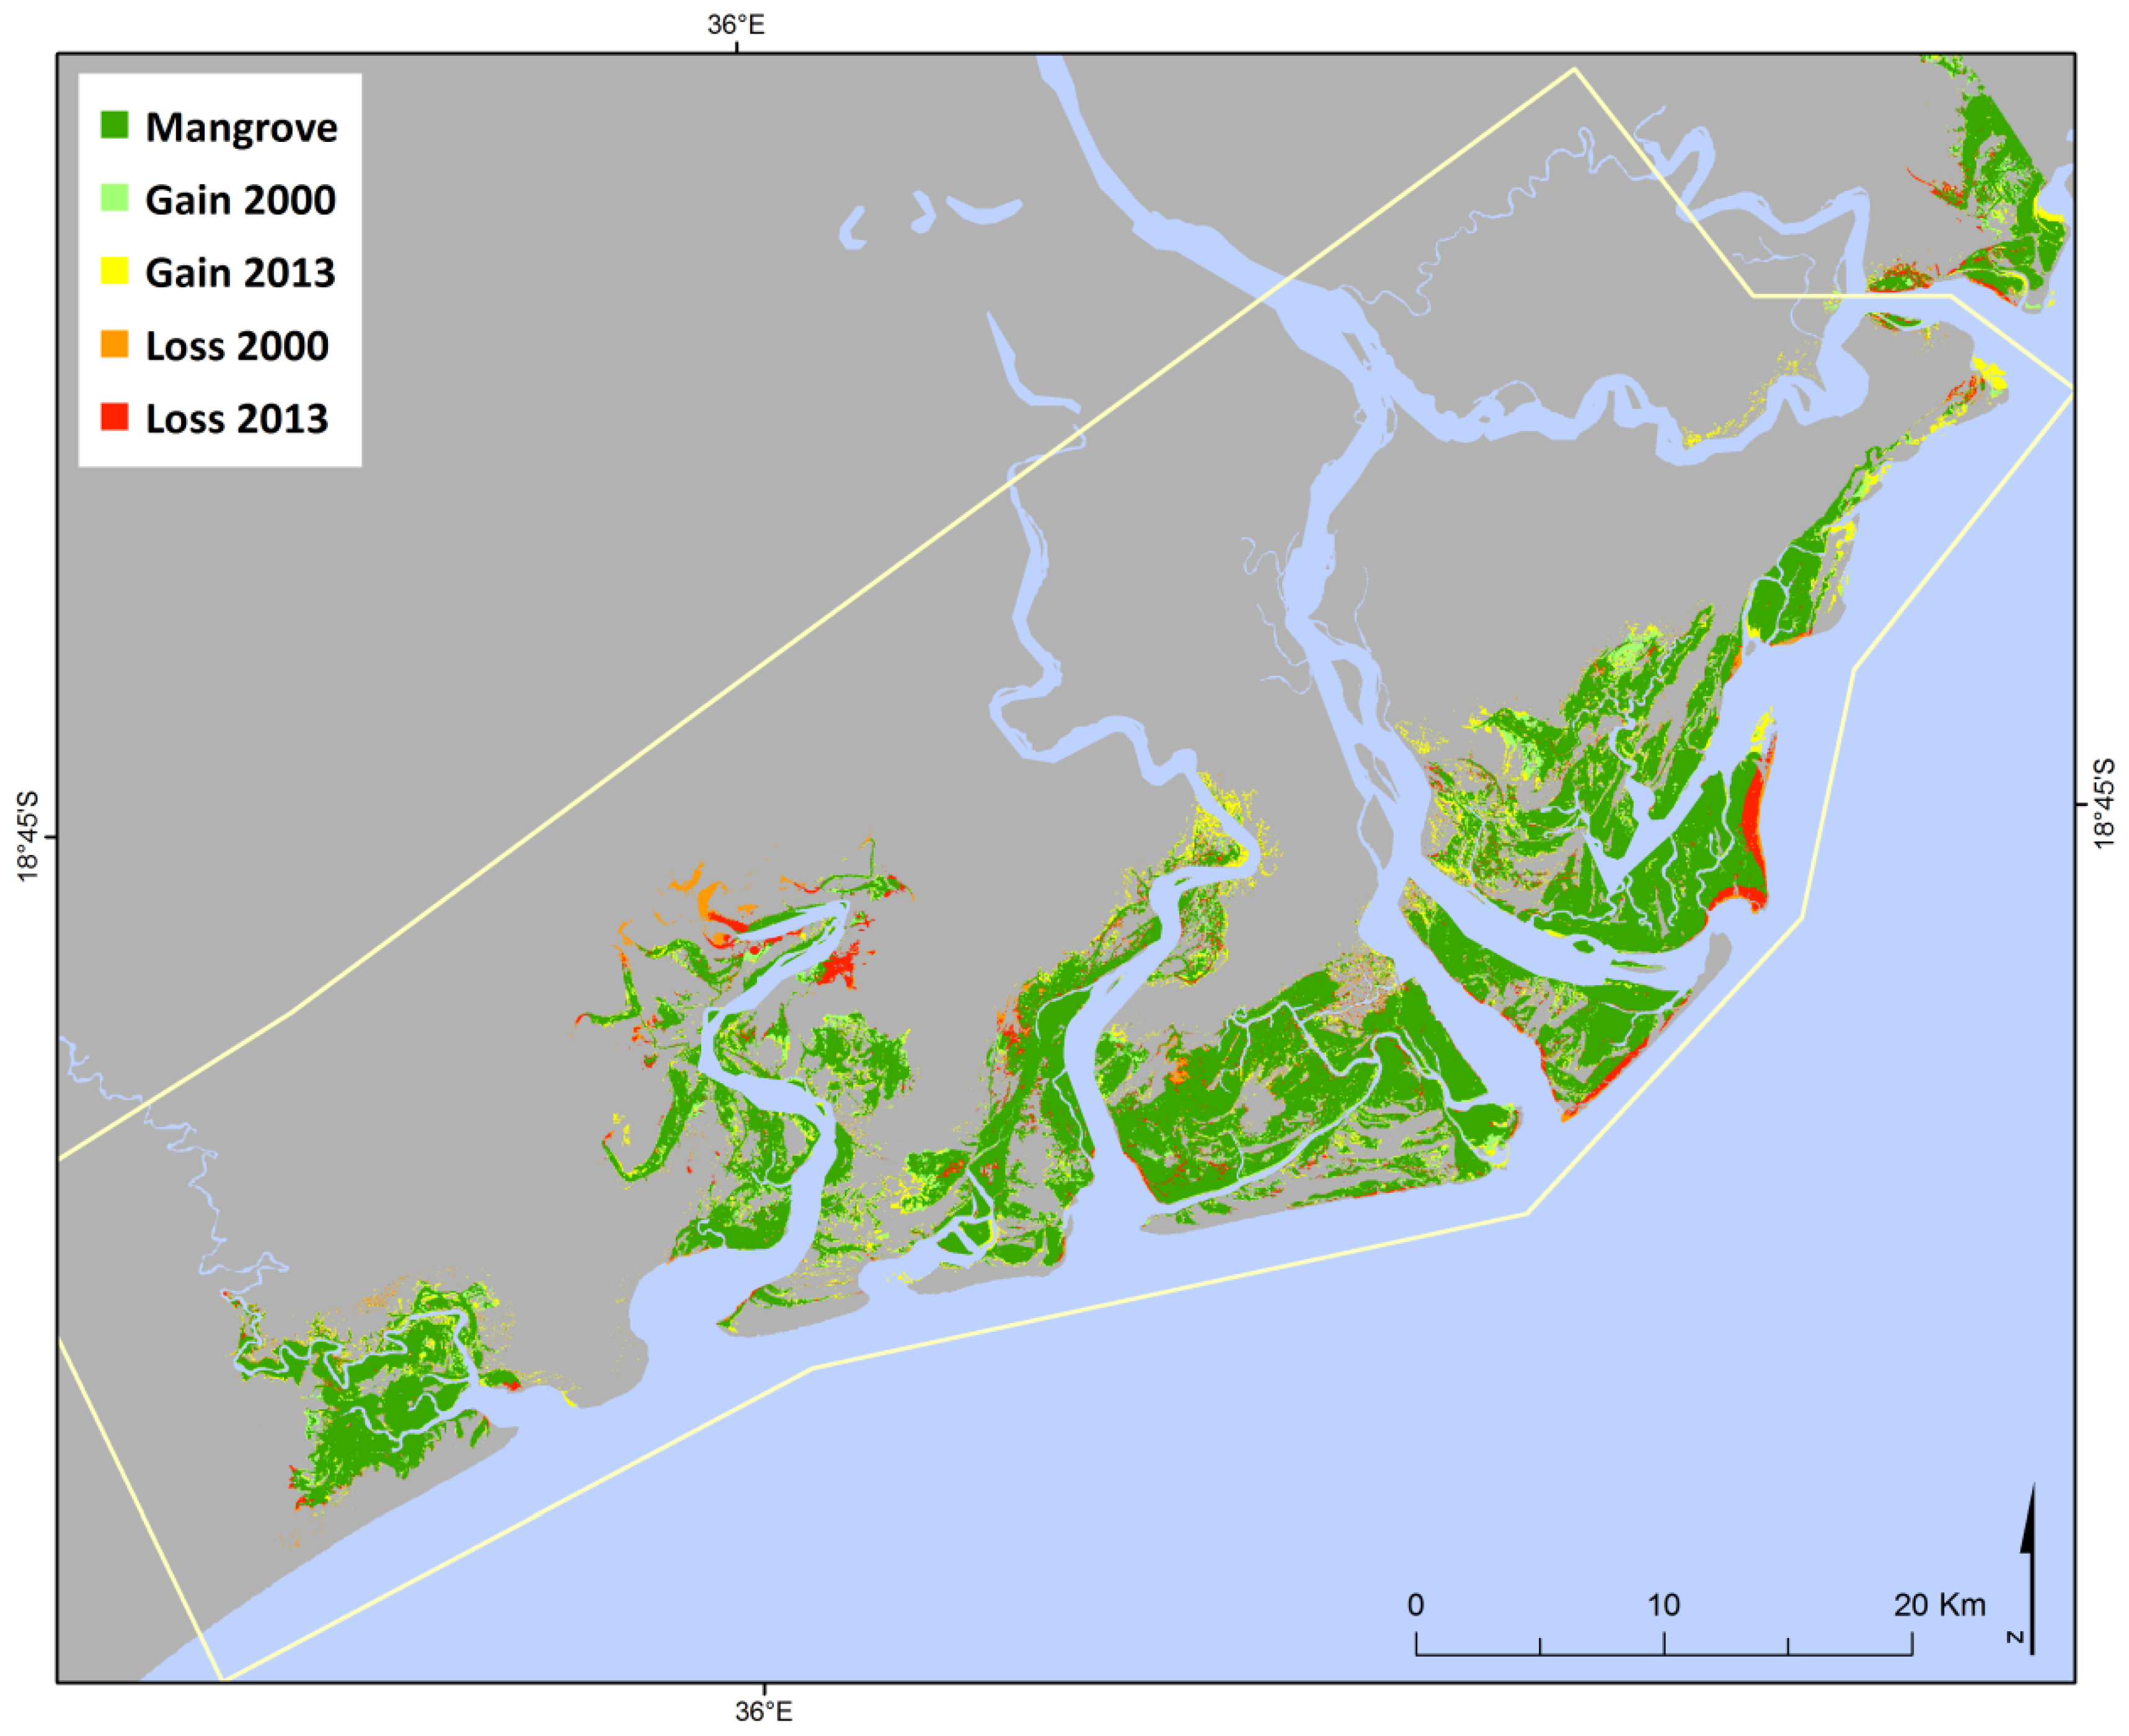
Mangrove area within the Zambezi River Delta as reported from recent assessments at varying scales using Landsat data. The comparison is for the area within the Delta boundary as shown in
Figure 3.
Table 7.
Mangrove area within the Zambezi River Delta as reported from recent assessments at varying scales using Landsat data. The comparison is for the area within the Delta boundary as shown in Figure 3.
| Area (ha) | Year | Project Scale | Source | Overall Accuracy (%) |
|---|
| 37,034 | 2013 | Strict Delta Area | This study | 85 |
| 36,461 | 2000 | Global | [2] | Not assessed |
| 30,267 | 1999–2002 | Continental Africa | [22] | 93 |
| 38,505 | Not reported | Mozambique | [9] | 84 |
The comparison amongst these aforementioned estimations is also difficult for the Zambezi Delta as the projects themselves differ in scale—these are often national products, with likely limited detailed information and field data specifically for the Delta area. Accordingly, the analyses presented here were focused on the Delta area and present the most robust to-date, resulting from standard methods [
10] applied specifically for Zambezi mangroves, tailored and verified by VHR and field data. The relative consistency between estimates mangrove area derived from Landsat time series affirm that the total area is much less than the largest estimates (e.g., >50,000 ha) previously reported [
6,
8]. The repeatability of our method with minimal visual interpretation and post-classification hand editing is also vital for reliable change detection and new estimates over time.
An accurate assessment of change in forest cover is fundamental for developing a strategy for REDD+ and monitoring progress towards emissions reduction targets. It is difficult to provide accurate estimates of change derived from various data sources, such as tabular statistics, or aerial photo interpretation combined with newer satellite image derived estimates, many of which lack specifically targeted field data or accuracy estimates [
8]. Correspondingly, large scale or global datasets may provide reliable general estimates, but inevitably lack the specificity for a particular area or forest type, and consistent accuracy assessment of these datasets may simply not be possible. Accordingly, there have not been any reliable estimates of change in mangrove cover for Mozambique. Hand-edited data which may be very accurate are unsuited for large scale or automated monitoring due to extensive user dependent interpretations. While large-scale automated tools appear to hold promise, the Google Forest Cover Change analysis, assessing forest cover change based on analysis of Landsat imagery from 2000 to 2013 did not show any gain or loss in mangrove forest cover within the Delta [
24].
Studying the distribution of mangroves throughout Mozambique, Fatoyinbo
et al. [
8] found large decreases in mangrove area in the Zambezi Delta based on Landsat data from 1990 to 2002. While that work contained a validation assessment, these data were collected from a different mangrove ecosystem in southern Mozambique, where the mangrove forest composition and structure are quite different than in the central and northern portions of the country. In contrast, in a study focusing on the Zambezi Delta, Beilfuss
et al. [
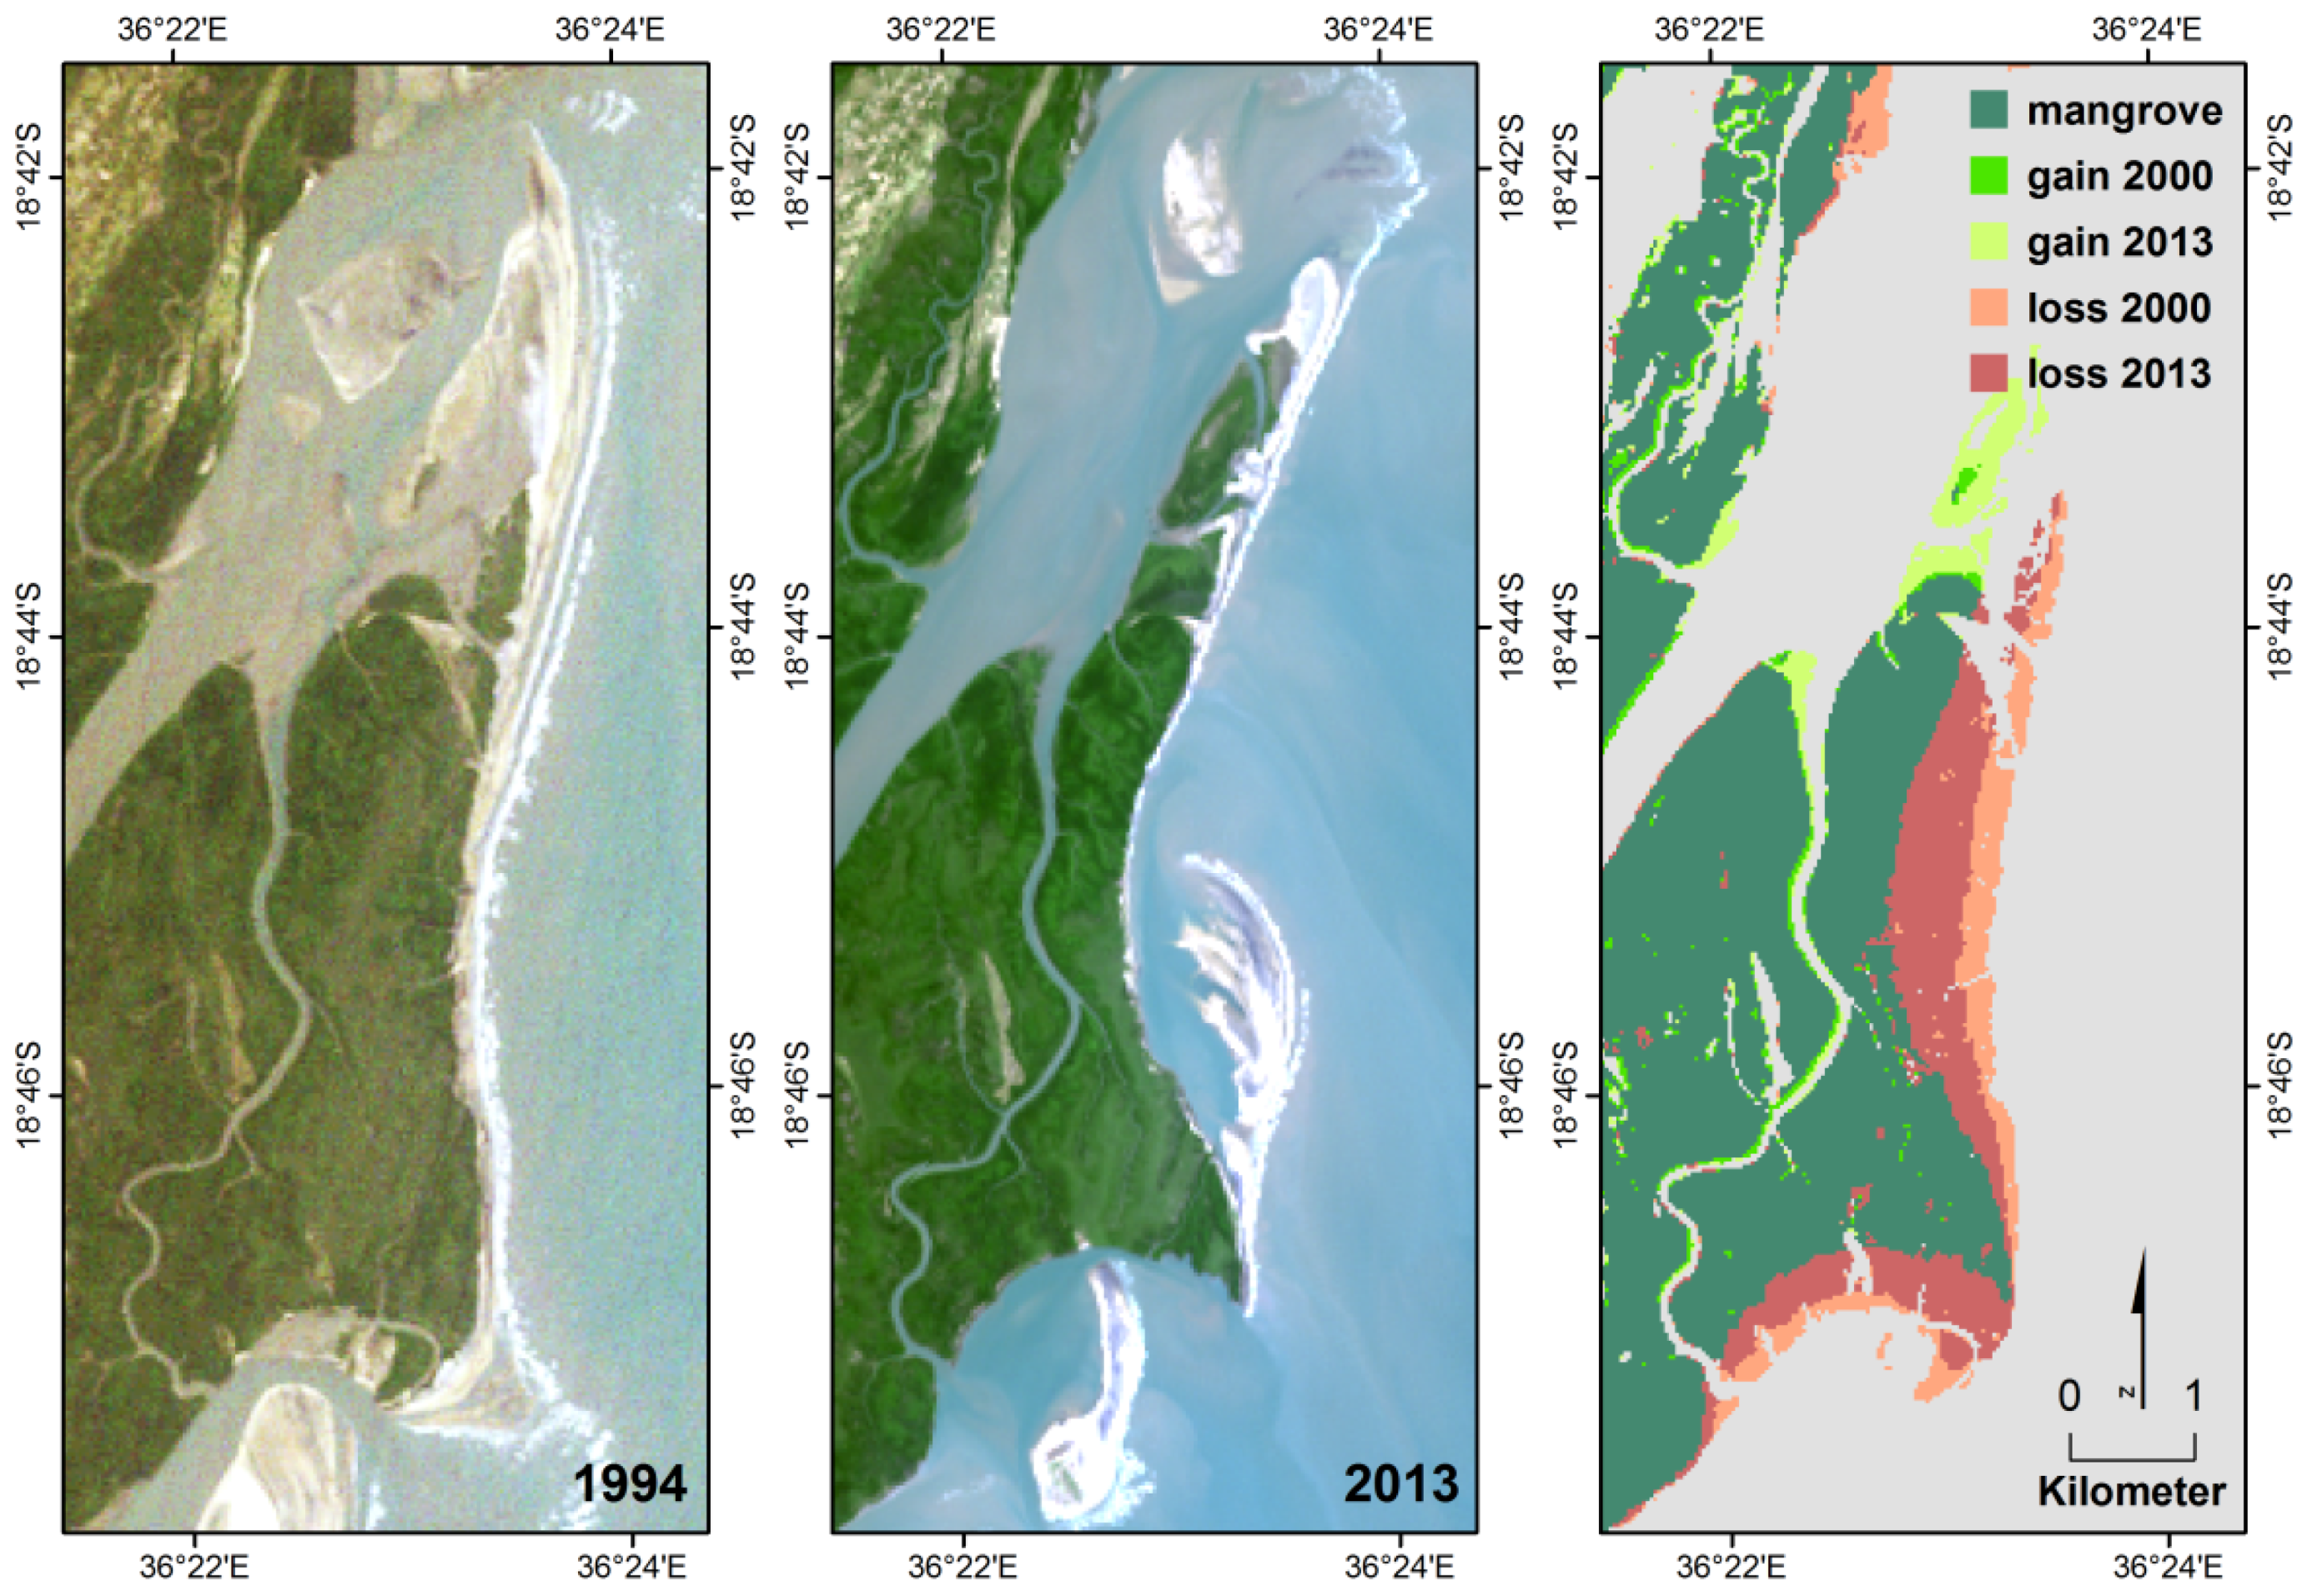
16] reported loss of mangrove forest that was balanced by the development of new mud flats supporting aggrading mangroves between 1960 and 2000, resulting in no overall change in mangrove area over the 40 year period. Large river deltas are dynamic systems subject to persistent tidal forces and seasonal flooding, resulting in changes to flow-paths, shoreline position and development of new lands, which can result in changes in mangrove cover, notably directional changes or shifts along geomorphological patterns [
6,
25]. On the ocean coast, regression has been observed, evidenced by dead trees and stumps in exposed mud and sand, a natural consequence of shifting shorelines from wave erosion and tropical storms. Other causes of mangrove cover loss include burning and cutting by local communities, though most areas suspected of being burned are located in the Marromeu Reserve, which was not visited during the field expeditions. Local observations of cut mangroves were in stands that were already dead or eroded on the shore. Mangroves are expanding upstream, which may be attributed in part by salinity regimes as a result of sea level rise and altered freshwater discharge from upstream dams. Many new young stands of
Avicennia marina were observed along inner channels and mud flats in the delta which was also documented by Tinley [
26] and Beilfuss
et al. [
16]. It should be noted that the increase in mangrove extent observed here is likely specific to the Zambezi and other relatively undisturbed deltas and estuaries.
There are relatively few inhabitants with the Zambezi Delta [
6]; accordingly, the pressures from anthropogenic disturbance (e.g., burning and cutting) are bound to be low, which is consistent with a recent report on the anthropogenic effects of coastal erosion [
27]. As a result, the total area of mangroves appears not to diminish due to human impacts as seen elsewhere, and the mangroves of the Zambezi are relatively intact despite the dynamic nature of its distribution. The widely varying reports of deforestation for the Zambezi Delta attest to the need for specific assessments, which include field validation for the area under consideration. It is quite possible that mangroves are decreasing for various reasons elsewhere in Mozambique, which unfortunately, are trends also observed worldwide [
8,
26,
28,
29]. Understanding the varying baseline condition and natural rate of gains and losses in mangrove forests is fundamental to REDD+ or other conservation mechansisms, and has important ramifications for restoration.
5.2. Application of High Resolution Data
It is a common misconception that higher resolution and detail results in better maps [
30]. On the contrary, it is more difficult to achieve the same overall accuracy with higher resolution due to the complexity of the imagery, small features which may be difficult to classify or have spectral signatures influenced by neighboring pixels. In addition, logistical limitations of very high resolution imagery include purchasing cost and processing time, and the need to bring together data imaged on different dates because of smaller swath size. Some of these factors can be overcome with a well-defined minimum mapping unit (MMU) [
30,
31] or OBIA, still, most high resolution satellites have lower spectral resolution compared to Landsat (lack of short-wave infrared bands which are very useful for mangrove mapping), large data volumes and limited archives for long time series. In this case, funding was a limiting factor for purchasing the full spectral resolution of VHR. For the purposes of REDD+ MRV, one aims for consistent, simple and cost-efficient mapping which can be repeated over time, for which very high resolution data in this case may not be optimal.
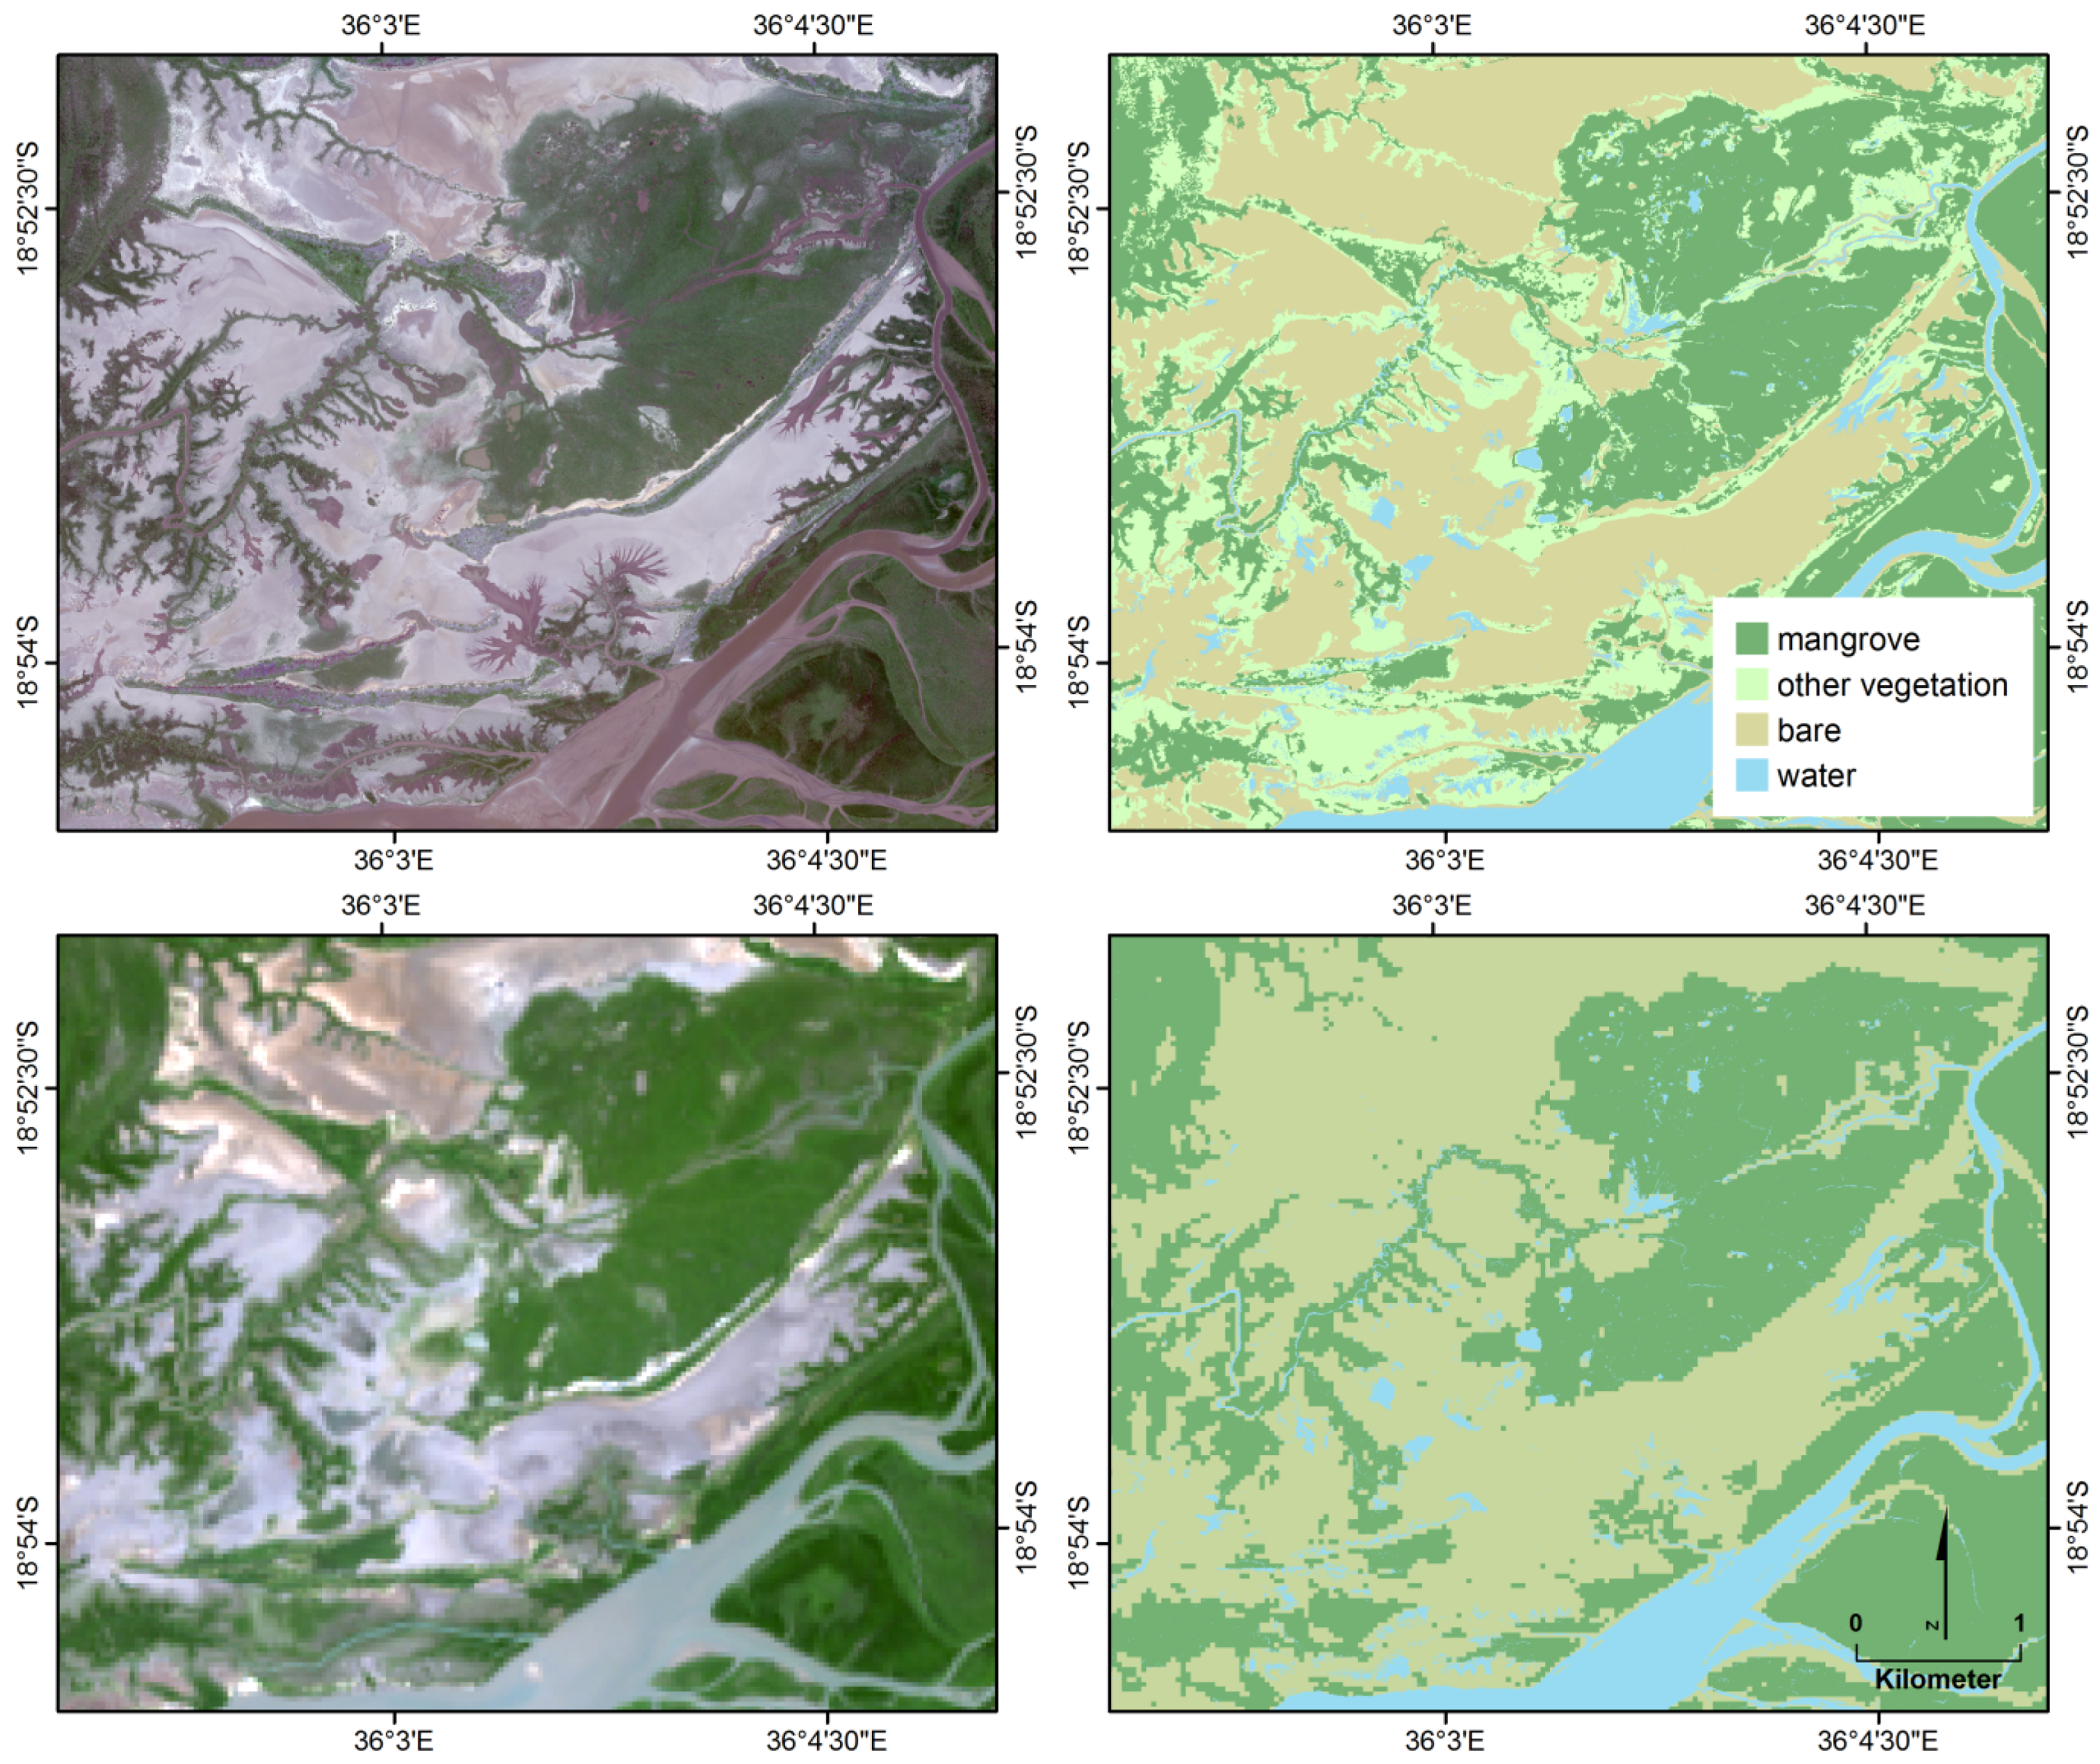
In this analysis, the Landsat derived map produced higher overall accuracy than the Worldview-2 data. This can be attributed to the more adequate spectral resolution of Landsat for mapping mangroves, while the detail of higher resolution (15 times greater;
Figure 5) and greater number of mapped classes generally reduce accuracy. While overall error may be higher with higher resolution, the higher producer accuracy indicates fewer areas of omissions, as this detailed imagery can identify sparse or small patches of mangrove. The high resolution data are also able to identify young mangrove stands with sparse tree cover and bare areas in between, which might not be visible in a Landsat pixel. VHR is nevertheless very useful for mapping mangrove cover in detail, often even species types, but requires more extensive field data, time intensive analysis and post-processing, in this case more than double the time than Landsat due to multiple vertical tiles treated separately. The classification based on high resolution data could be improved by including additional factors, such as mangrove structure, or revising methods [
32] however, the effort required to produce the maps with OBIA or complex techniques requires specialized knowledge, data, software, storage and is highly software dependent. The fundamental consideration is whether meter or sub-meter detail is required or provides essential added value to MRV, which is likely not true in such dynamic ecosystems which grow and change so quickly requiring time series—one only needs to map the forest and not individual trees. Here we produced more accurate maps over a longer time frame at a fraction of the cost of mapping with VHR. This by no means discounts the value of high resolution for use in the field for orientation and localization, reconnaissance for inaccessible areas as well as ground truthing and validation of lower resolution data, or to help determine causes of mangrove loss. The recommendation for MRV is to use imagery for its strengths: Landsat, and the new Sentinel-2 satellite will provide consistent time series and just as important, the appropriate spectral bands for mapping change, while high resolution imagery provides detail needed in localized areas for verification of loss or gain, or to provide additional insight for inaccessible areas.
5.3. Change in Carbon Stocks
Mangroves are recognized for their large amount of carbon in above- and belowground biomass and soil pools [
4], hence the widespread concern for their deforestation which can cause substantial carbon emissions [
22,
33]. With an understanding of baseline carbon stock, the land cover change analysis was used to assess the changes in biomass over time. In contrast to utilizing the SRTM data to estimate biomass [
22], [
4] measured carbon stocks directly, and used the canopy height classification based on remotely sensed data to extrapolate across the inventory area. Similarly, [
34] used Landsat to classify land cover in Madagascar and inventory carbon stock in three different mangrove types. The use of an objective inventory design in combination with a land classification can provide the basis for assessing changes in carbon stocks based on land changes in land cover.
The dynamic redistribution of forest carbon stocks in mangroves has important implications for the design and implementation of sustainable management and conservation strategies to ensure the delivery of ecosystem goods and services. There was net increase in carbon stocks observed with in the Zambezi Delta over the 13 year period, which is driven by the increase in mangrove area over time. Loss in forest carbon stock occurred across all canopy height classes, though more change occurred in the smaller height classes. While we assumed the loss of mangrove cover resulted in a loss of all carbon, a preferred means would be to obtain carbon density measurements for new land cover conditions as well as changes such as sequestration provided by persistent mangrove. In the case of erosion, however, where the land has been replaced by water, the assumption of complete loss is tenable. From a carbon perspective, the ability to sustain an increase in forest carbon despite the lower carbon density on the lower stature height class 1 stands, is attributed to the gain in forest area with soils inherently high in C, which is not uncommon for mud flats and estuarine sediments [
35]. The loss of carbon per unit area by deforestation occurs very quickly howrver, whereas it takes several years to build up carbon stocks in soil and trees.


 ,
, 

