1. Introduction
The last 15 years have witnessed an increasing number of techniques, applications and studies aimed at demonstrating the applicability of images captured by satellite Synthetic Aperture Radar (SAR) sensors to slope instability investigations. This appears to be related to: (i) the wide data availability, resulting from the launches of a number of platforms hosting radar sensors with increasing imaging capabilities, in terms of both spatial and temporal resolutions [
1,
2,
3]; (ii) the development of new data processing techniques, such as SqueeSAR [
4], which extends the applicability of Persistent Scatterer Interferometry (PSI) methods [
5,
6,
7,
8] to non-urban areas; (iii) the improved capabilities of new generation X-band satellites in terms of flexibility and time performance (revisiting time and timeliness of delivery) which contributed to the use of satellite SAR sensors as operational monitoring tools [
9,
10].
Geoscientists have widely exploited existing SAR archives chiefly to resolve the spatial distribution and to analyze the temporal evolution of displacements in areas affected by slow moving landslides [
11,
12,
13,
14,
15,
16,
17,
18]. In many cases, they used different approaches belonging to the PSI family, which relies on the phase shift analysis of long series of co-registered, multi-temporal SAR images of the same target area. Due to the inherent limitations of current space observation systems and relevant data processing techniques, PSI approaches are currently applicable only to two classes of the [
19] classification: extremely slow and very slow movements (vel < 16 mm/yr and 16 mm/yr ≤ vel < 1.6 m/yr, respectively). Therefore, landslide-induced displacements, detectable through PSI techniques, are restricted to phenomena with very slow dynamics, such as deep-seated gravitational slope deformations, creep, and, in some cases, slides and complex landslides. These movements are suitable for analysis based on PSI techniques, as long as they evolve with very low displacement rates (few tens of centimeters per year) and their velocities do not exceed the intrinsic limits of the techniques, related to the radar wavelength and the spatial density of measurement points. Nevertheless, some applications of SAR data exist with regard to the identification and mapping of rapid landslides. Czuchlewski
et al. [
20] used L-band imagery to detect surface changes produced by the earthquake-induced Tsaoling landslide; Molch and Singhroy [
21] characterized the debris size and monitored post-slide motion of rock avalanches in Canada; Lauknes
et al. [
22] presented a detailed rockslide mapping in northern Norway.
To overcome the above mentioned limitations and to map deformations induced by rapid landslides, the analysis of amplitude information (rather than the phase values of the complex SAR scene) is often an effective method to retrieve deformation data in fast-moving areas. A typical application is related to fast moving (with respect to the revisiting time) glaciers [
23] or large co-seismic fault slip (generating large deformation gradients). The amplitude-based Rapid Motion Tracking (RMT) technique, applied in this work, is a method capable of tracking movement rates (from tens of centimeters to tens of meters) that exceed those observable with SAR interferometry [
24].
In this work, the outcomes of the activities performed during a landslide emergency that occurred in the Montescaglioso municipality (Basilicata Region, southern Italy) are presented. On 3 December 2013, prolonged and intense rainfalls triggered a large and rapid slope failure, which produced a ground displacement of several meters. This displacement resulted in remarkable geomorphological effects but, luckily, no fatalities occurred and the Montescaglioso village suffered no major damage.
Following this event, in the framework of the post-disaster initiatives led by the National Department of Civil Protection (DPC), several activities were performed aimed at supporting local authorities in the assessment of the hydro-geological risk of the area. The Center of Competence of the Earth Sciences Department of the University of Firenze (UNIFI-DST), in collaboration with TRE (Tele-Rilevamento Europa, spin-off of the Polytechnic University of Milano), was asked to analyze the landslide deformation field using satellite radar data. In this paper, we present the main findings of these activities, which allowed a better understanding of the phenomena occurring in the study area.
First, we present the outcomes of the multi-interferogram SqueeSAR analysis applied to SAR images acquired by the COSMO-SkyMed (CSK) sensors before the event, to obtain a synoptic view of pre-existing surface deformation phenomena. Then, the three components of the deformation field induced by the landslide are presented, as retrieved by the RMT approach applied to CSK SAR images captured before and after the event.
2. The Study Area
Montescaglioso is a hilltop village, developed at an elevation of about 350 m a.s.l., located in the southeast part of the Basilicata Region, close to its border with the Puglia region (southern Italy), orographically left of the Bradano River. The study area is an important archeological zone [
25]. The original nucleus of Montescaglioso dates back to the Bronze Age. Thanks to its strategic position in the Bradano valley, Montescaglioso was a flourishing Greek and Roman settlement.
2.1. Geological and Geomorphological Framework
Montescaglioso is located inside the Bradanic trough, which represents the foredeep between the Southern Apennines and the Apulian foreland. The southern continuation of the Bradanic trough is represented by the Gulf of Taranto, where the subduction of the Apulian foreland under the Apennine chain is still active. The inland part of the trench was filled between the Lower Pliocene and the Pleistocene by a 3000 m thick sedimentary sequence. The Neogene deposits are made of marine clay, sandstones and conglomerates with intercalation of olistotrome from the Apennine chain. At the top of this sedimentary sequence, continental deposits crop out. The Apulian foreland is made of limestone disjointed by a NW-SE oriented system of normal faults.
The early stage of the foredeep filling occurred at the end of the Lower Pliocene when the marine transgression moved towards NW, forming a gulf 100 km wide. During the Medium-Upper Pliocene, the Bradanic trough became a trench because of the renewal of the subduction of the Apulian foreland and the uplift of the Apennine chain. During this period, the prevailing sedimentary processes are represented by turbidites, debris flows and mud flows. The overthrusting of the Apennine chain on the Pliocene deposits continued since the Pleistocene when the maximum sinking of the foredeep was reached in correspondence with the area where Montescaglioso is located. Here, the turbiditic deposits have a thickness of more than 1500 m and the Quaternary deposits lie in unconformity on the Apulian limestones.
During the Middle-Upper Pleistocene, the study area was affected by uplift phenomena [
26,
27] characterized by the deposition of continental deposits (sands and conglomerates). The depocenter shifted eastward toward the Gulf of Taranto.
The study area is characterized by the presence of a NNW-SSE oriented low relief (up to 400 m a.s.l.) whose top hosts the urban fabric of the Montescaglioso village. The local relief of the Montescaglioso area is represented by a stratigraphic succession made of clays, silty sands, sands and conglomerates deposited between the Upper Pliocene and the Pleistocene. These lithologies have been mixed by landslide phenomena occurring over time along the steep slopes bordering the village. In particular, along the south-west side of the Montescaglioso hill, the occurrence of ancient, large, deep-seated slope failures is witnessed by the presence of big-sized block of conglomerates scattered within the sandy deposits.
The whole study area is characterized by a scarce vegetation cover. Erosive phenomena at the toe of the hills are frequent because of the presence of several streams having torrential flows. Gully erosion phenomena are common especially in areas characterized by the presence of clay. Furthermore, this area is strongly affected by past slope failure phenomena as testified by the detection of several crowns, trenches, slope bulging and mud lobes.
2.2. Landslide Occurrence
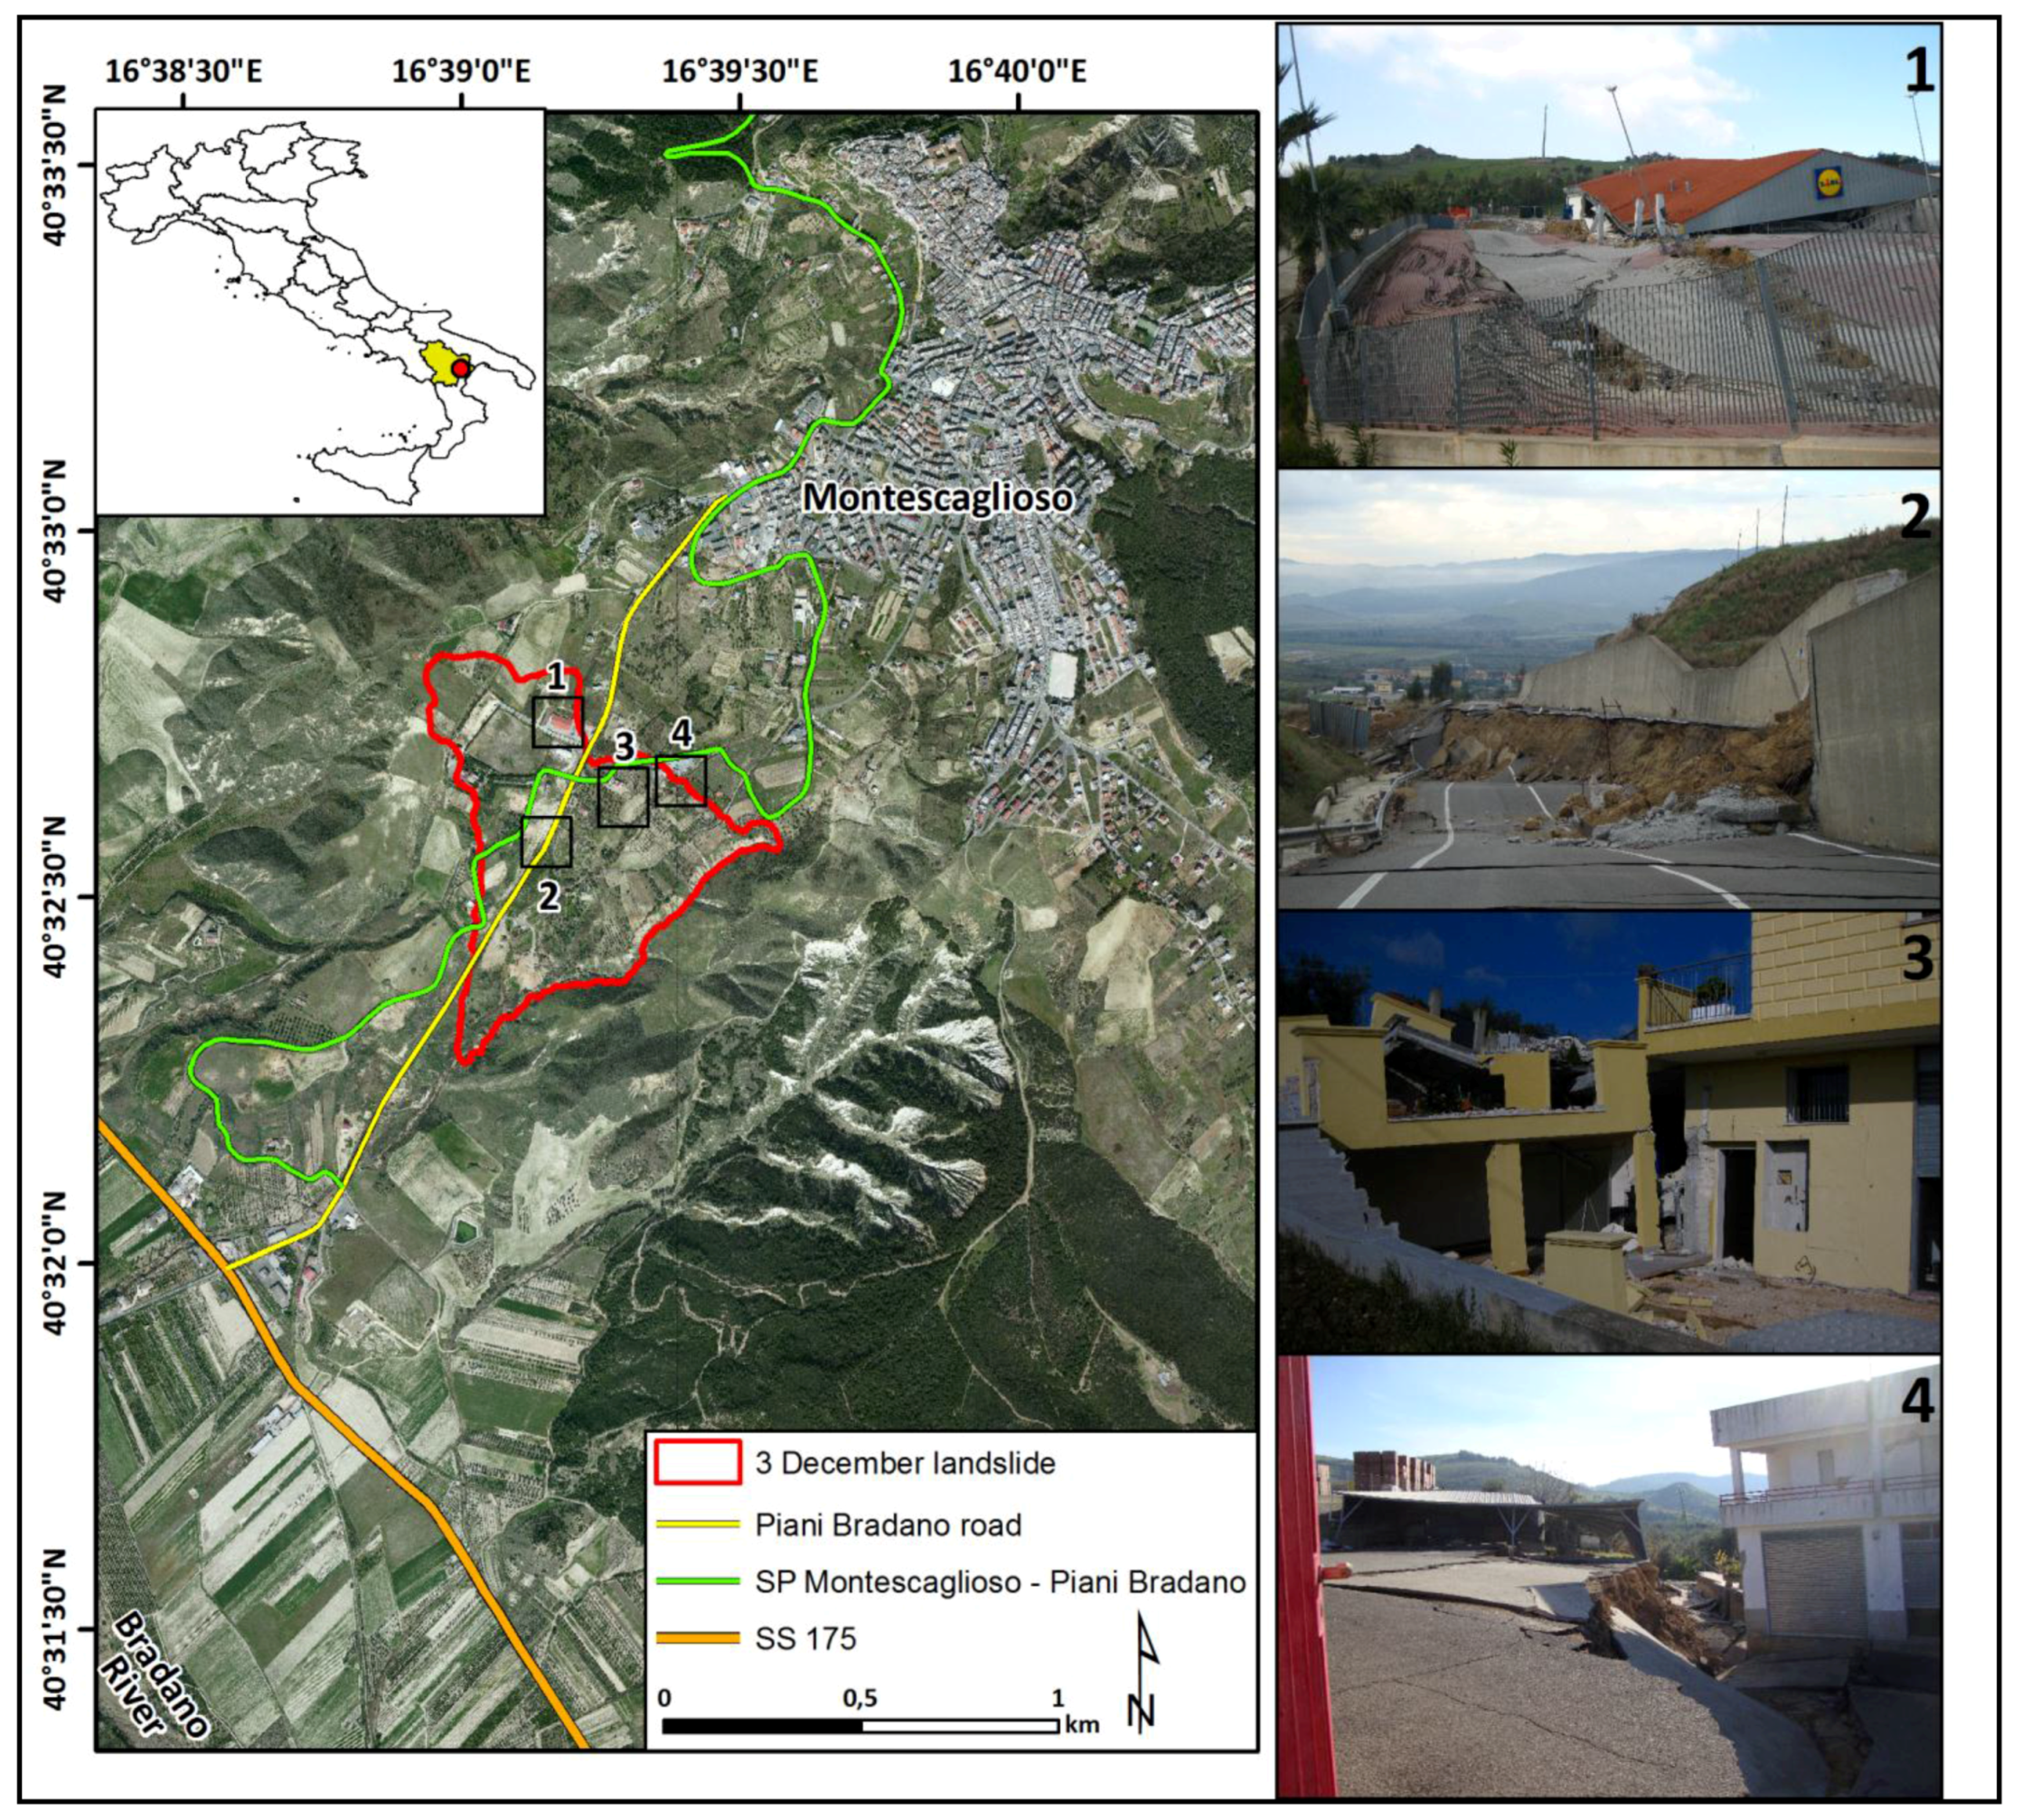
On 3 December 2013, a large landslide occurred on the SW facing slope of the Montescaglioso village (
Figure 1).
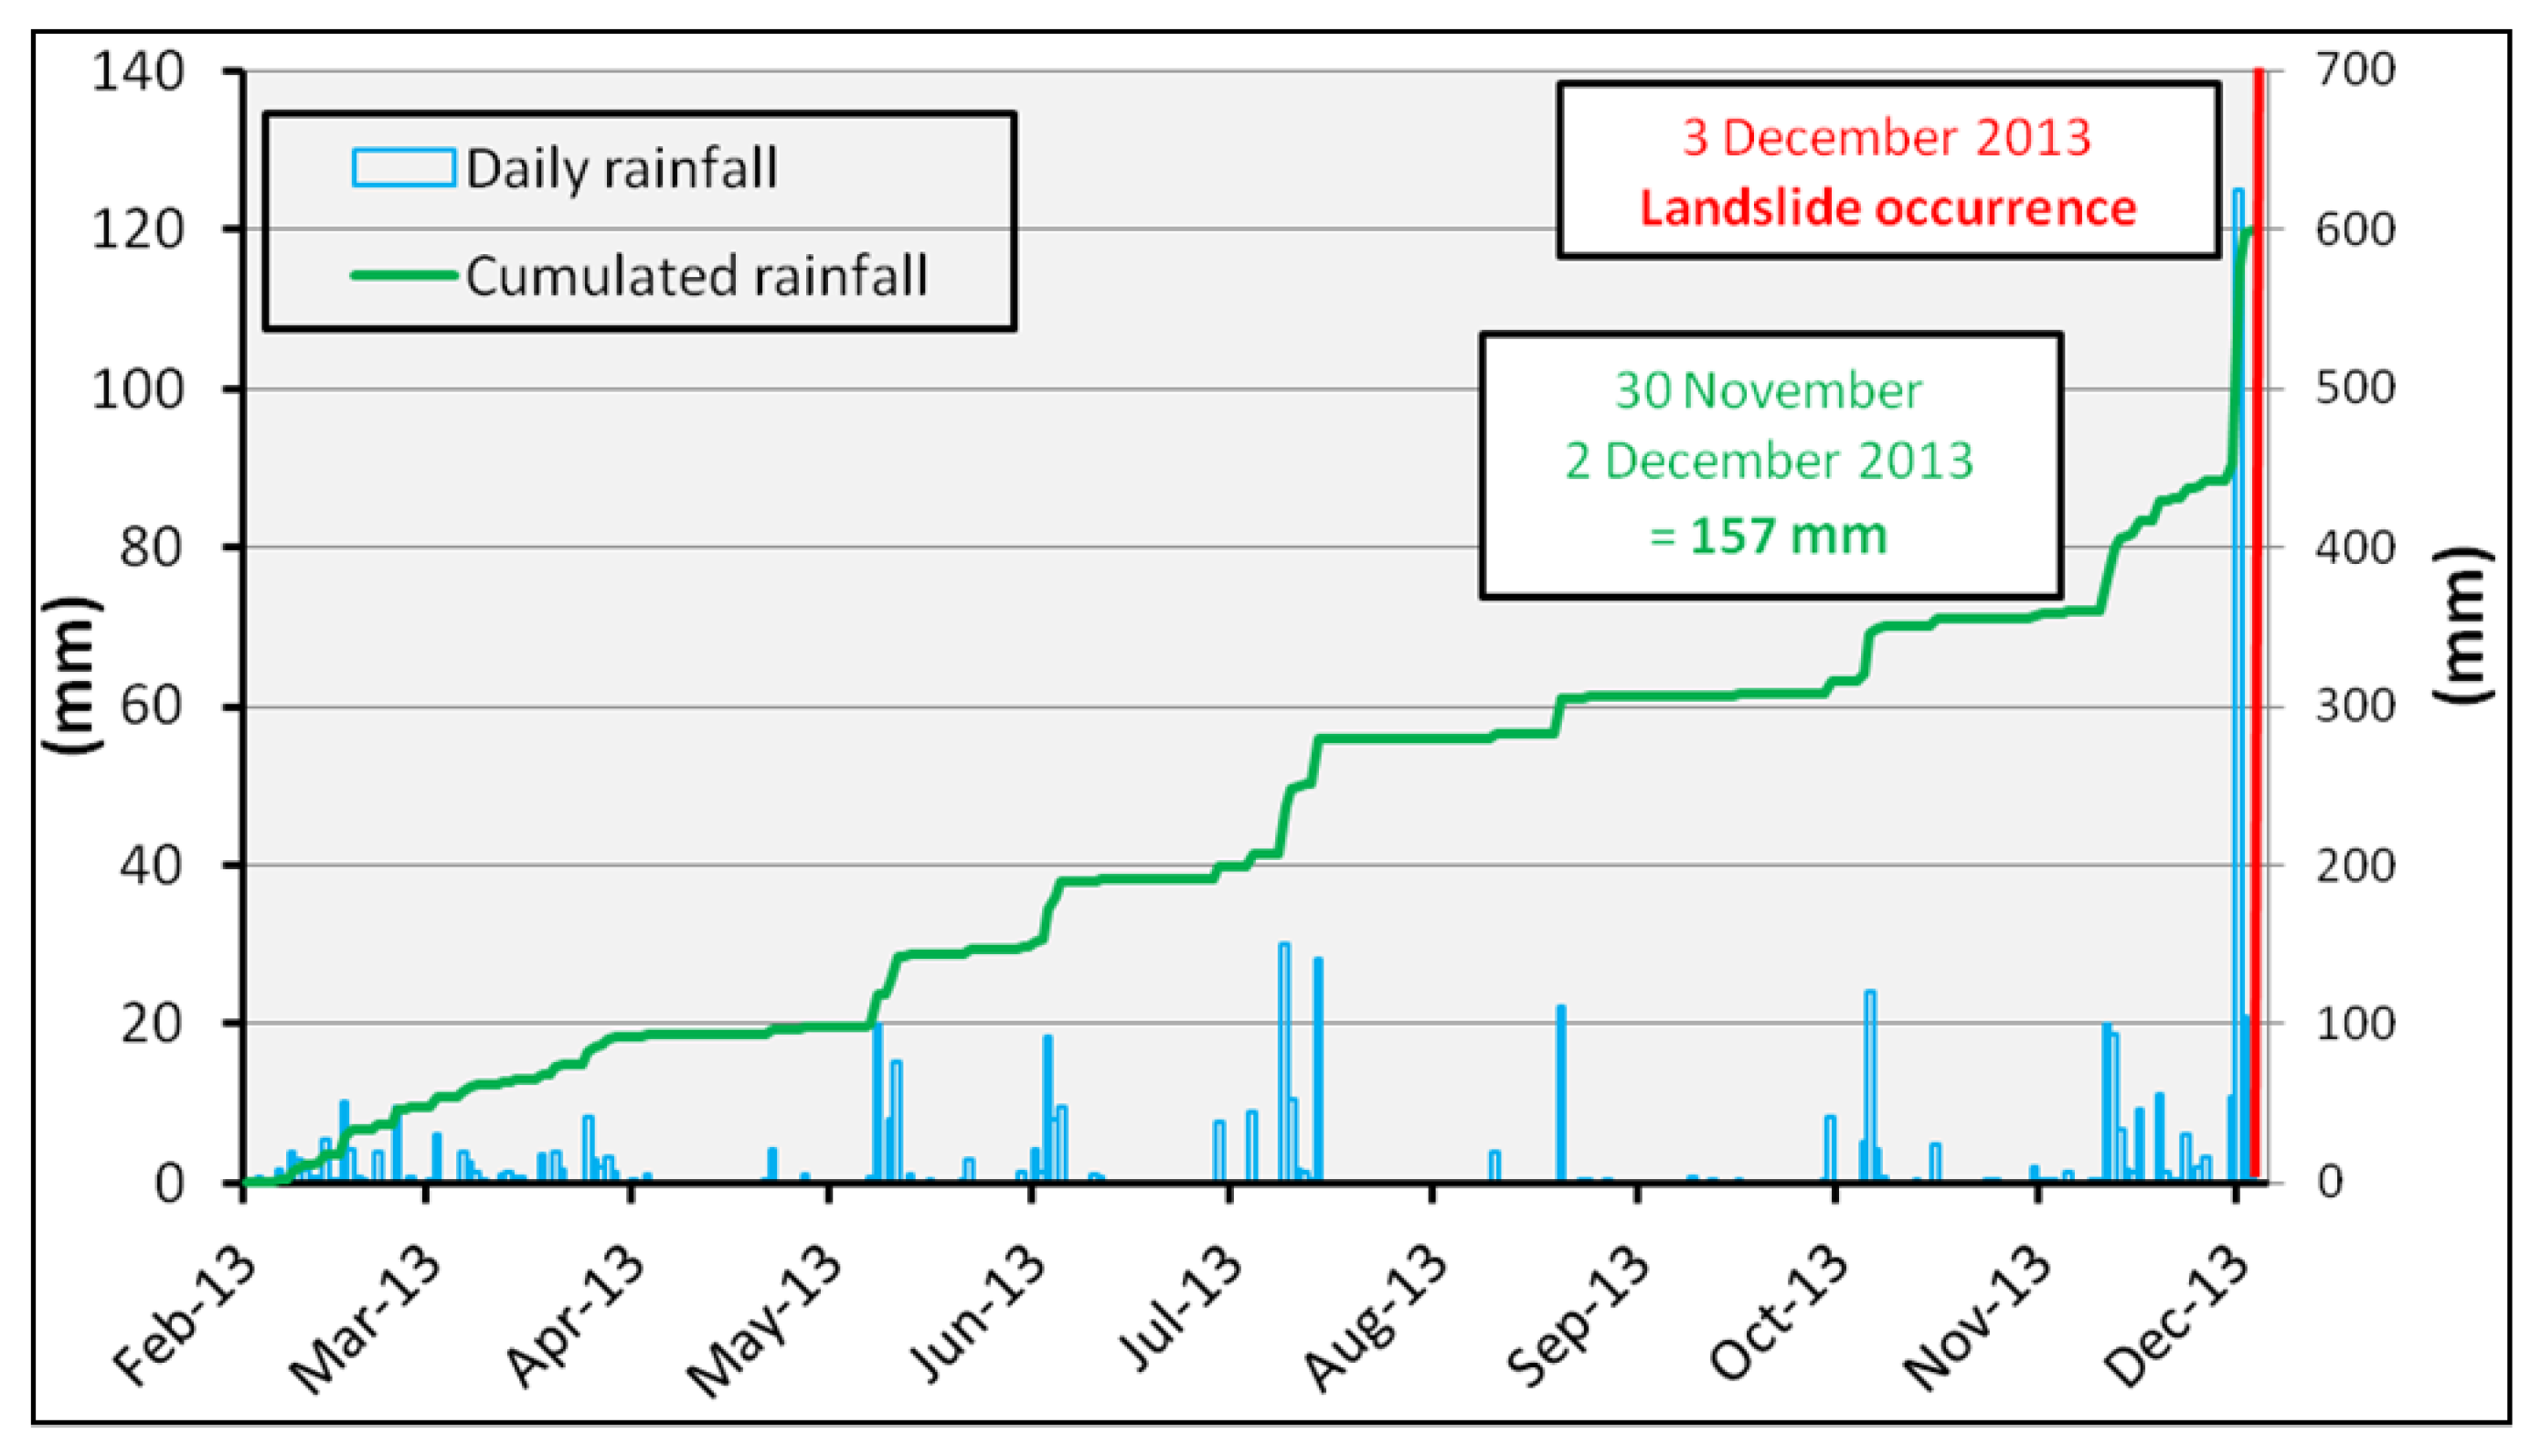
The landslide occurred after some days of persistent rainfall affecting southern Italy. Despite the lack of a rain gauge within the Montescaglioso municipality when the landslide occurred, two meteorological stations were available nearby the area, at Ginosa and Matera, 8 km SE and 13 km NW of the landslide, respectively. From the afternoon of 30 November to the late evening of 2 December, the cumulative rainfall was 152 mm and 157 mm at the Ginosa and Matera rain gauge (
Figure 2), respectively. This intense precipitation, immediately before the event, further contributed to the critical state caused by the significant accumulation of rainfall occurred during the month of October and November, which led the soil to complete saturation. It is worth mentioning that the average annual rainfall in the area is 570 mm [
28].
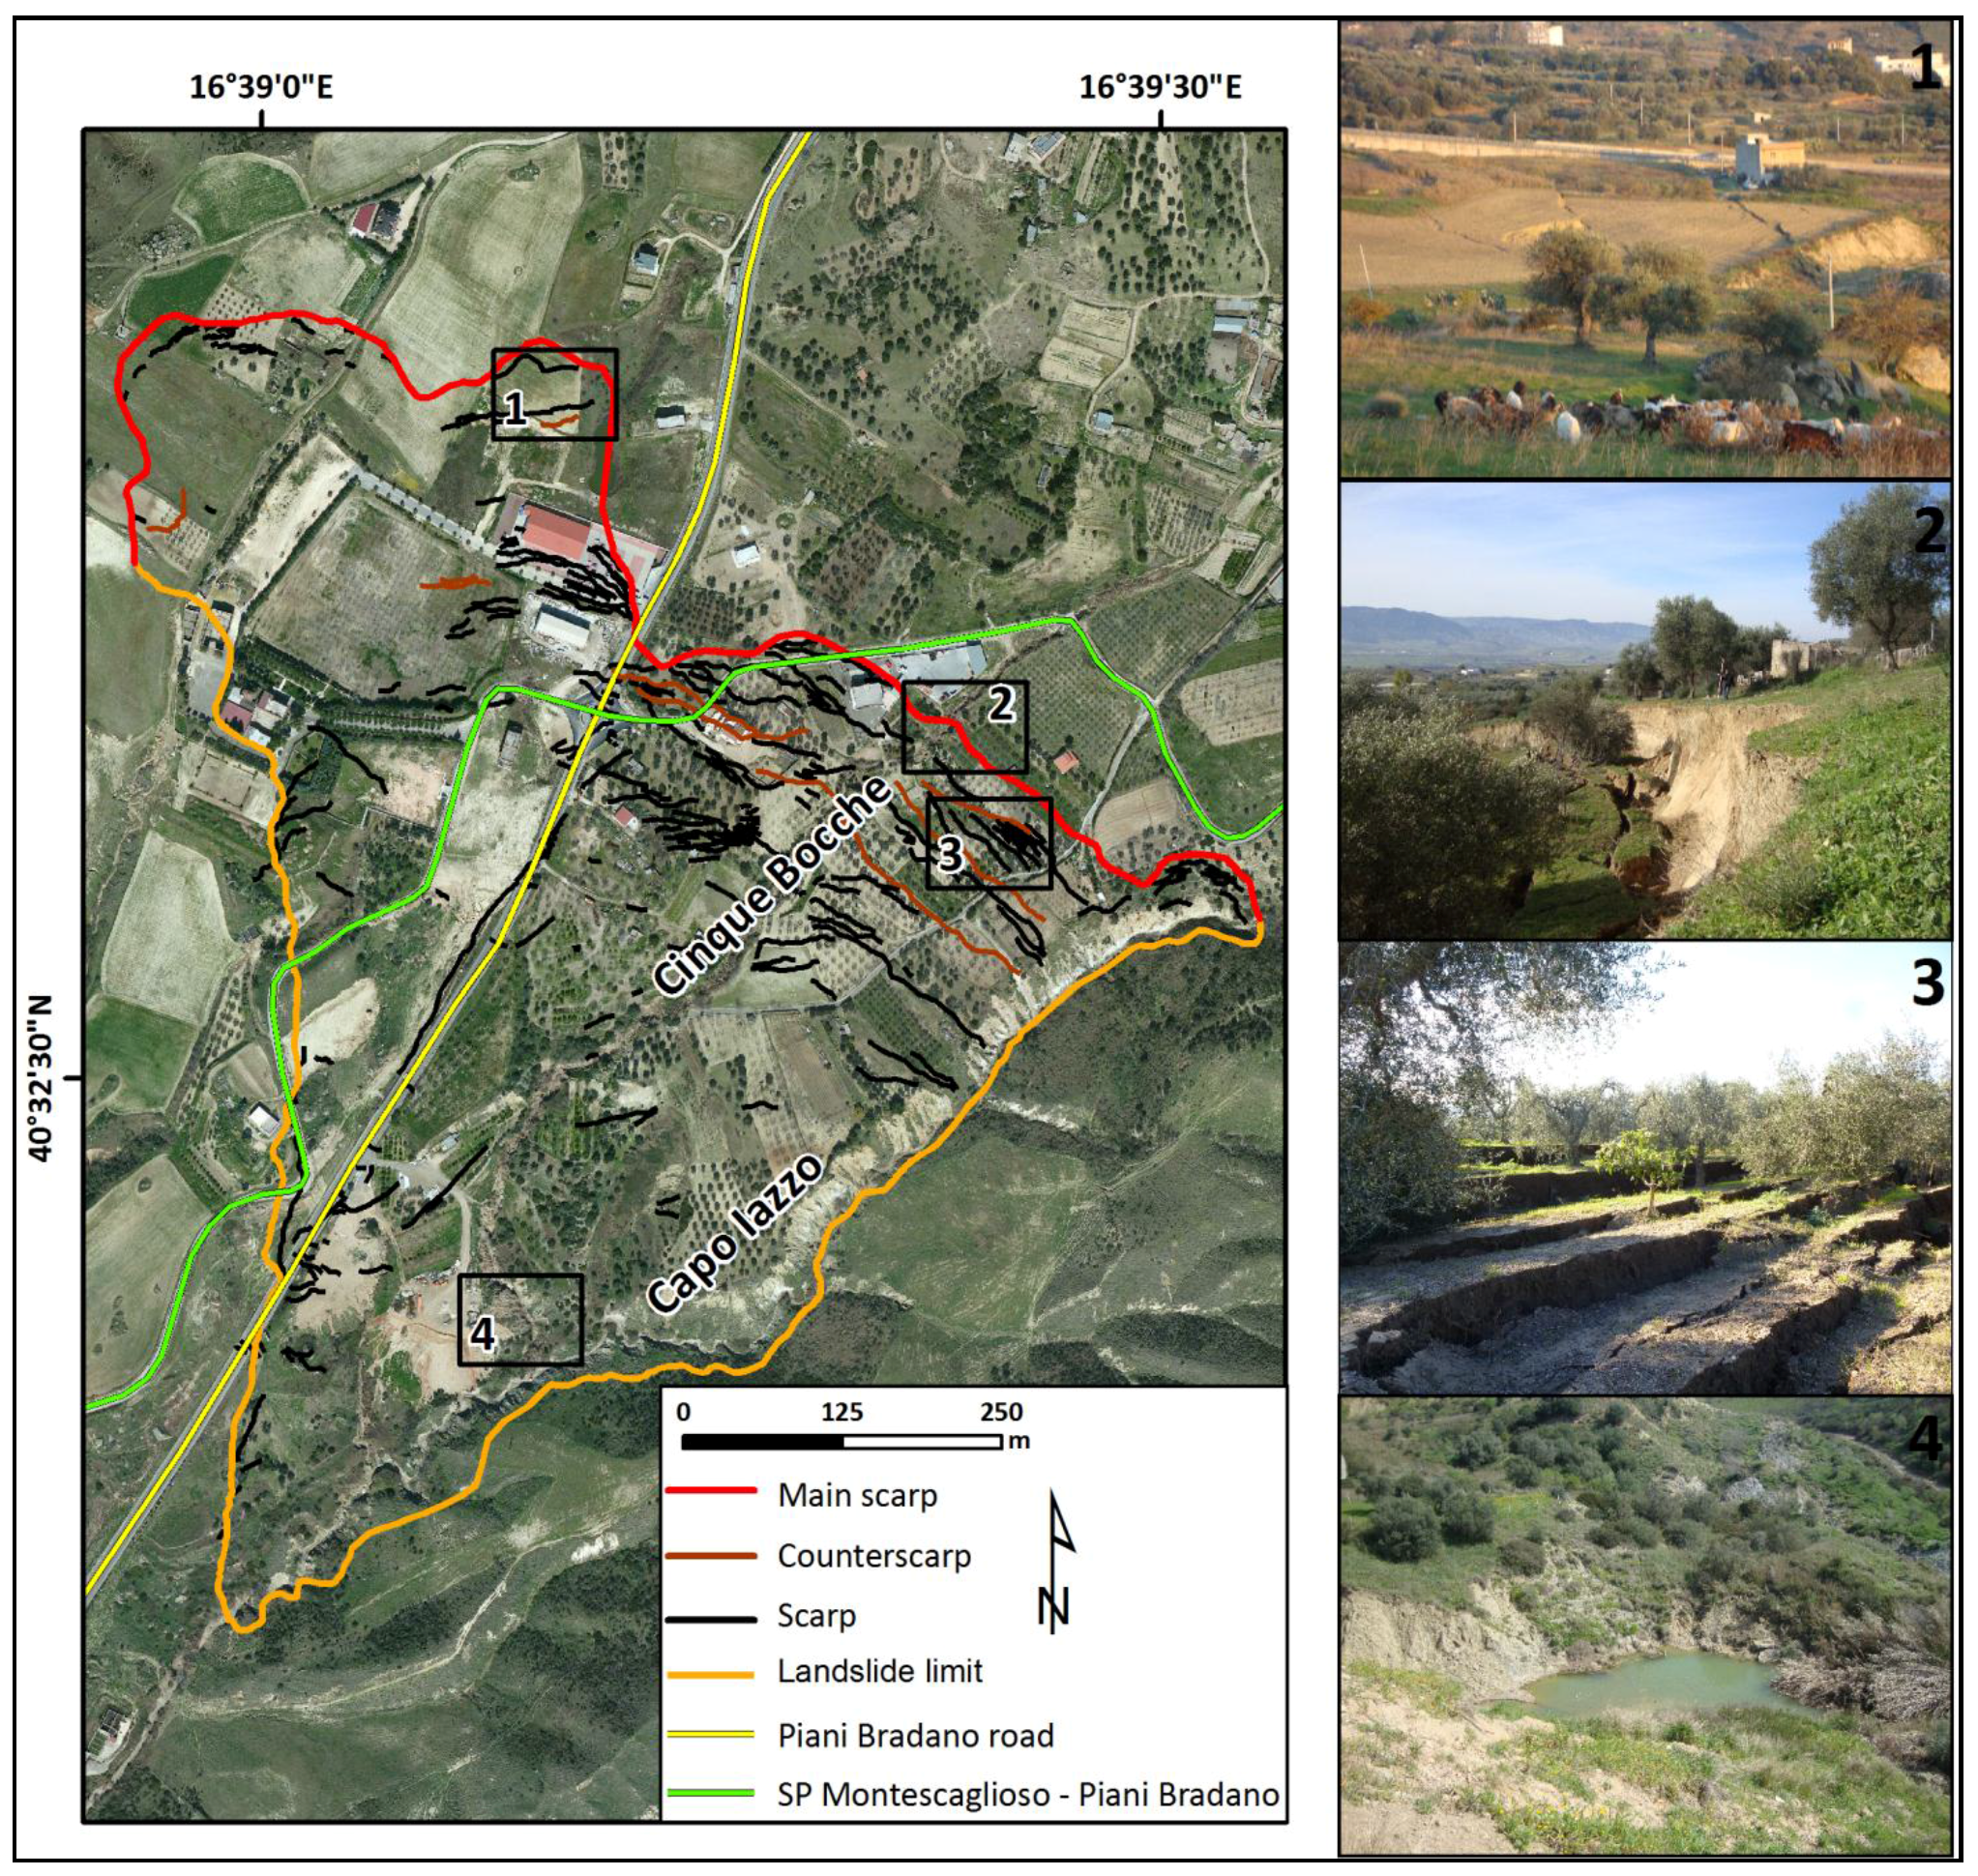
The landslide began to move at 13:00 in the area charted as “Le Cinque Bocche” (
Figure 3), an Italian name referring to the numerous water springs in this sector of the slope, related to the very shallow piezometric surface. The movement immediately involved the municipality road named “Piani Bradano” and progressively moved south-east, affecting the area along the right bank of the Capo Iazzo creek (See
Figure 3 for location). Afterward, in a second phase, the movements affected the north-western part of the slope.
Figure 1.
Location map of the 3 December 2013 Montescaglioso landslide. In the insets damaged buildings and disrupted roads are reported: (1) Collapsed supermarket; (2) Disruption to the Piani Bradano road; (3) Damage to a private house; (4) Damage to artisan warehouse.
Figure 1.
Location map of the 3 December 2013 Montescaglioso landslide. In the insets damaged buildings and disrupted roads are reported: (1) Collapsed supermarket; (2) Disruption to the Piani Bradano road; (3) Damage to a private house; (4) Damage to artisan warehouse.
Figure 2.
Rainfall recorded before the landslide event at the Matera rain gauge. The red line represents the occurrence of landslide on 3 December 2013.
Figure 2.
Rainfall recorded before the landslide event at the Matera rain gauge. The red line represents the occurrence of landslide on 3 December 2013.
According to the [
19] classification, the landslide can categorized in the “rapid” class (1.8 m/h ≤ vel < 3 m/min): in fact, most of the movement occurred within a period of 20 minutes, resulting in a maximum displacement of more than 15 meters, corresponding to a velocity of 0.75 m/min. The landslide area extends from an elevation of 250 m a.s.l. at the crown area to 130 m a.s.l. at the toe. The landslide has a total length, along the main displacement axis, of about 1200 m, and a width, measured perpendicularly, of about 880 m.
The 3 December 2013 landslide affected ca. 500 m of the municipality road named “Piani Bradano” which connects the Montescaglioso village to the SS (Strada Statale) 175, stretching along the left side of the Bradano River. The landslide created damages in several sectors of the road, making it unusable and causing interruption to the main arterial road of the area, which guarantees access to Montescaglioso. Also, the SP (Strada Provinciale) Montescaglioso–Piani Bradano, the historical connection between the village and the Bradano valley, was disrupted for ca. 600 m. Consequently, the whole road network of the area was largely damaged. The event caused the damage of some private buildings, of commercial and artisan activities and the collapse of a supermarket (
Figure 1). For security reasons, 10 houses were evacuated after the landslide.
A few days after the event, a campaign of field activities was performed to survey the main morphological evidence of surface deformation and to prepare a detailed geomorphological map of the landslide. To this aim, the boundary of the landslide and the main scarps and counterscarps were accurately surveyed through a topographic differential GPS in RTK (Real Time Kinematics) mode. RTK GPS device allows the acquisition, in a few seconds, of the position (LAT, LONG) and height of a surveyed point in WGS84 coordinates. Therefore, position and height can be only obtained for those points that can be physically accessed with the device, and where sufficient visibility to more than four GPS satellites is achieved [
29,
30].
For the Montescaglioso landslide, in order to collect the accurate position of the landslide features, the survey step between two consecutive points ranged from a few meters for irregular and/or curved elements to several meters for regular and rectilinear elements. We surveyed the main scarp for its 1.5 km of length, to mark the upslope end of the landslide and the 2 km long landslide limit to assess the extension of the mass of soil moved downslope. These landslide features have been surveyed and mapped with an accuracy in the order of 2 cm. The results of the GPS survey are mapped in
Figure 3.
The movement affected an area of about 0.4 km
2, resulting in a series of trenches (up to 2–3 m wide), scarps and counterscarps, tens of meters in length and with height up to 8–10 m. The main scarp appears as a steep (nearly vertical) surface of exposed soil at the head of the landslide. In the upper sectors of the landslide,
graben-type features were also present. The landslide movement determined the alteration of the hydrographic network: the debris of the left flank of the landslide partially blocked the Capo Iazzo creek, modifying the main drainage network. In the lower part, close to the original confluence between the Cinque Bocche and Capo Iazzo creek, the accumulation of material dammed water flow, resulting in the formation of landslide ponds and lakes (
Figure 3). The morphological evidences surveyed indicate a main translational-type movement, with the main directions of movement towards the South-West.
Beside this, field surveys allowed the identification of many geormorphological features related to the presence of pre-existing landslides of different types. Besides landslide inventory maps included within the Hydrogeological Setting Plan of Basilicata Basin Authority and the IFFI catalog (Inventory of Landslide Phenomena in Italy), more recent studies, devoted to mapping gravitational movements, are available [
28,
31]. As reported by these authors, the area struck by the landslide of December 2013 is characterized by many geomorphological features related to the presence of pre-existing mass movements of different typologies and ages. The most relevant morphological evidence is a large, concave area extending from the upper part of the slope (where the village is settled) to the Bradano River plain. This area reflects the presence of a deep, large and old landslide, now modeled by human activity, erosion and other gravitational processes. Within this large landslide, a number of scarps, counterscarps and minor and more recent instability events can be identified, including slides and flows, reflecting the diffuse gravitational instability characterizing this slope.
Figure 3.
The 3 December Montescaglioso landslide. In the insets, field evidences of deformation are reported: (1) graben-type feature in the upper sector of the slope; (2) main scarp; (3) set of scarps and counterscarps; (4) landslide pond at the confluence between the Cinque Bocche and Capo Iazzo creeks.
3. Results: Surface Deformation Retrieval with Satellite SAR Images
Following the official request of the DPC, the Italian SAR constellation COSMO-SkyMed (CSK) was tasked to acquired Stripmap high resolution X-band SAR images with an effective revisiting time of eight days. Stripmap CSK images have a ground resolution of 3 × 3 m
2 and a swath extension of 40 × 40 km
2. Moreover, the Italian Space Agency (ASI) made available two datasets of archive images, acquired along both ascending and descending geometries (
Table 1). The ascending dataset includes 30 pre-event images (acquired from 30 January 2012 to 03 December 2013) and three post-event images (18 December 2013 to 11 January 2013); while the descending dataset includes 11 pre-event images (captured in the period from 21 March 2012 to 14 May 2013) and five post event images (12 December 2013 to 13 January 2014).
The purpose of the analysis of satellite radar data was twofold:
- (1)
Detect and record any pre-event deformation in and around the village of Montescaglioso, through the use of advanced InSAR techniques, suitable for mapping slow deformation phenomena (from mm up to a few cm per year);
- (2)
Detect and measure any surface changes produced by the 3 December landslide, using amplitude-based method (i.e., exploiting the correlation of the speckle pattern of two images, pre- and post-failure), suitable for mapping much faster displacements.
To achieve these targets, both amplitude and phase values of the available SAR images were exploited and processed, through the application of SqueeSAR [
4] and Speckle Tracking [
32] techniques, respectively. In the following sections, we describe the data processing steps and report the main findings.
Table 1.
List of COSMO-SkyMed (CSK images) acquired for the landslide analysis. In bold post-event images.
Table 1.
List of COSMO-SkyMed (CSK images) acquired for the landslide analysis. In bold post-event images.
| Date and Time of Acquisition | Satellite | Geometry | Look | Angle |
|---|
| 20120130_043654 | SAR2 | Ascending | Right | 27-31 |
| 20120419_043615 | SAR2 | Ascending | Right | 27-31 |
| 20120521_043554 | SAR2 | Ascending | Right | 27-31 |
| 20120606_043547 | SAR2 | Ascending | Right | 27-31 |
| 20120708_043527 | SAR2 | Ascending | Right | 27-31 |
| 20120724_043521 | SAR2 | Ascending | Right | 27-31 |
| 20121028_043435 | SAR2 | Ascending | Right | 27-31 |
| 20121113_043429 | SAR2 | Ascending | Right | 27-31 |
| 20121129_043420 | SAR2 | Ascending | Right | 27-31 |
| 20121215_043414 | SAR2 | Ascending | Right | 27-31 |
| 20121231_043403 | SAR2 | Ascending | Right | 27-31 |
| 20130116_043355 | SAR2 | Ascending | Right | 27-31 |
| 20130217_043341 | SAR2 | Ascending | Right | 27-31 |
| 20130217_043341 | SAR2 | Ascending | Right | 27-31 |
| 20130305_043337 | SAR2 | Ascending | Right | 27-31 |
| 20130321_043328 | SAR2 | Ascending | Right | 27-31 |
| 20130406_043321 | SAR2 | Ascending | Right | 27-31 |
| 20130422_043315 | SAR2 | Ascending | Right | 27-31 |
| 20130508_043309 | SAR2 | Ascending | Right | 27-31 |
| 20130524_043302 | SAR2 | Ascending | Right | 27-31 |
| 20130609_043256 | SAR2 | Ascending | Right | 27-31 |
| 20130625_043248 | SAR2 | Ascending | Right | 27-31 |
| 20130711_043241 | SAR2 | Ascending | Right | 27-31 |
| 20130812_043229 | SAR2 | Ascending | Right | 27-31 |
| 20130828_043223 | SAR2 | Ascending | Right | 27-31 |
| 20130929_043212 | SAR2 | Ascending | Right | 27-31 |
| 20131015_043208 | SAR2 | Ascending | Right | 27-31 |
| 20131116_043155 | SAR2 | Ascending | Right | 27-31 |
| 20131202_043151 | SAR2 | Ascending | Right | 27-31 |
| 20131203_043150 | SAR2 | Ascending | Right | 27-31 |
| 20120321_170015 | SAR3 | Descending | Right | 27-31 |
| 20120609_165934 | SAR3 | Descending | Right | 27_31 |
| 20121209_165803 | SAR1 | Descending | Right | 27-31 |
| 20121225_165755 | SAR1 | Descending | Right | 27-31 |
| 20130110_165744 | SAR1 | Descending | Right | 27_31 |
| 20130126_165737 | SAR1 | Descending | Right | 27-31 |
| 20130211_165733 | SAR1 | Descending | Right | 27-31 |
| 20130227_165724 | SAR1 | Descending | Right | 27-31 |
| 20130315_165718 | SAR1 | Descending | Right | 27_31 |
| 20130331_165713 | SAR1 | Descending | Right | 27-31 |
| 20130514_165649 | SAR4 | Descending | Right | 27-31 |
| 20131218_043142 | SAR2 | Ascending | Right | 27-31 |
| 20131226_043142 | SAR1 | Ascending | Right | 27-31 |
| 20140111_043134 | SAR1 | Ascending | Right | 27-31 |
| 20131212_165532 | SAR1 | Descending | Right | 27-31 |
| 20131220_165529 | SAR2 | Descending | Right | 27-31 |
| 20131228_165529 | SAR1 | Descending | Right | 27-31 |
| 20140105_165525 | SAR2 | Descending | Right | 27-31 |
| 20140113_165521 | SAR1 | Descending | Right | 27-31 |
3.1. Pre-Event Deformation Analysis Using SqueeSAR Data
Immediately after the event, ASI made CSK datasets available. CSK archive images were processed to retrieve information about pre-event surface displacement phenomena. Ground displacement data were obtained using the SqueeSAR technique. SqueeSAR is a second generation PSInSAR algorithm [
4], which was the first of the PSI techniques. Methods belonging to this family are based on the processing of long temporal series of co-registered, multi-temporal SAR images acquired over the same target area from the same acquisition geometry. The main idea behind these methods is to identify pixels exhibiting good phase coherence during the entire observation period, via proper statistical analyses. These coherent points are usually referred to as Permanent (or Persistent) Scatterers (PS) [
5,
33]. PS usually correspond to rocky outcrops, boulders, buildings and anthropic structures in general. Using this sparse grid of point-like targets, PSI techniques are able to statistically identify, quantify and remove atmospheric noise from SAR phase data and create a history of motion for each target.
Unlike the PSInSAR approach, the SqueeSAR technique allows the measurement of surface displacements by exploiting both point-wise coherent scatterers (
i.e., the PS) and partially coherent Distributed Scatterers (DS). DS correspond to groups of pixels sharing similar radar returns. They typically correspond to homogeneous, low reflectivity areas, such as scattered outcrops, bare soil, debris-covered zones and non-cultivated lands. SqueeSAR results provide a significant increase in spatial density of measurement points, compared to PSI techniques, especially over non-urban areas [
34,
35,
36,
37,
38], allowing a much better understanding of possible ground deformation phenomena threatening a specific area of interest.
The SqueeSAR approach was applied to the two available datasets of SAR images for the area of Montescaglioso. Given the limited number of available images and their uneven temporal distribution, the processing of the descending dataset did not allow the extraction of reliable surface deformation data. However, the SqueeSAR algorithm applied to the ascending data-stack provided valuable information on ground movements before the event (
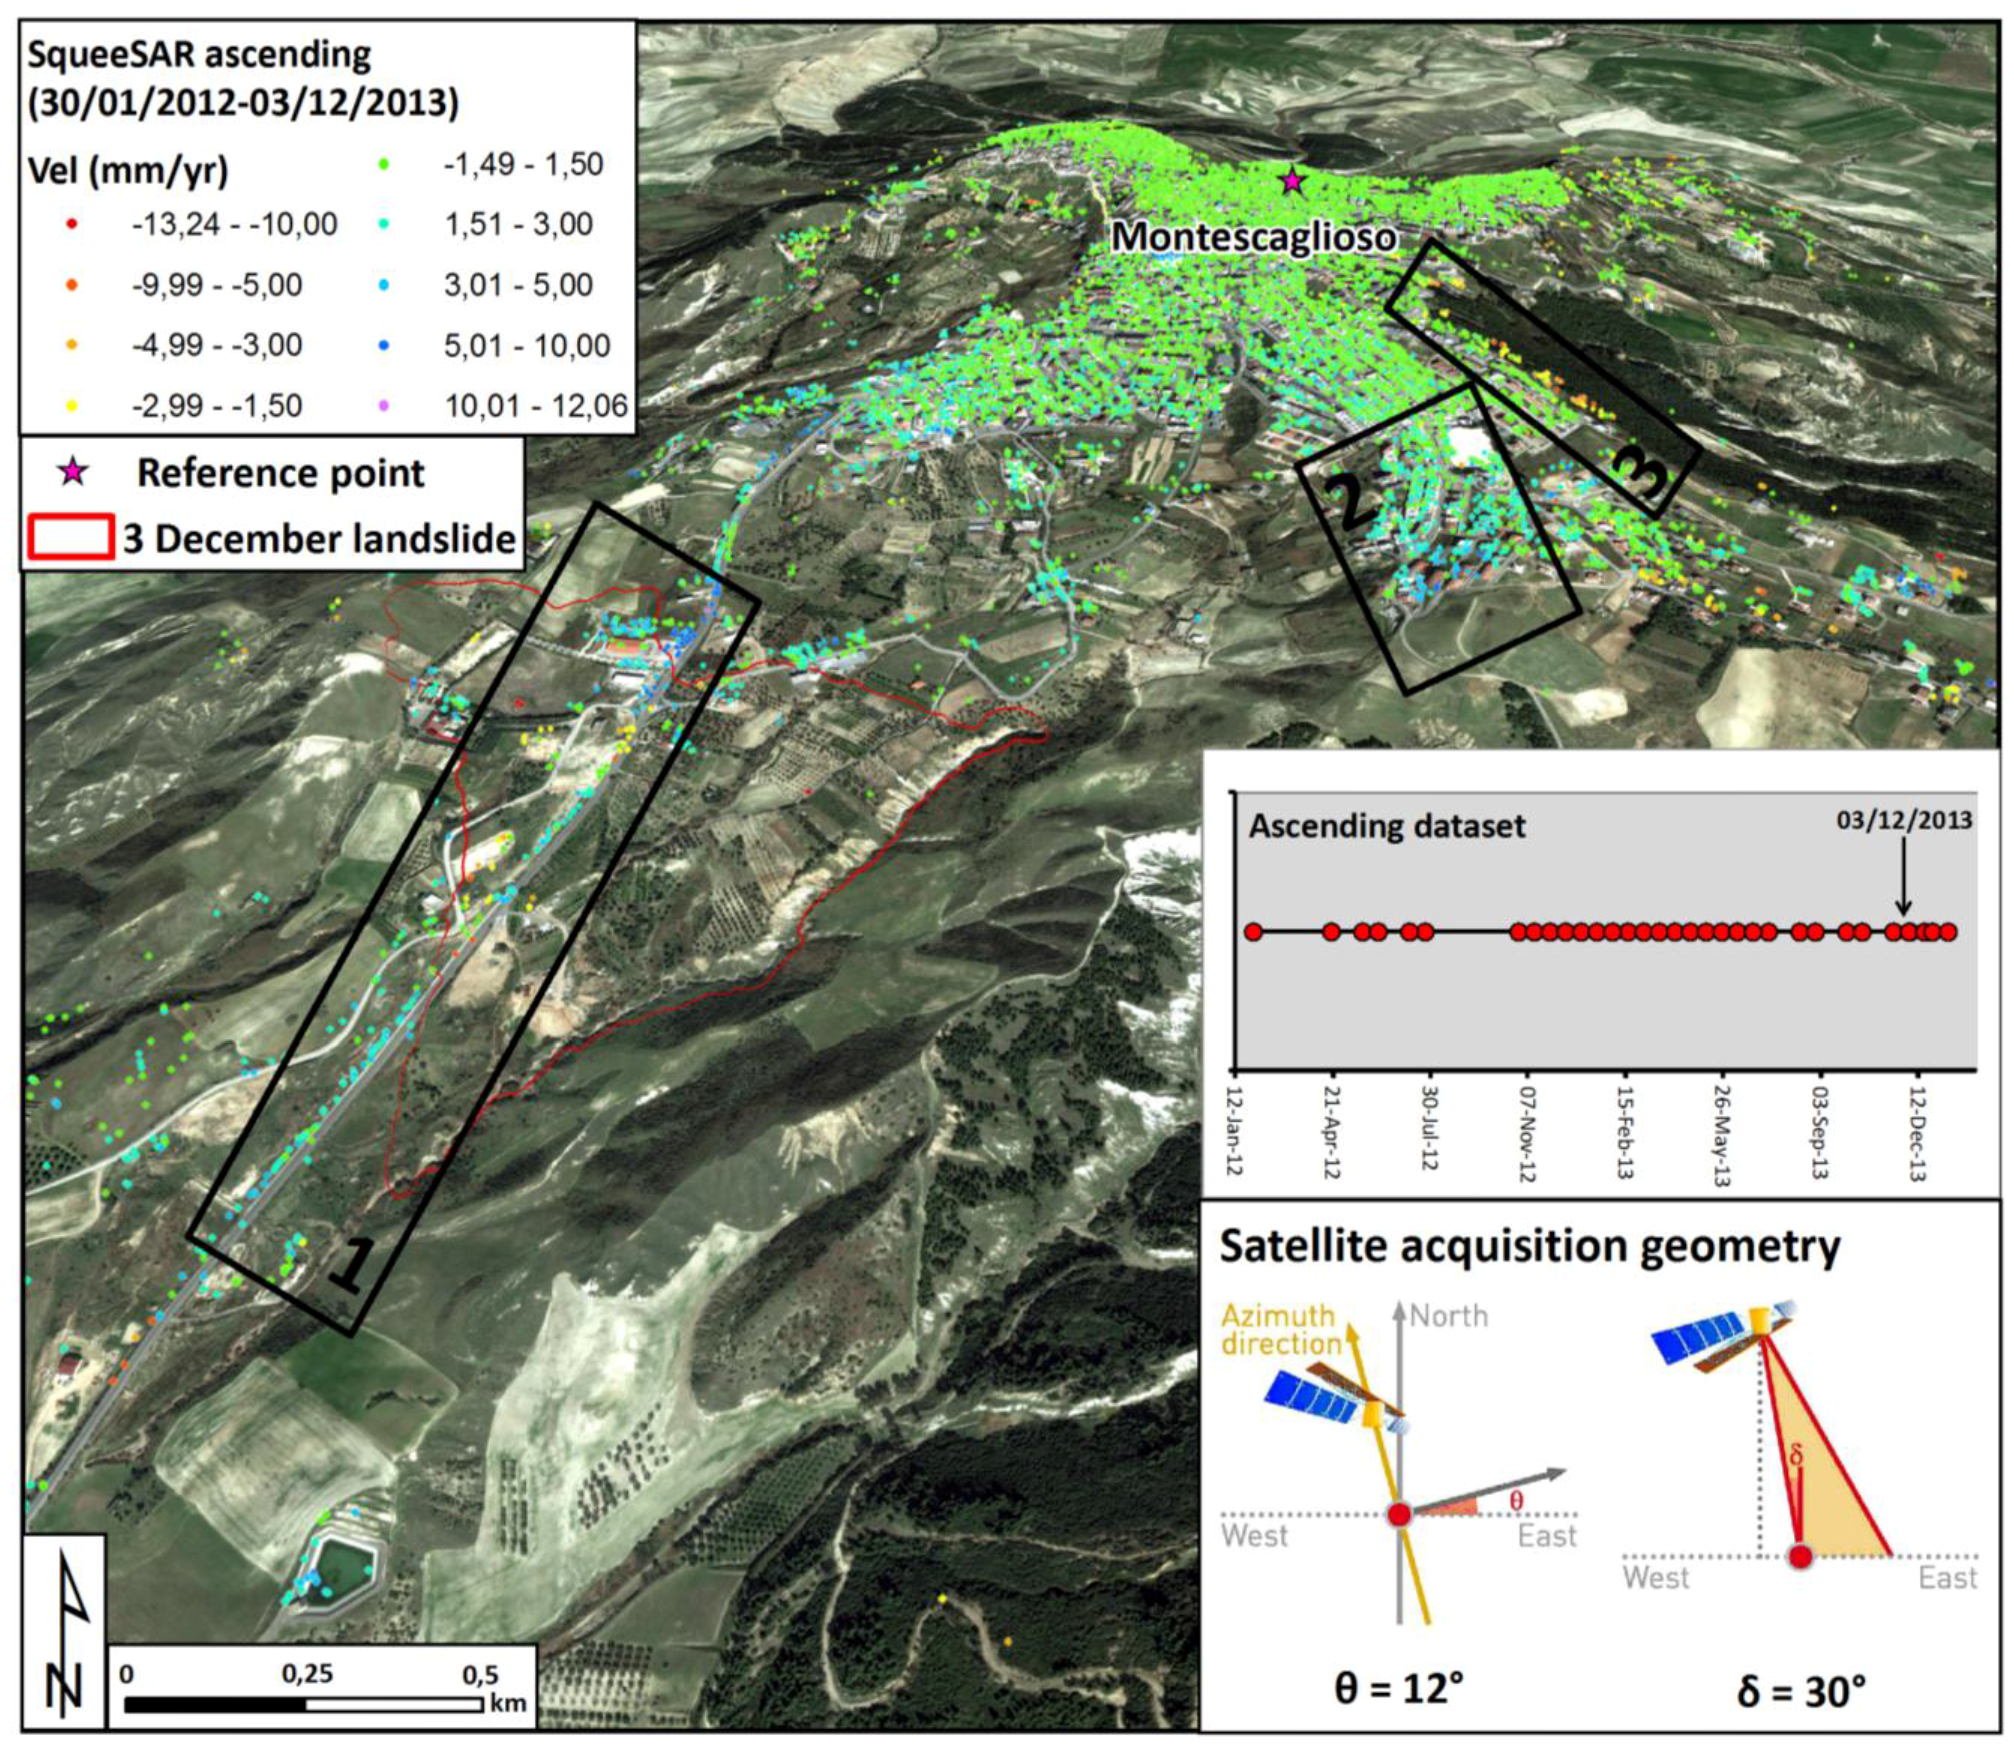
Figure 4). PS and DS were detected and classified according to their average velocities. Positive values correspond to motion toward the satellite; negative values correspond to motion away from the satellite (in mm/year). Displacement rates were calculated relative to a reference point located on a stable sector of the urban fabric of Montescaglioso. It should be noted that, for each PS and DS, the mean velocity and the displacement temporal series are the projection, along the sensor Line Of Sight (LOS), of the 3D displacement vector affecting the target.
The hilltop village of Montescaglioso shows very low deformation rates, ranging between −1.5 and 1.5 mm/yr, indicating relatively stable ground conditions (green to light blue regions). Nevertheless, SqueeSAR results highlight the presence of active movements in the southern (inset 2 of
Figure 4) and eastern sector (inset 3 of
Figure 4) of the village. Taking into account the acquisition geometry (ascending) and the slopes orientation (SW and NE facing slope, respectively), deformation data are consistent with the occurrence of gravitational movements marginally affecting the village of Montescaglioso.
Moreover, SqueeSAR results highlight the presence of active movements in the SW slope of the Montescaglioso village (inset 1 of
Figure 4), as well as sliding phenomena, in the order of a few mm/yr, along the “Piani Bradano” road. The highest deformation rates (dark blue regions) were recorded in the area between the supermarket and the Cinque Bocche creek (see also
Figure 5). Here, velocity values range between 5 and 10 mm/yr, with peaks up to 12 mm/yr. In this case too, considering the acquisition geometry and the orientation of the slope, the measured deformation rates are consistent with the occurrence of pre-existing gravitational movements over a large sector of the slope affected by the 3 December 2013 landslide. It is worth remarking that this specific sector of the slope was the origin of the first phase of the sliding event.
Figure 4.
Pre-event SqueeSAR results (ascending geometry) for the area of Montescaglioso.
Figure 4.
Pre-event SqueeSAR results (ascending geometry) for the area of Montescaglioso.
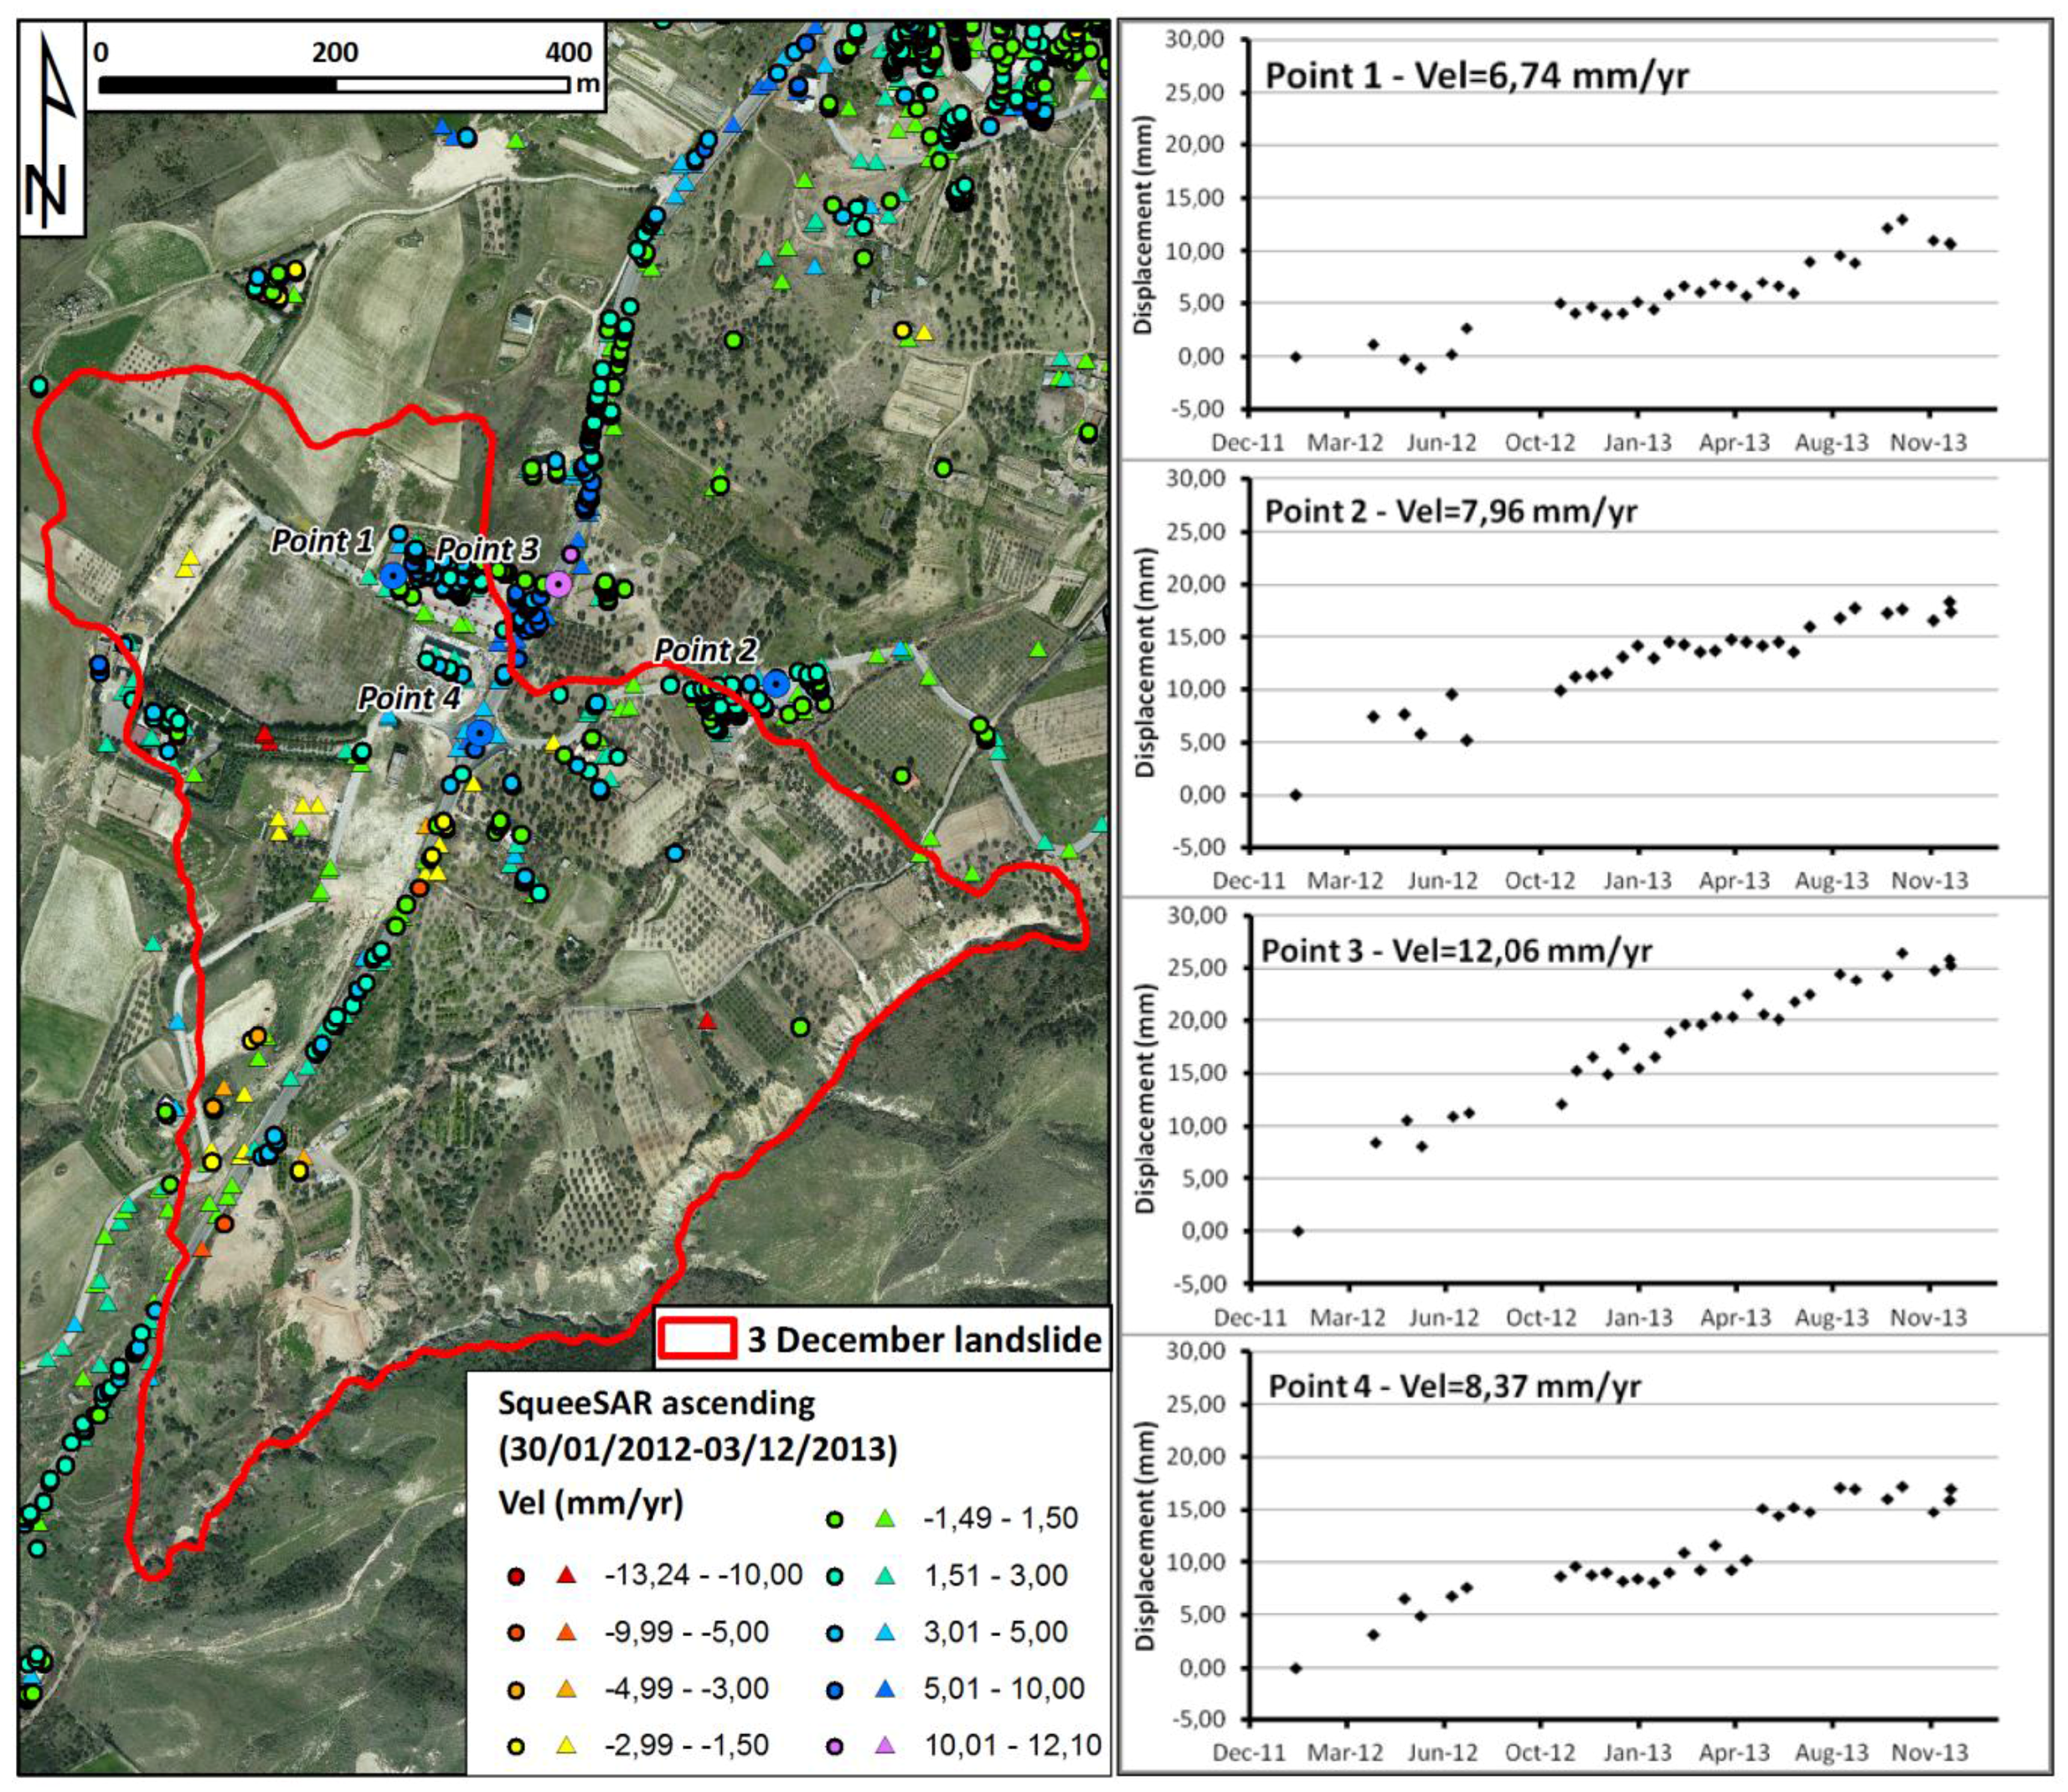
SqueeSAR analysis provides also, for each measurement point, a time series of deformation, which describes the evolution of displacement over the entire period. Each measurement of the time series corresponds to a single satellite acquisition. A time series shows the temporal pattern of the deformation, highlighting non-linear movements, seasonal trends, ground acceleration and any potential changes occurring during the analyzed period. Four measurement points have been selected and corresponding deformation time series are presented in
Figure 5. Points are located in the most critical areas,
i.e., the areas characterized by the highest deformation velocities, and have been selected to identify the presence of potential precursor movements and to evaluate changes in deformation rates. Points 1 and 2 correspond to the roofs of the supermarket and the artisan warehouse of
Figure 1, respectively. As remarked before, both of these buildings have been severely affected by the 3 December landslide. Point 3 and point 4 are located along the Piani Bradano road, and straddle the landslide boundary. Analysis of deformation time series highlights, for all of them, an almost linear deformation trend. Beside a few minor oscillations, no significant accelerations before the 3 December event can be observed.
Figure 5.
Pre-event SqueeSAR results for the area of Montescaglioso village.
Figure 5.
Pre-event SqueeSAR results for the area of Montescaglioso village.
3.2. Event Deformation Analysis Using Speckle Tracking Analysis
Any radar image can provide both amplitude and phase information. The amplitude-based Rapid Motion Tracking (RMT) is a recently developed technique for tracking movements exhibiting displacement rates exceeding those observable with SAR Interferometry [
9,
24]. By tracking amplitude features in multi-temporal SAR data, it is possible to extract displacement time series, in a way similar to what InSAR algorithms provide, working on phase data. The precision of techniques based on cross-correlation of amplitude data (
i.e., based on speckle tracking) is in the order of 1/50th–1/20th of image pixel [
39], depending on the coherence level and the number of pixels inside the window used for the analysis.
Local image offsets can be estimated by processing two SAR scenes acquired at different times, wherever nearly identical features are visible in both acquisitions. Standard cross-correlation analysis is performed over a set of partially overlapping image patches. The position of the maximum of the cross-correlation function for each patch provides the estimation of the offset, i.e., the component of the displacement vector affecting along the range and the azimuth coordinates. The value of the ratio between the maximum of the (bidimensional) cross-correlation function and those of other local maxima depends on the signal-to-noise ratio (SNR) and is a proxy for the reliability of the estimation.
In order to increase the SNR in the estimation of the displacement field generated by the landslide, we decided to carry out an incoherent average of the available SAR scenes acquired before the event. More precisely, the cross-correlation analysis, for both ascending and descending data, was performed using the multi-image reflectivity (MIR) map of the CSK scenes acquired before the event and the first CSK image acquired after 3 December. In doing so, it was possible to significantly decrease the level of speckle noise, at least for pre-event data, and increase the quality of the results.
We applied this technique on Stripmap COSMO-SkyMed SAR acquisitions, using patches of 50 × 50 pixels (corresponding to about an area of about 100 × 100 m in azimuth and ground range). Estimated error bars were lower than 10 cm [
39], more than an order of magnitude larger than what is obtained by applying the SqueeSAR approach to phase data. However, RMT can be successfully applied to areas affected by high displacement rates, which would appear as completely uncorrelated in any SAR interferogram. Moreover, with respect to interferometry, which is capable of retrieving only 1D displacement data (along the satellite line of sight) over coherent areas, RMT provides additional information on the displacement vector. In fact, RMT provides 2D rather than 1D displacement fields, since measurements are estimated via offset estimation both along the range and the azimuth (orbital) direction, for each image patch. RMT is capable of measuring movement from tens of centimetres to tens of metres in both the line-of-sight and the azimuth (north-south) directions [
24].
For the Montescaglioso landslide, the availability of multi-temporal SAR data-stacks acquired along both ascending and descending orbits made it possible to estimate the three components of displacement vector (East-West, Up-Down and North-South), by properly combining RMT data from the two acquisition geometries (
Figure 6). The estimation was performed by inverting the linear system of equations describing the two acquisition geometries (line of sight and azimuth direction):
where
d is the unknown 3D displacement vector (East, North, z),
drg_asce,
daz_asce,
drg_desce,
daz_desce, are the two pairs of offset values estimated along ascending and descending data, respectively;
urg_asce and
urg_desce are unit vectors describing the satellite line of sight for the two acquisition geometries and
θasce and
θdesce are the angles between the satellite orbits and the NS direction (as shown in
Figure 4 for the ascending dataset).
Results shown in
Figure 6 provide a quantitative assessment of the extent and the amount of ground displacement associated to the event occurred on 3 December 2013.
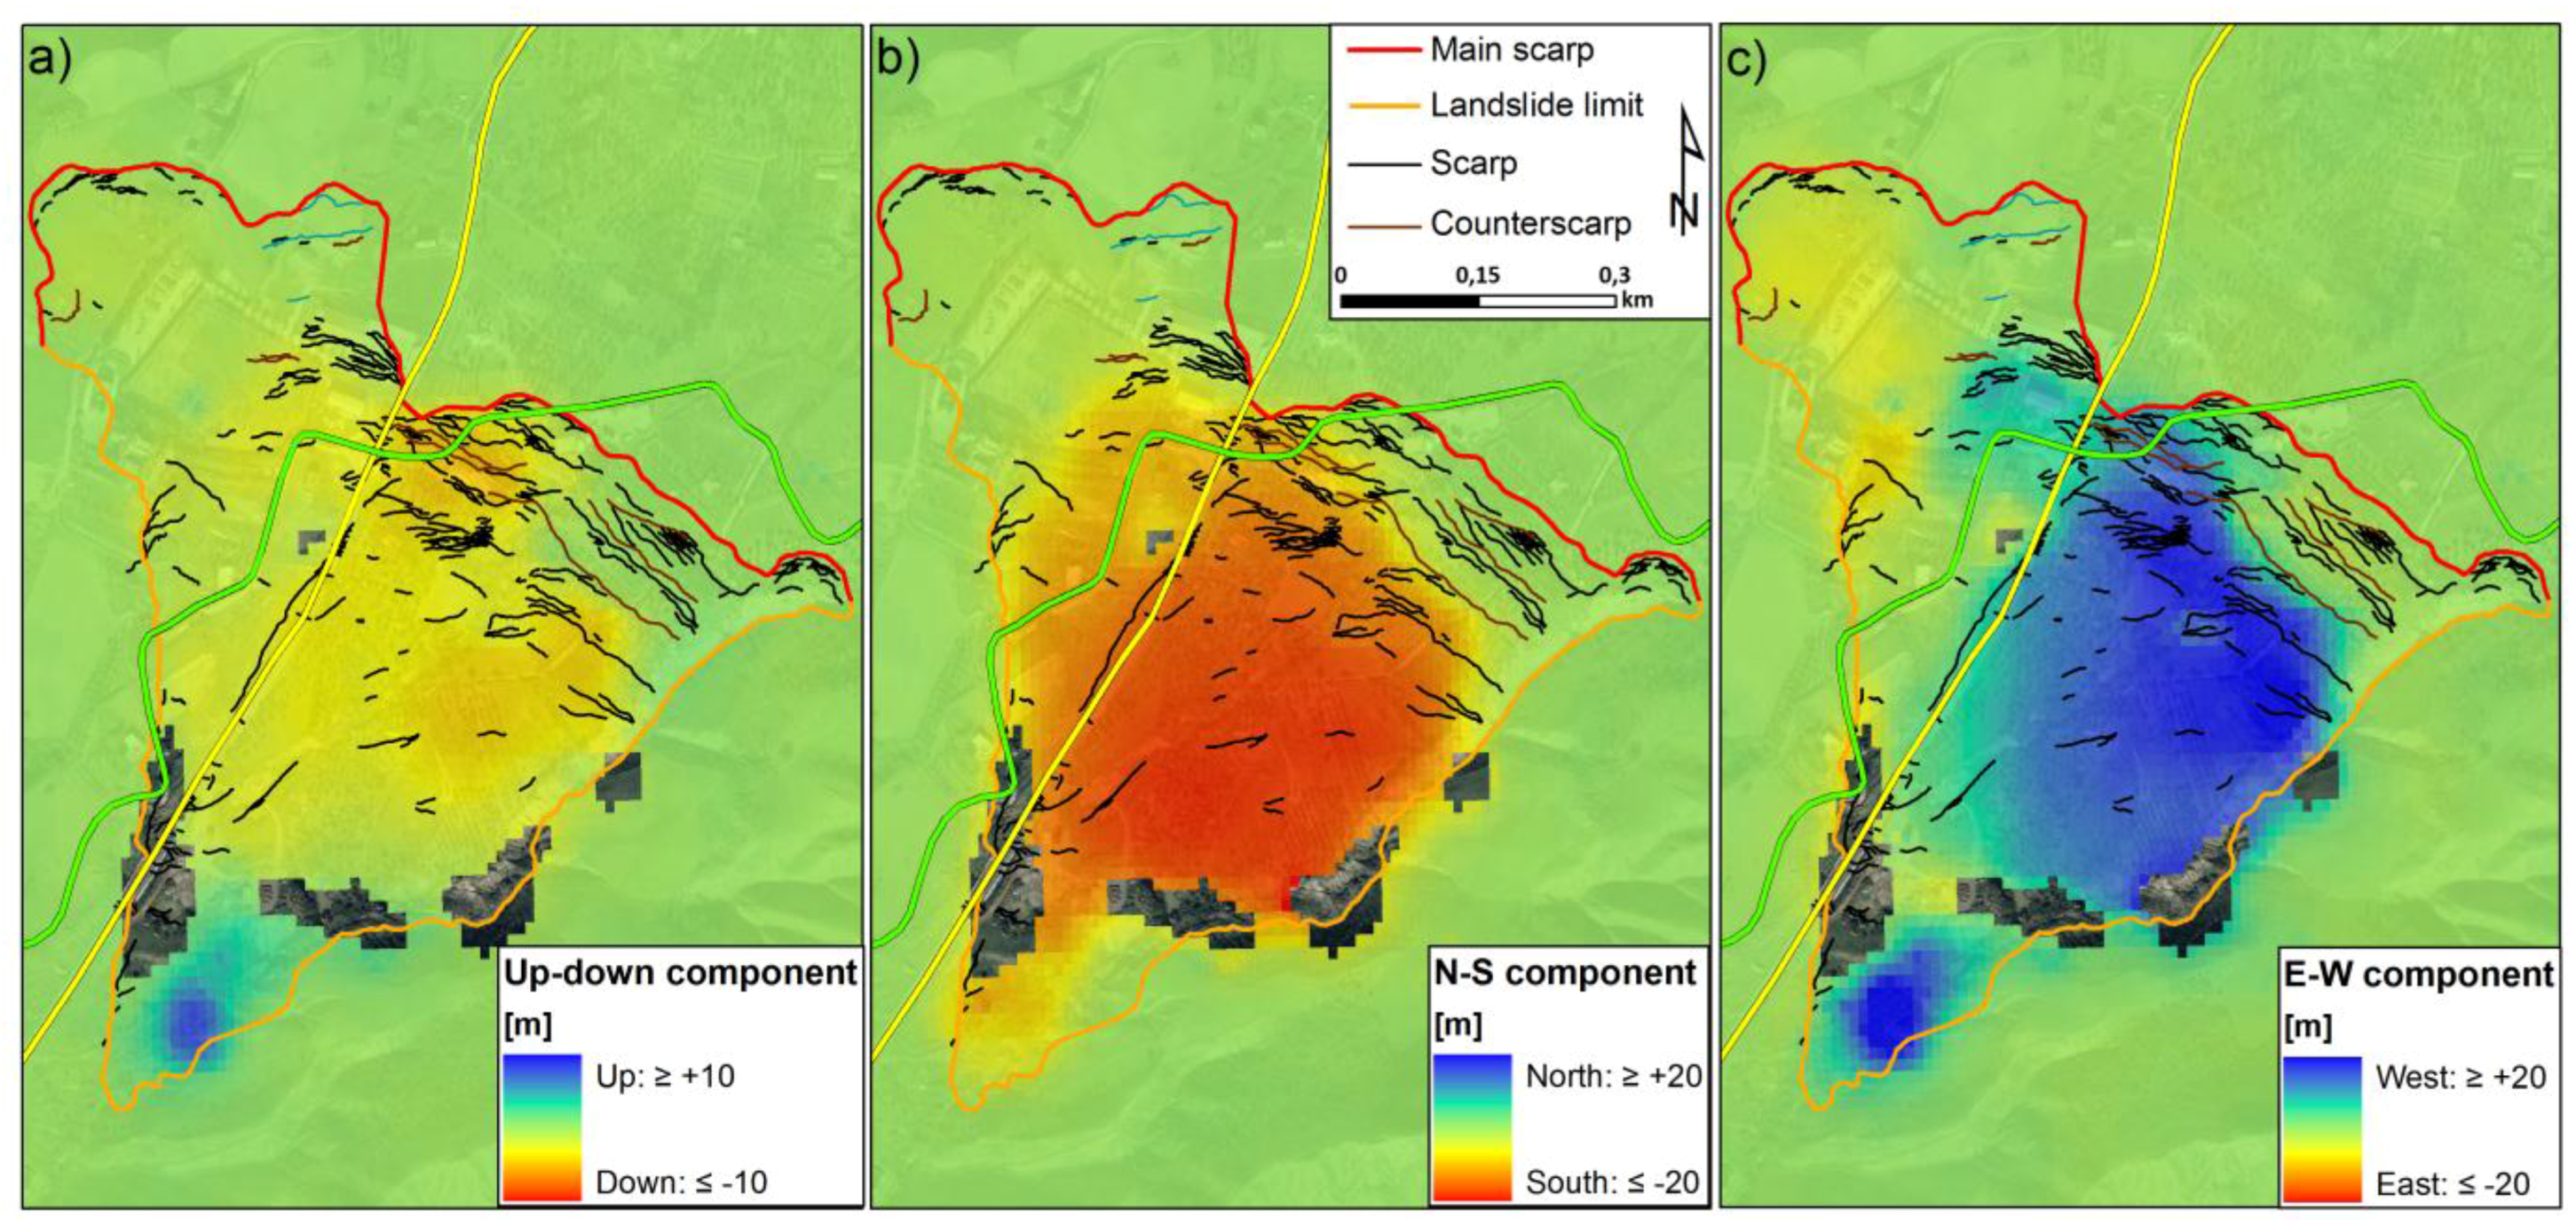
Figure 6.
3D deformation data related to the 3 December 2013 event in Montescaglioso. (a) Up-down, (b) North–South, and (c) East-West components of the deformation vector retrieved by Rapid Motion Tracking. Colored lines correspond to the main roads.
Figure 6.
3D deformation data related to the 3 December 2013 event in Montescaglioso. (a) Up-down, (b) North–South, and (c) East-West components of the deformation vector retrieved by Rapid Motion Tracking. Colored lines correspond to the main roads.
Figure 7.
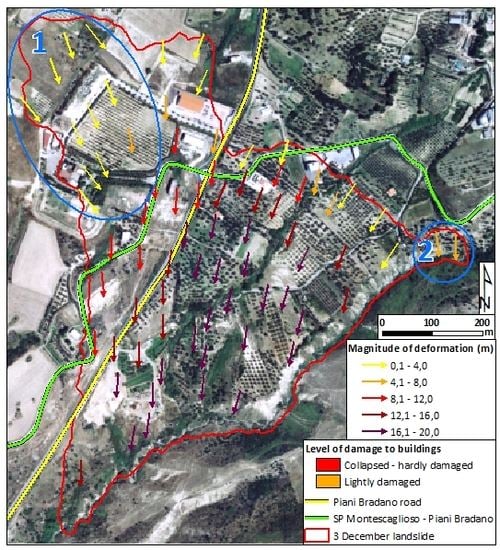
Magnitude and direction of the 3D deformation field of the 3 December 2013 landslide on the south-west slope of Montescaglioso. The map shows also the main road network and the level of damage to buildings. Secondary landslides are circled in blue.
Figure 7.
Magnitude and direction of the 3D deformation field of the 3 December 2013 landslide on the south-west slope of Montescaglioso. The map shows also the main road network and the level of damage to buildings. Secondary landslides are circled in blue.
As already reported by [
28], ground deformation has dominant SW components, with values ranging between 8 and 12 m for large sectors of the landslide. Surface deformation generally increases moving towards Capo Iazzo creek, which is the left limit of the landslide, with values up to 18–20 m for both NS and EW components. Vertical displacements are generally smaller than planimetric components, ranging from 2 to about 3 m, with a maximum of 5 m in the upper part of the slope, where most of the damages occurred. The deposit area is clearly visible in the lower part of the landslide, with an uplift of about 7–8 m.
The analysis of the 3D deformation field of the landslide allows one to identify the magnitude and direction of the displacement field (
Figure 7). The main landslide event has a main south-southwest direction of movement, with a minor south component close to its right limit.
Two smaller landslides have been detected in the upper part of the slope: the first NW of the collapsed supermarket (ellipse 1 in
Figure 7) with a main SE movement direction likely occurred during the retrogressive movements of the landslide, as the rupture surface extended towards the divide. A second event, even smaller, can be detected in the north-eastern edge of the main landslide (circle 2 in
Figure 7), with a dominant SSE movement direction. This minor event involves the easternmost sector of the scarp of the main landslide.
4. Discussion
In this work, we applied an integrated SAR analysis aimed at extracting as much information as possible about the slope instability phenomena affecting the area of interest. Considering the 3 December Montescaglioso landslide as the main event to be investigated, the aim of this work was to test and assess the capability of CSK SAR images to reliably detect, map and measure pre-event and event movements using SqueeSAR and RMT techniques. The main idea underpinning this synergistic approach is that a landslide, depending on its surface features, kinematics and orientation with respect to the SAR sensor, may require different forms of analysis for its investigation. Our approach was designed to retrieve useful information about distinct displacement regimes, ranging from small to high deformation rates, analyzing high resolution X-band SAR imagery.
SqueeSAR data have provided a synoptic view of the pre-event deformation processes affecting the area of Montescaglioso, allowing the identification of stable and unstable zones. In general, InSAR analyses can provide good results for slow landslides affecting large areas, where the vegetation coverage is limited. The potential and the limitations of InSAR data for slope instability detection are mainly related to the different landslide typologies and their kinematics. Fast-moving landslides, like the Montescaglioso event, are characterized by rapid movement, often triggered by heavy rain. InSAR data can provide useful information about pre-event movements, often characterized by low displacement rates (few cm/yr) persisting over long time periods. This deformation regime is quite different to failure events, which occur suddenly and may produce ground displacements of several meters. As discussed by [
11], the practical applicability of SAR interferometry is usually limited to extremely slow to very slow movements [
19] and to “coherent” landslides,
i.e., with little internal deformation (e.g., translational slides, deep-seated phenomena).
Fast mass movements, like the Montescaglioso landslide, with intermittent deformation velocity (e.g., debris and earth flows triggered by heavy rainfall) are extremely difficult to be monitored by means of satellite InSAR data, at least using satellite sensors available today. Indeed, during phase unwrapping, ambiguity related to the number of cycles (2π) to be added to the “wrapped” (modulo-2π) interferometric phase can remain unsolved or underestimated (it is the so called “aliasing effect”). The probability of phase aliasing depends on the spatial gradient of the displacement field, the kinematics of the deformation, the PS/DS spatial distribution and the temporal sampling of the acquisitions (
i.e., the satellite revisiting time). Aliasing effects are limited to a quarter of the wavelength (λ/4) the maximum differential displacement (along the satellite line of sight) between two neighboring PS and two consecutive SAR acquisitions [
40,
41]. If we take into account just the radar wavelength and the satellite revisiting time, the maximum displacement rates that can be estimated are: about 15 cm/yr for ERS/Envisat (C-band, 5.6 cm wavelength, 35-day repeat cycle), 21 cm/yr for Radarsat (C-band, 24-day repeat cycle), 25 cm/yr for TerraSAR-X (X-band, 3.1 cm wavelength, 11-day revisiting time), and 45 cm/year for ALOS-1 (L-band, 23 cm wavelength, 46-day repeat cycle) [
41]. In the specific case of CSK data (λ = 3.1 cm and a revisiting time of 16 days), the maximum differential displacement that can be measured without aliasing, between two successive acquisitions, is 8 mm corresponding to a displacement rate of about 16 cm/yr.
The Montescaglioso landslide is a rapid one, which exhibits complex deformation patterns. Fast-moving and/or episodic landslides may be more successfully observed using amplitude-based techniques, as movements induce significant changes in the surface features (and therefore in the radar backscatter signature), leading the interferometric approach to partially fail. In case of sliding areas characterized by fast and/or intermittent kinematics and/or areas affected by phase decorrelation phenomena, speckle-tracking procedures based on amplitude data are a somewhat natural complement to InSAR techniques. This method is particularly suitable when ground motion between two radar acquisitions is too large to be measured by radar interferometry (local ground displacement of a few meters).
In this work, satellite results were compared successfully with
in-situ investigation (GPS survey, geomorphological analysis and field analysis), and the approach was shown to be effective for analyzing ground deformation in the area. Topographic survey with RTK GPS has been coupled with complementary field surveys to account for those situations when the GPS acquisition errors were too high for an accurate object location, and the receiving antenna could not establish good connection with satellites (
i.e., presence of physical objects like tree canopy).
In-situ investigations were mainly devoted to survey the landslide boundary and main scarp. This survey was essential to validate SAR measurements. The comparison between satellite results and
in-situ investigation is shown in
Figure 6, where a good agreement can be found between 3D deformation data retrieved through Rapid Motion Tracking and the landslide scarp and boundary as surveyed through GPS and field work.
Moreover, field surveys highlight how the sector of the slope affected by deformation phenomena before the landslide has experienced, over time, the impact of a progressive and invasive urbanization, which heavily modified the natural hydrographic network. For instance, in order to accommodate the supermarket (collapsed on 3 December), the natural hydrographic network was modified and dammed, with the creation of an artificial lake, while the construction of the “Piani Bradano” road partially blocked the flow of surface water, limiting the natural drainage and causing a potentially dangerous increase of the weight of the slope during persistent rainfall.
Field investigations are complementary to satellite data, as they allow gathering useful information for the validation of SAR measurements. Dealing with complex phenomena like landslides, the fundamental aspect is the design of integrated analyses, encompassing remote sensing information (high resolution SAR and optical scenes), traditional monitoring instruments (e.g., GPS), detailed data on topography (like those provided by LIDAR survey) and field investigations. The synergistic use of these techniques provides a wide range of information and is strategic for landslide analysis in operational scenarios. In the future, the use of more sophisticated space-borne SAR sensors, with large swaths and short repeat cycles, will allow more effective monitoring activities.
5. Conclusions
In this work, we reported the main findings of a study on a large, rapid landslide occurred on 3 December 2013 in Montescaglioso (Southern Italy). The event, triggered by prolonged rainfalls, created significant damage to buildings and local infrastructure. The area where the landslide occurred is characterized by the presence of relict landslides. The natural drainage network was heavily modified by the construction of buildings (in particular, a supermarket) and of the road “Piani Bradano”, which connects the Montescaglioso village to the bottom of the Bradano valley.
Since this landslide exhibited a quite complex displacement pattern, we used a synergistic approach, similar to what is becoming a standard for analysis of deformations affecting open-pit mining areas [
24], based on the analysis of both amplitude and phase SAR data, acquired by the Italian COSMO-SkyMed constellation. Both pre-event and event movements were estimated using SAR acquisitions acquired along both ascending and descending satellite orbits.
SqueeSAR analysis has been used successfully to map the pre-event deformation field, revealing movements in the order of a few mm/yr in the slope sector affected by the landslide of December 2013. Maximum displacement rates up to 10–12 mm/yr have been measured along the “Piani Bradano” road and in the area surrounding a supermarket that collapsed due to the landslide.
RMT proved to be a reliable method to map spatial patterns of deformation produced by episodic or rapid sliding events. RMT data have shown that ground displacement values associated with the main Montescaglioso landslide have a dominant SSW component, with values exceeding 10 m and with local peaks of 20 m in the central and deposit areas. Two smaller landslides with a dominant SSE direction have been detected in the upper part of the slope, likely occurring after the main event.
This paper demonstrates that this complementary approach, based on the synergistic exploitation of phase and amplitude SAR data, can become a powerful tool for landslide investigation, allowing the detection of slow, precursory deformation patterns as well the retrieval of full 3D surface displacement fields caused by large, rapid-moving landslides.
Although this study focused on a single landslide within a particular pattern of deformation that occurred in a specific environment, characterized by a quite peculiar morphology, material involved, and urbanization and vegetation cover, we deem that similar approaches, based on the exploitation of both phase and amplitude of satellite SAR data, can be applied successfully for studying many other sliding areas. Hopefully, in the future, the increased number of available satellite data sources, characterized by short revisiting times and high spatial resolution, will provide key information layers for decision support systems and early-warning programs on a regional and national scale.


 ,
, 


