1. Introduction
The Kīlauea volcano, one of the youngest and most active volcanoes in the world, showed unusual activity beginning on 21 April 2015. Kīlauea’s summit inflated at an abnormal rate, and the Halema‘uma‘u crater began to fill with a rising lava lake. The rising lava finally reached the floor of the Halema‘uma‘u crater on 28 April, and these conditions continued for approximately two weeks until 10 May 2015. After overflowing for approximately 10 days, the lava lake began to drop along with a summit deflation starting on 10 May. Seismic activity in the southern portion of Kīlauea’s summit increased sharply on 14 May and a tiltmeter began to tilt rapidly from the static state. In other words, the slope of the ground began to change due to magma dynamics beneath the southern part of Kīlauea’s summit. All of these activities were interpreted as an early sign of an imminent magma intrusion into the southern portion of the Kīlauea caldera (U.S. Geological Survey reports;
http://hvo.wr.usgs.gov/volcanowatch).
Interferometric Synthetic Aperture Radar (InSAR) is the most powerful technique for the measurement of surface displacements using imaging-based approaches. It has been used to investigate enormous volcanic activities in recent decades [
1,
2,
3,
4,
5,
6,
7]. To map realistic surface motions, three-dimensional (3D) components of surface deformation have been retrieved in recent studies [
6,
8,
9,
10]. Several methods have been adopted to solve the 3D measurement problem, but weak resolving power in the along-track direction is the main obstacle for retrieving precise 3D displacements in most approaches.
The Multiple Aperture Interferometry (MAI) technique uses split-beam InSAR processing to provide precise measurements in the along-track direction [
11,
12], and this technique has opened a new chapter in SAR interferometry. The measurement accuracy of 3D displacements has been markedly improved by the MAI method, which is approximately two- to three-fold more accurate than the offset-based approach [
10,
12,
13]. Using the MAI method, 3D measurements have been made of various geologic phenomena [
6,
14,
15]. Recently, 3D measurements using multi-temporal data stacking was introduced to further improve the measurement accuracy, allowing sub-centimeter accuracy in the 3D measurements to be achieved [
16].
In this study, surface deformation associated with the recent volcanic activity of the Kīlauea volcano, Hawai‘i, was explored by conventional InSAR and MAI techniques using a multi-temporal COSMO-SkyMed X-band SAR data set. The 3D components of the surface deformation were calculated by integrating the multi-stacked InSAR and MAI interferograms, obtained from ascending and descending orbits, respectively. Compared to the C- and L-band SAR system, the X-band SAR is difficult to apply in the MAI observation because the X-band system is affected by relatively large temporal decorrelation. Despite the potential risks of temporal decorrelation associated with the X-band system, the powerful capability of data acquisition from COSMO-SkyMed enables us to measure the precise MAI deformation using the multi-temporal stacking approach [
17,
18].
Model parameter estimations of the magma source were performed using the 3D components of the surface deformation. Surface displacements during periods of unrest have been used to determine the geometries and volume changes of magma bodies [
2,
7,
19,
20,
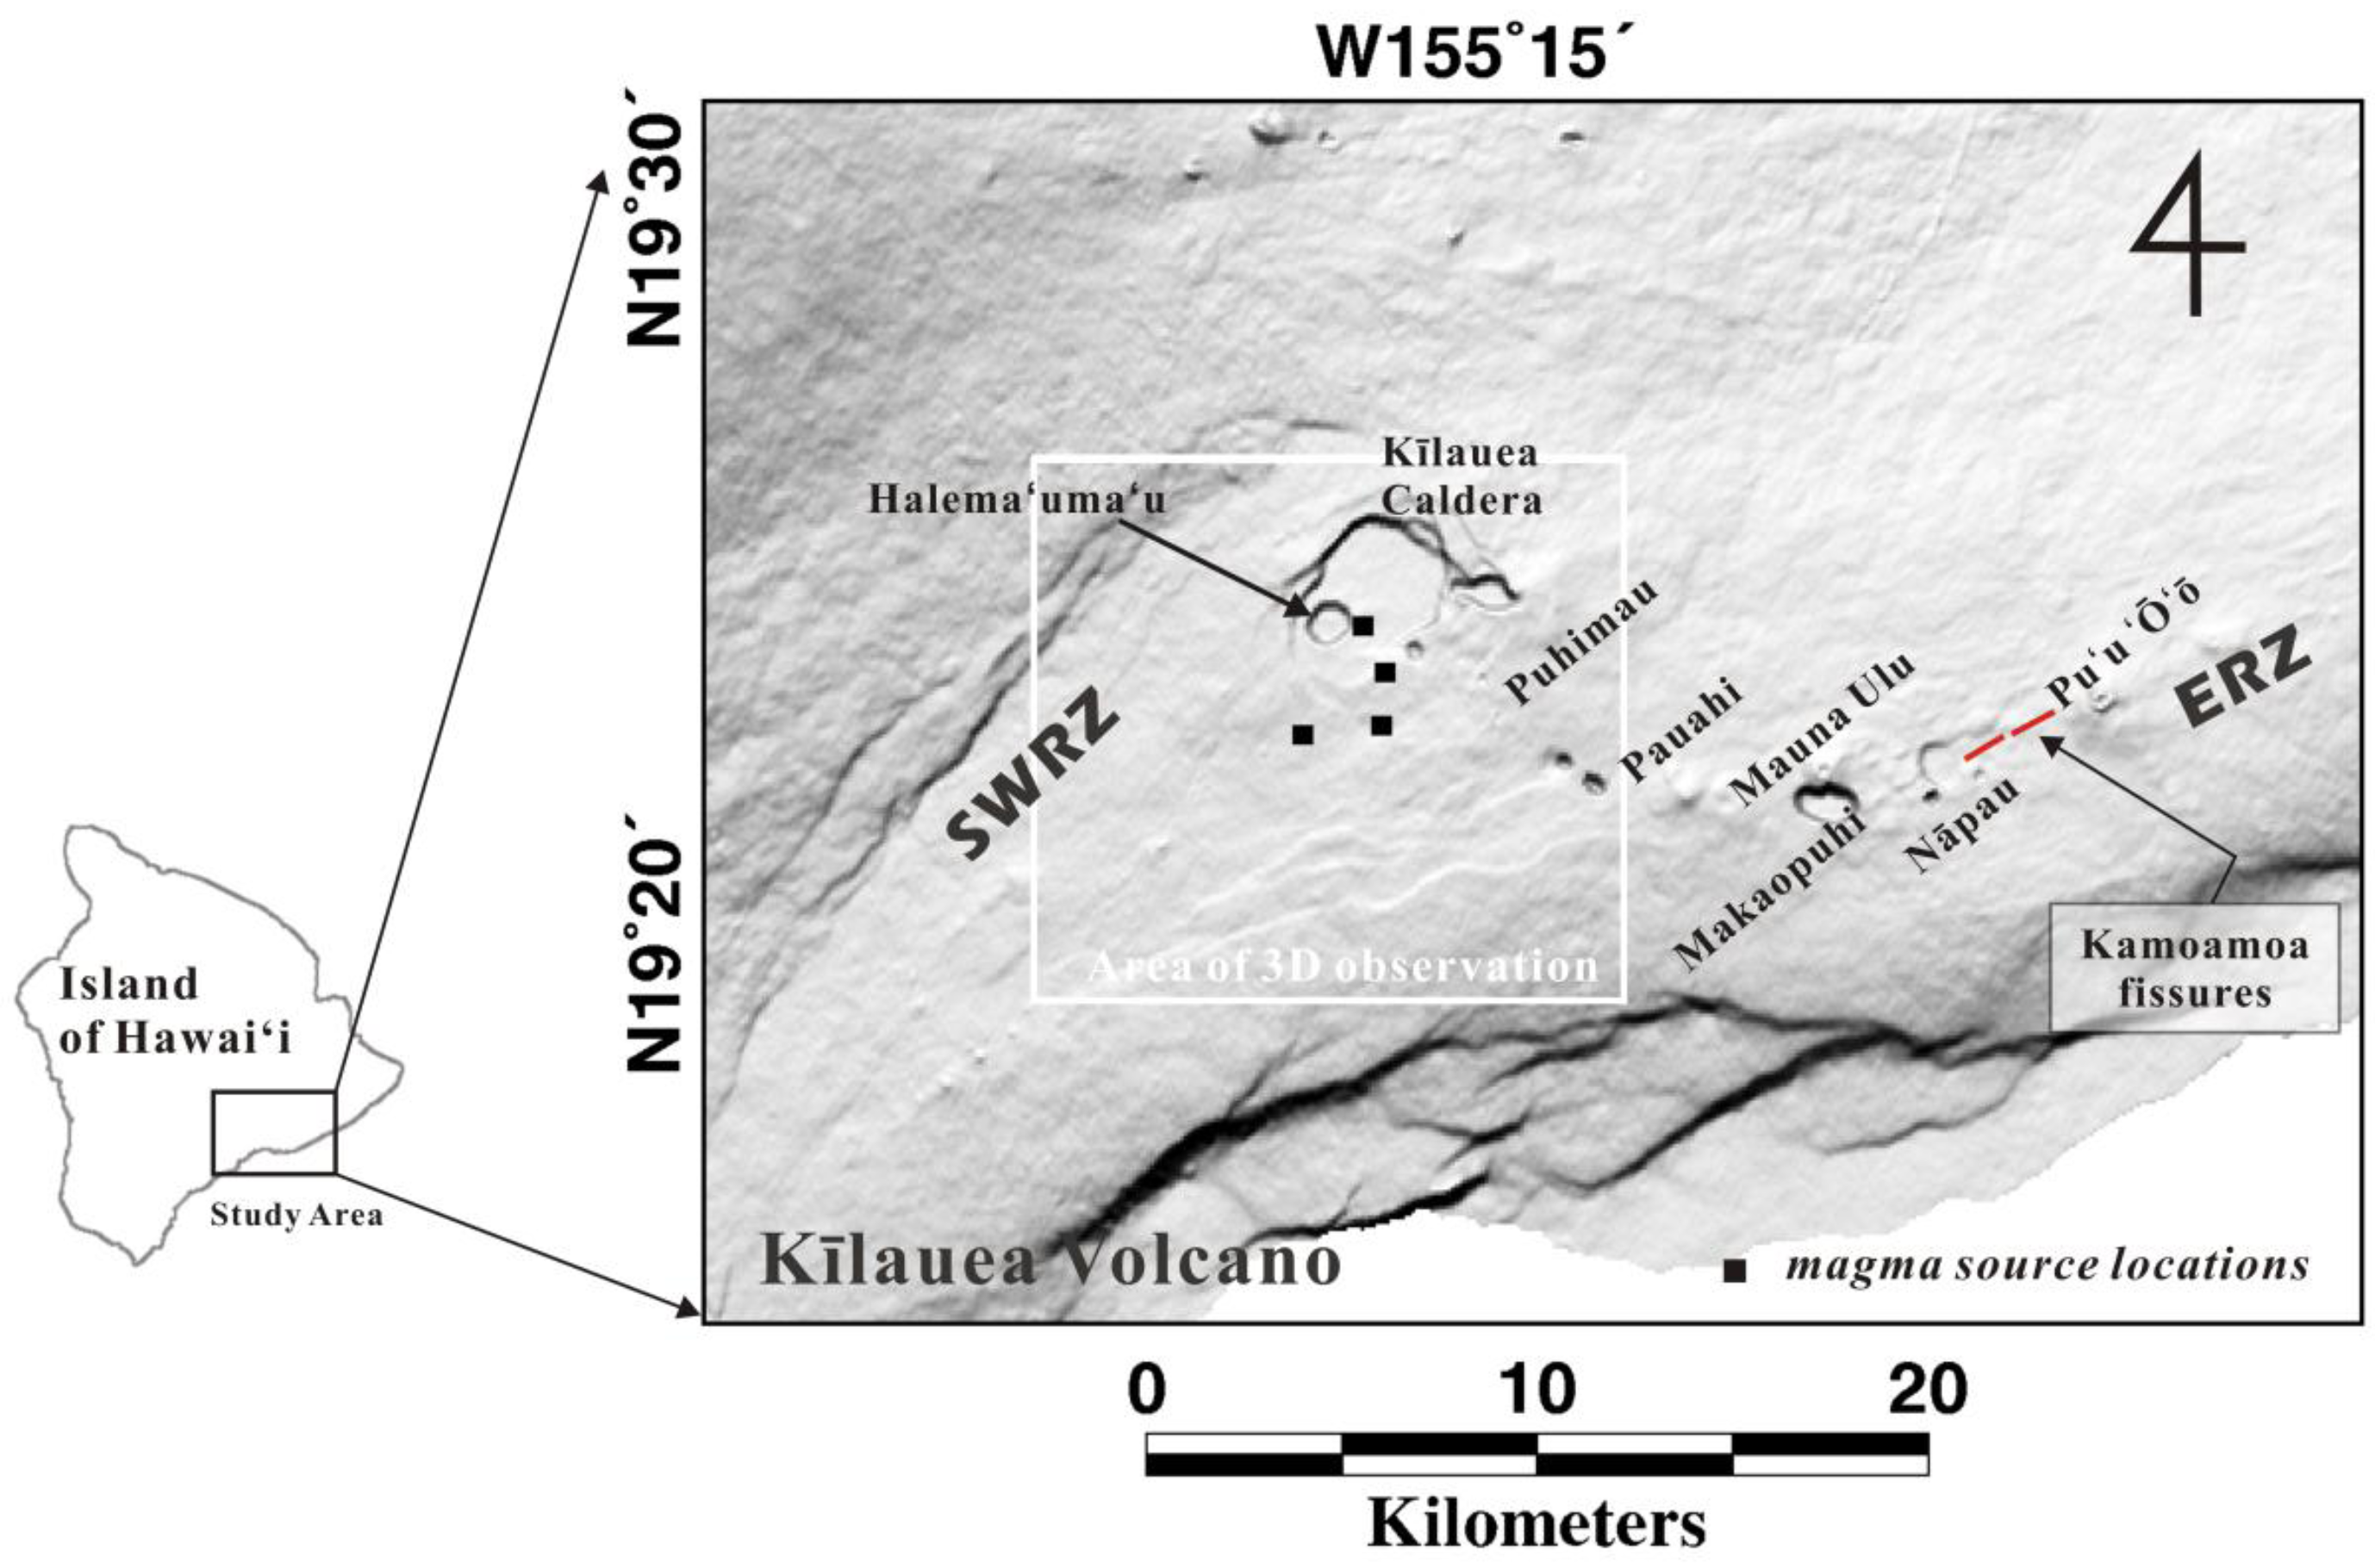
21]. By modeling geodetic observations, previous studies have demonstrated that there are at least three or four discrete magma reservoirs beneath Kīlauea’s summit. Individual sources are located beneath Keanakāko‘i, Halema‘uma‘u, and the southern caldera [
7,
20,
22]. The shallow magma source below Halema‘uma‘u crater is at a depth of 1–2 km [
7], whereas the other sources lie at depths of 2.5–4.5 km. By modeling the 3D displacements, we are able to determine that the most relevant magma source for the recent volcanic activity of Kīlauea volcano. In addition, we expect to achieve better precision in the parameter estimates by exploiting the 3D-based modeling.
3. Three-Dimensional Measurements
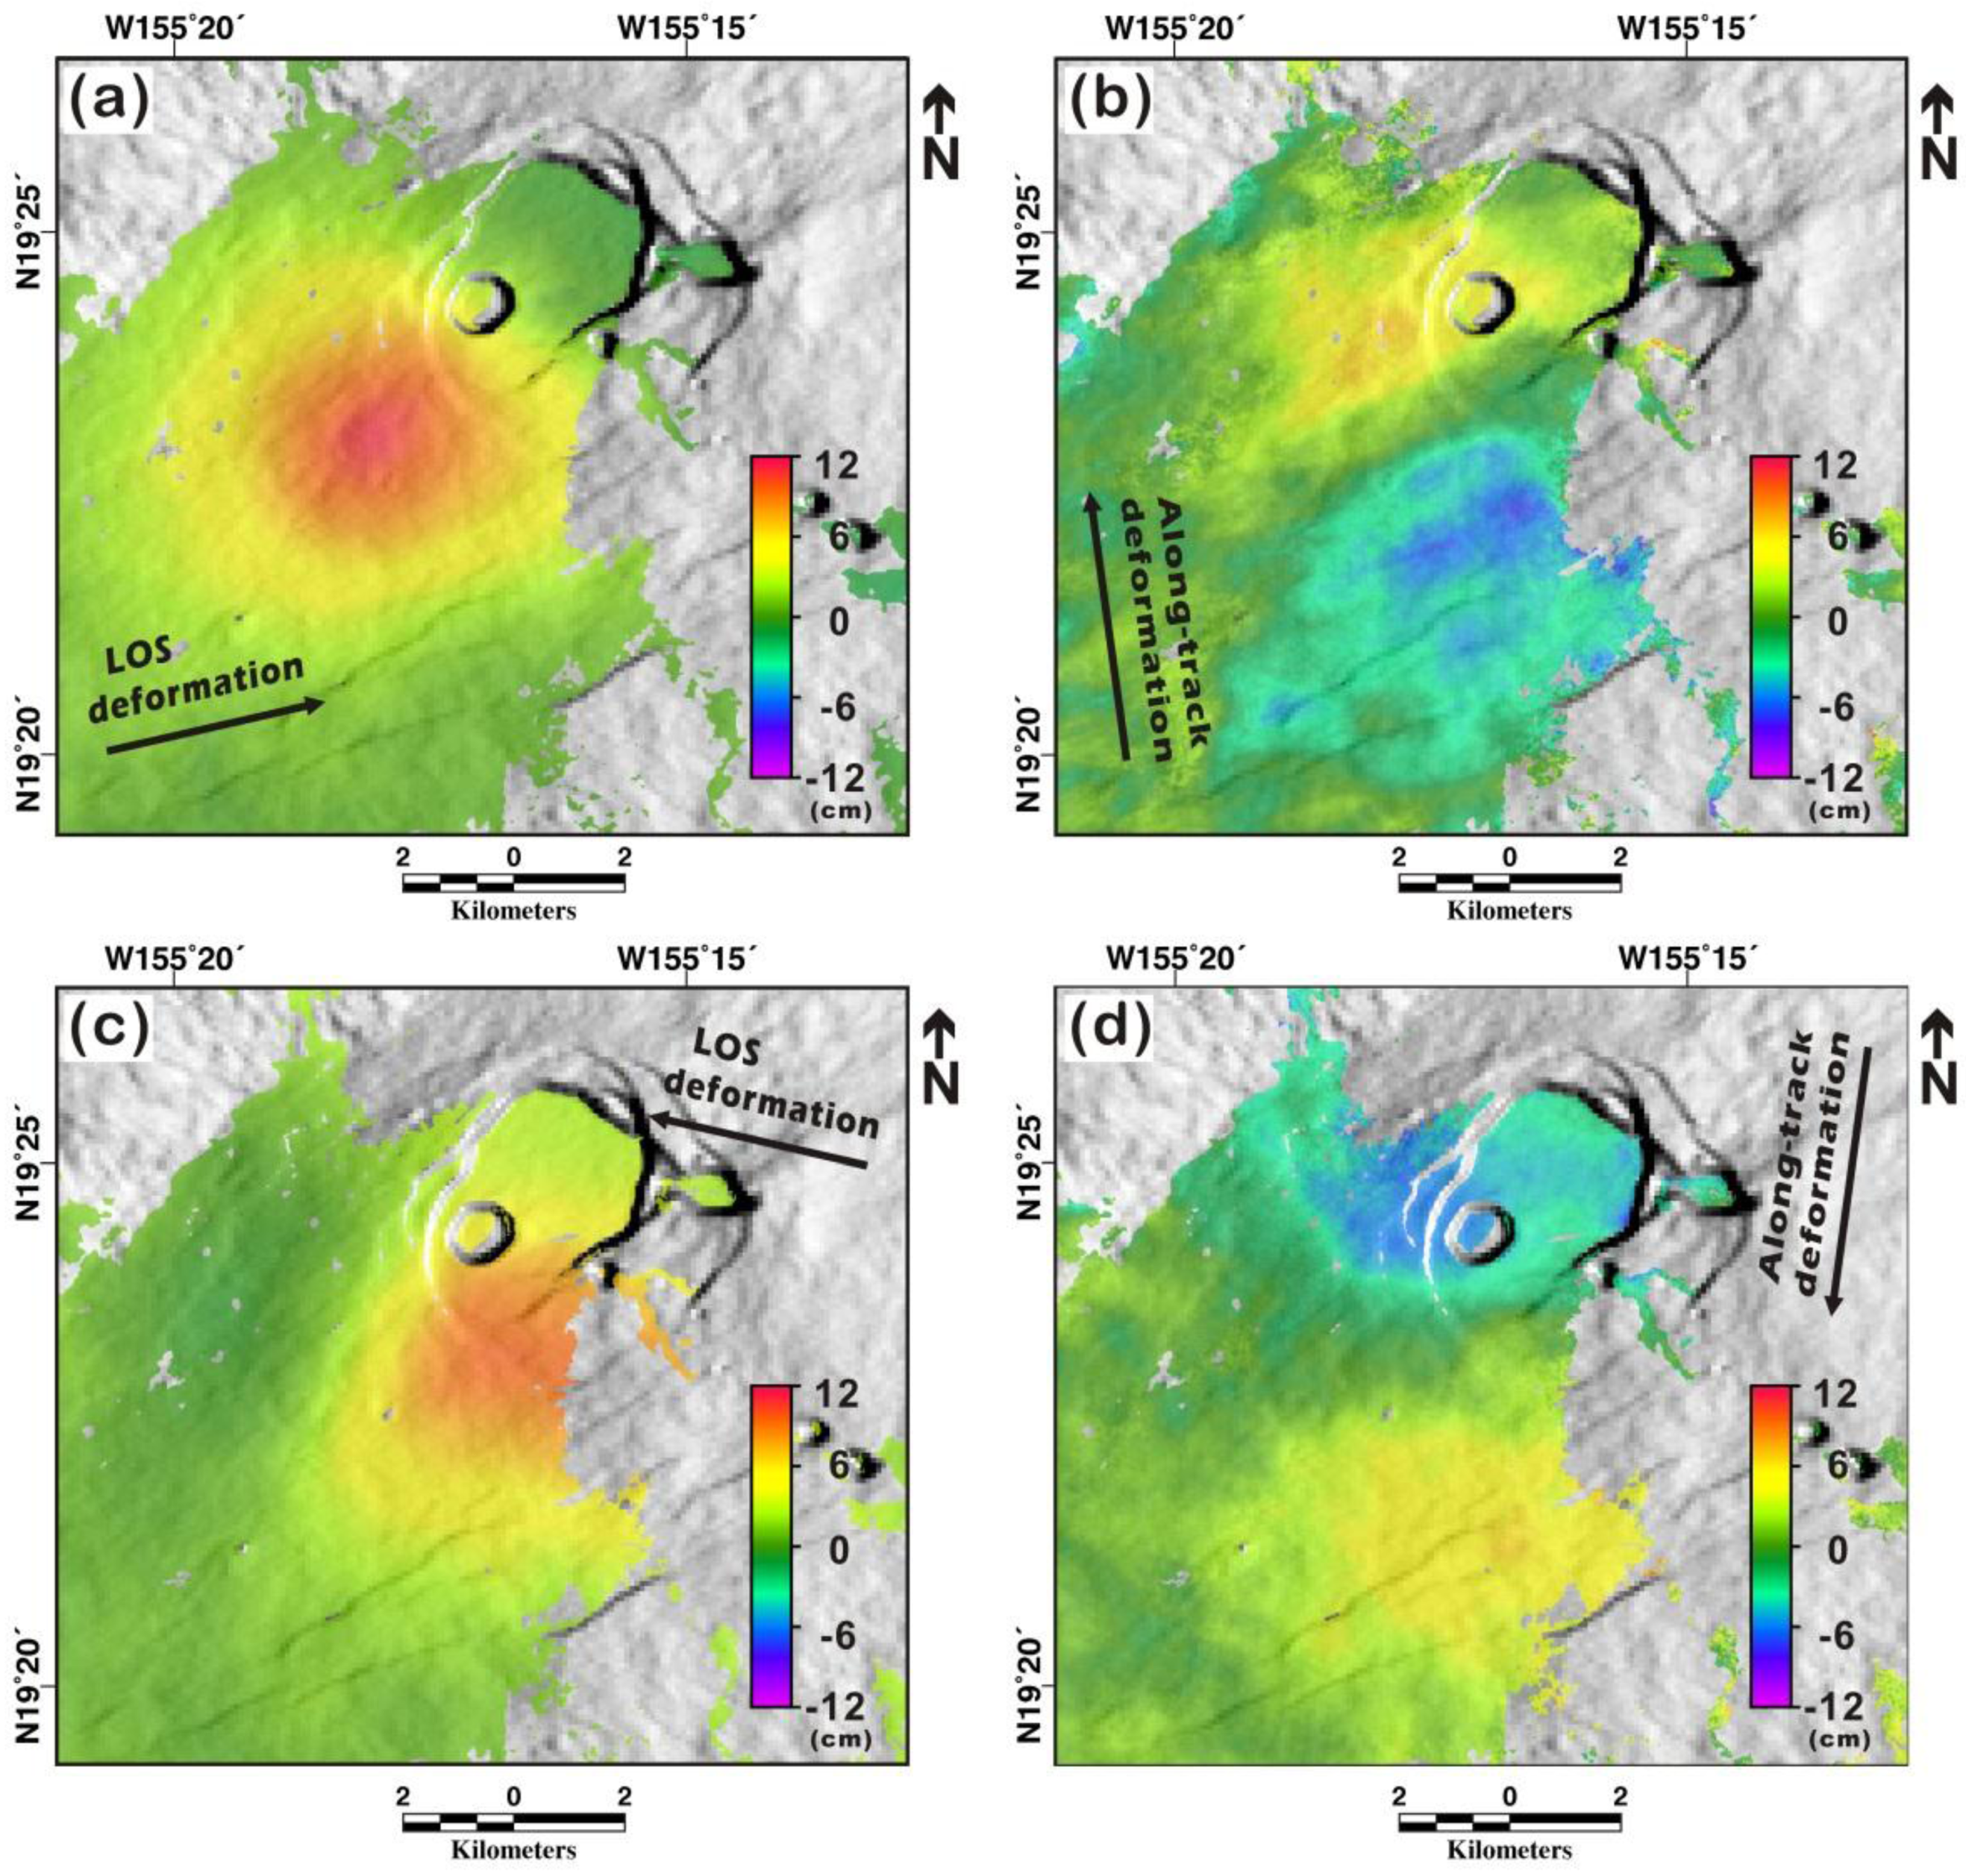
Figure 2 shows the along-track and cross-track (LOS) displacements obtained by the stacks of multiple InSAR pairs. Eight and seven pairs were stacked for the ascending and descending data sets, respectively. The measurements in the low-coherence (γ < 0.7) areas were masked due to their low reliability. As shown in
Figure 2a,c, the LOS deformation based on the InSAR method were clearer than the along-track deformation in
Figure 2b,d. In general, the InSAR measurements are much more precise than the MAI measurements. However, previous studies have shown that the MAI interferograms can provide measurement accuracies of approximately 1.0 cm/year by stacking multi-temporal pairs [
16,
17]. Moreover, MAI measurements might provide more reliable results than InSAR in certain places where atmospheric effects are severe because the MAI technique is not influenced by atmospheric signal delay [
16].
As observed in the InSAR measurements of both ascending and descending data sets, uplift is clearly identified in the vicinity of Kīlauea’s summit, but the center of the deformed region is separated from the Kīlauea caldera to the southwest. The along-track deformation from both ascending and descending data sets shows a symmetric deformation pattern in opposite directions in the northern and southern portions from the deformation center (
Figure 2b,d). The along-track displacement from the ascending data shows an oblique distribution pattern, whereas this pattern is not clearly visible in the descending data set. Therefore, the deformation source is not uniaxial but might be bi- or triaxial in shape. The magnitudes of the deformation are nearly the same in both data sets. The maximum displacement of the southern part of the caldera in the along-track direction is approximately 16 cm, based on the results from both data sets.
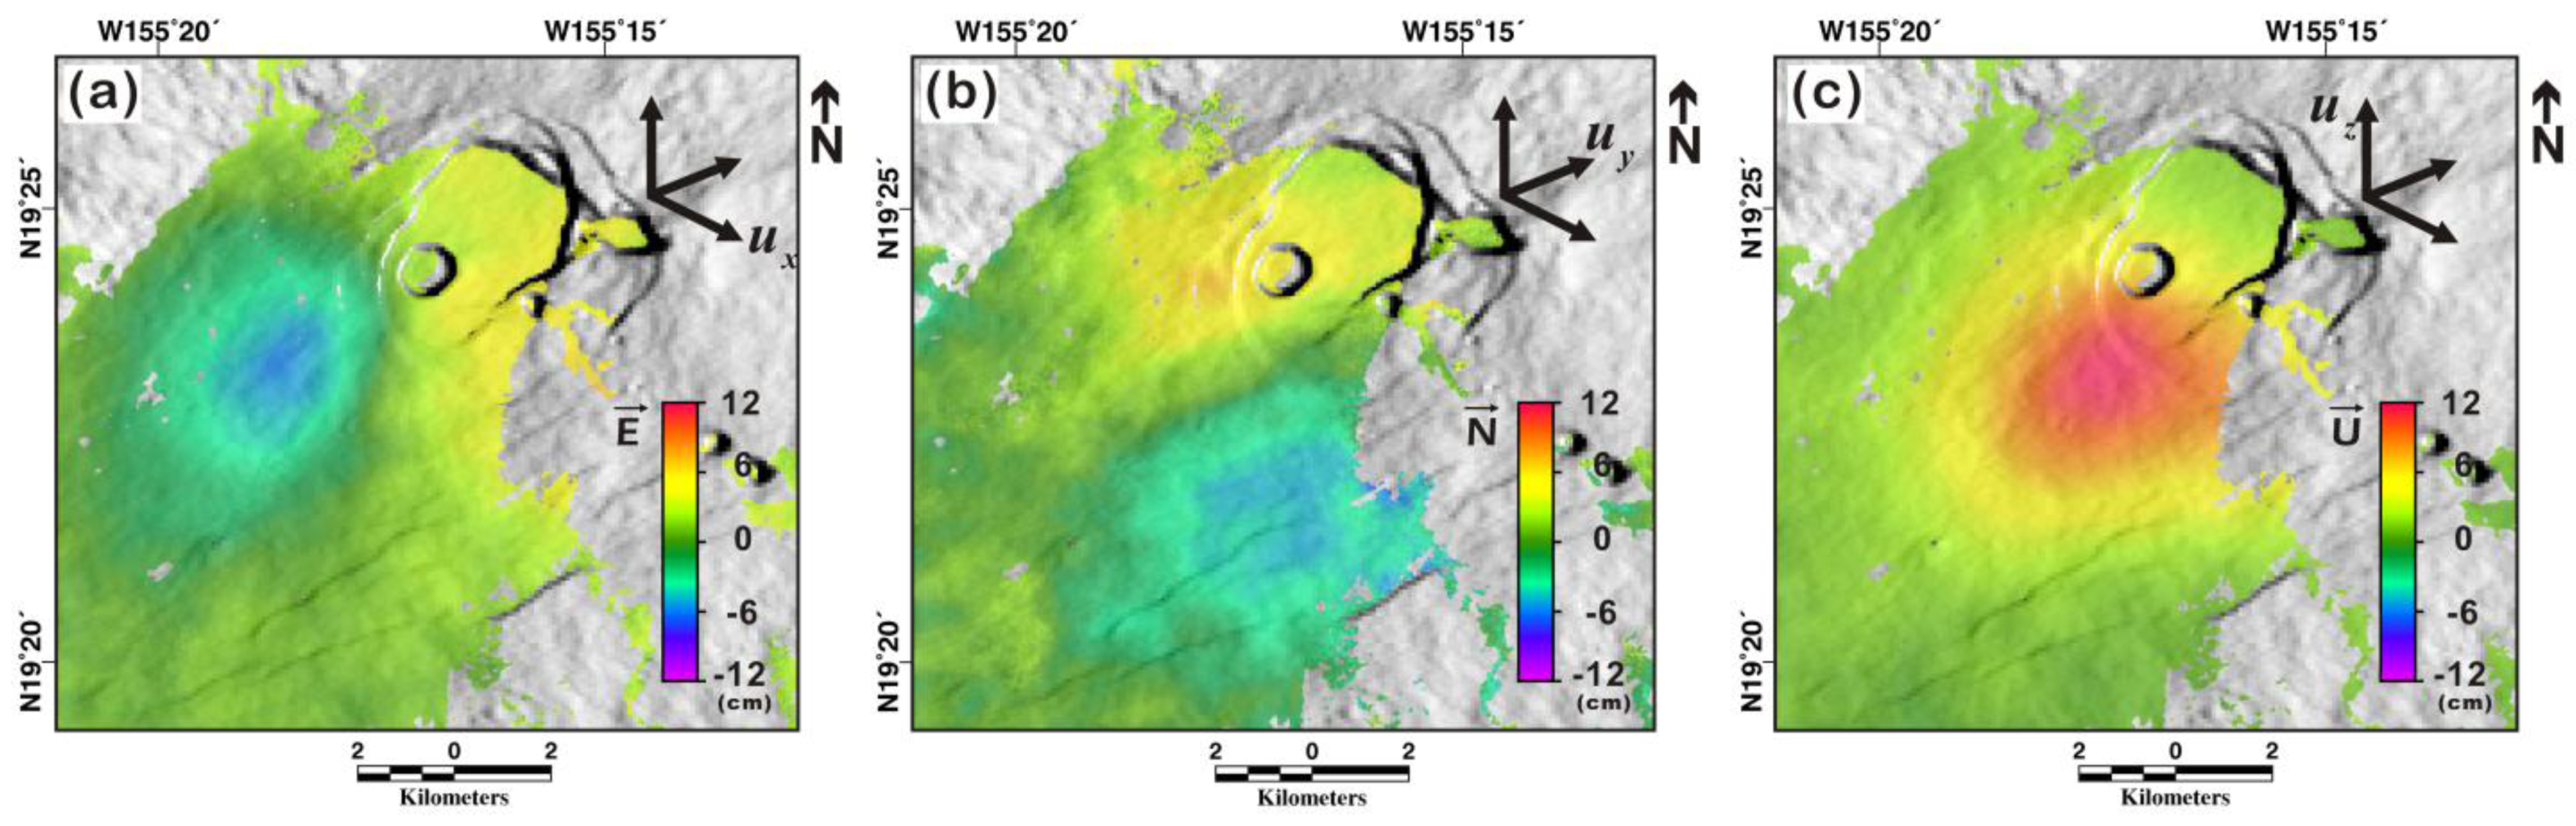
Two LOS and two along-track displacements from ascending and descending data were jointly inverted to retrieve the east, north, and up components of the 3D deformation around Kīlauea’s summit area (
Figure 3). Positive values represent movement in the eastward, northward, and upward directions. The maximum displacements measured are approximately 8.2, −13.8, and 11.6 cm in the east, north, and up directions, respectively. As with the individual InSAR and MAI measurements, the typical deformation pattern for the summit’s inflation can be observed via the 3D displacement maps. These maps also show that the center of the uplift was not exactly in center of the caldera, whereas the deflation center in association with the Kamoamoa fissure eruption was nearly in the center of the caldera. Therefore, the magma sources for the Kamoamoa fissure eruption and the recent intrusion were not the same. The magma source for the recent intrusion is slightly separated from the caldera center in the southwestward direction
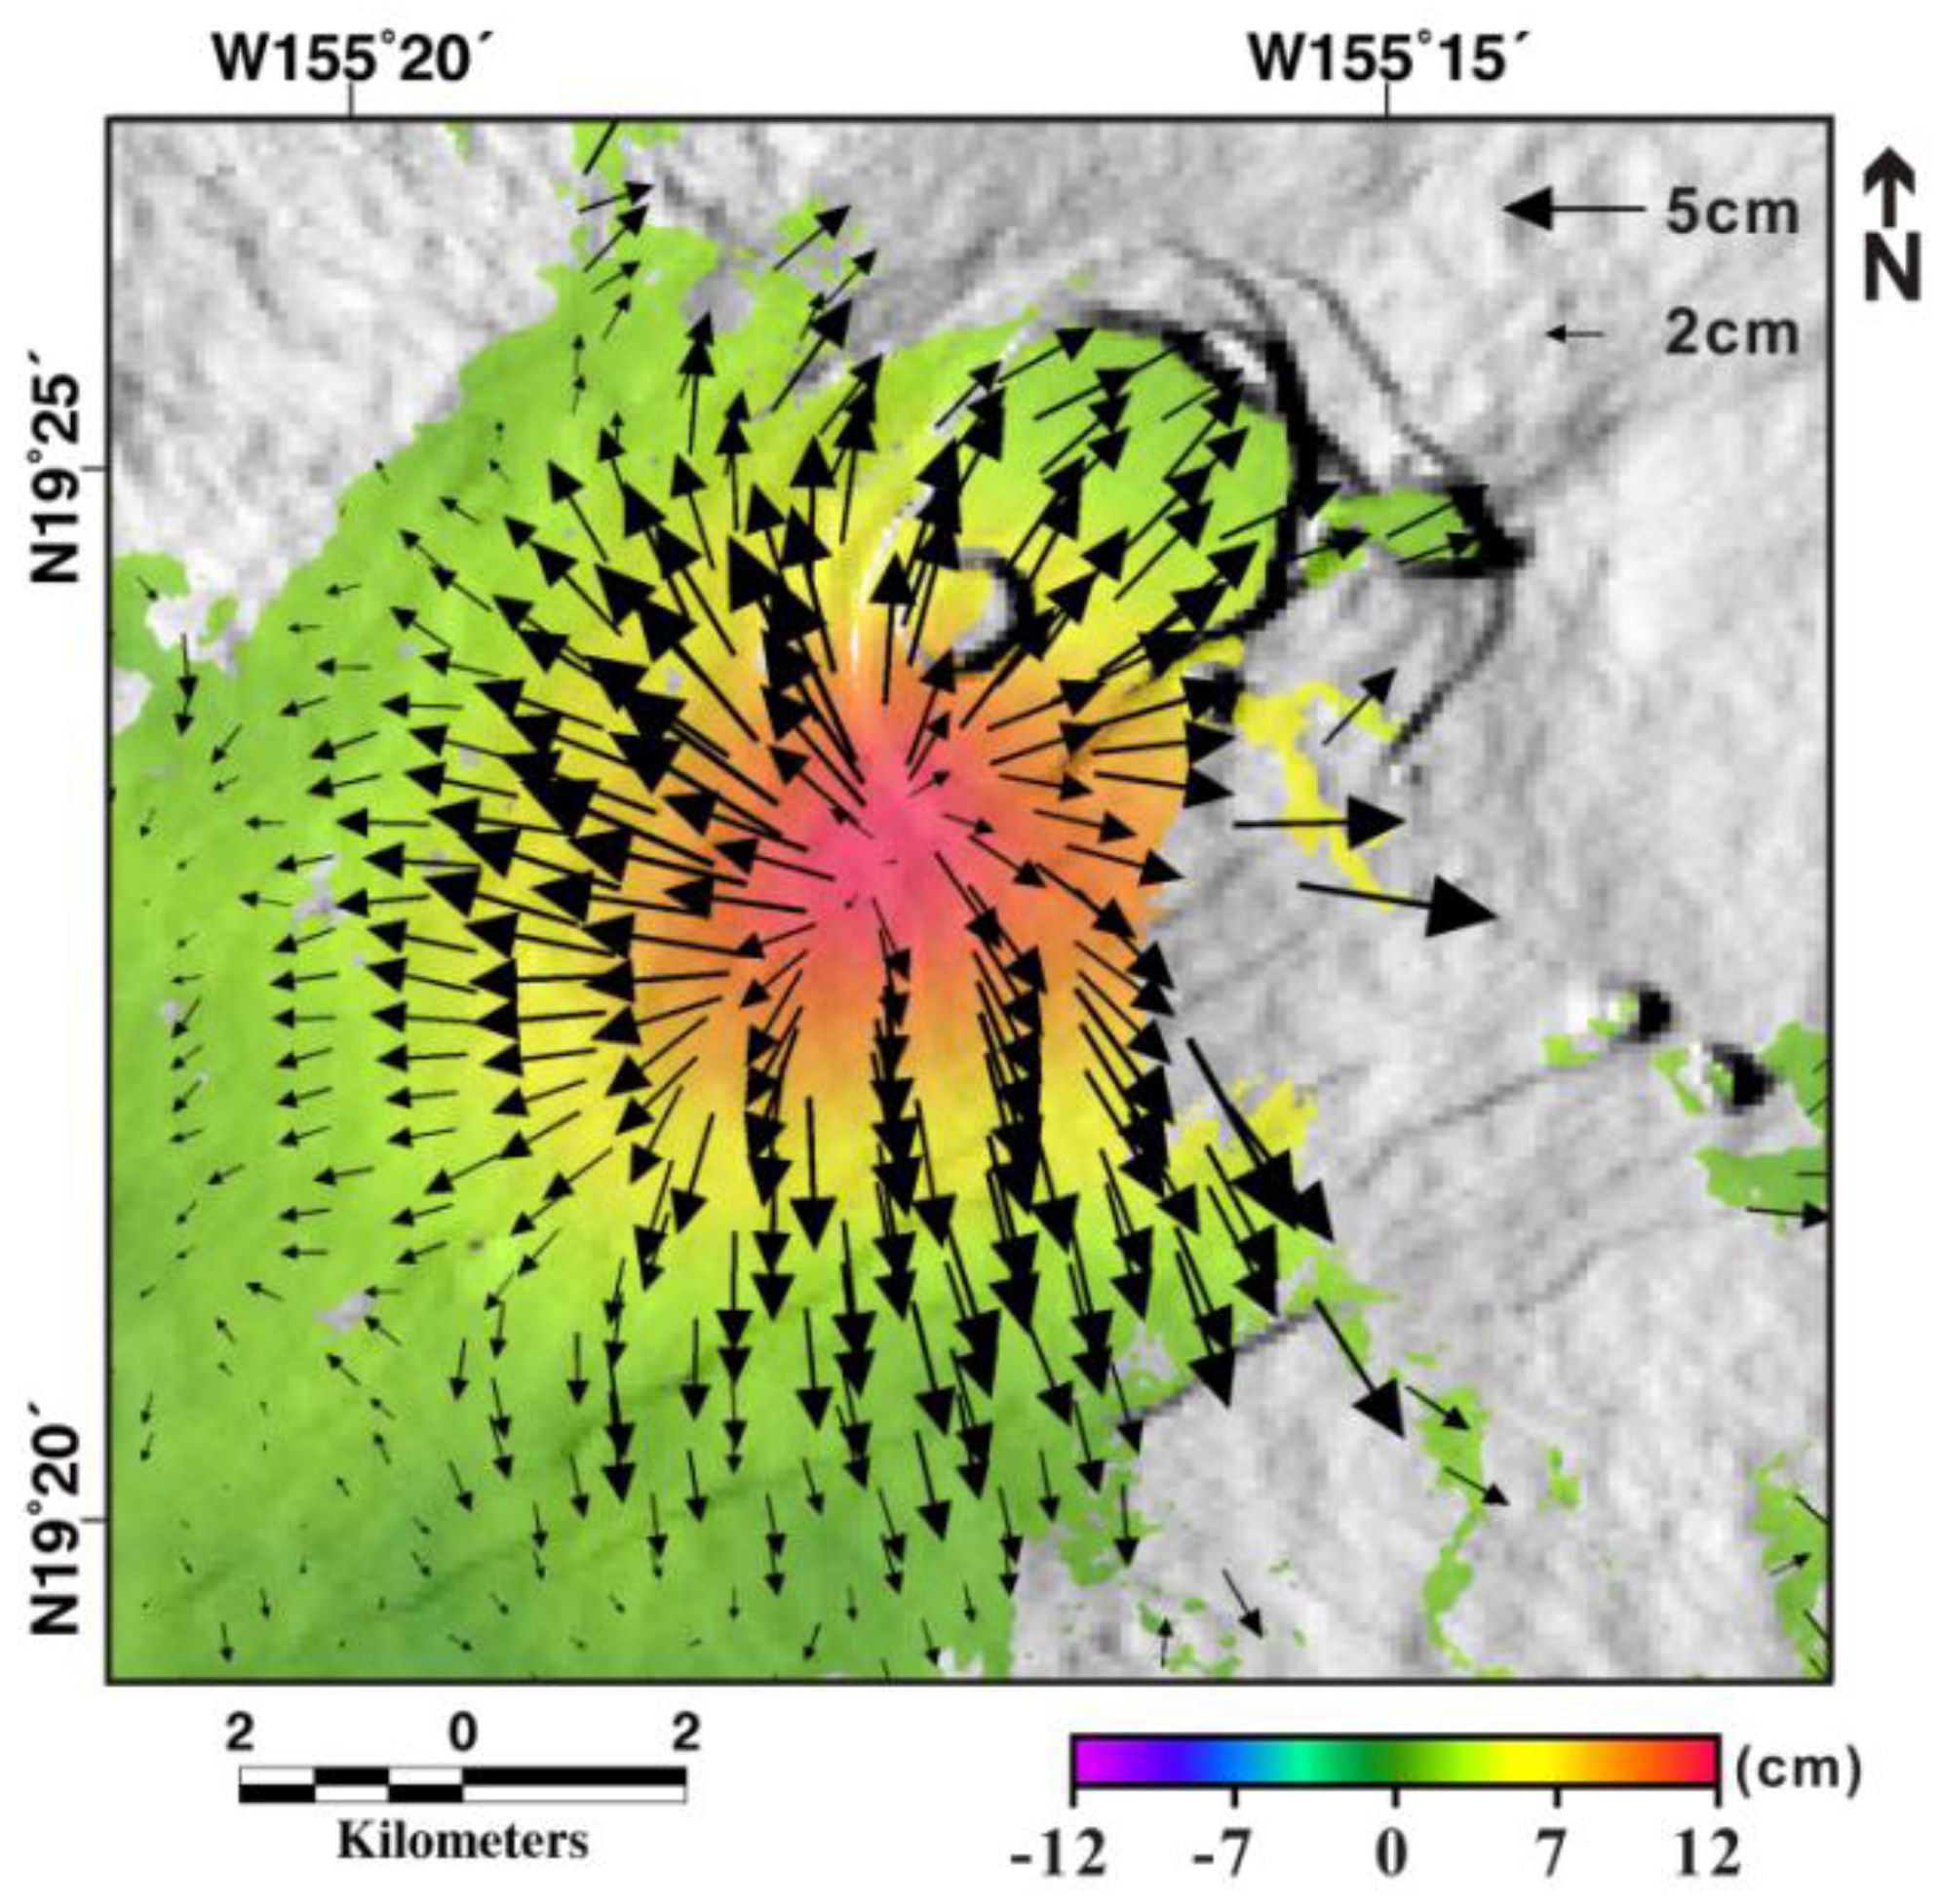
Figure 4 shows the 3D displacement vectors computed by combining the eastward and northward components of the 3D deformation. Arrows indicate the horizontal movements, and the color map represents the vertical component of the surface deformation. Based on the horizontal vector fields, the pattern of surface inflation is clearly recognizable. The difference is not great, but the movement in the north-south direction is more distinct than that in the east-west direction. As discussed earlier, this means that the magma source for this intrusion is likely not spherical in shape. The 3D measurements enable us to assume the approximate shape and size of the deformation source. These estimates, in turn, are used as an initial parameter determination in modeling.
Figure 2.
Multi-stacked InSAR and MAI measurements. (a) LOS and (b) along-track deformation based on InSAR and MAI measurements from ascending orbits. (c) LOS and (d) along-track deformation based on InSAR and MAI measurements from descending orbits.
Figure 2.
Multi-stacked InSAR and MAI measurements. (a) LOS and (b) along-track deformation based on InSAR and MAI measurements from ascending orbits. (c) LOS and (d) along-track deformation based on InSAR and MAI measurements from descending orbits.
Figure 3.
3D surface displacement maps retrieved from integrating multi-stacked InSAR and MAI measurements: (a) east, (b) north, and (c) up components of surface deformation. Positive signals represent eastward, northward, and upward movements.
Figure 3.
3D surface displacement maps retrieved from integrating multi-stacked InSAR and MAI measurements: (a) east, (b) north, and (c) up components of surface deformation. Positive signals represent eastward, northward, and upward movements.
Figure 4.
The horizontal displacement vector field generated from the east and north components of surface deformation. The arrows indicate the magnitude and directions of the horizontal displacements, and the colored map represents the vertical displacements.
Figure 4.
The horizontal displacement vector field generated from the east and north components of surface deformation. The arrows indicate the magnitude and directions of the horizontal displacements, and the colored map represents the vertical displacements.
4. Magma Source Modeling
To define the magma source inducing the surface deformation at Kīlauea’s summit for the recent intrusion in April–May 2015, we applied the prolate spheroid model (Yang model) [
24] and rectangular dislocation model (Okada model) [
26], assuming an isotropic, homogeneous, and elastic half-space condition. We assumed a Poisson’s ratio of 0.25. To determine the optimal parameters of the magma source, we performed ten thousand simulations via Monte Carlo optimization. All model parameters were not fixed, and each of them was determined between the boundary conditions. Among the total of over 400,000 pixels within the deformation maps, 7% from randomly selected samples were used for the model parameter estimation in each iteration. The upper and lower boundaries of the model parameters were broadly chosen by referencing previous modeling from other studies. The optimum model parameters of the magma source were determined as the model with the minimum misfit.
Based on the 3D measurements of surface deformation, we expect that the magma source inducing this minor event should be appropriately modeled by a spheroid model. However, we exploited the dislocation model as well, in order to compare the two modeled results. Additionally, a previous study simulated a magma source using the dislocation model for deformation measured in almost the same position as our observations [
20]. Among the four distinct magma sources below the Kīlauea summit, the deformation patterns and location in this study are quite similar to the surface deformation observed during the period of March 2006 to October 2006 [
20].
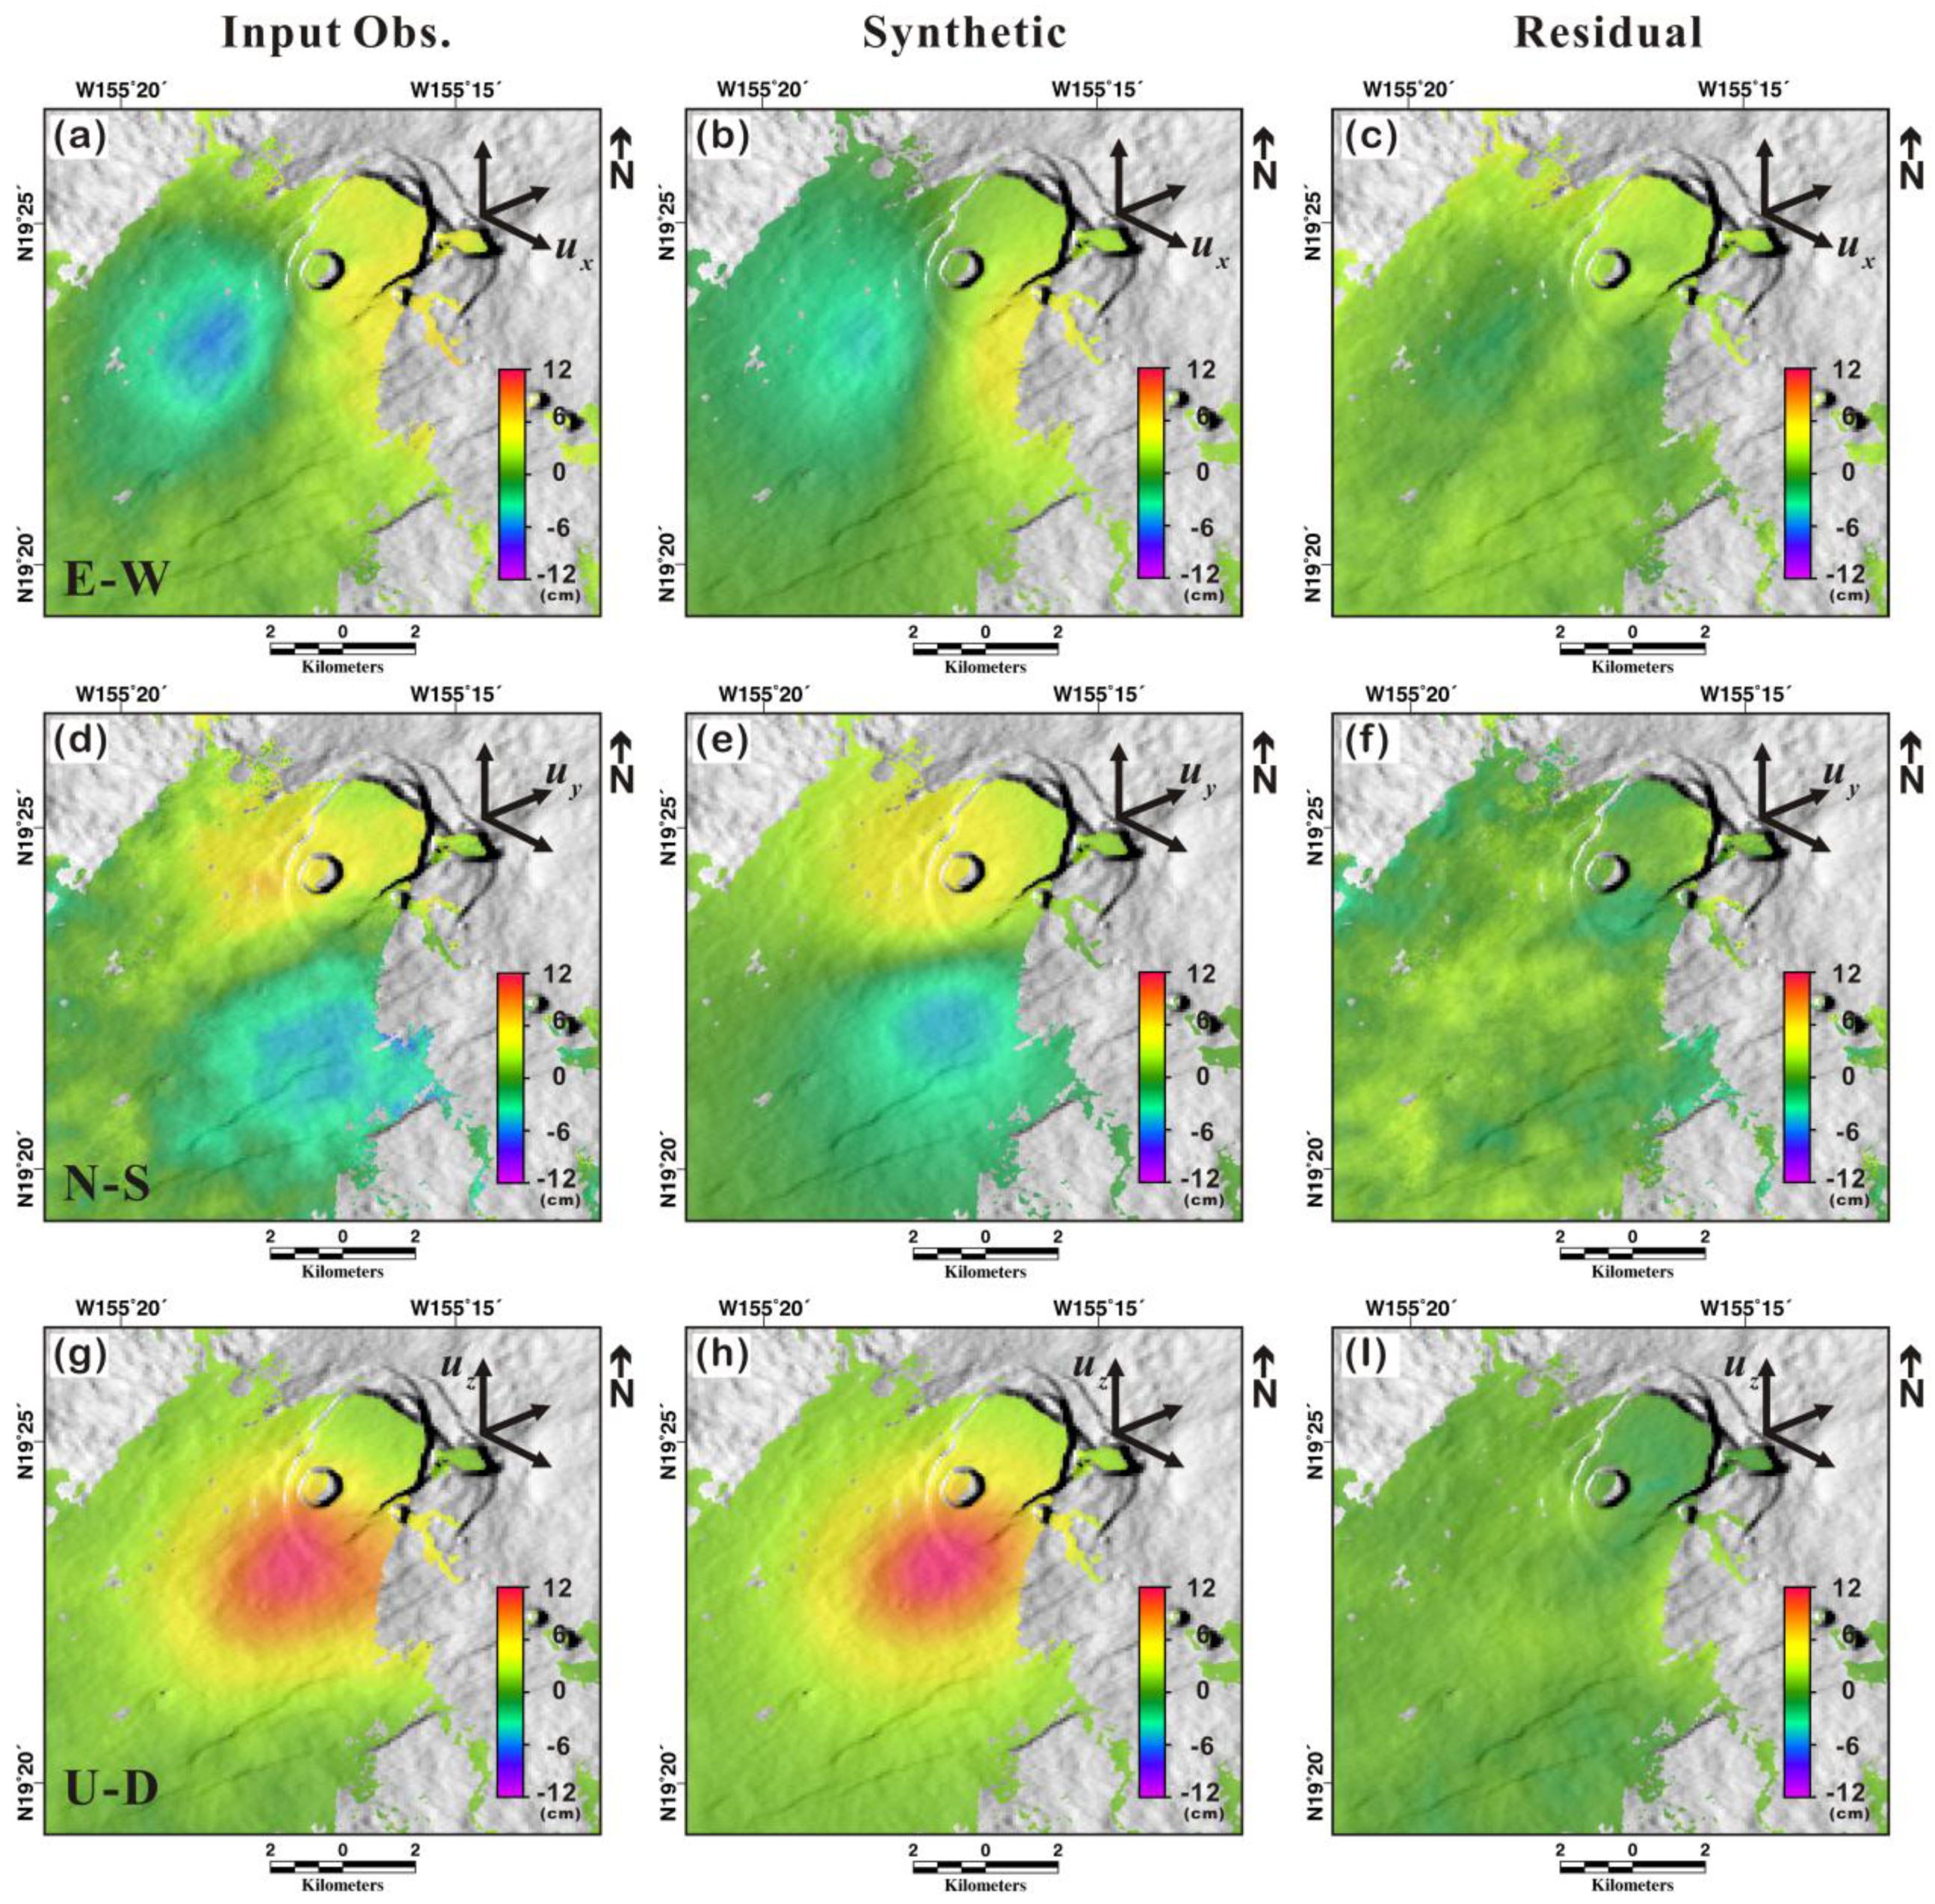
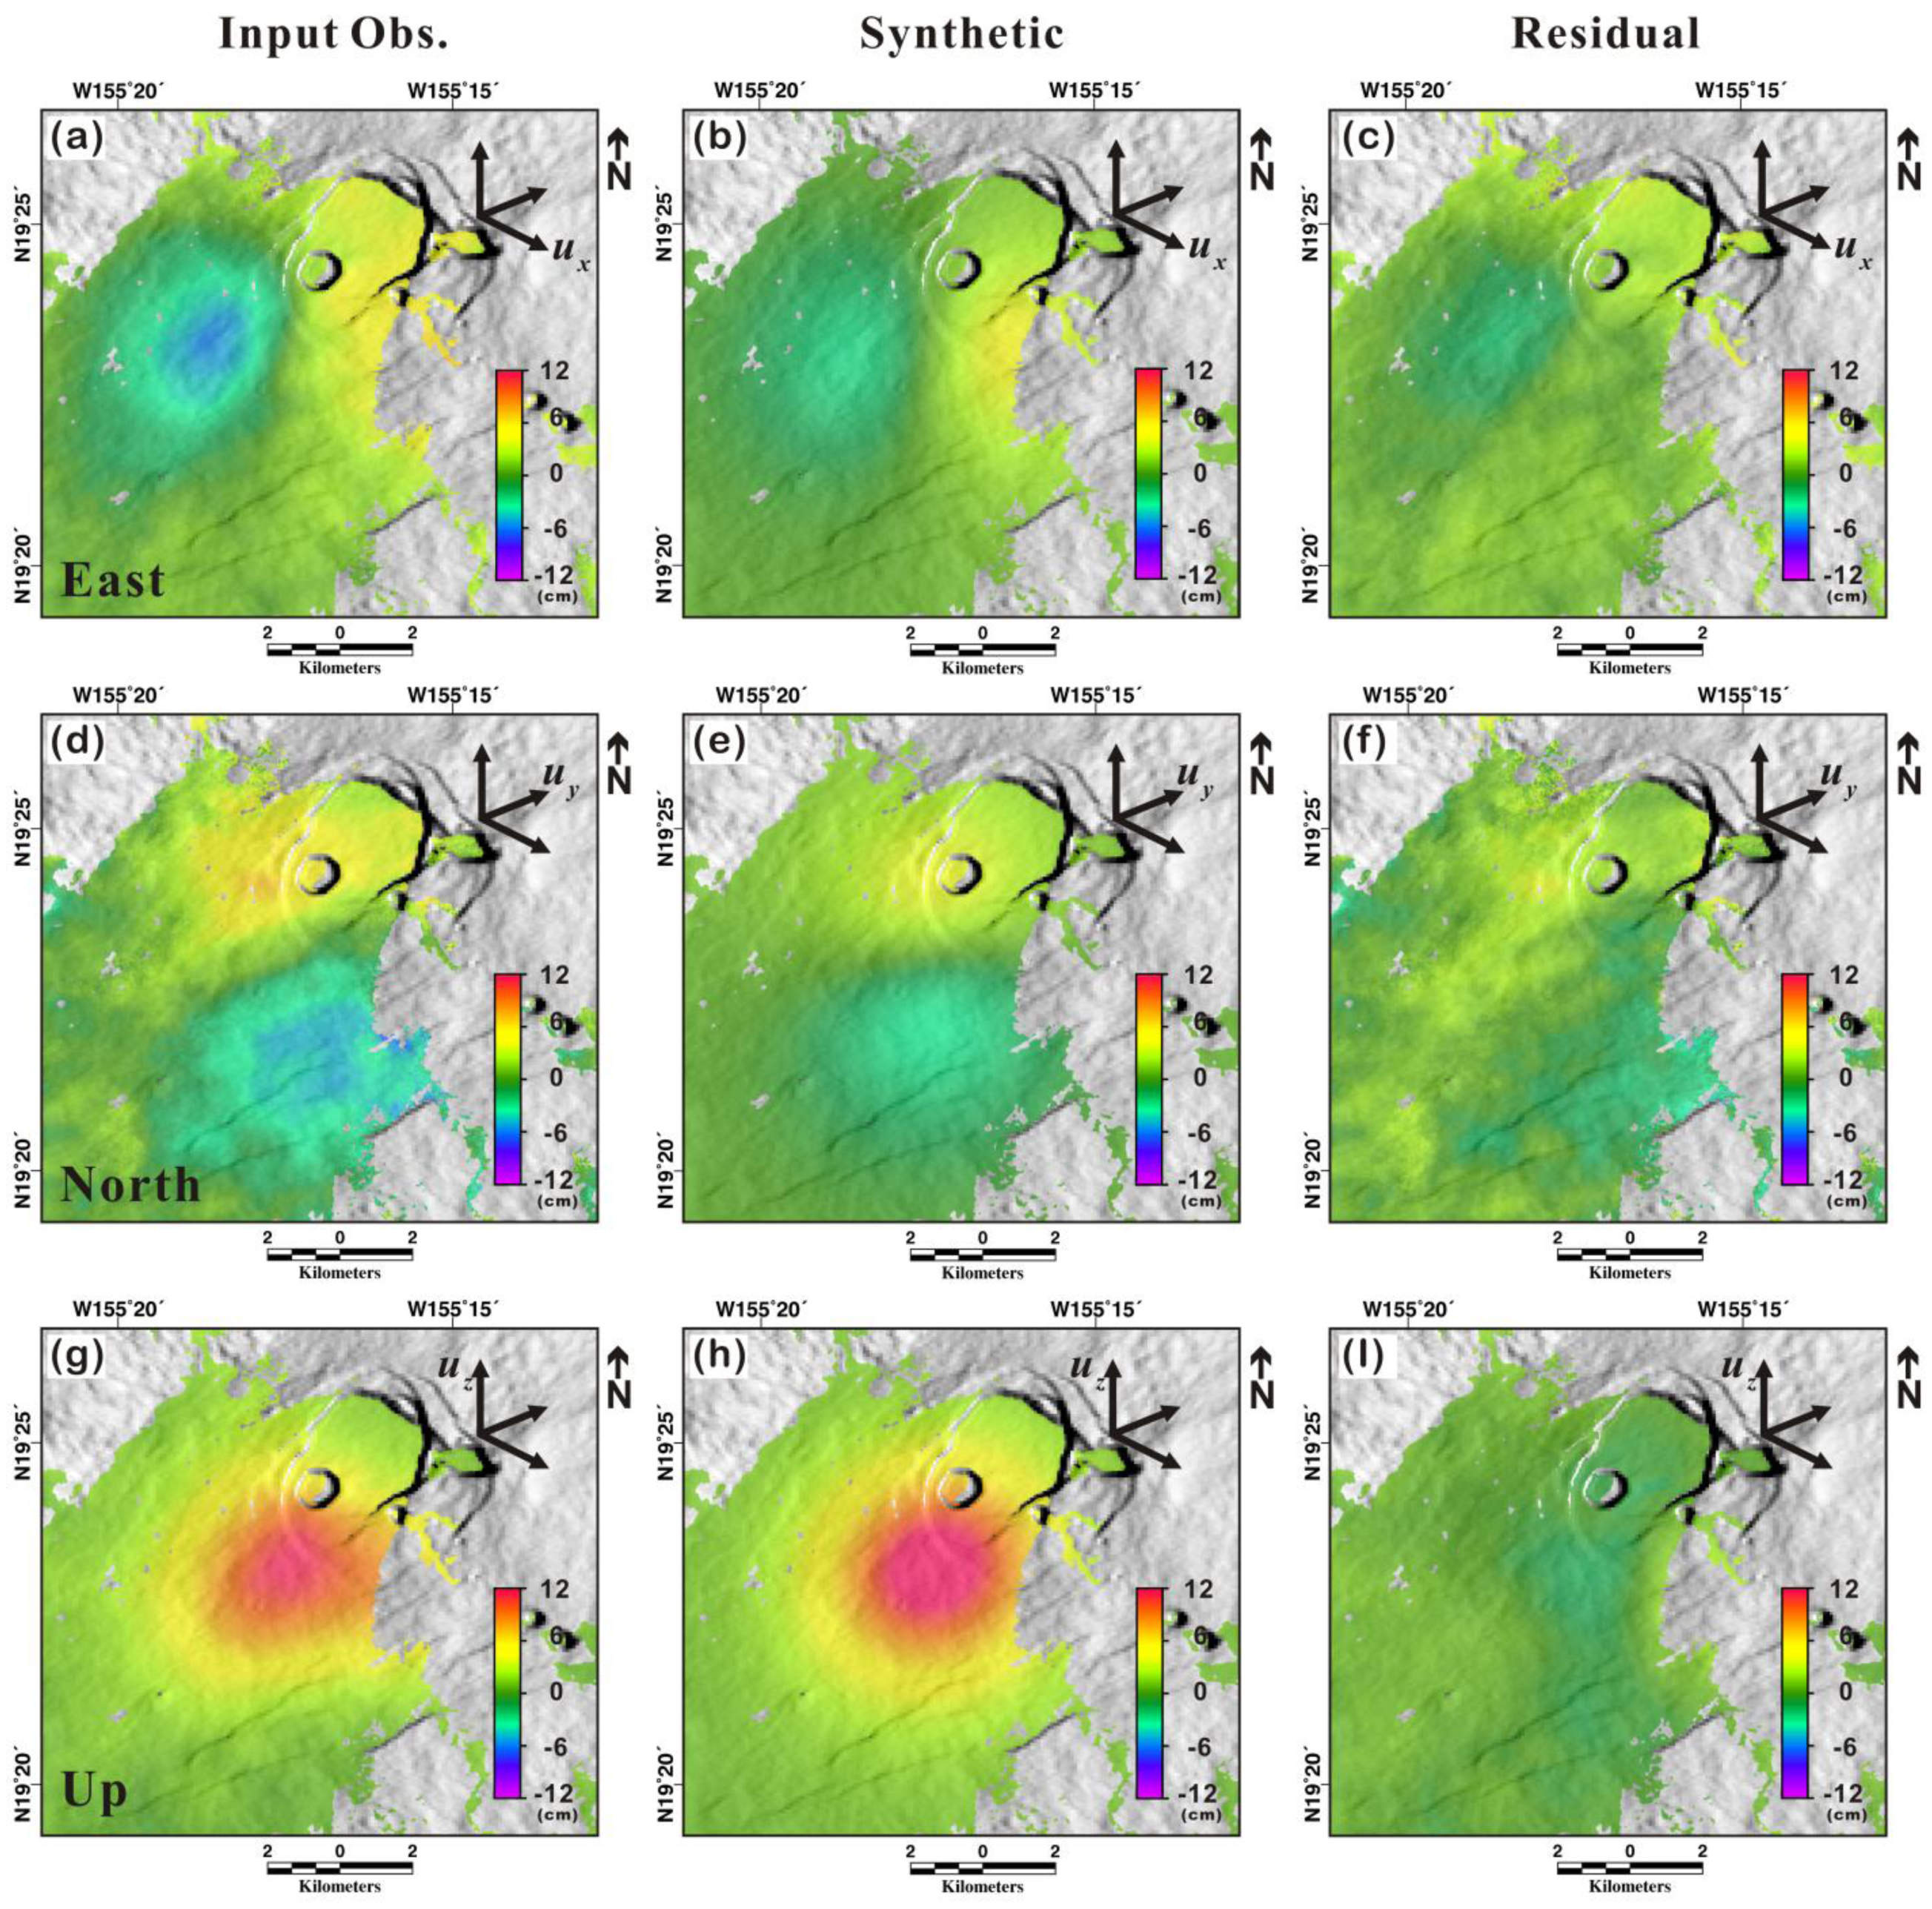
Figure 5 shows the inversion results of the dislocation model using 3D displacement maps, reporting the observed (left), modeled (center), and residual (right) displacements for the east, north, and up components. The 3D components were jointly modeled to determine the parameters of the magma source inducing the surface changes. Based on the residual displacement maps in
Figure 5, a few centimeters of residuals were observed in the east, north, and up components. The root-mean-square (RMS) values for the residual displacements were 0.88, 1.03, and 0.54 cm for the east, north, and up components, respectively. Based on the RMS estimation, the residuals of the north component are slightly larger than those of the east and up components, but the RMS ratios between the residual and observed displacements of the east and north components were similar, with values of 0.49. The residual of the observation ratio for the up component (0.18) was the smallest among the 3D components. In other words, much of the noise might be introduced by measuring the horizontal displacements. Since the up component is only relevant to the InSAR measurement, we infer that the MAI observation introduced the majority of the errors.
The best-fit parameters based on the dislocation model are summarized in
Table 2. Based on the results of the 3D-based modeling, the estimated magma source has a dimension of approximately 4.02 km in width and 1.61 km in length. The orientation of this rectangular source is approximately N67E, and the dip angle is small enough to be considered horizontal. The depth of the magma reservoir is approximately 4.25 km below the surface. [
20] estimated the depth of this deep source to be 2.9–4.2 km at the 95% confidence level, and their best-fit estimate of depth was approximately 3.6 km. When compared to the results of [
20], our modeled source is at a reasonable depth but slightly deeper than that of the previous study. The volume change in the magma source differed significantly from the estimate of the previous study. Assuming a uniform dislocation from the overall rectangular magma source, the estimated volume increase is approximately 6.03 × 10
6 m
3 using the width, length, and opening model parameters. This value is almost half the size of the volume change in the previous study [
20]. Based on the difference in volume changes, we confirmed that the scale of the previous intrusion was much larger than that of the recent event. This finding is further supported by the different durations of the intrusions. The previous intrusion lasted for approximately six months (28 March to 6 October 2006) [
20], whereas this minor event lasted only approximately two weeks.
Figure 5.
Inversion results of the rectangular dislocation (Okada) model for Kīlauea’s summit area using 3D measurements. The first row shows the (a) observed, (b) synthetic, and (c) residual deformation of the east component. The second row shows the (d) observed (e) synthetic, and (f) residual deformation of the north component. The third row shows the (g) observed, (h) synthetic, and (i) residual deformation of the up component.
Table 2.
The best-fit model parameters of Kīlauea’s magma source using the Okada dislocation model.
Table 2.
The best-fit model parameters of Kīlauea’s magma source using the Okada dislocation model.
| | | Okada Model Parameters |
|---|
| Width (km) | Length (km) | Depth (km) | Dip** (deg.) | Strike (deg.) | Pos-X* (lon.) | Pos-Y* (lat.) | Strike-Slip (x10−03 km) | Dip-Slip (x10−03 km) | Opening (x10−03 km) |
|---|
| 4.019 ± 0.08 | 1.612 ± 0.16 | 4.247 ± 0.05 | 4.757 ± 0.41 | 67.475 ± 1.02 | −155.287 ± 7.31e−04 | 19.382 ± 0.13 | 0.0165 ± 9.24e−06 | 0.0055 ± 1.24e−05 | 0.9314 ± 9.56e−05 |
Figure 6.
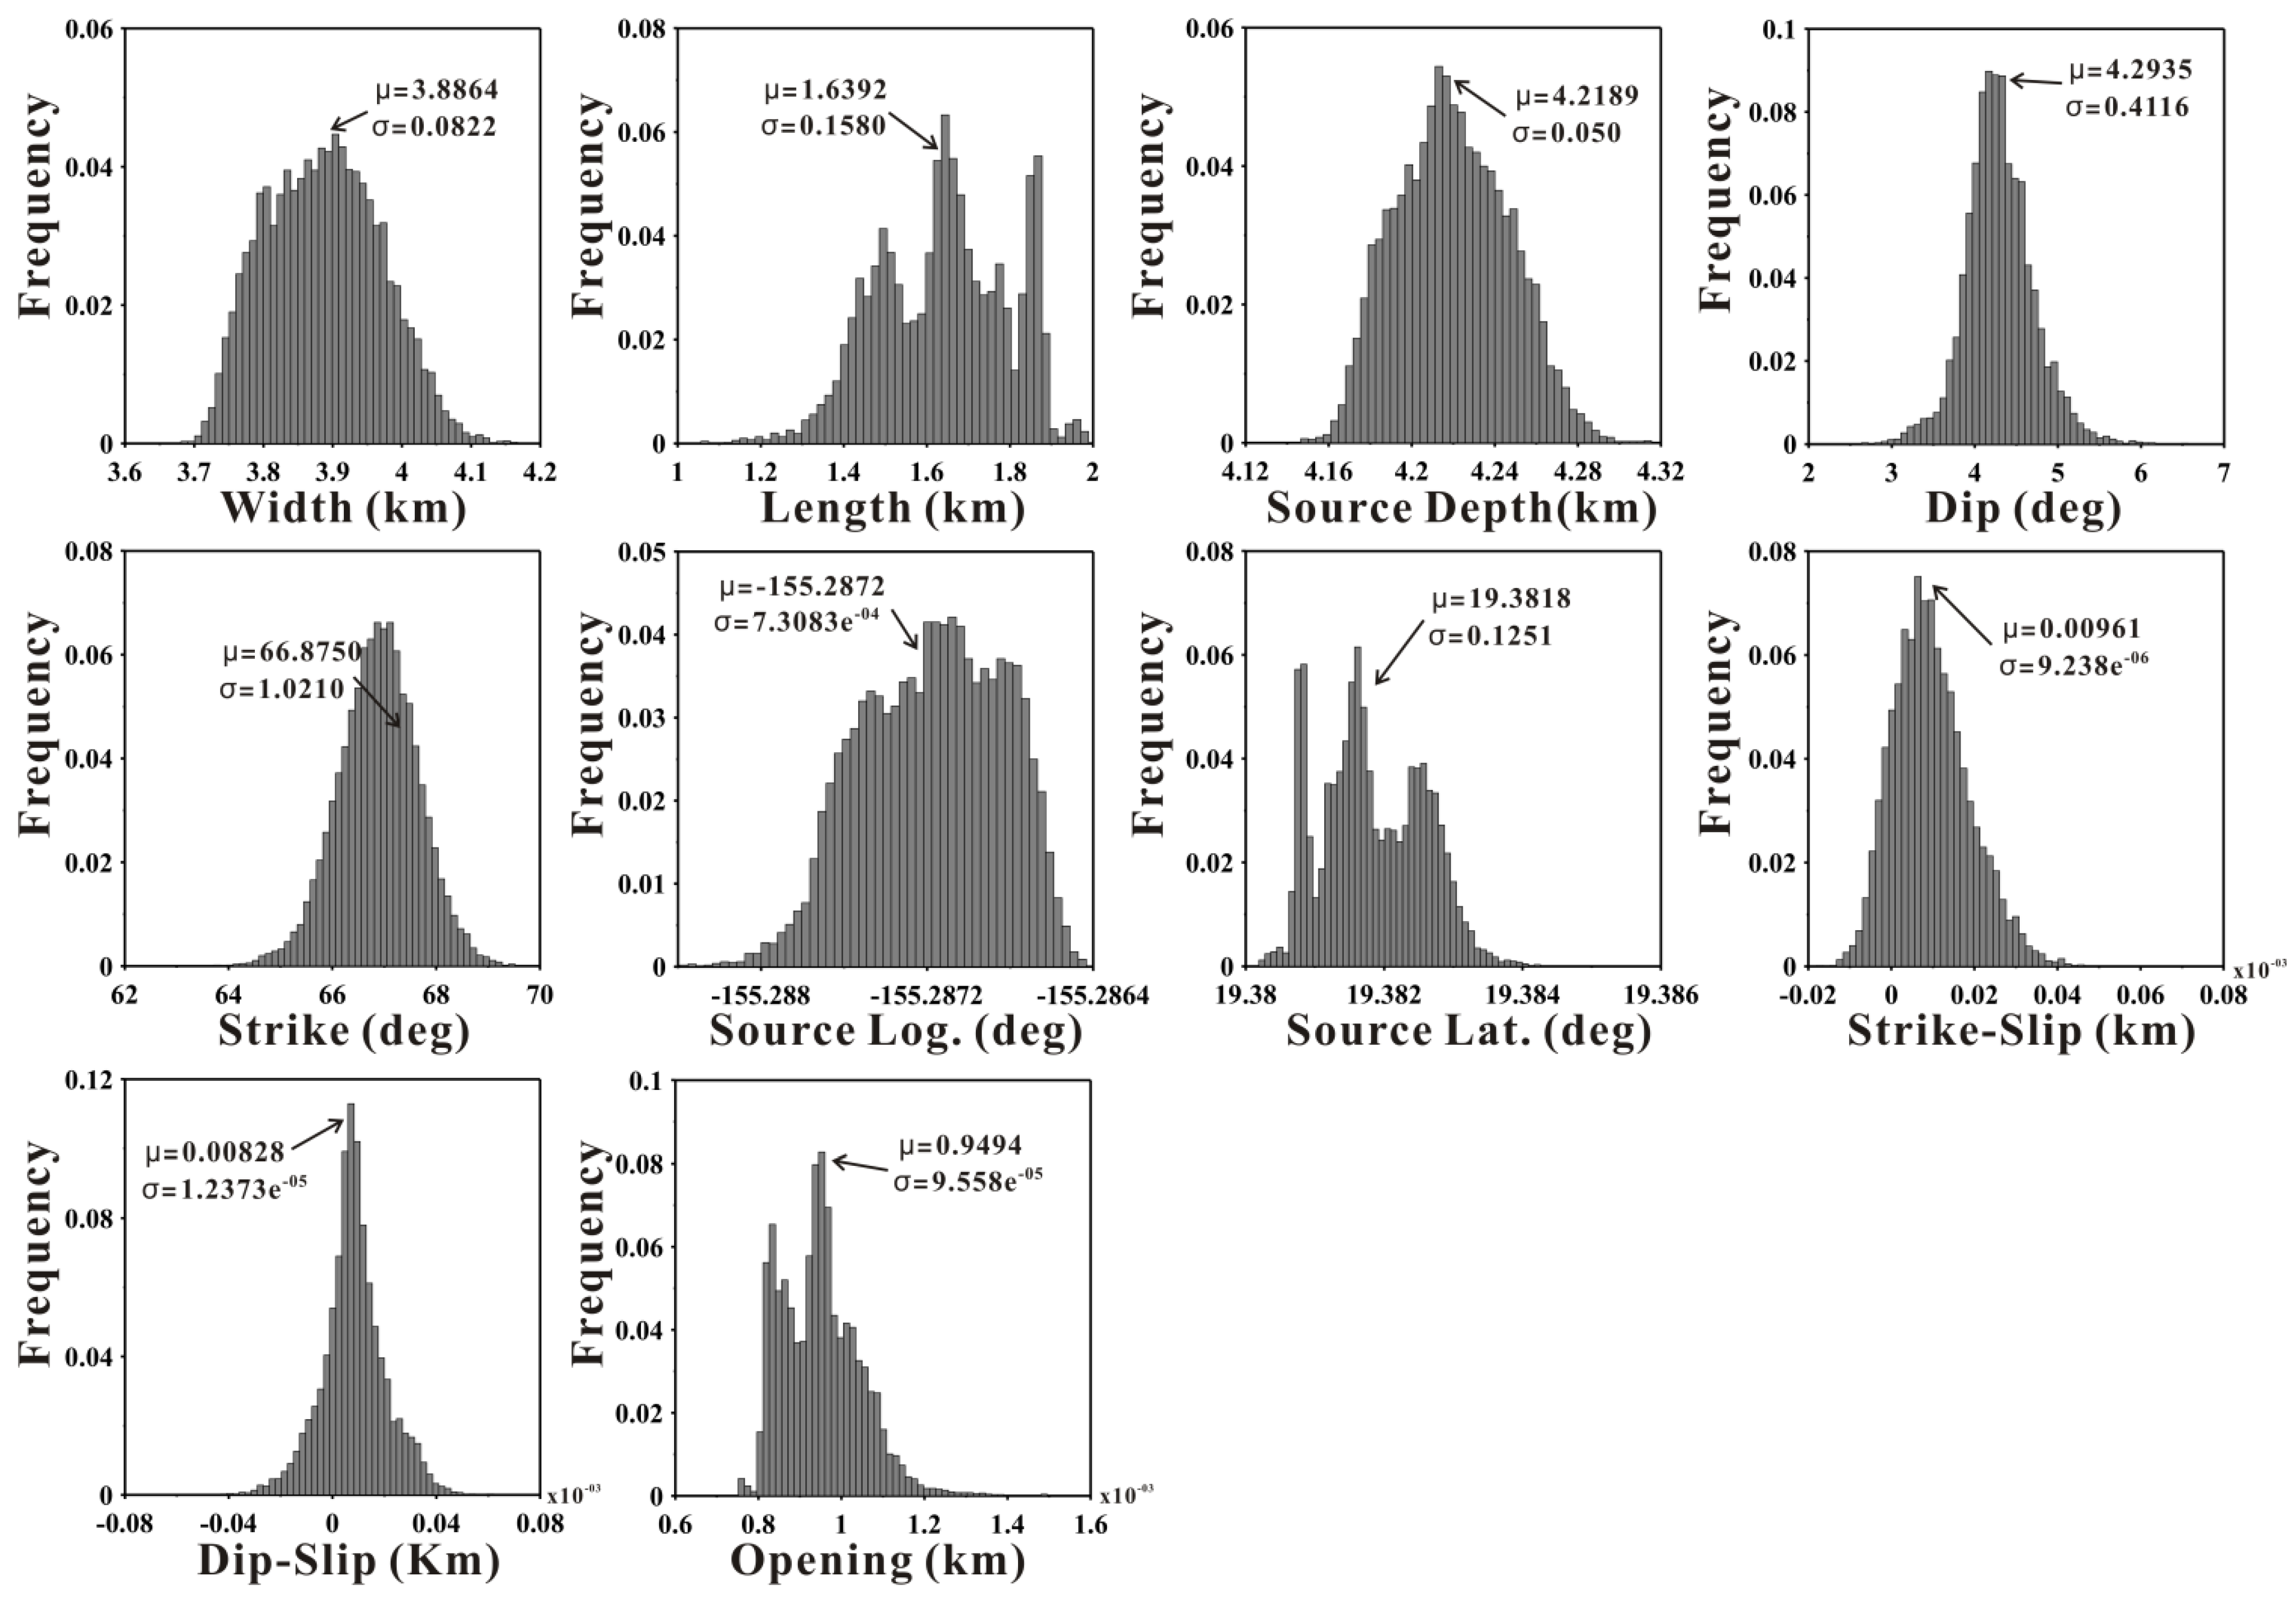
Histograms of the magma source parameters estimated from the 3D measurement inputs using the Okada dislocation model.
Figure 6.
Histograms of the magma source parameters estimated from the 3D measurement inputs using the Okada dislocation model.
Based on the dislocation model, the best-fit X and Y positions of the magma source were approximately −155.287 and 19.382 degrees in the ground coordinates, which differ slightly from the results in the previous study (−155.29 degrees longitude and 19.38 degrees latitude) [
20]. As observed in the histograms of the model parameters in the Okada model (
Figure 6), the X and Y positions (longitude and latitude coordinates) did not simply converge on a unique value. In particular, the parameter of the Y-position featured a multimodal histogram with relatively large uncertainties. The length and opening parameters also showed multiple peaks with large standard deviations. Although several parameters did not converge on a unique solution due to relatively large uncertainties, the 3D measurements provided an improved magma source model relative to the InSAR measurements by reducing biases. The enhancement of the parameter estimation for the magma source model using 3D measurements was demonstrated by [
17].
Figure 7 shows the inversion results of the prolate spheroid model from the 3D displacement maps. In
Figure 7, the left column is the inputs of east, north, and up components, which are the same as the dislocation model. The center and right columns are synthetic and residual displacements based on the spheroid model, respectively. When the results of the dislocation model are compared to those of the spheroid model, the residuals were small, demonstrating that the magma model is accurately estimated by the spheroid model. The RMS estimates of the residual displacements were 0.81, 0.79, and 0.41 cm for the east, north, and up components, respectively. Among the 3D components, the residuals of the north component notably decreased by approximately 23%. Therefore, the spheroid magma source matches the 3D measurements and provides the most realistic magma model for the recent magma intrusion. Similar to the north component, the residuals of the east and up components were lower in the spheroid model than in the dislocation model. The residual to observation ratios for the east, north, and up components were approximately 0.45, 0.37, and 0.13, respectively.
Figure 7.
Inversion results of the prolate spheroid model for the magma source below Kīlauea’s summit using 3D measurements. The first row shows the (a) observed, (b) synthetic, and (c) residual deformation of the east component. The second row shows the (d) observed (e) synthetic, and (f) residual deformation of the north component. The third row shows the (g) observed, (h) synthetic, and (i) residual deformation of the up component.
The best-fit parameters of the spheroid model are summarized in
Table 3. The magma source’s X- and Y-positions, depth, pressure, major and minor axes, strike, and plunge were determined from the 3D-based modeling. The magma pressure estimated from the modeling has been converted to a volumetric change using the conversion equation in [
27]. Although the X- and Y-positions of the magma source are similar to the best-fit model parameters of the dislocation model,
i.e., −155.288 degrees longitude and 19.388 degrees latitude, the depth of the source, approximately 2.81 km below the surface, is quite different. The strike and plunge of the source were estimated to be approximately N64E and 8.3 degrees, respectively. The orientation angles of the two models are similar, differing by only approximately three degrees. The reservoir’s volume change due to magma intrusion was calculated to be 5.20 × 10
6 m
3 based on the estimated pressure change.
Table 3.
The best-fit prolate spheroid model parameters of Kīlauea’s magma source.
Table 3.
The best-fit prolate spheroid model parameters of Kīlauea’s magma source.
| Prolate Spheroid Model Parameters |
|---|
| Pos-X* (lon.) | Pos-Y* (lat.) | Depth (km) | Volume Change (×106 m3) | Major Axis (km) | Minor Axis (km) | Strike (deg.) | Plunge (deg.) |
|---|
| −155.288 ± 1.042e−04 | 19.388 ± 5.75e−05 | 2.813 ± 0.012 | 5.210 ± 0.056 | 3.142 ± 0.044 | 2.139 ± 0.048 | 64.265 ± 0.603 | 8.306 ± 0.464 |
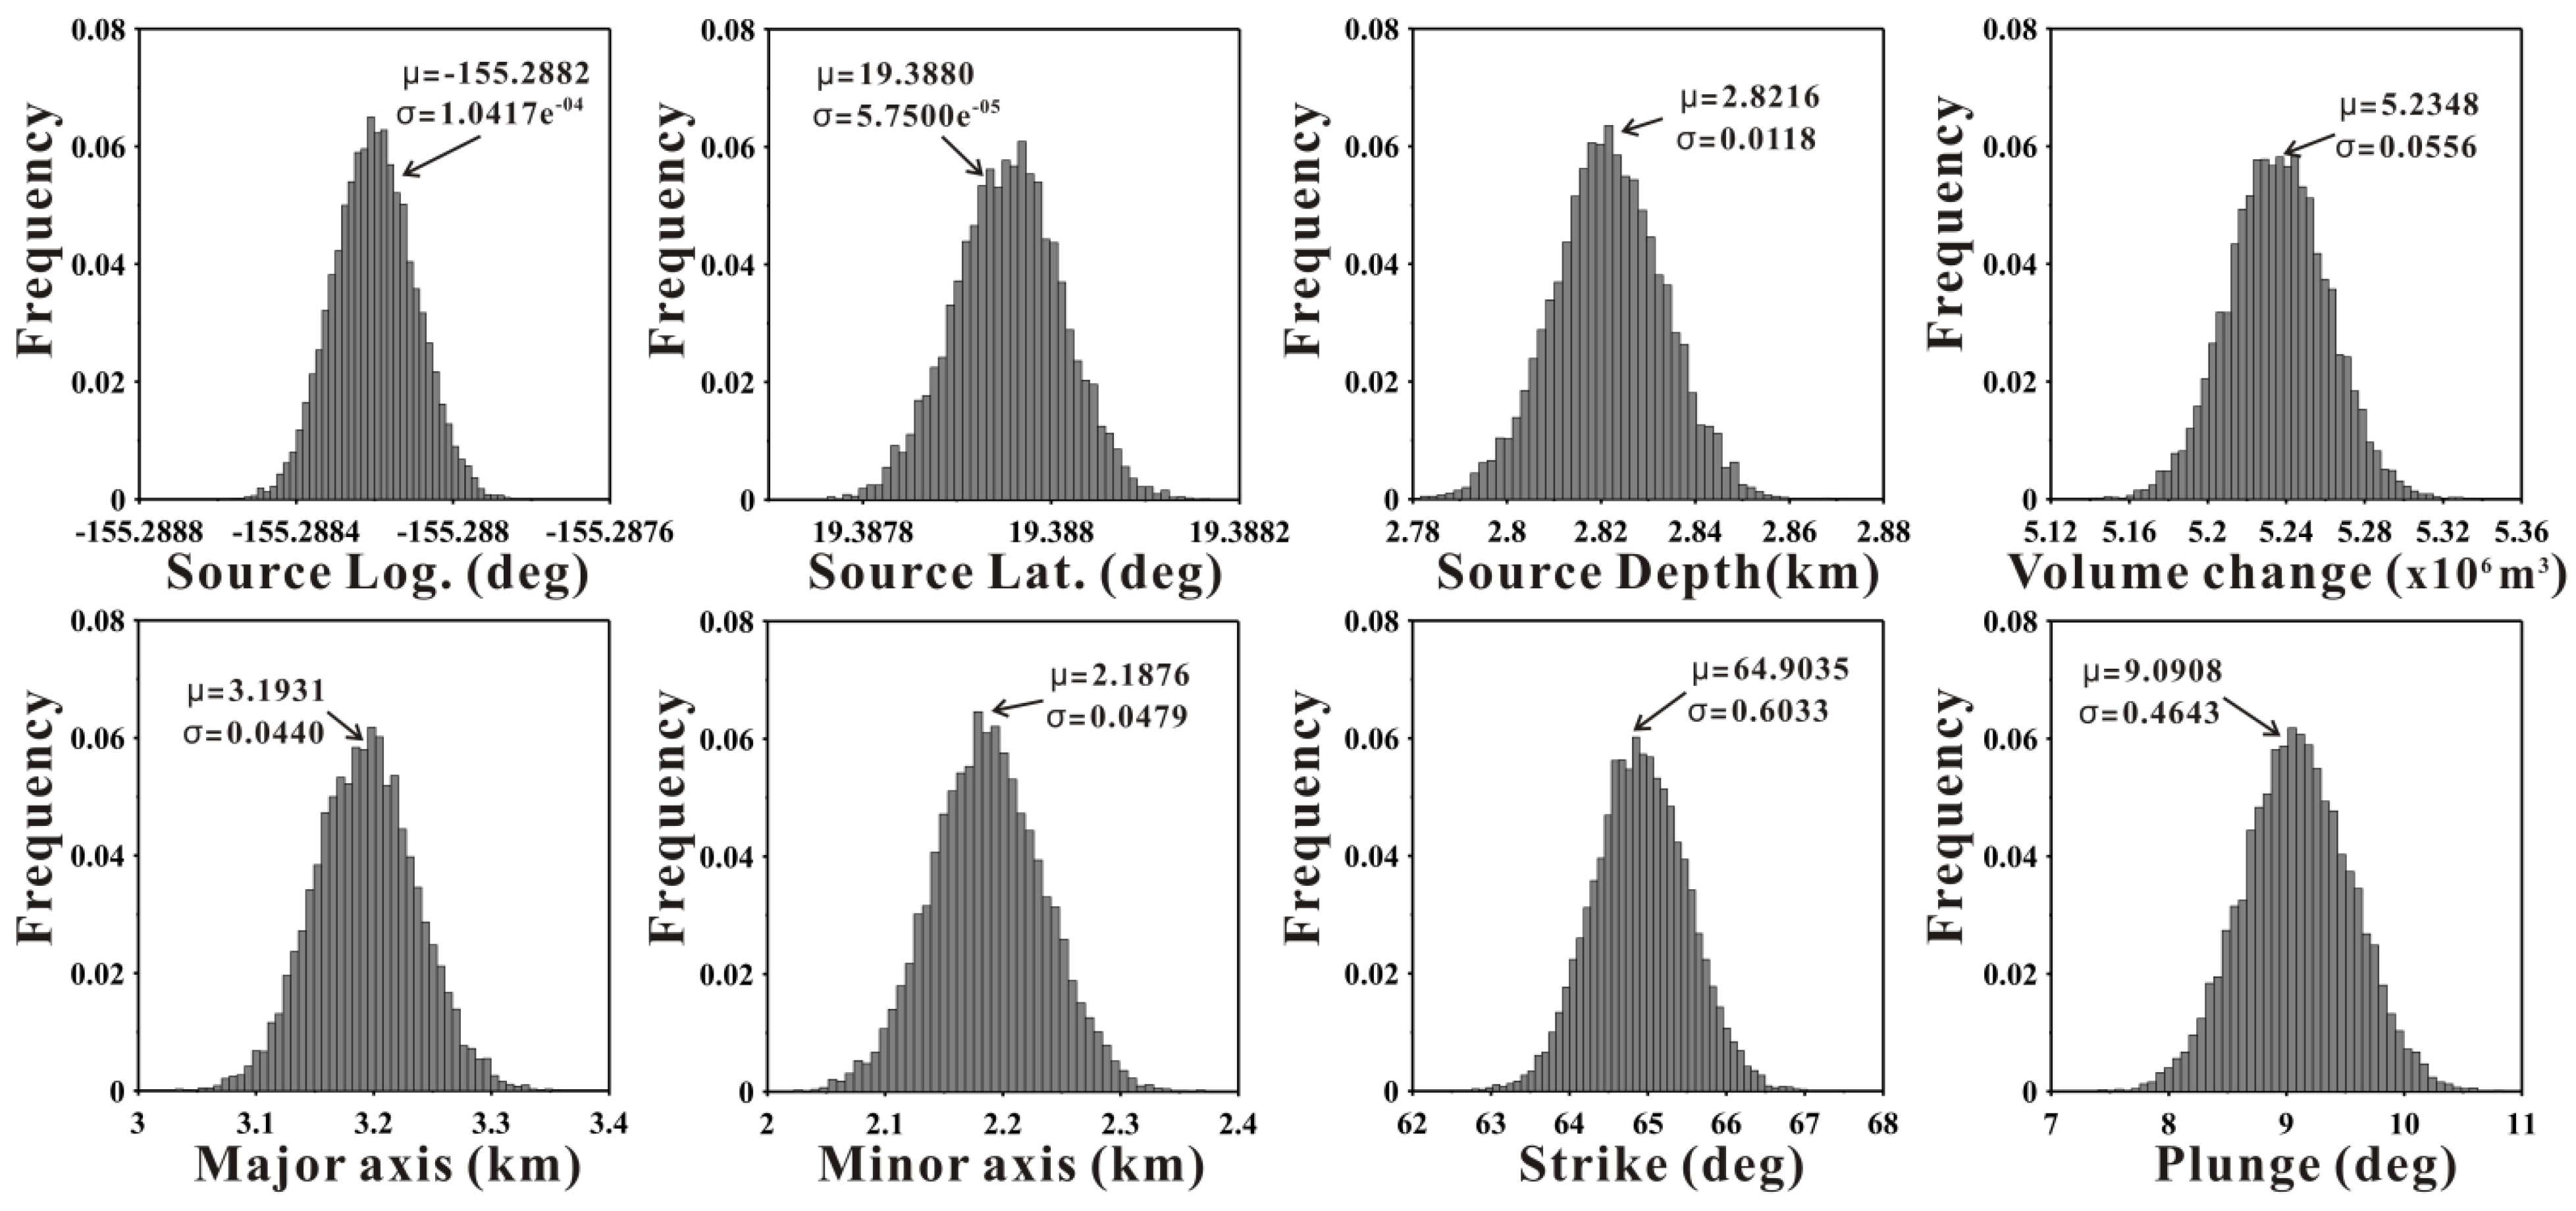
Figure 8 shows the histograms of the parameter estimations using a spheroid model. Ten thousand iterations were performed to determine the best-fit model parameters. Unlike the simulation results of the dislocation model, all the parameters converge on unique values with very small standard deviations. Therefore, the spheroid model is in good agreement with the magma source. In particular, the source position and orientation parameters are clearly determined by the spheroid model, unlike the parameters in the Okada model that exhibited multimodal histograms.
Figure 8.
Histograms of the magma source parameters estimated from the 3D measurement inputs using prolate spheroid model.
Figure 8.
Histograms of the magma source parameters estimated from the 3D measurement inputs using prolate spheroid model.
Based on the previous studies, at least three to four distinct magma sources are responsible for inducing uplift or deflation on Kīlauea [
7,
16,
20,
22]. The magma source related to the recent magma intrusion is most likely coincides with the deep source located near the southwest rift zone, based on the deformation patterns and distribution.
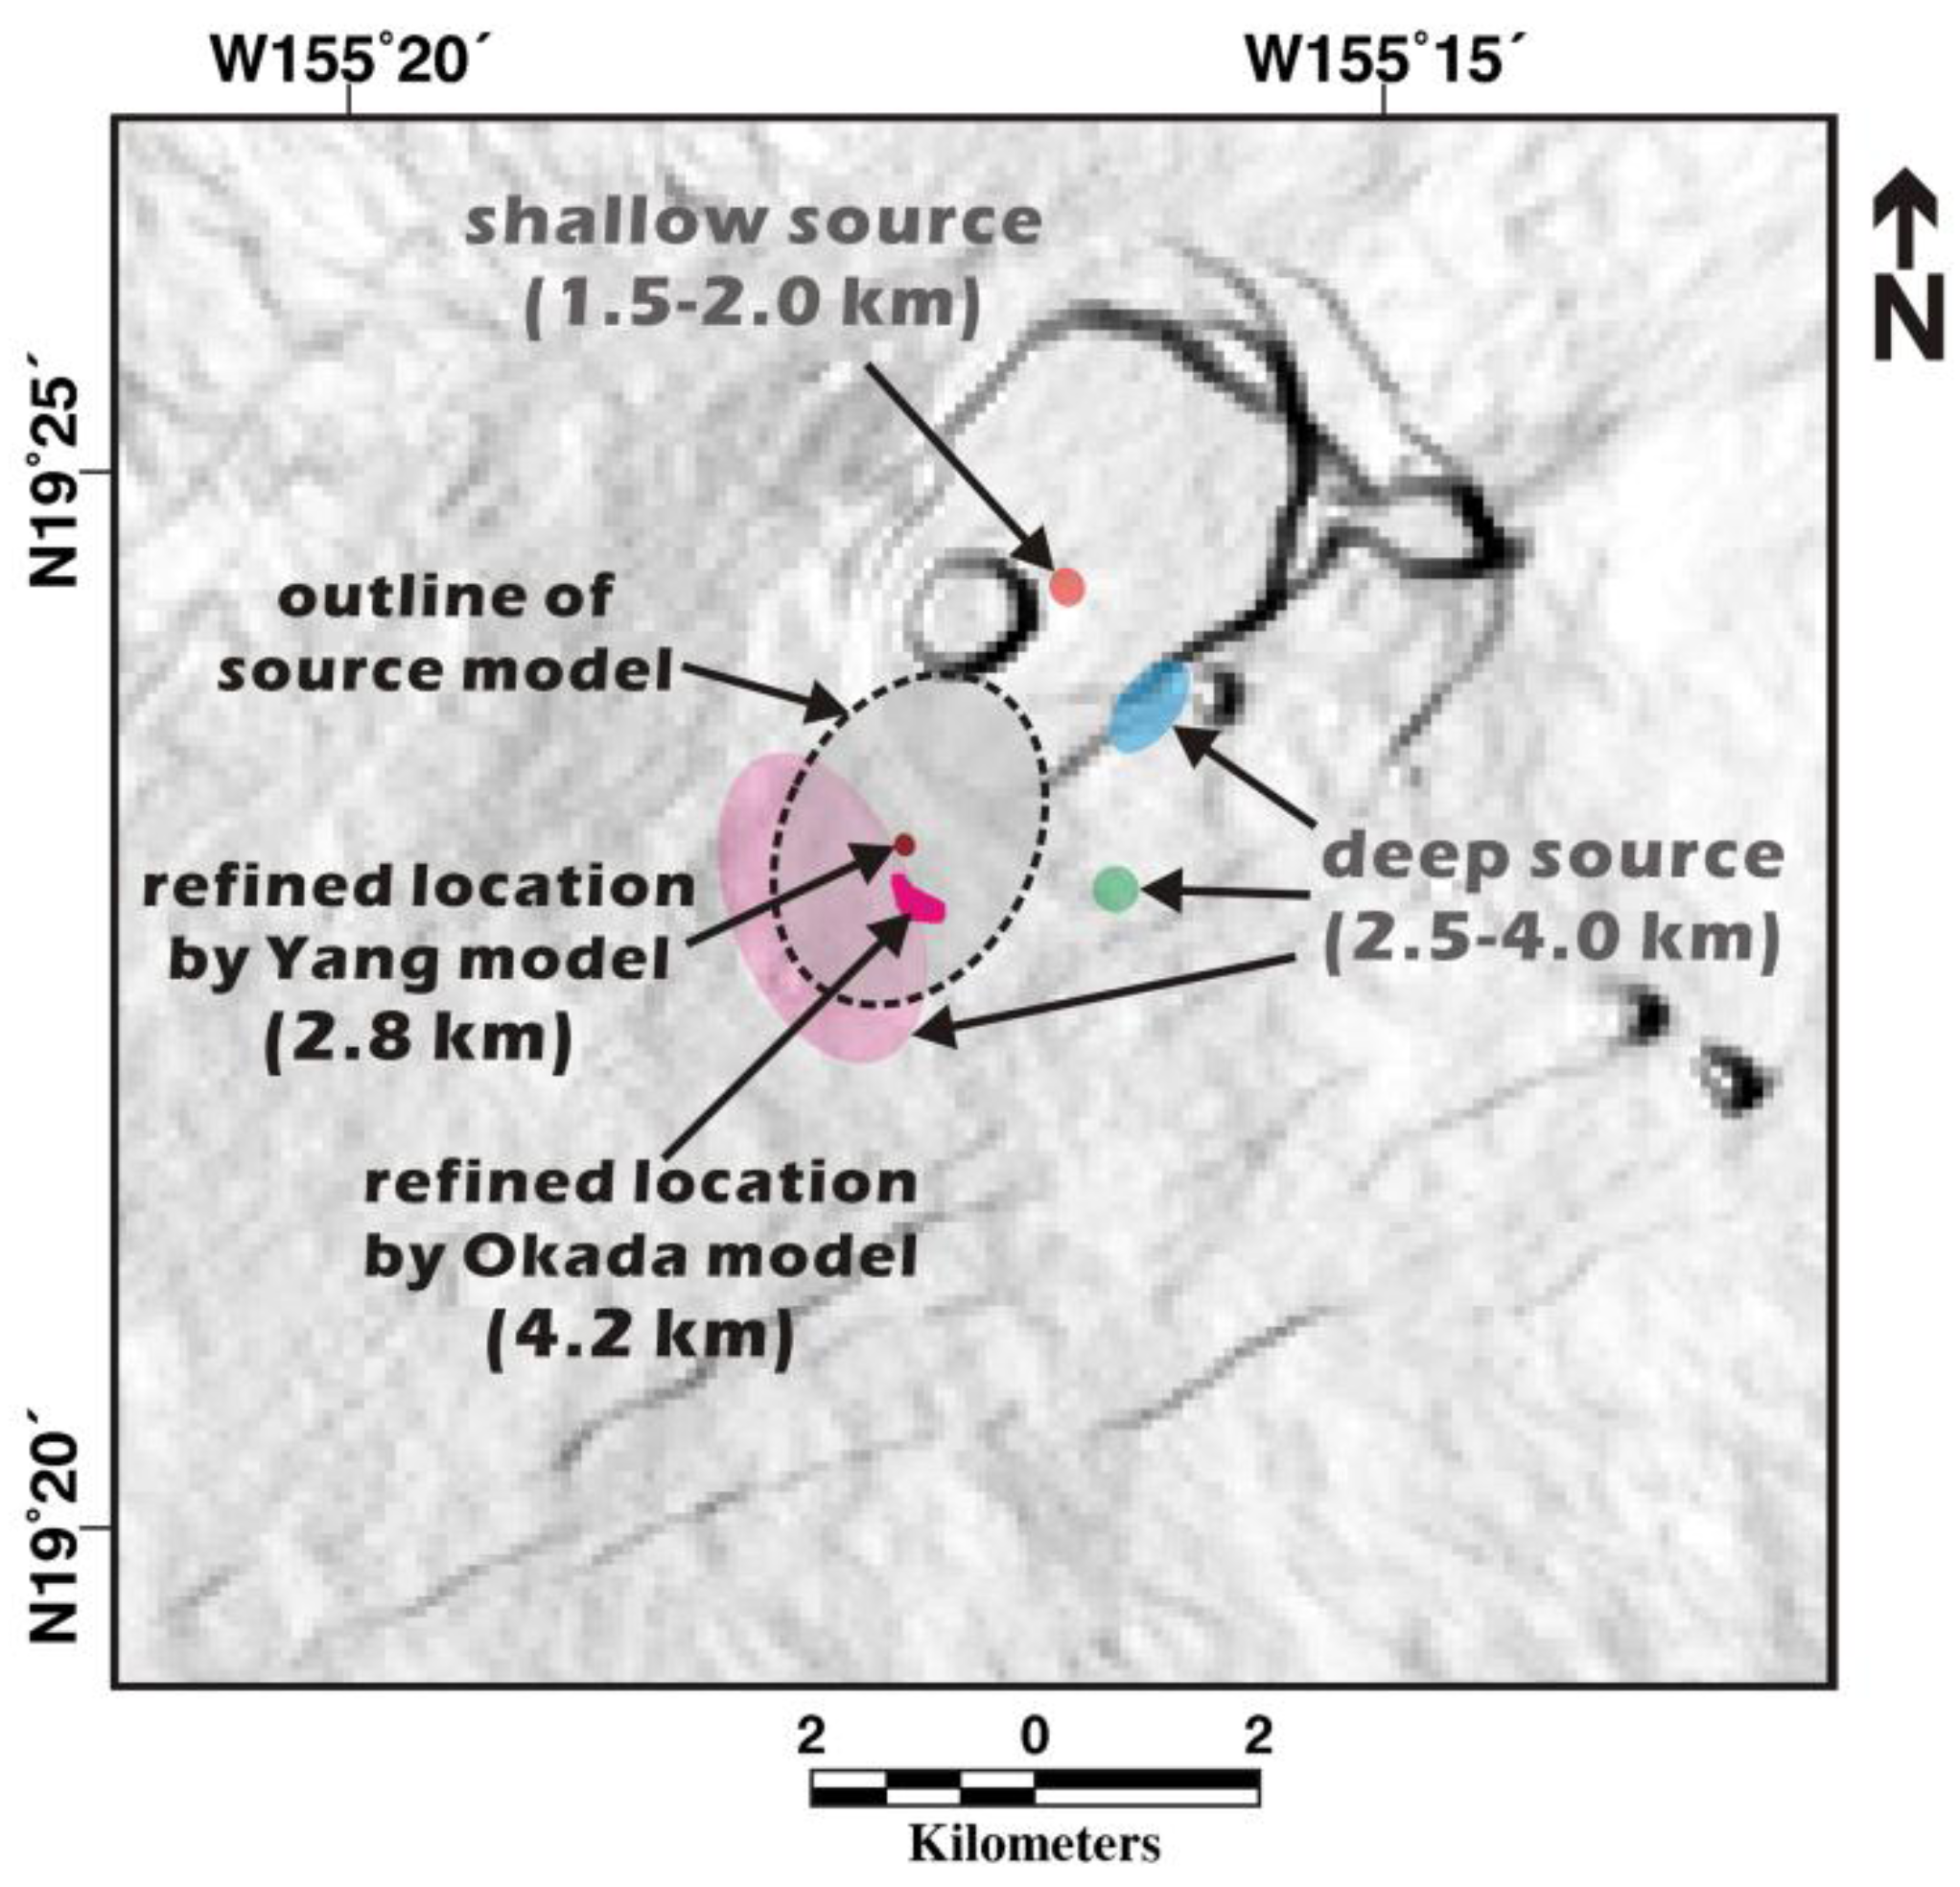
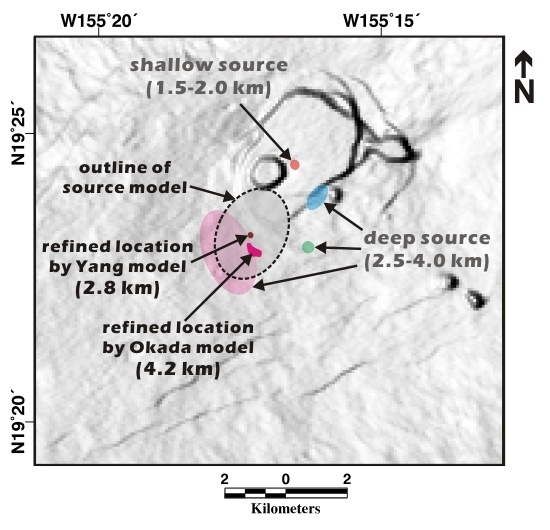
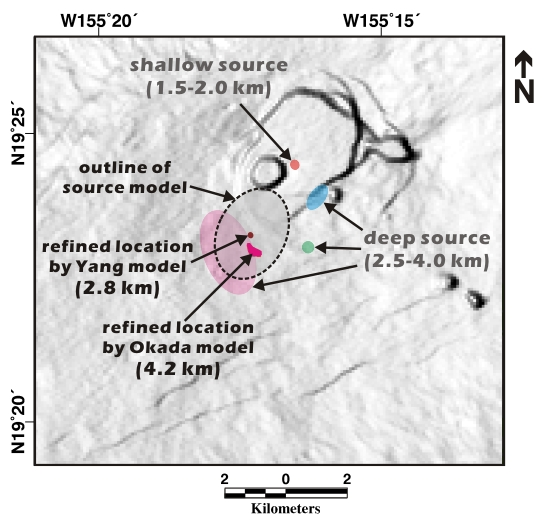
Figure 9 shows the refined magma source locations estimated from our 3D-based modeling and previously defined source locations from an earlier study [
20]. The areas with colors represent the locations of sources below Kīlauea’s summit. The extent of the color boundaries correspond to the uncertainty associated with each source location. In other words, a large area of color indicates a relatively uncertain location of the magma source.
In
Figure 9, the source very close to the Halema‘uma‘u crater is the shallow magma reservoir, which lies at a depth of approximately 1.5–2.0 km below the surface [
14,
16,
22]. Only this shallow reservoir is presumed to be a point source with a spherical or spheroid shape; the others located at depths of 2.5–4.0 km are presumed to be penny-shaped or rectangular sources. The magma source represented by the large light-red ellipsoid is the deepest source beneath Kīlauea’s summit and is related to the magma source involved in the recent volcanic event. The two small areas that are very close to the light-red ellipsoid are the magma source locations from our modeled results. These source locations do not differ significantly from the previous location, but much better precision can be obtained using 3D-based modeling. In particular, the 3D-based model based on a spheroid source provided almost identical source positions in ten thousand Monte-Carlo simulations. The ellipsoid with the dashed outline represents the modeled magma source with the best-fit model parameters based on a spheroid source. The best-fit spheroid model involves a magma body at approximately 2.8 km depth, which is >1 km shallower than the previous estimate.
Figure 9.
Refined magma source locations estimated from the 3D displacement maps using rectangular dislocation (Okada) model and prolate spheroid (Yang) model. Areas with colors indicate the source locations below Kīlauea’s summit, as defined by a previous study [
20] and our results. The dashed outline represents the magma source boundary of the spheroid model.
5. Conclusions
We have retrieved 3D surface deformation components by integrating multi-stacked InSAR and MAI measurements of the deformation induced by recent magma intrusion at Kīlauea, Hawai‘i. COSMO-SkyMed X-band SAR data from ascending and descending orbits was collected before and after the period of unrest from April to May 2015 to observe uplift associated with the intrusion of magma. From the 3D measurements, we clearly identified deformation patterns and the boundary of deformed regions, enabling us to identify the center of the deformation, which is located slightly to the south of the Kīlauea caldera. The maximum displacement induced by this volcanic event was approximately 8.2, −13.8, and 11.6 cm in the east, north, and up directions, respectively.
In this study, model parameters of the magma reservoir have been estimated using 3D measurement inputs. Two different magma source models, the Okada and prolate spheroid models, were employed to determine the appropriate magma model for this minor event, and the best-fit model parameters were determined using ten thousand iterative simulations. Through comparison with the model parameters in previous studies, a similar position of the magma chamber was determined, but the uncertainties were markedly diminished through the modeling of the 3D measurement inputs. The source location based on the best-fit dislocation model is approximately −155.287 degrees longitude and 19.382 degrees latitude and lies at a depth of approximately 4.25 km beneath the surface. The source location of the best-fit spheroid model is approximately −155.288 degrees longitude and 19.388 degrees latitude. Although the depth of the dislocation model is quite similar to that in the previous investigation, the best-fit estimate of the spheroid model suggests a relatively shallow depth of the magma source, approximately 2.8 km beneath the surface. The source dimensions and depth are differ somewhat from the previous report, but they exist within a reasonable range.
This minor volcanic event is characterized by complex magma behavior during a short time period. Thus, it is not easy to define the characteristics of the magma source, and a certain risk of oversimplification exists in the model parameter estimation. However, we expect that measuring precise 3D displacements and magma model determinations will provide guidance as a first attempt for this volcanic event. If we update the geometry and the conditions of the magma source using 3D-based modeling, the results will be helpful in better understanding of complex magmatic systems.


