
Remote Sensing Analysis Techniques and Sensor Requirements to Support the Mapping of Illegal Domestic Waste Disposal Sites in Queensland, Australia

Abstract
:
1. Introduction
1.1. Geography of Illegal Waste Disposal Sites
- sociocultural acceptability of illegal waste disposal [10]
1.2. Threats Posed by Illegal Waste
1.3. The Need for Improved Management of Illegal Waste
2. Review of Remote Sensing Based Methods for Mapping Illegal Waste Disposal Sites
2.1. Overview of Illegal Waste Monitoring and Mapping Methods Utilizing Aerial Photography

| Sensor Specifications | |||
|---|---|---|---|
| Sensor | Spectral Range (Wavelength Width of Different Frequency Bands) | Pixel Size | Temporal Resolution |
| Optical sensors (moderate spatial resolution) | |||
| LANDSAT TM [27] | 0.45–0.52 µm (band 1) 0.52–0.60 µm (band 2) 0.63–0.69 µm (band 3) 0.76–0.90 µm (band 4) 1.55–1.75 µm (band 5) 10.4–12.5 µm (band 6, thermal) 2.08–2.35 µm (band 7) | 30 m 120 m (thermal) | 16 days |
| Optical sensors (medium spatial resolution) | |||
| FORMOSAT-2 [24] | 0.45–0.90 µm (panchromatic) 0.45–0.52 µm (blue) 0.52–0.60 µm (green) 0.63–0.69 µm (red) 0.76–0.90 µm (near-infrared) | 2 m (panchromatic) 8 m (multispectral) | 1 day |
| ALOS AVNIR-2 [23] | 0.42–0.50 µm (blue) 0.52–0.60 µm (green) 0.61–0.69 µm (red) 0.76–0.89 µm (near-infrared) | 10 m | 46 days |
| Microwave sensors (medium spatial resolution) | |||
| ALOS PALSAR [23] | 1.3 GHz or 23 cm | 10 m 100 m | 46 days |
| Optical sensors (high to very high spatial resolution) | |||
| ALOS PRISM [23] | 0.52–0.77 µm | 2.5 m | 46 days |
| QUICKBIRD [28] | 0.45–0.90 µm (panchromatic) 0.45–0.52 µm (blue) 0.52–0.60 µm (green) 0.63–0.69 µm (red) 0.76–0.90 µm (near-infrared) | 0.65 m (panchromatic) 2.62 m (multispectral) | 1–3.5 days |
| IKONOS [25,26] | 0.45–0.90 µm (panchromatic) 0.45–0.52 µm (blue) 0.51–0.60 µm (green) 0.63–0.70 µm (red) 0.76–0.85 µm (near-infrared) | 0.82 m (panchromatic) 3.2 m (multispectral) | 3 days |
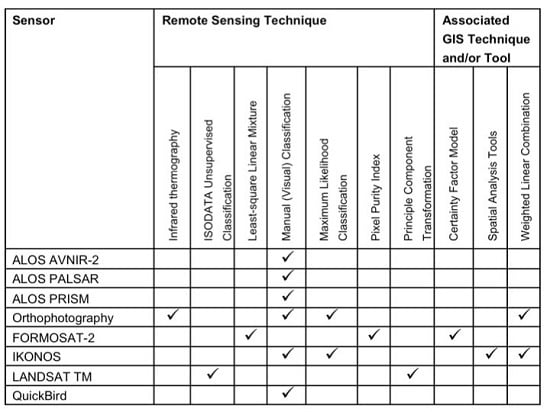
| Sensor | Remote Sensing Technique | Associated GIS Technique and/or Tool | ||||||||
|---|---|---|---|---|---|---|---|---|---|---|
| Infrared thermography | ISODATA Unsupervised Classification | Least-square Linear Mixture | Manual (Visual) Classification | Maximum Likelihood Classification | Pixel Purity Index | Principle Component Transformation | Certainty Factor Model | Spatial Analysis Tools | Weighted Linear Combination | |
| ALOS AVNIR-2 | [29] | |||||||||
| ALOS PALSAR | [29] | |||||||||
| ALOS PRISM | [29] | |||||||||
| Digital orthophotography | [31] | [2,21] | [18] | [2] | ||||||
| FORMOSAT-2 | [20] | [20] | [20] | |||||||
| IKONOS | [1,3] | [1,3] | [1] | [3] | ||||||
| LANDSAT TM | [21] | [21] | ||||||||
| QuickBird | [29] | |||||||||
2.2. Overview of Illegal Waste Monitoring and Mapping Methods Utilizing Moderate Resolution Satellite Data
2.3. Overview of Illegal Waste Monitoring and Mapping Methods Using Medium Resolution Satellite Data
2.4. Overview of Illegal Waste Monitoring and Mapping Methods Utilizing High- to Very-High-Resolution Satellite Data
2.5. Overview of Illegal Waste Monitoring and Mapping Methods Incorporating Remote Sensing Analysis and other Spatial Data in a Geographic Information System
3. Discussion
3.1. Applicability of Existing Remote Sensors for Monitoring and Mapping Illegal Domestic Waste Disposal
3.2. Applicability of Existing Remote Sensing Analysis Methods for Monitoring and Mapping Illegal Domestic Waste Disposal
3.3. Applicability of New or Upcoming Remote Sensors for Monitoring and Mapping Illegal Domestic Waste Disposal
| Sensor Specifications | |||
|---|---|---|---|
| Satellite and Sensor | Spectral Range (Wavelength Width of Different Frequency Bands) | Pixel Size | Swatch Width |
| CARTOSAT-2E Panchromatic Camera (PAN) | 0.5–0.75 µm (panchromatic) | 0.65 m | 9 km |
| Pleiades 1A High-Resolution Imager (HiRI) | 0.47–0.84 μm (panchromatic) 0.44–0.54 μm (blue) 0.50–0.60 μm (green) 0.61–0.71 μm (red) 0.77–0.91 μm (near-infrared) | 0.7 m | 20 km |
| Pleiades 1B High-Resolution Imager (HiRI) | 0.47–0.84 μm (panchromatic) 0.44–0.54 μm (blue) 0.50–0.60 μm (green) 0.61–0.71 μm (red) 0.77–0.91 μm (near-infrared) | 0.7 m | 20 km |
| KOMPSAT-3 Advanced Electronic Image Scanning System (AEISS) | 0.50–0.90 μm (panchromatic) 0.45–0.52 μm (blue) 0.52–0.60 μm (green) 0.63–0.69 μm (red) 0.76–0.90 μm (near-infrared) | 0.8 m (panchromatic) 4 m (multispectral) | 15 km |
| Environmental Satellite Resurs: P N1 DK 1 Geoton-L1 | 0.58–0.8 μm (panchromatic) 0.45–0.52 μm (blue) 0.52–0.60 μm (green) 0.61–0.68 μm (red) 0.72–0.80 μm (near-infrared) 0.80–0.90 μm (near-infrared) | 1 m 3 m | |
| Environmental Satellite Resurs: P N2 DK 1 Geoton-L1 | 0.58–0.8 μm (panchromatic) 0.45–0.52 μm (blue) 0.52–0.60 μm (green) 0.61–0.68 μm (red) 0.72–0.80 μm (near-infrared)0.80–0.90 μm (near-infrared) | 1 m 3 m | |
| Environmental Satellite Resurs: P N3 DK 1 Geoton-L1 | 0.58–0.8 μm (panchromatic) 0.45–0.52 μm (blue) 0.52–0.60 μm (green) 0.61–0.68 μm (red) 0.72–0.80 μm (near-infrared) 0.80–0.90 μm (near-infrared) | 1 m 3 m | |
| KOMPSAT-2 Multi-Spectral Camera (MSC) | 0.50–0.90 μm (panchromatic) 0.45–0.52 μm (blue) 0.52–0.60 μm (green) 0.63–0.69 μm (red) 0.76–0.90 μm (near-infrared) | 1 m (panchromatic) 4 m (multispectral) | 15 km |
| CARTOSAT-2 Panchromatic Camera (PAN) | 0.5–0.75 μm (panchromatic) | 1 m | 10 km |
| CARTOSAT-2A Panchromatic Camera (PAN) | 0.5–0.75 μm (panchromatic) | 1 m | 10 km |
| CARTOSAT-2B Panchromatic Camera (PAN) | 0.5–0.75 μm (panchromatic) | 1 m | 10 km |
| ALOS-2 PALSAR-2 | 1270 MHz or 24 cm | 1 m (in spotlight mode) | 25 km (in spotlight mode) |
| COSMO-SkyMed 1-4 Synthetic Aperture Radar (SAR) | 9.6 GHz or 3 cm | 1 m (in spotlight mode) | 10 km (in spotlight mode) |
| KOMPSAT-5 Corea Synthetic Aperture Radar (COSI) | Microwave | 1 m | 100 km |
| Sensor Specifications | ||||
|---|---|---|---|---|
| Satellite and Sensor | Spectral Range (Wavelength Width of Different Frequency Bands) | Pixel Size | Swatch Width | Launch Date |
| CARTOSAT-3 Panchromatic Sensor | 0.5–0.75 μm (panchromatic) | 0.3 m | 15 km | 2018 |
| KOMPSAT-3A Advanced Electronic Image Scanning System-A (AEISS-A) | 0.5–0.9 μm (panchromatic) 0.45–0.52 μm (blue) 0.52–0.60 μm (green) 0.63–0.69 μm (red) 0.76–0.90 μm (near-infrared) | 0.8 m (panchromatic) 4 m (multispectral) 5.5 m (near-infrared) | 15 km | December 2014 |
| PAZ X Band Synthetic Aperture Radar (SAR-X) | 9.65 GHz or 3 cm | <1 × 1 m | 5 km | March 2015 |
| Meteor-M Oceanographical Satellite N3 Synthetic Aperture Radar X Band | X-Band | 1 m | 10 km | December 2016 |
| Sensor Specifications | ||||
|---|---|---|---|---|
| Satellite and Sensor | Spectral Range (Wavelength Width of Different Frequency Bands) | Pixel Size | Swatch Width | Launch Date |
| TerraSAR Next Generation (TSX-NG) X Band Synthetic Aperture Radar | 9.65 GHz–1200 MHz or 3 cm–25 cm | 0.25 m (HR Spotlight mode) | 5 × 10 km (HR Spotlight mode) | 2018 |
| OPtical System for Imagery and Surveillance (OPSIS) Very High Resolution Panchromatic Camera | 0.45–0.90 μm (panchromatic) 0.45–0.52 μm (blue) 0.52–0.60 μm (green) 0.63–0.69 μm (red) 0.76–0.90 μm (near-infrared) | 0.5 m (panchromatic) 2 m (multispectral) | 10 km | 2017 |
| High Resolution Wide Swath (HRWS) X-Band Digital Beamforming Synthetic Aperture Radar | 9.65 GHz–1200 MHz or 3 cm–25 cm | 0.25 × 0.5 m (VHR mode); 0.5 m (HR Stripmap mode) 1 m (Stripmap mode) | 10 km (VHR Mode) 20 km (HR Stripmap mode) 70 km (Stripmap mode) | 2022 |
| Cartography Satellite-2E (CARTOSAT-2E) High Resolution Multi Spectral (HRMX) | VIR and NIR | 0.65 m2 m | 10 km | 2016 |
| HY-3A Synthetic Aperture Radar (WSAR) | 8–12 GHz or 2.5–3.7 cm | 1 m | 40 km | 2015 |
| HY-3B Synthetic Aperture Radar (WSAR) | 8–12 GHz or 2.5–3.7 cm | 1 m | 40 km | 2017 |
| HY-3C Synthetic Aperture Radar (WSAR) | 8–12 GHz or 2.5–3.7 cm | 1 m | 40 km | 2022 |
4. Conclusion
Acknowledgments
Author Contributions
Conflicts of Interest
References
- Silvestri, S.; Omri, M. A method for the remote sensing identification of uncontrolled landfills: Formulation and validation. Int. J. Remote Sens. 2007, 29, 975–989. [Google Scholar] [CrossRef]
- Romeo, V.; Brown, S.; Stuver, S. A GIS analysis of illegal dumping in the 78249 Zip Code of Bexar County, Texas. In Proceedings of Esri International User Conference, San Diego, CA, USA, 7–11 July 2003.
- Biotto, G.; Silvestri, S.; Gobbo, L.; Furlan, E.; Valenti, S.; Rosselli, R. GIS, multi-criteria and multi-factor spatial analysis for the probability assessment of the existence of illegal landfills. Int. J. Geogr. Inf. Sci. 2009, 23, 1233–1244. [Google Scholar] [CrossRef]
- Jordá-Borrell, R.; Ruiz-Rodríguez, F.; Lucendo-Monedero, Á.L. Factor analysis and geographic information system for determining probability areas of presence of illegal landfills. Ecol. Indic. 2014, 37, 151–160. [Google Scholar] [CrossRef]
- Uricchio, V.; Palmisano, V.; Lopez, N.; Bruno, D. A centralized management data to prevention of environmental crimes fight: the Altamura case. In Proceedings of IEEE Workshop on Environmental, Energy, and Structural Monitoring Systems, Taranto, Italy, 9 September 2010; pp. 59–64.
- Tasaki, T.; Kawahata, T.; Osako, M.; Matsui, Y.; Takagishi, S.; Morita, A.; Akishima, S. A GIS-based zoning of illegal dumping potential for efficient surveillance. Waste Manage. 2007, 27, 256–267. [Google Scholar] [CrossRef] [PubMed]
- Ichinose, D.; Yamamoto, M. On the relationship between the provision of waste management service and illegal dumping. Resour. Energy Econ. 2011, 33, 79–93. [Google Scholar] [CrossRef]
- Jones, B. The Geography of Open Dumps in Rural Appalachia. M.Sc. Thesis, Marshall University, Huntington, WV, USA, 2008. [Google Scholar]
- United States Environmental Protection Agency. Illegal Dumping Prevention Guidebook; US EPA Region 5: Chicago, IL, USA, 1998.
- Matos, J.; Oštir, K.; Kranjc, J. Attractiveness of roads for illegal dumping with regard to regional differences in Slovenia. Acta Geogr. Slovenica 2012, 52, 431–451. [Google Scholar] [CrossRef]
- Department of Environment and Heritage Protection Queensland. Queensland’s Litter and Illegal Dumping Action Plan; 2013. Available online: https://www.ehp.qld.gov.au/waste/qld-litter-illegal-dump-action-plan.html (accessed on 8 July 2015).
- Australian Bureau of Statistics. Australian Demographic Statistics; 2014.
- Department of Environment and Heritage Protection Queensland. Facts and maps. Available online: http://wetlandinfo.ehp.qld.gov.au/wetlands/facts-maps/queensland/ (accessed on 8 July 2015).
- Department of Environment and Heritage Protection Queensland. State of Waste and Recycling in Queensland. 2014. Available online: https://www.ehp.qld.gov.au/waste/state-of-waste-report.html (accessed on 8 July 2015). [Google Scholar]
- Doak, M.; Khan, S.; Kelly, G.; Silvestri, S. The use of remote sensing to map illegal landfills at the border of Ireland/Northern Ireland. In Proceedings of International Waste Management and Landfill Symposium, Sardinia, Italy, 1–5 October 2007; pp. 747–748.
- Matsumoto, S.; Takeuchi, K. The effect of community characteristics on the frequency of illegal dumping. Environ. Econ. Policy Stud. 2011, 13, 177–193. [Google Scholar] [CrossRef]
- Tasaki, T.; Matsui, Y.; Kawahata, T.; Osako, M.; Takagishi, S.; Morita, A. Analysis of Geographic Attributes and Probabilities Related to Illegal Dumping. J. Jpn. Soc. Waste Manage. Experts 2004, 15, 1–10. [Google Scholar] [CrossRef]
- Kim, G.; Chang, Y.; Kelleher, D. Unit pricing of municipal solid waste and illegal dumping: An empirical analysis of Korean experience. Environ. Econ. Policy Stud. 2008, 9, 167–176. [Google Scholar] [CrossRef]
- Salleh, J.B.; Tsudagawa, M. Classification of industrial disposal illegal dumping site images by using spatial and spectral information together. In Proceedings of 19th IEEE Instrumentation and Measurement Technology Conference, Anchorage, AK, USA, 21–23 May 2002; pp. 559–563.
- Chu, T.-H.; Lin, M.-L.; Shiu, Y.-S. Risk assessment mapping of waste dumping through a GIS-based certainty factor model combining remotely sensed spectral unmixing model with spatial analysis. In Proceedings of 7th International Conference on Renewable Energy Sources and the 1st International Conference on Environmental Informatics, Kuala Lumpur, Malaysia, 2–4 April 2013; pp. 367–372.
- Notarnicola, C.; Angiulli, A.; Giasi, C. Southern Italy illegal dumps detection based on spectral analysis of remotely sensed data and land cover maps. In Proceedings of Conference on Remote Sensing for Environmental Monitoring, GIS Applications and Geology, Barcelona, Spain, 13 February 2004; Volume 5239, pp. 483–493.
- Department of Environment and Heritage Protection Queensland. Report Littering and Illegal Dumping. Available online: https://www.ehp.qld.gov.au/waste/report-litter-illegal-dumping.html (accessed on 8 July 2015).
- Japan Aerospace Exploration Agency. Advanced Land Observing Satellite “DAICHI” (ALOS). Available online: http://global.jaxa.jp/projects/sat/alos/ (accessed on 8 July 2015).
- National Space Organization (NSPO). Formosat-2. Available online: http://www.nspo.org.tw/2008e/projects/project2/property.htm (accessed on 8 July 2015).
- Digital Globe. Satellite information - IKONOS. 2013. Available online: https://www.digitalglobe.com/resources/satellite-information (accessed on 8 July 2015).
- Geoimage. Satellite: Very high res - IKONOS. 2010. Available online: http://www.geoimage.com.au/satellite/ikonos (accessed on 8 July 2015).
- National Aeronautics and Space Administration Landsat Science: The Thematic Mapper. Available online: http://landsat.gsfc.nasa.gov/?p=3229 (accessed on 8 July 2015).
- Digital Globe. Satellite information - QuickBird. 2013. Available online: https://www.digitalglobe.com/resources/satellite-information (accessed on 8 July 2015).
- Yonezawa, C. Possibility of monitoring of waste disposal site using satellite imagery. J. Integr. Field Sci. 2009, 6, 23–28. [Google Scholar]
- European Space Agency. The Earth Observation Handbook: Key Tables, 2014.
- Persechino, G.; Schiano, P.; Lega, M.; Napoli, R.; Ferrara, C.; Kosmatka, J. Aerospace-based support systems and interoperability: The solution to fight illegal dumping. In Waste Management and the Environment; WIT Press: Southampton, UK, 2010; pp. 203–214. [Google Scholar]
© 2015 by the authors; licensee MDPI, Basel, Switzerland. This article is an open access article distributed under the terms and conditions of the Creative Commons Attribution license (http://creativecommons.org/licenses/by/4.0/).
Share and Cite
Glanville, K.; Chang, H.-C. Remote Sensing Analysis Techniques and Sensor Requirements to Support the Mapping of Illegal Domestic Waste Disposal Sites in Queensland, Australia. Remote Sens. 2015, 7, 13053-13069. https://doi.org/10.3390/rs71013053
Glanville K, Chang H-C. Remote Sensing Analysis Techniques and Sensor Requirements to Support the Mapping of Illegal Domestic Waste Disposal Sites in Queensland, Australia. Remote Sensing. 2015; 7(10):13053-13069. https://doi.org/10.3390/rs71013053
Chicago/Turabian StyleGlanville, Katharine, and Hsing-Chung Chang. 2015. "Remote Sensing Analysis Techniques and Sensor Requirements to Support the Mapping of Illegal Domestic Waste Disposal Sites in Queensland, Australia" Remote Sensing 7, no. 10: 13053-13069. https://doi.org/10.3390/rs71013053