
Retrieval of Land Surface Temperature over the Heihe River Basin Using HJ-1B Thermal Infrared Data


Abstract
:
1. Introduction
2. Methodology
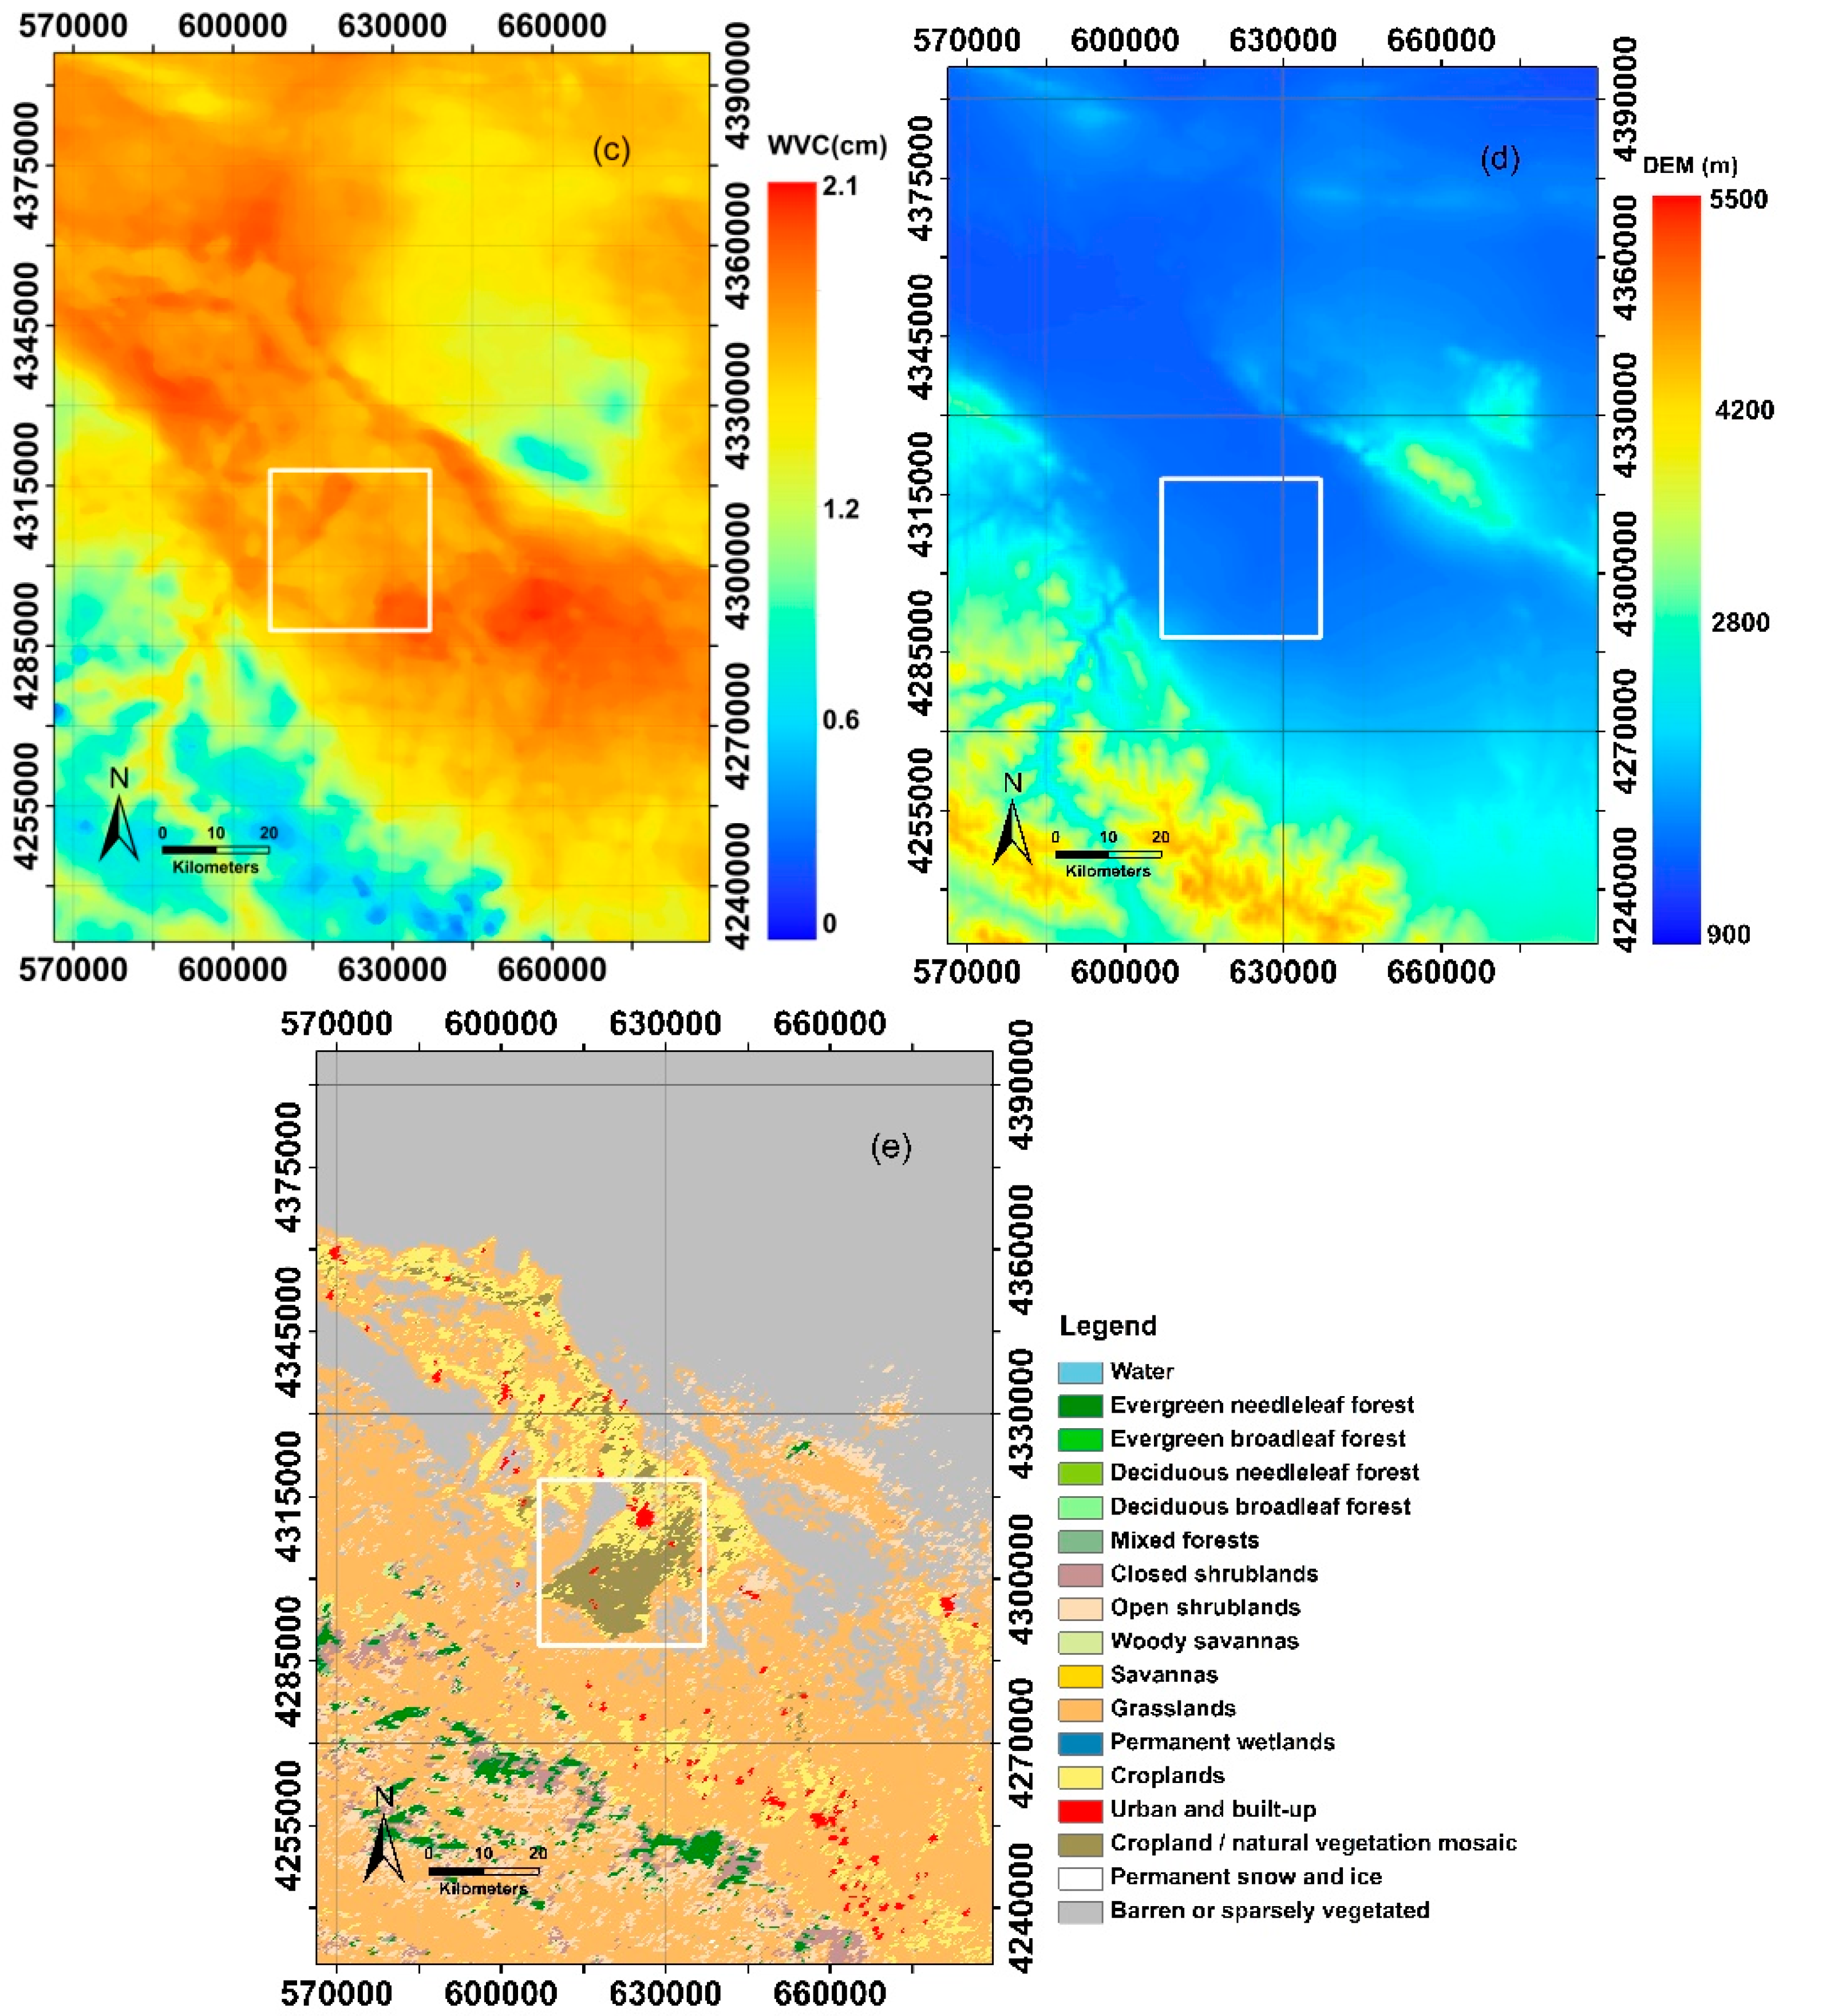
3. Data
3.1. HJ-1B/IRS Data

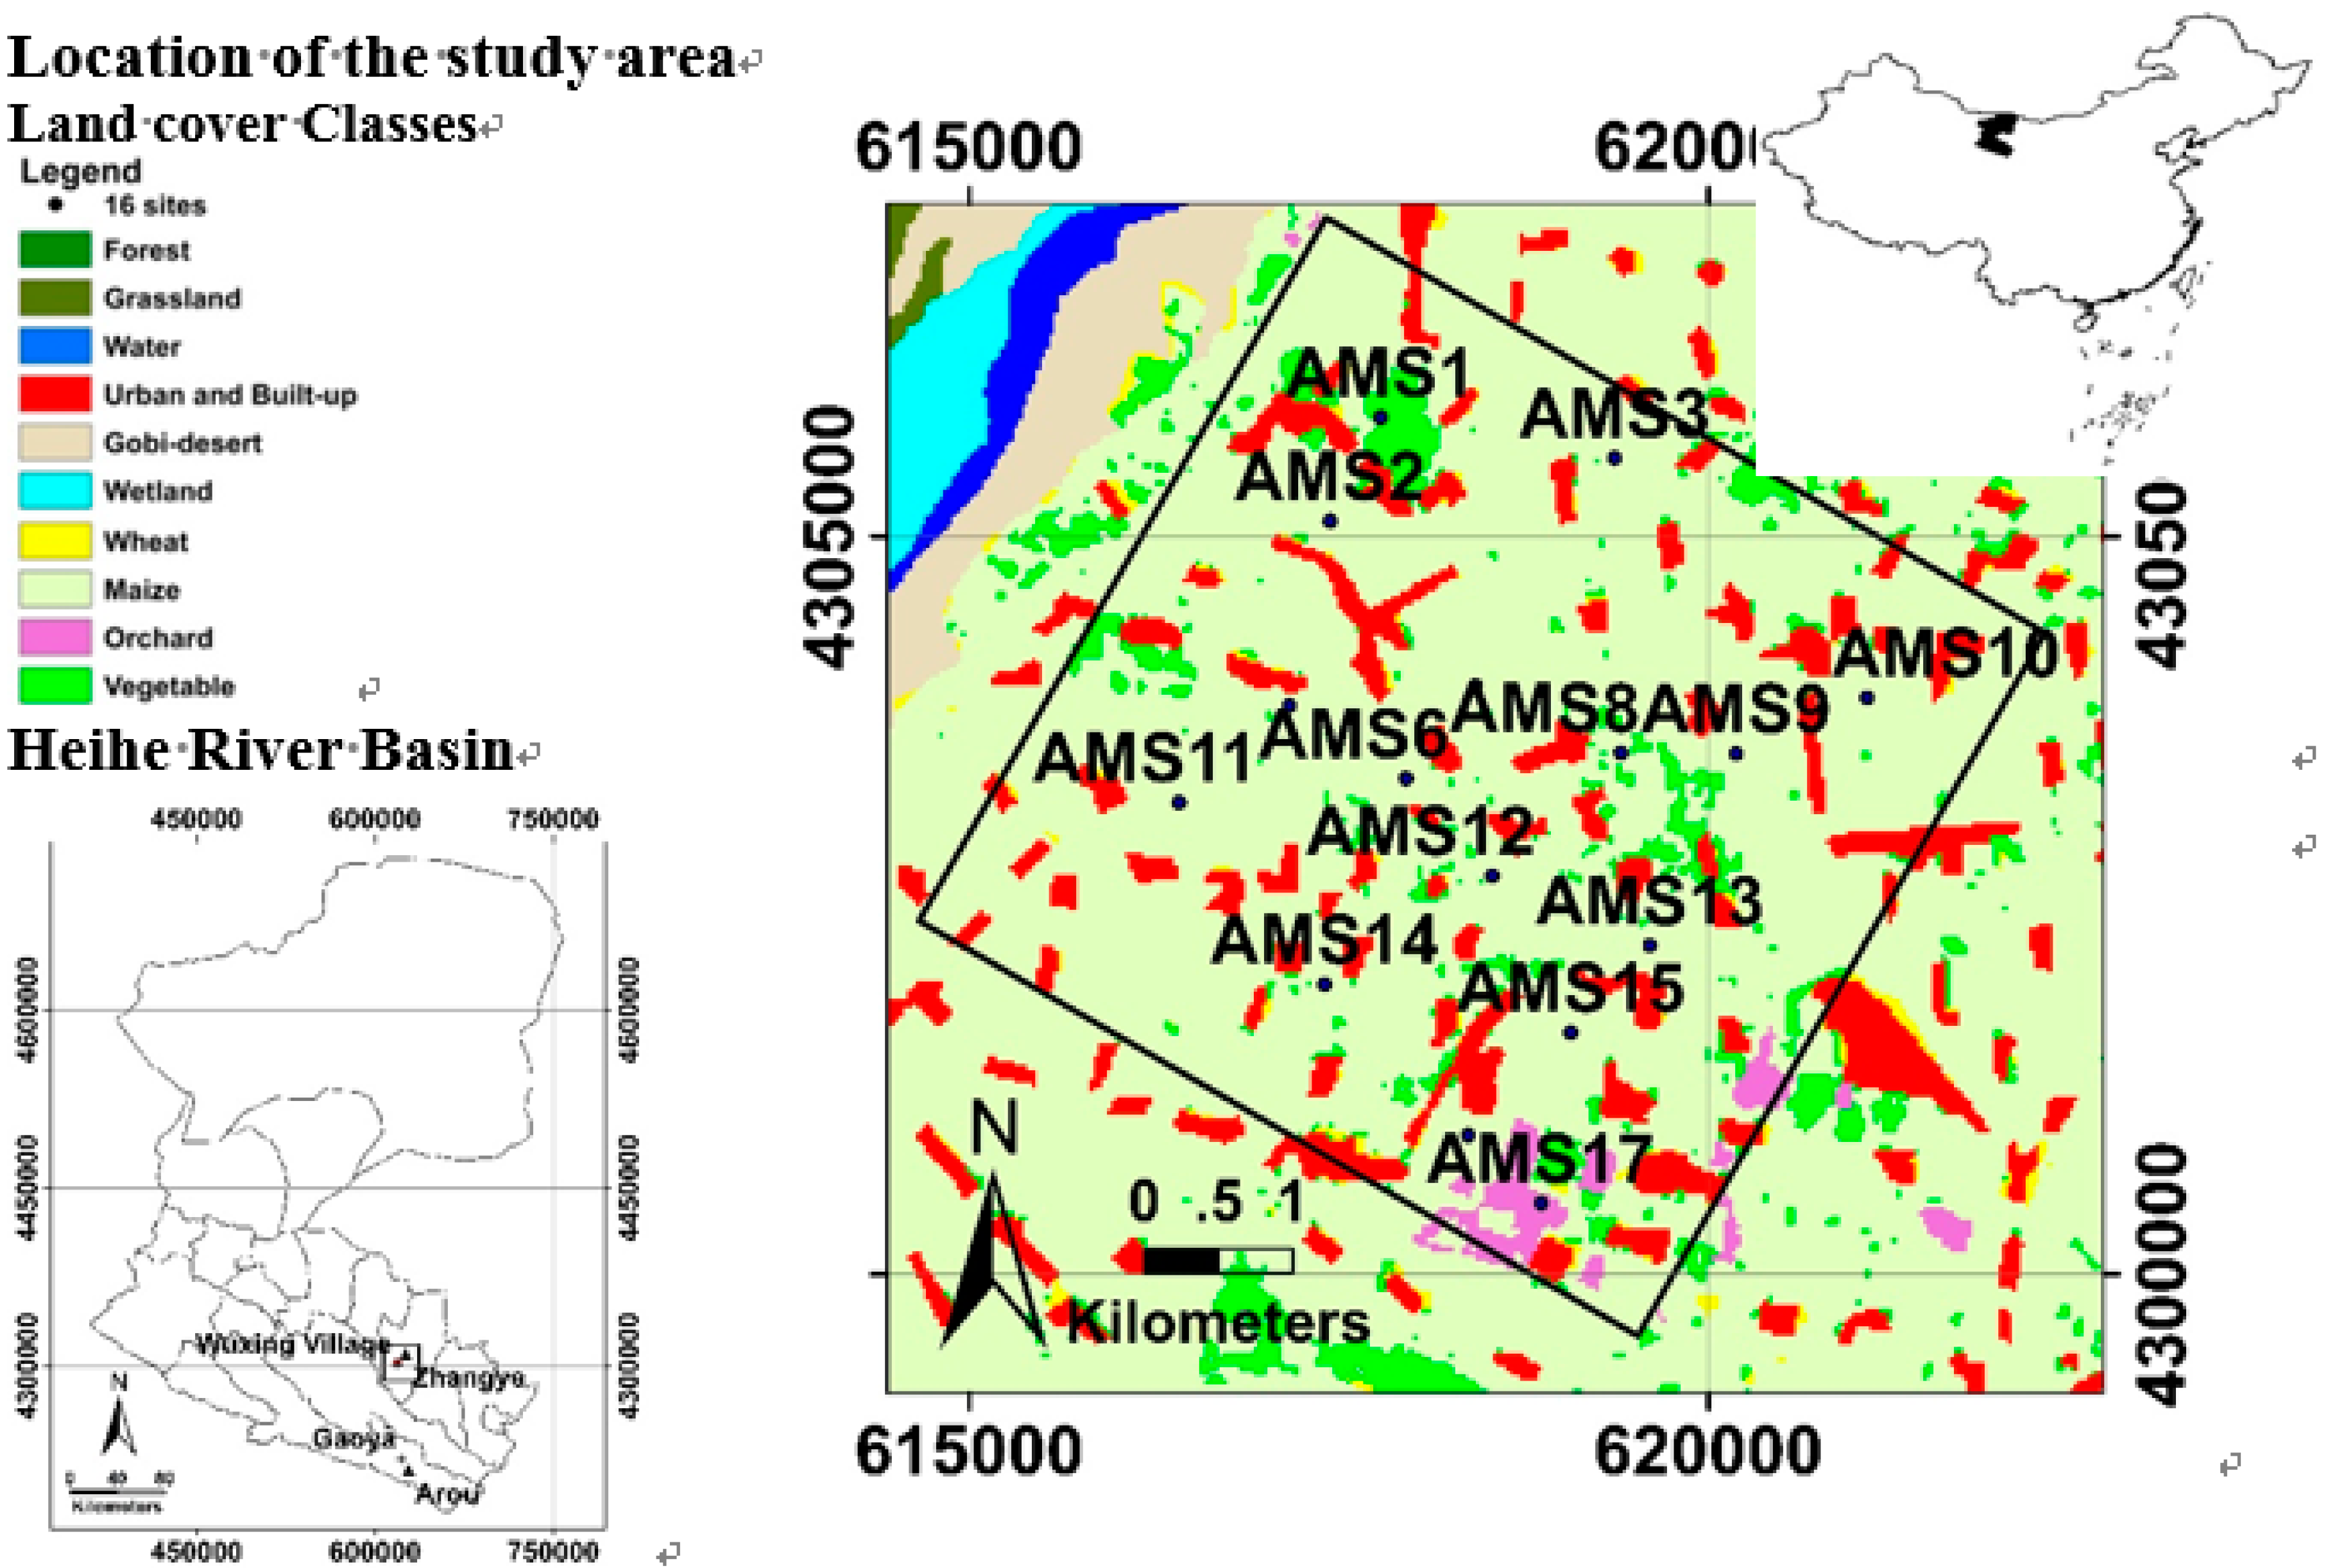
3.2. Ground Data
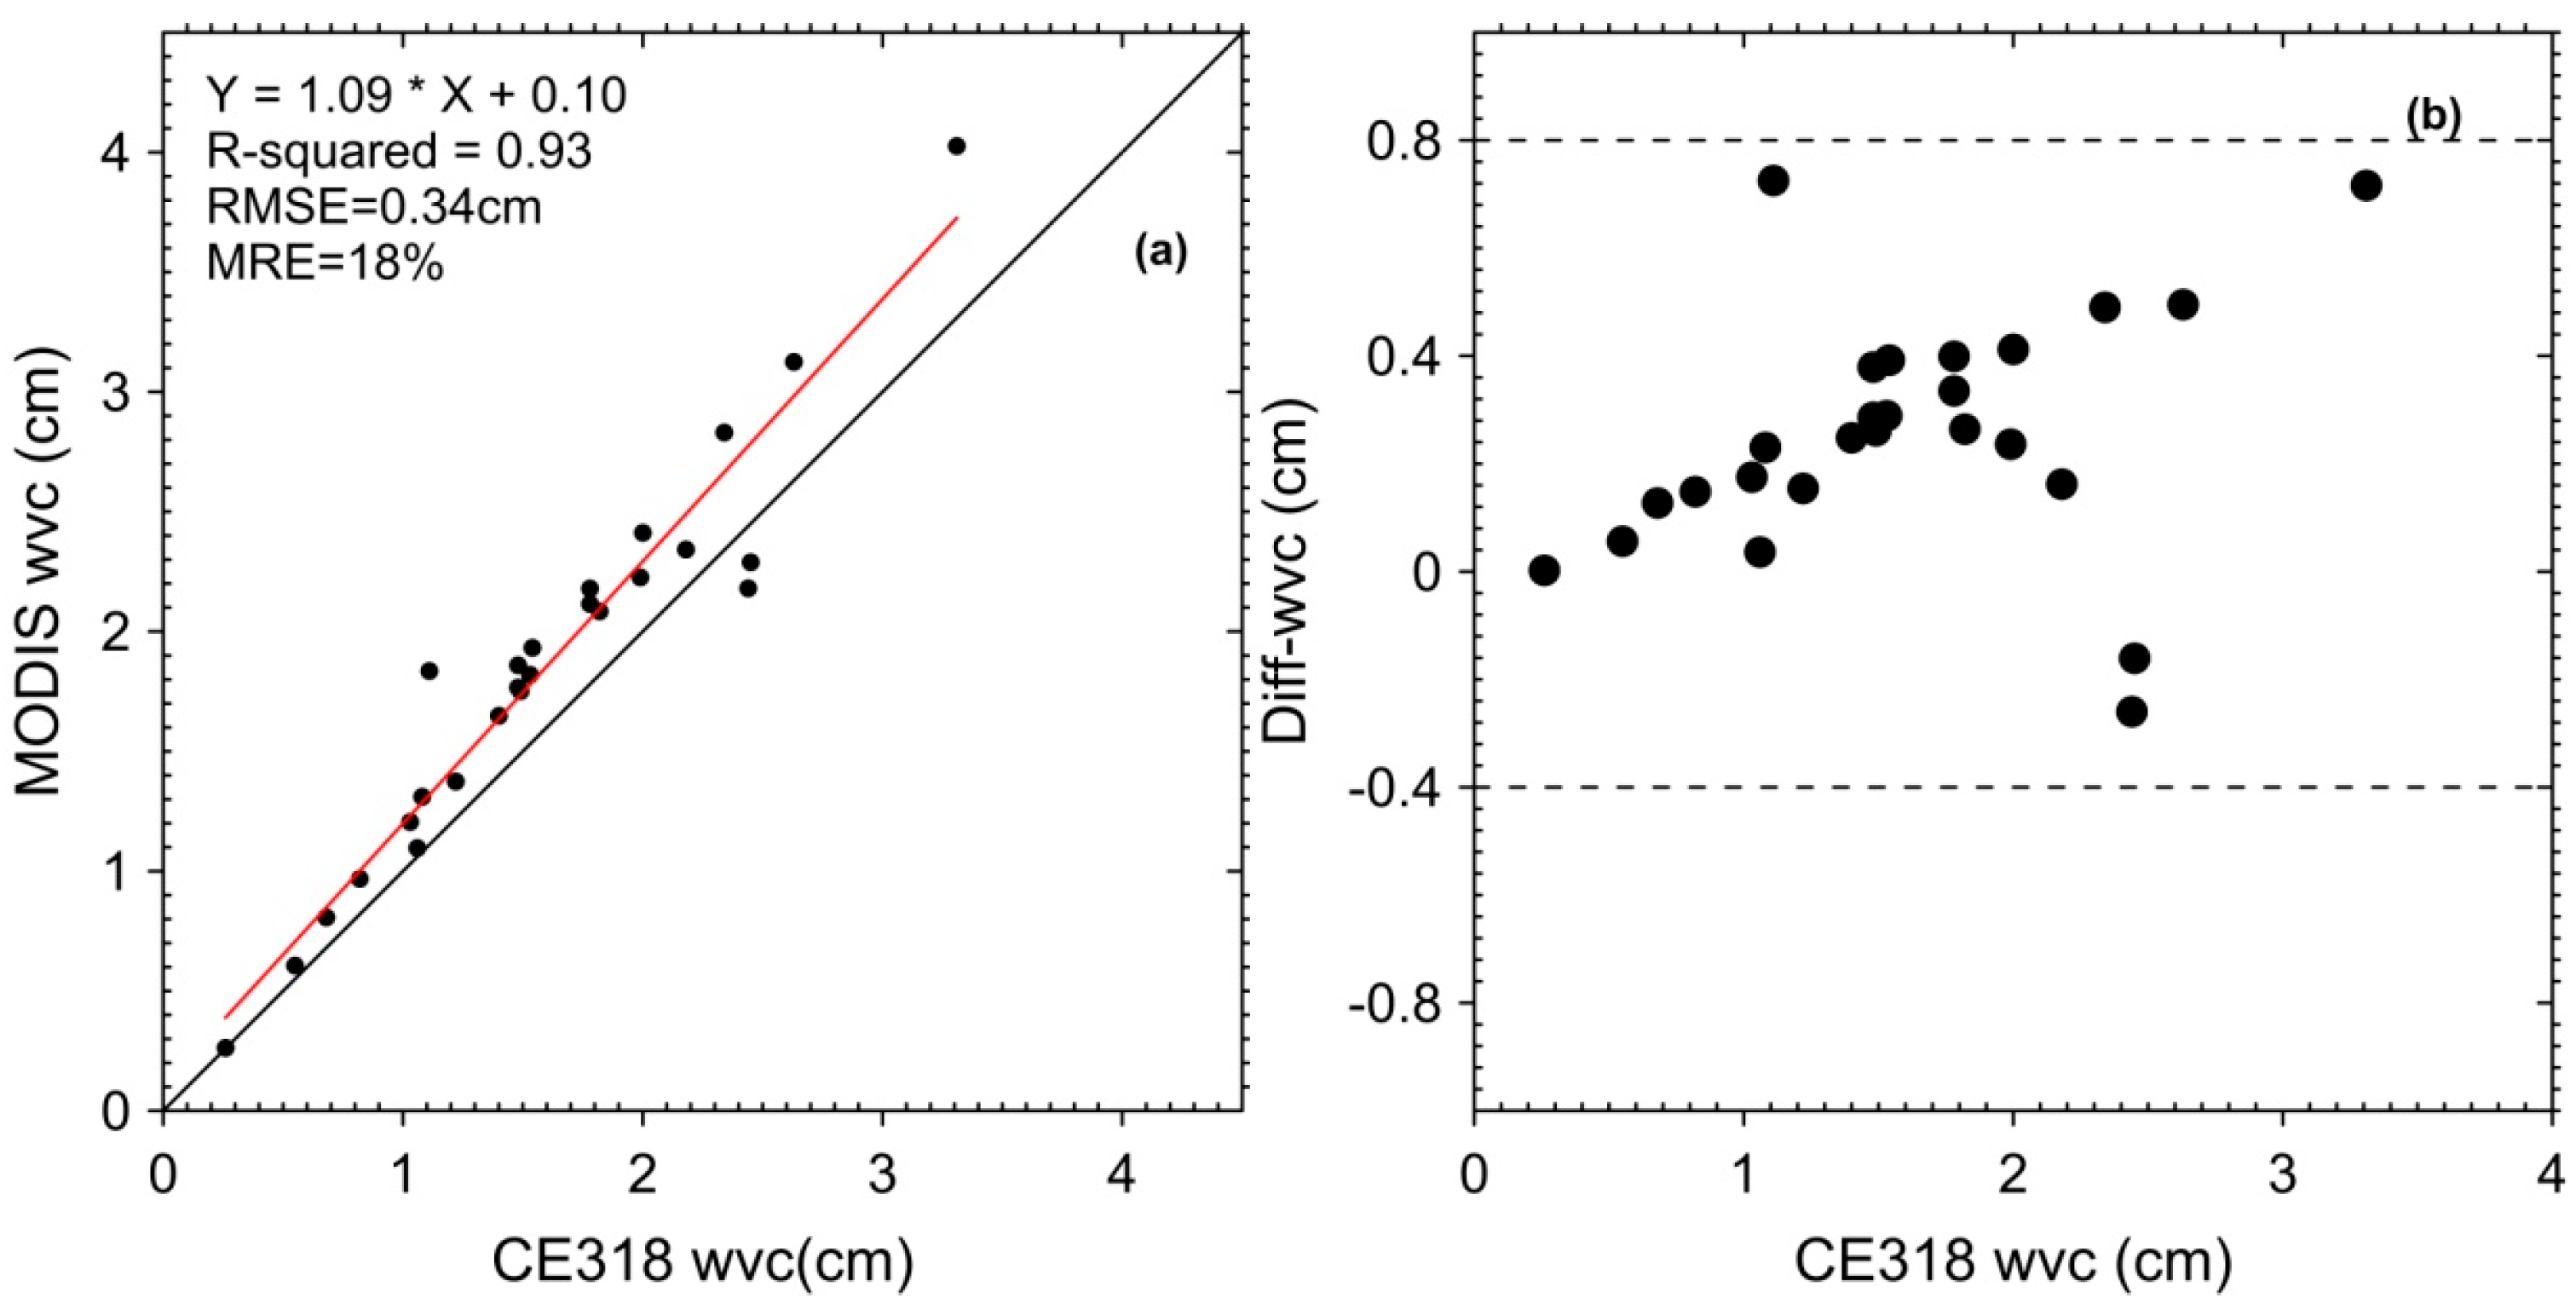
3.3. MODIS Data and In Situ Water Vapor Content Data
3.3.1. MODIS Data

| Product Name | Spatial Resolution | Temporal Resolution | Name of Datasets and Usage |
|---|---|---|---|
| MOD03 | 1 km | Daily | Geolocation/Input |
| MOD05 | 1 km | Daily | WVC/Input |
| MOD11A1 | 1 km | Daily | LST/Validation |
| MOD13Q1 | 250 m | 16 days | NDVI/Input |
| MCD12Q1 | 500 m | Yearly | Land cover types/Input |
3.3.2. In Situ Water Vapor Content WVC Data
| Date (Month/Day) | MOD05-WVC (cm) | CE318-WVC (cm) | MOD05-Based-LST (K) | CE318-Based-LST (K) | In Situ-LST (K) |
|---|---|---|---|---|---|
| 06/19 | 1.86 | 1.48 | 306.4 | 305.56 | 301.44 |
| 06/30 | 2.45 | 2.29 | 306.1 | 305.31 | 298.64 |
| 07/08 | 2.18 | 1.78 | 300 | 299.62 | 298.74 |
| 08/14 | 3.07 | No data | 295.3 | No data | 298.60 |
| 08/15 | 3.11 | 2.7 | 299.25 | 298.58 | 299.04 |
| 08/22 | 1.65 | No data | 299.8 | No data | 297.20 |
| 09/02 | 1.22 | 1.03 | 293.9 | 293.78 | 292.42 |
| 09/14 | 0.6 | 0.55 | 297.25 | 297.17 | 295.91 |
| RMSE | 0.12 cm | 1.27 K | 1.35 K | ||
| R2 | 0.98 | 0.53 | 0.71 | ||
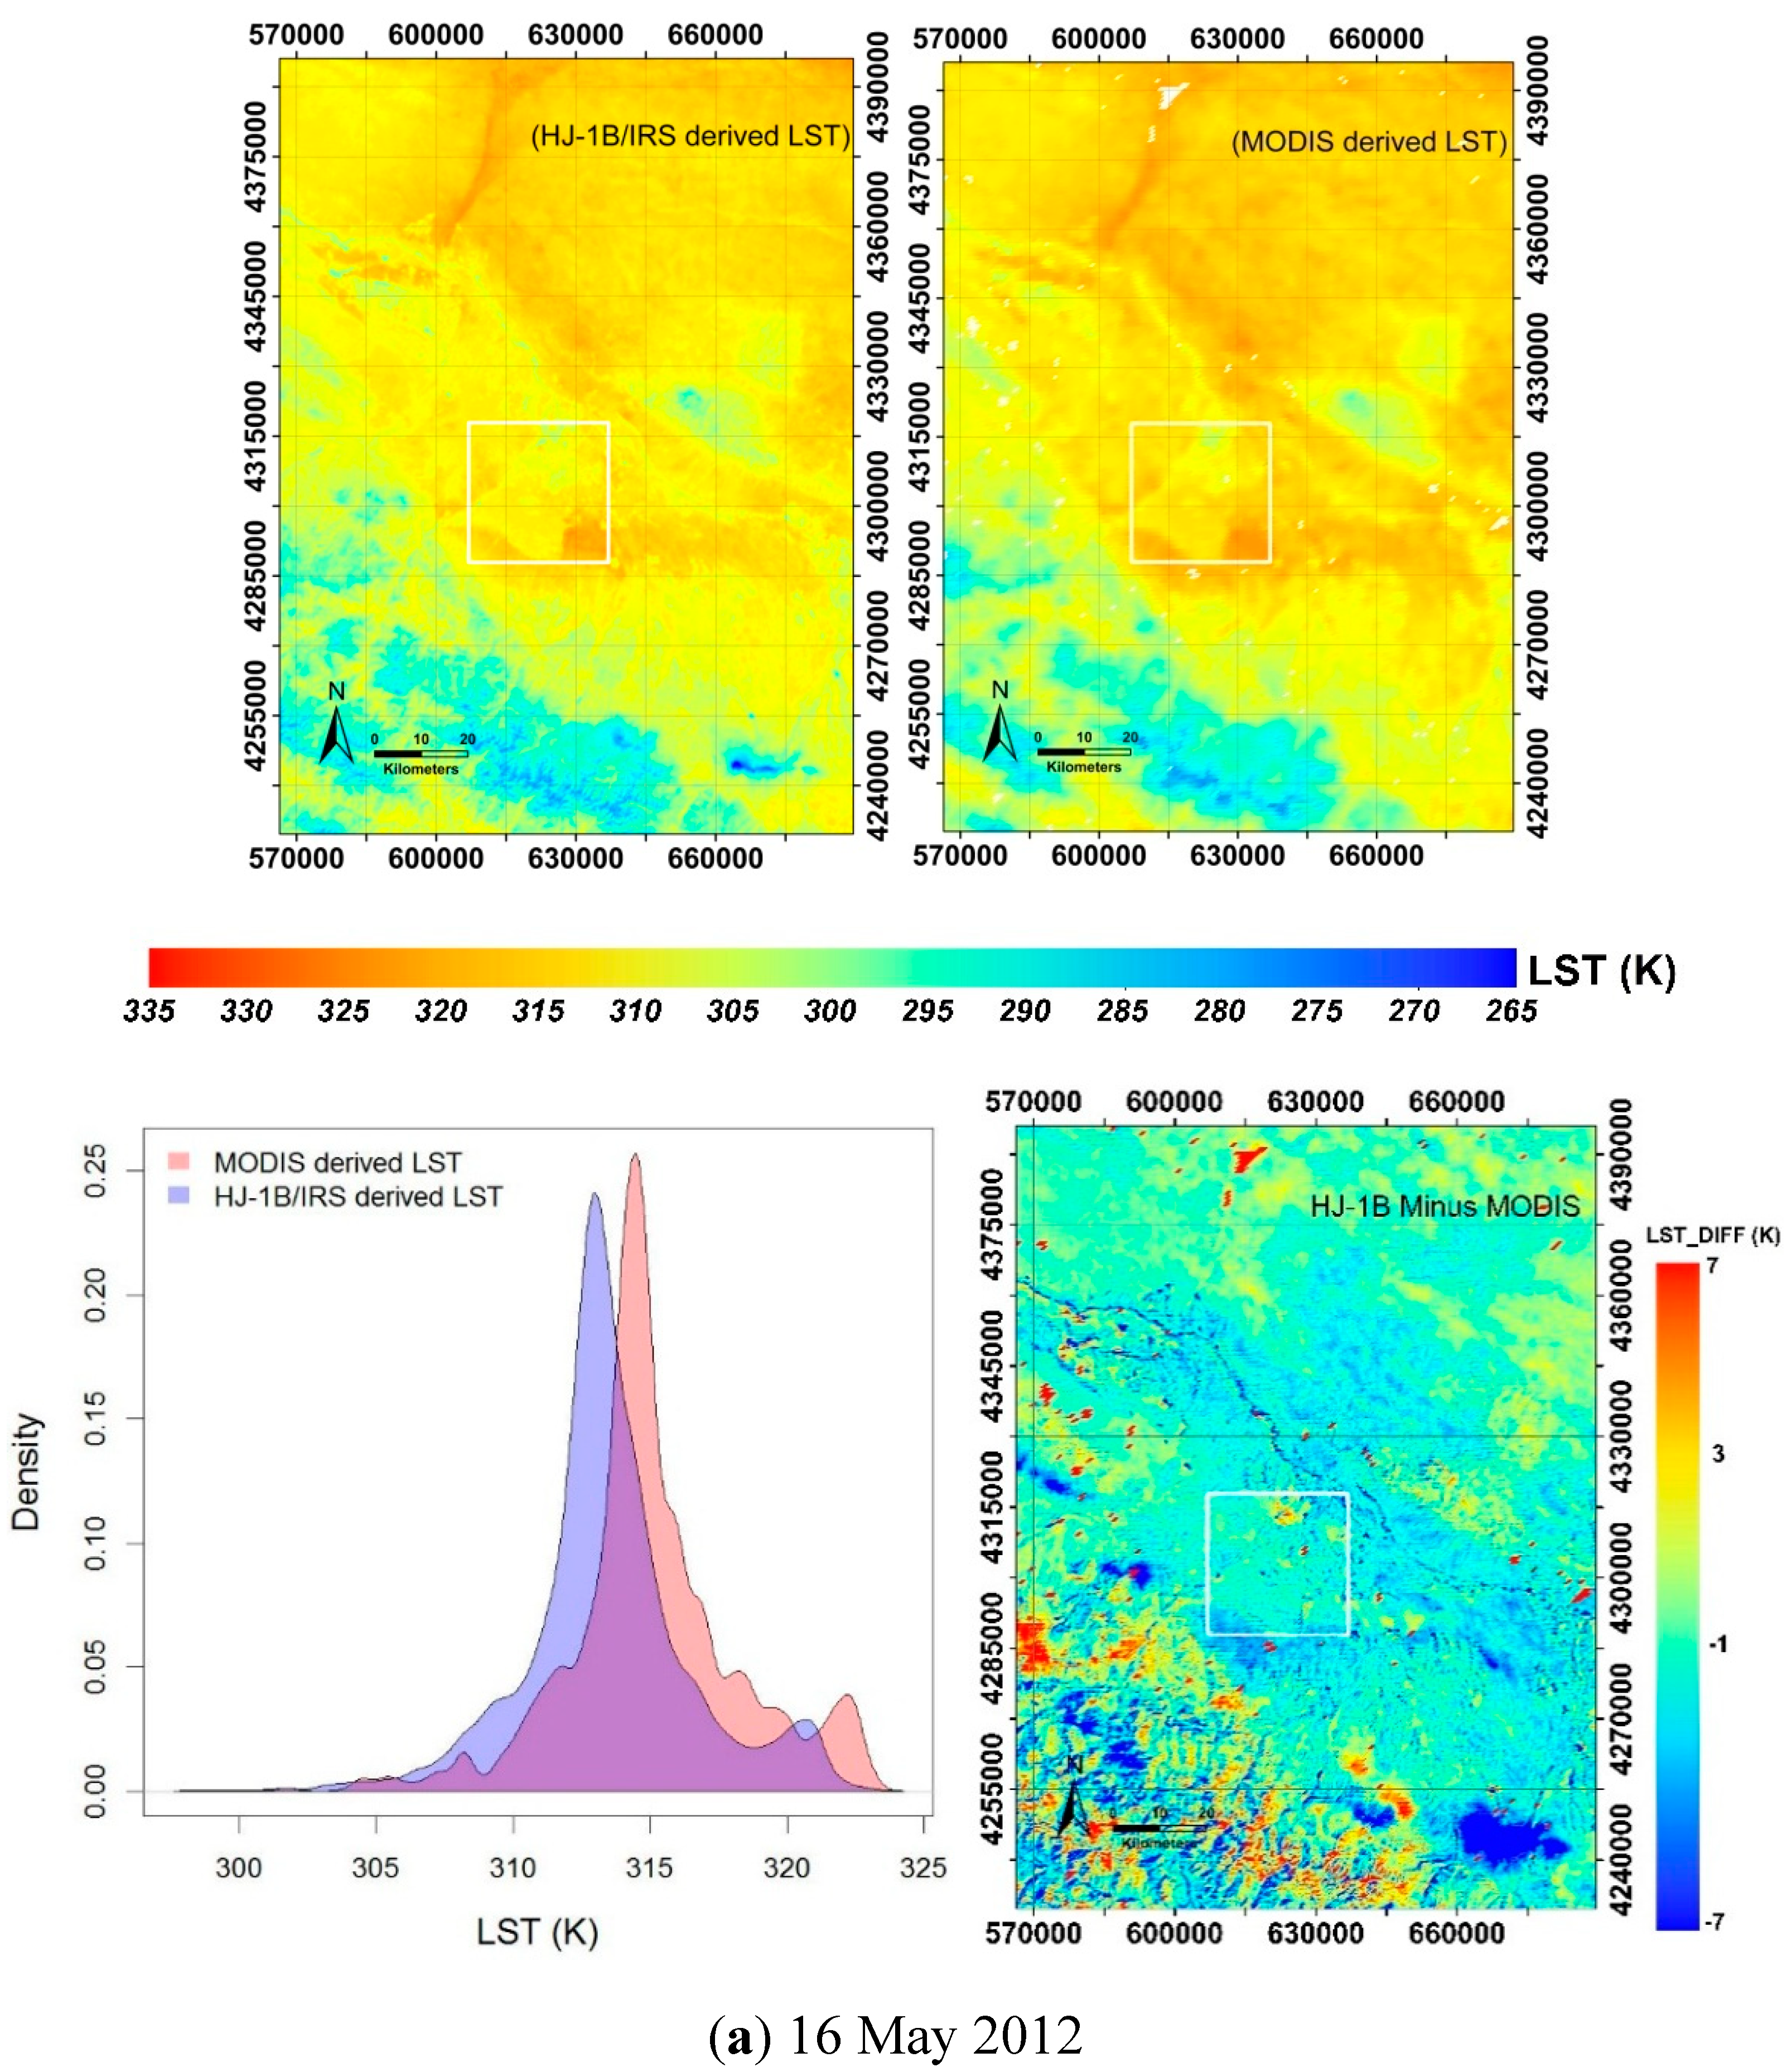
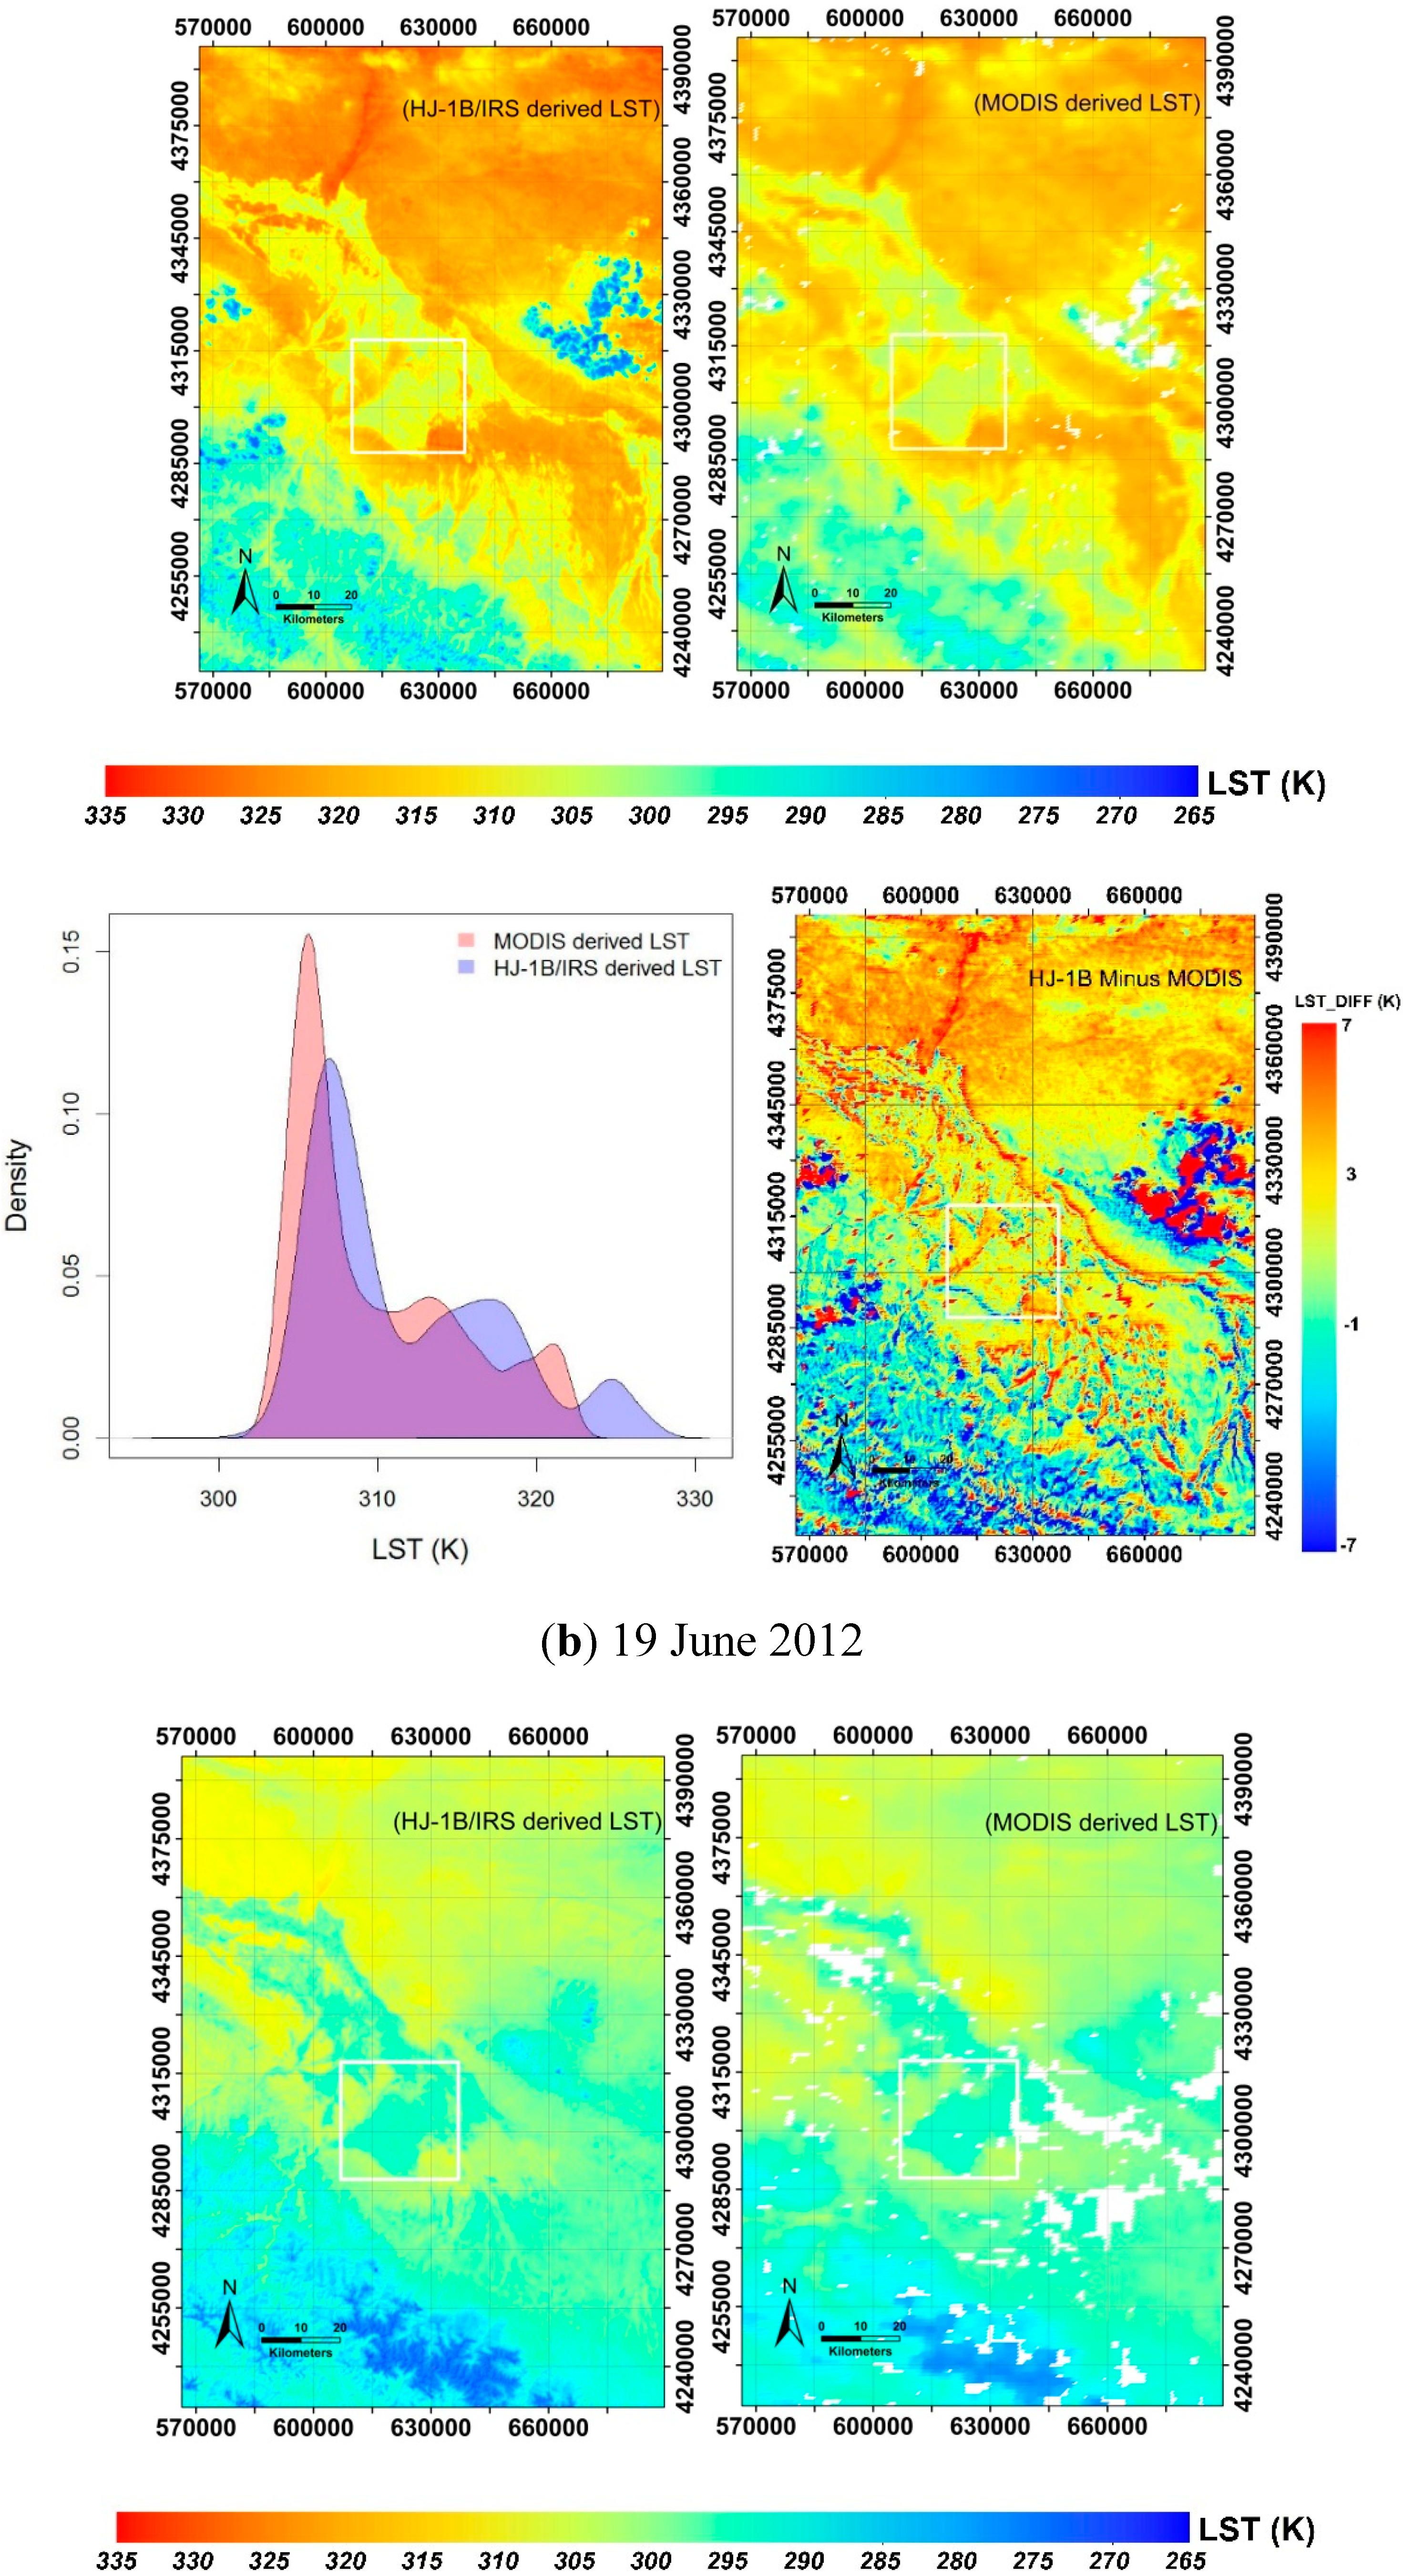
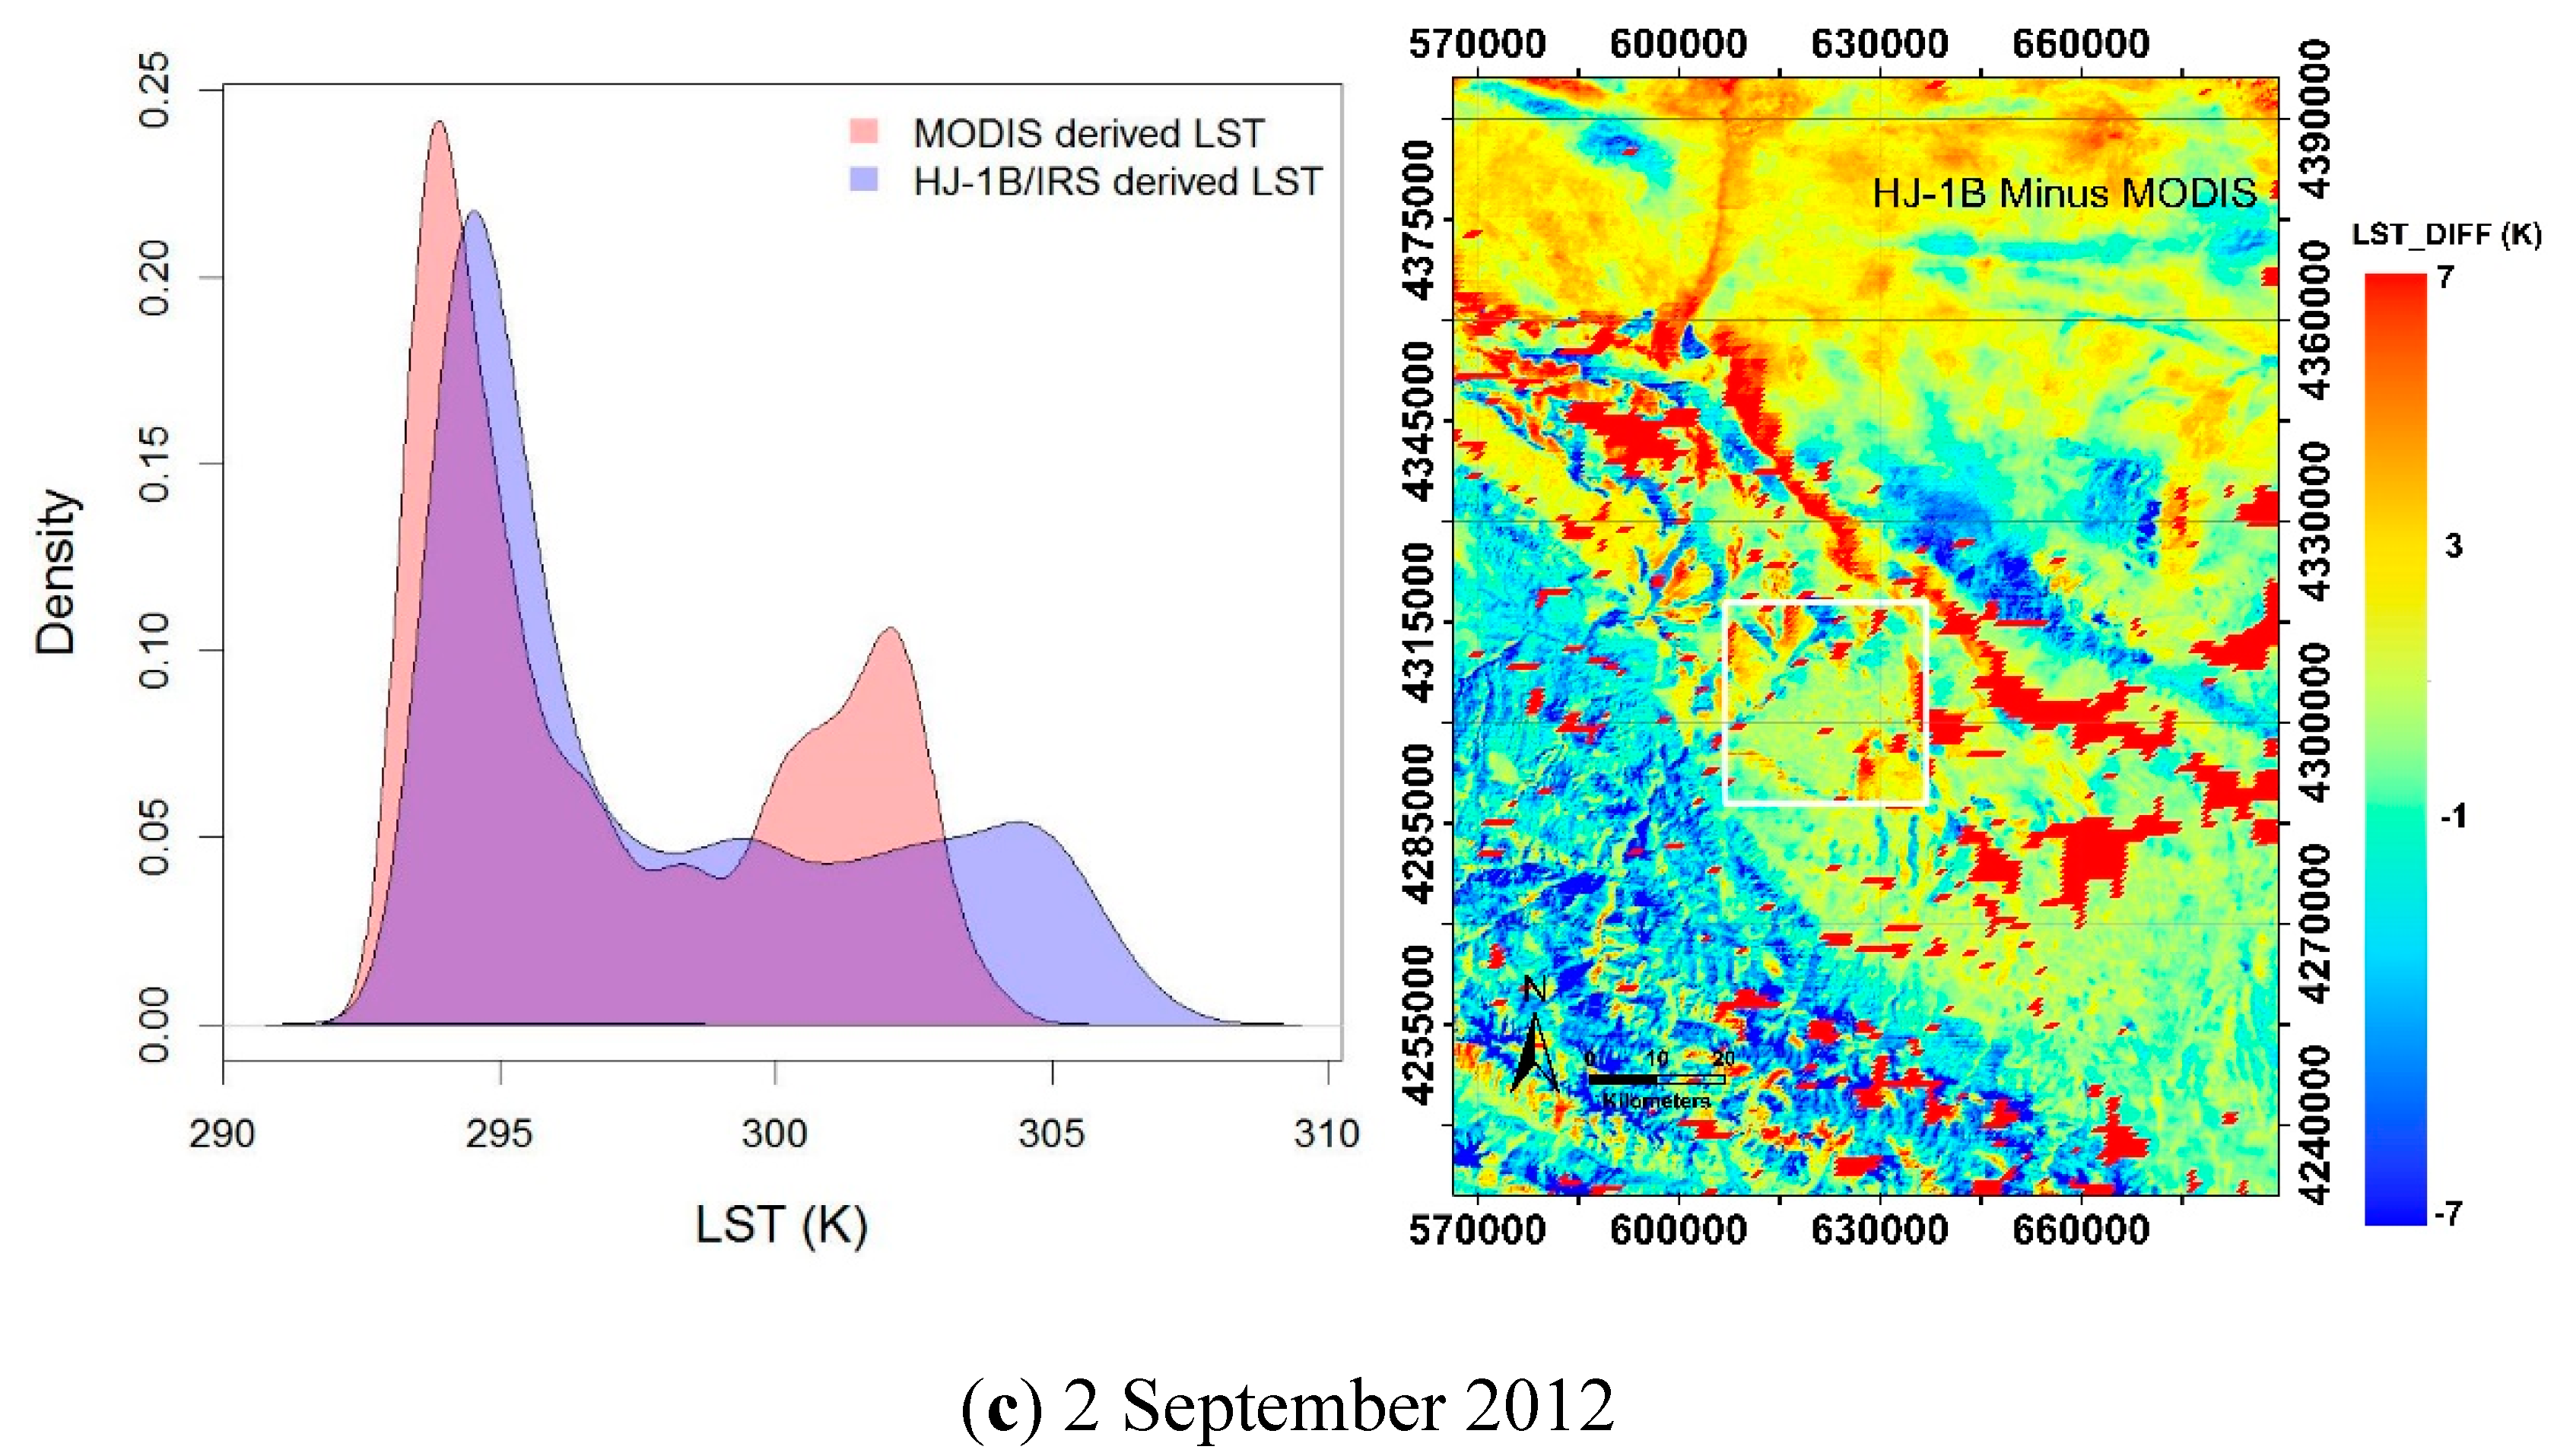
4. Results and Discussion
4.1. Comparisons between MOD05 and In Situ Measurements of Water Vapor Content

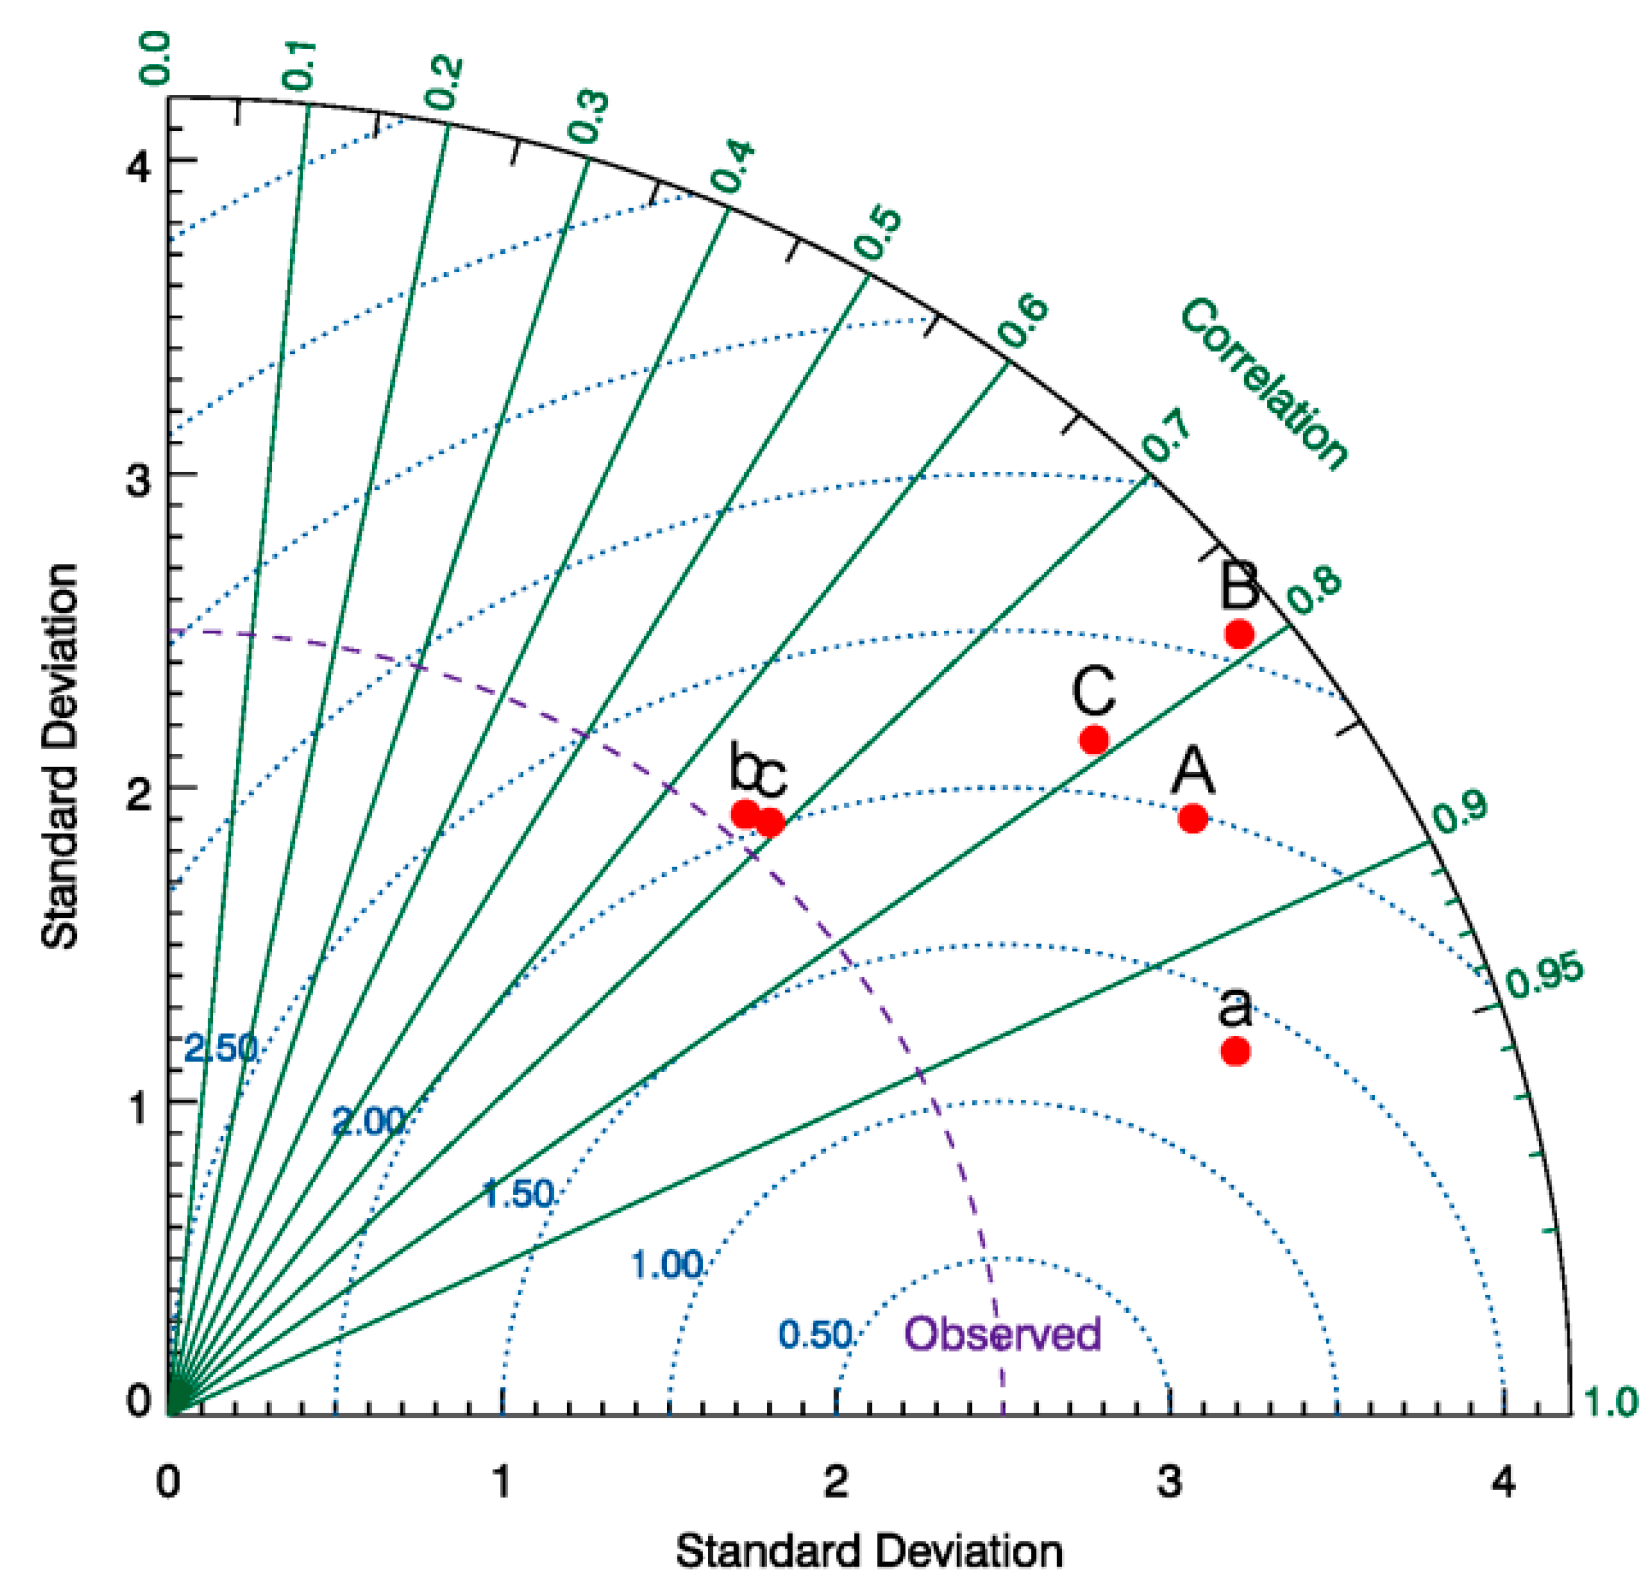
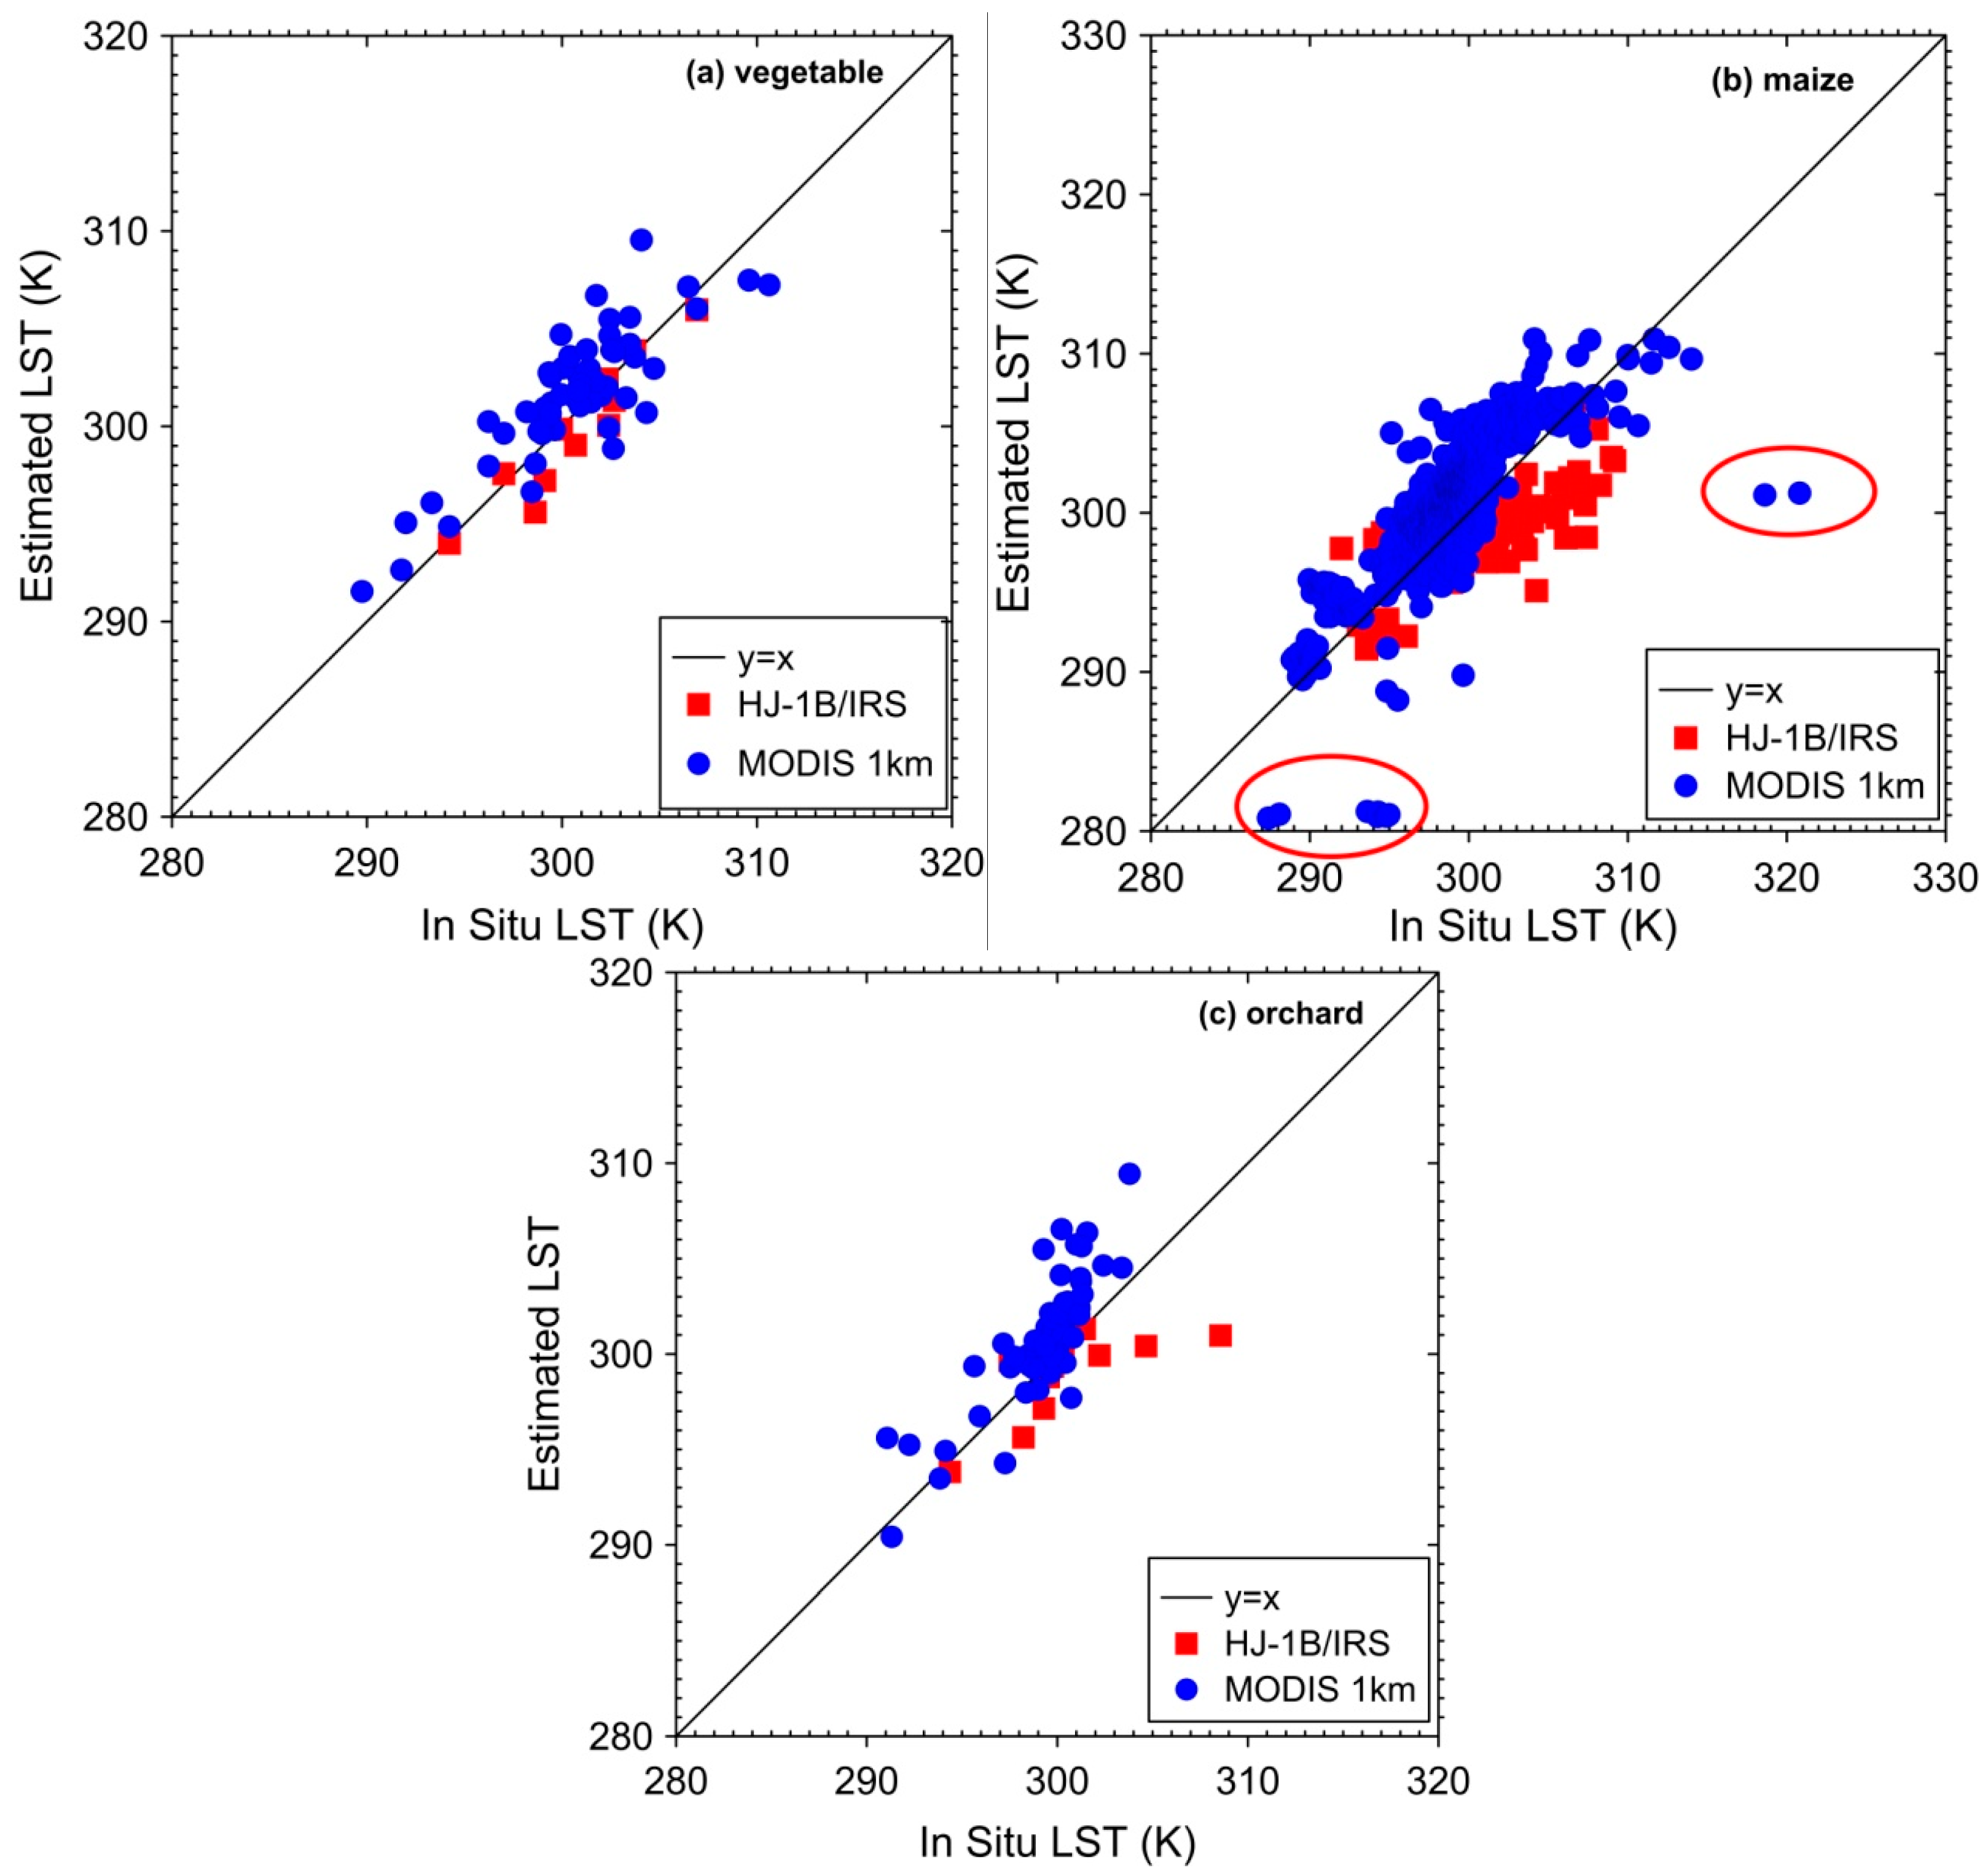
4.2. HiWATER-MUSOEXE Results
| Cropland | Product | Label (in Figure 4) | STD (K) | RMSE (K) | R | N (Samples) |
|---|---|---|---|---|---|---|
| Vegetable | HJ1B/IRS | a | 3.40 | 1.42 | 0.94 | 12 |
| MODIS | A | 3.61 | 2.32 | 0.85 | 53 | |
| Maize | HJ1B/IRS | b | 2.58 | 2.83 | 0.67 | 180 |
| MODIS | B | 4.06 | 3.01 | 0.79 | 778 | |
| Orchard | HJ1B/IRS | c | 2.61 | 2.87 | 0.69 | 12 |
| MODIS | C | 3.51 | 3.12 | 0.79 | 55 |


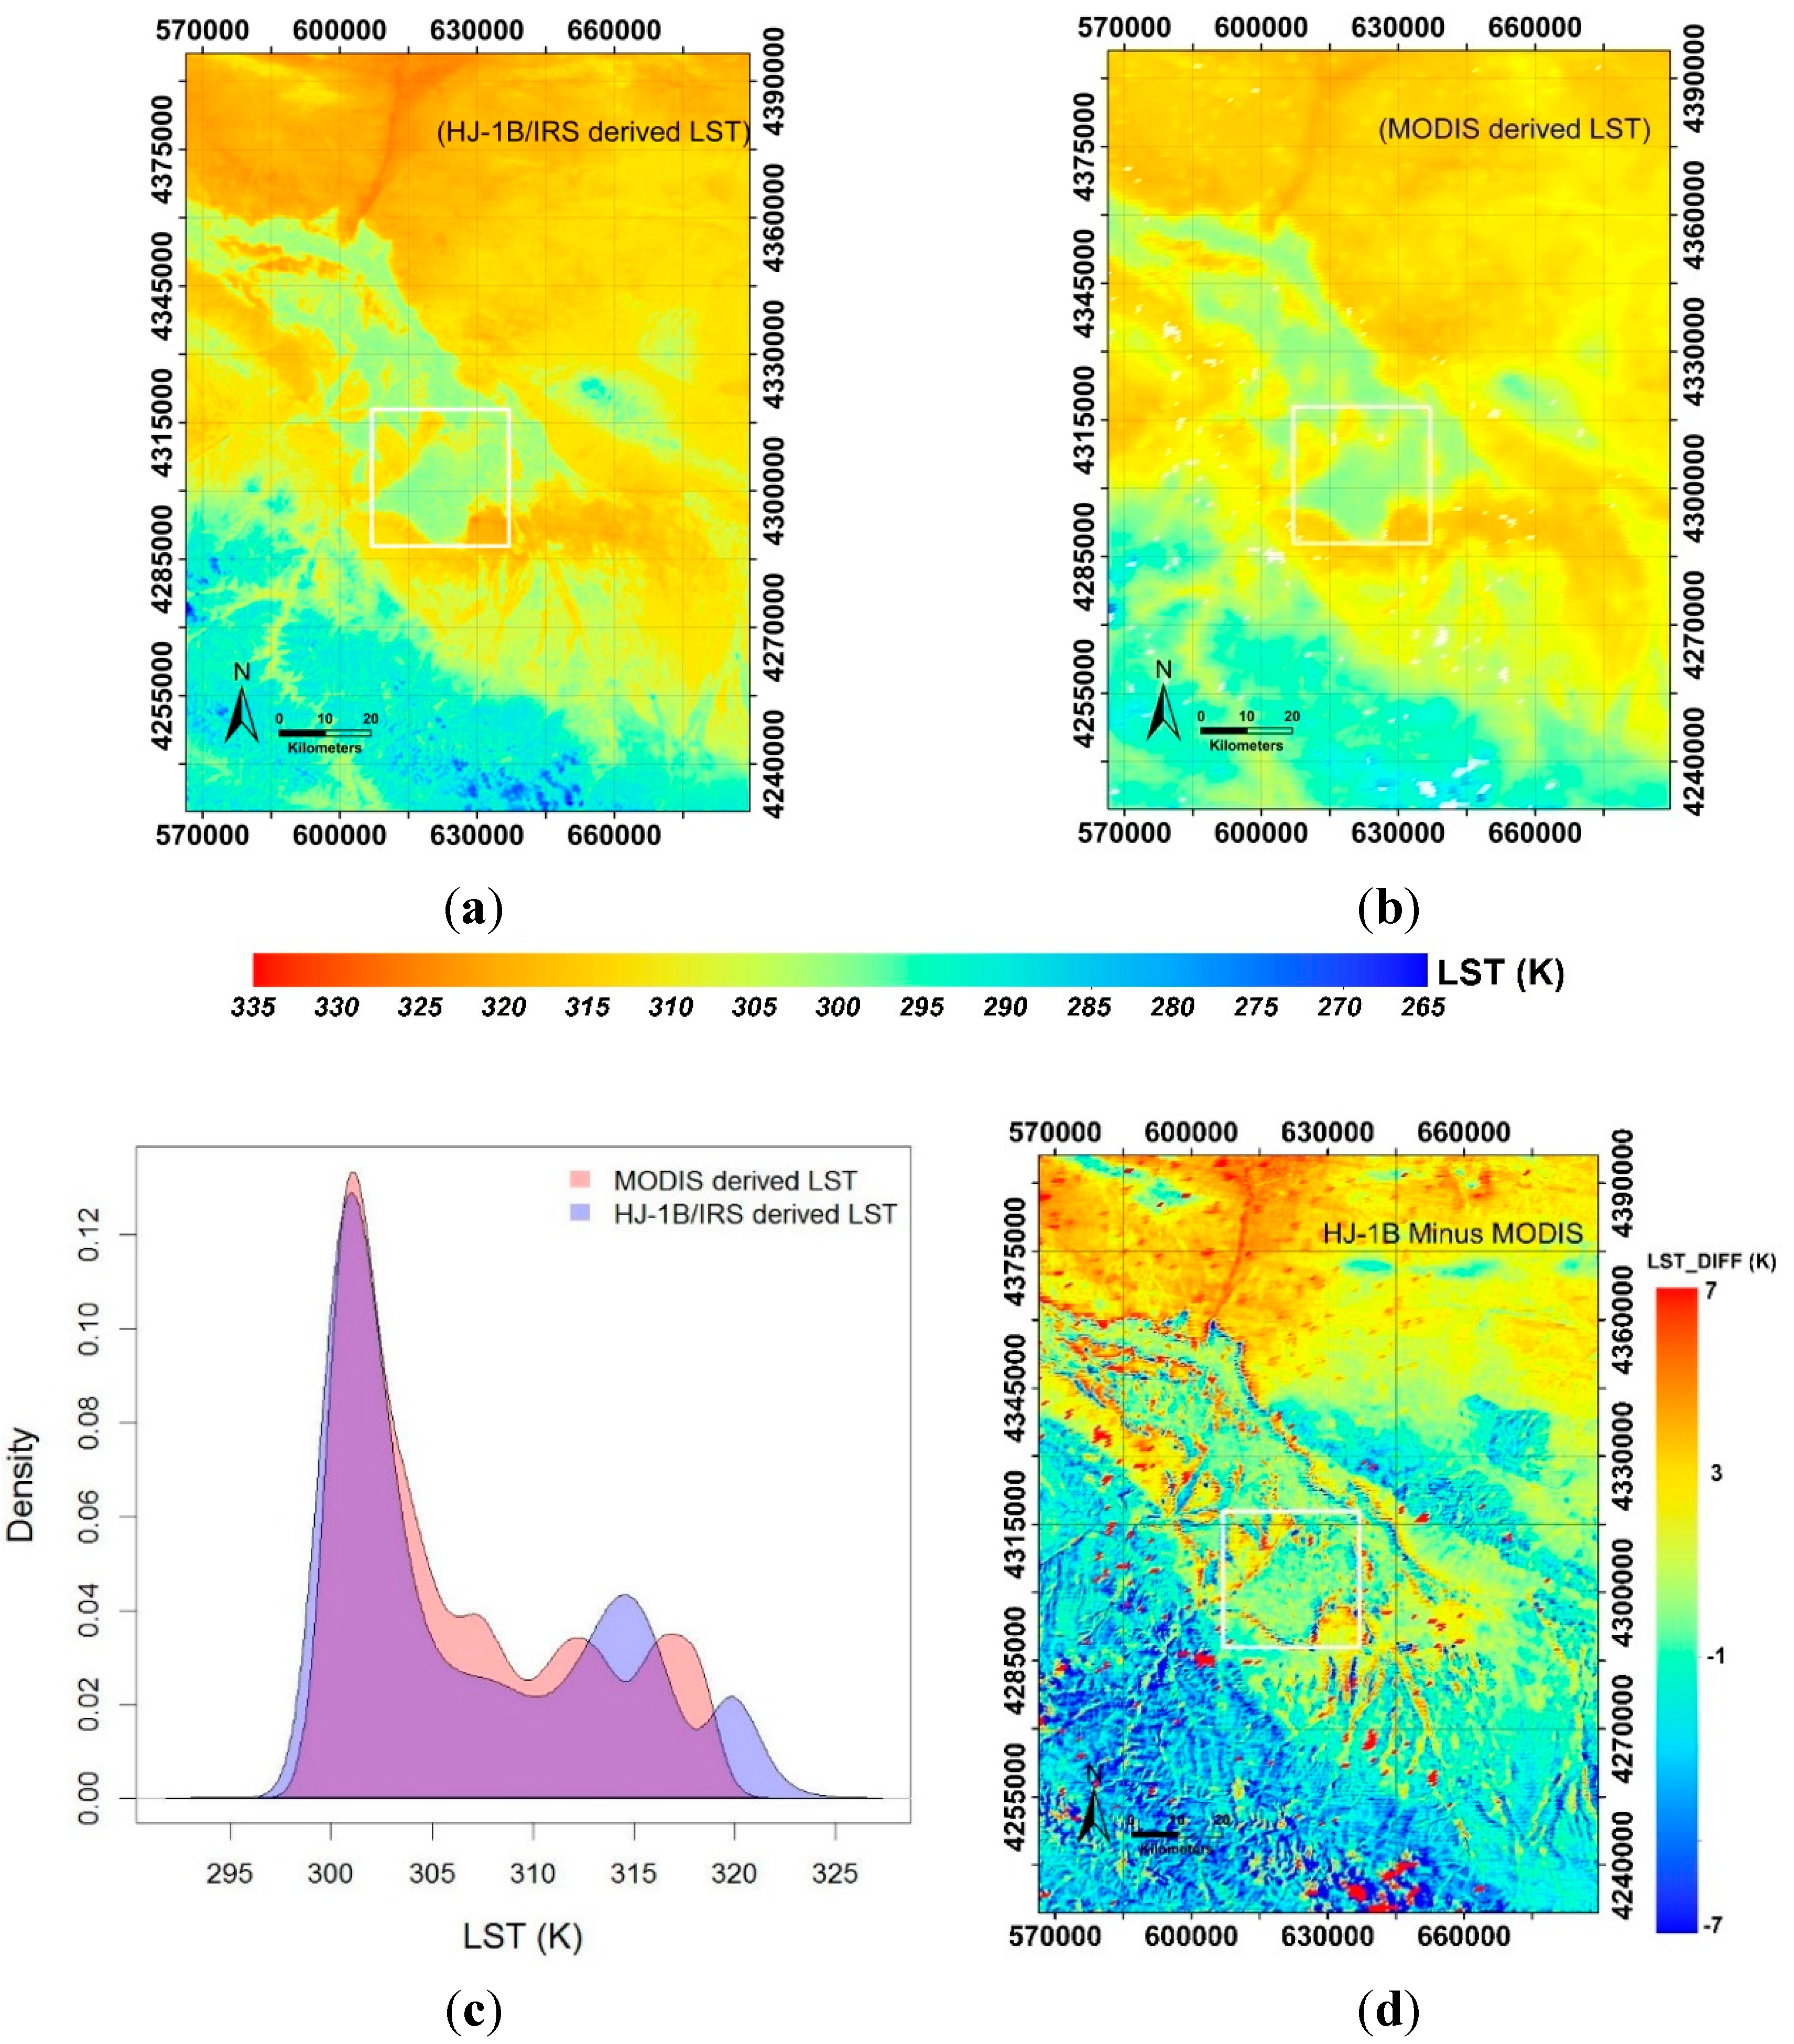
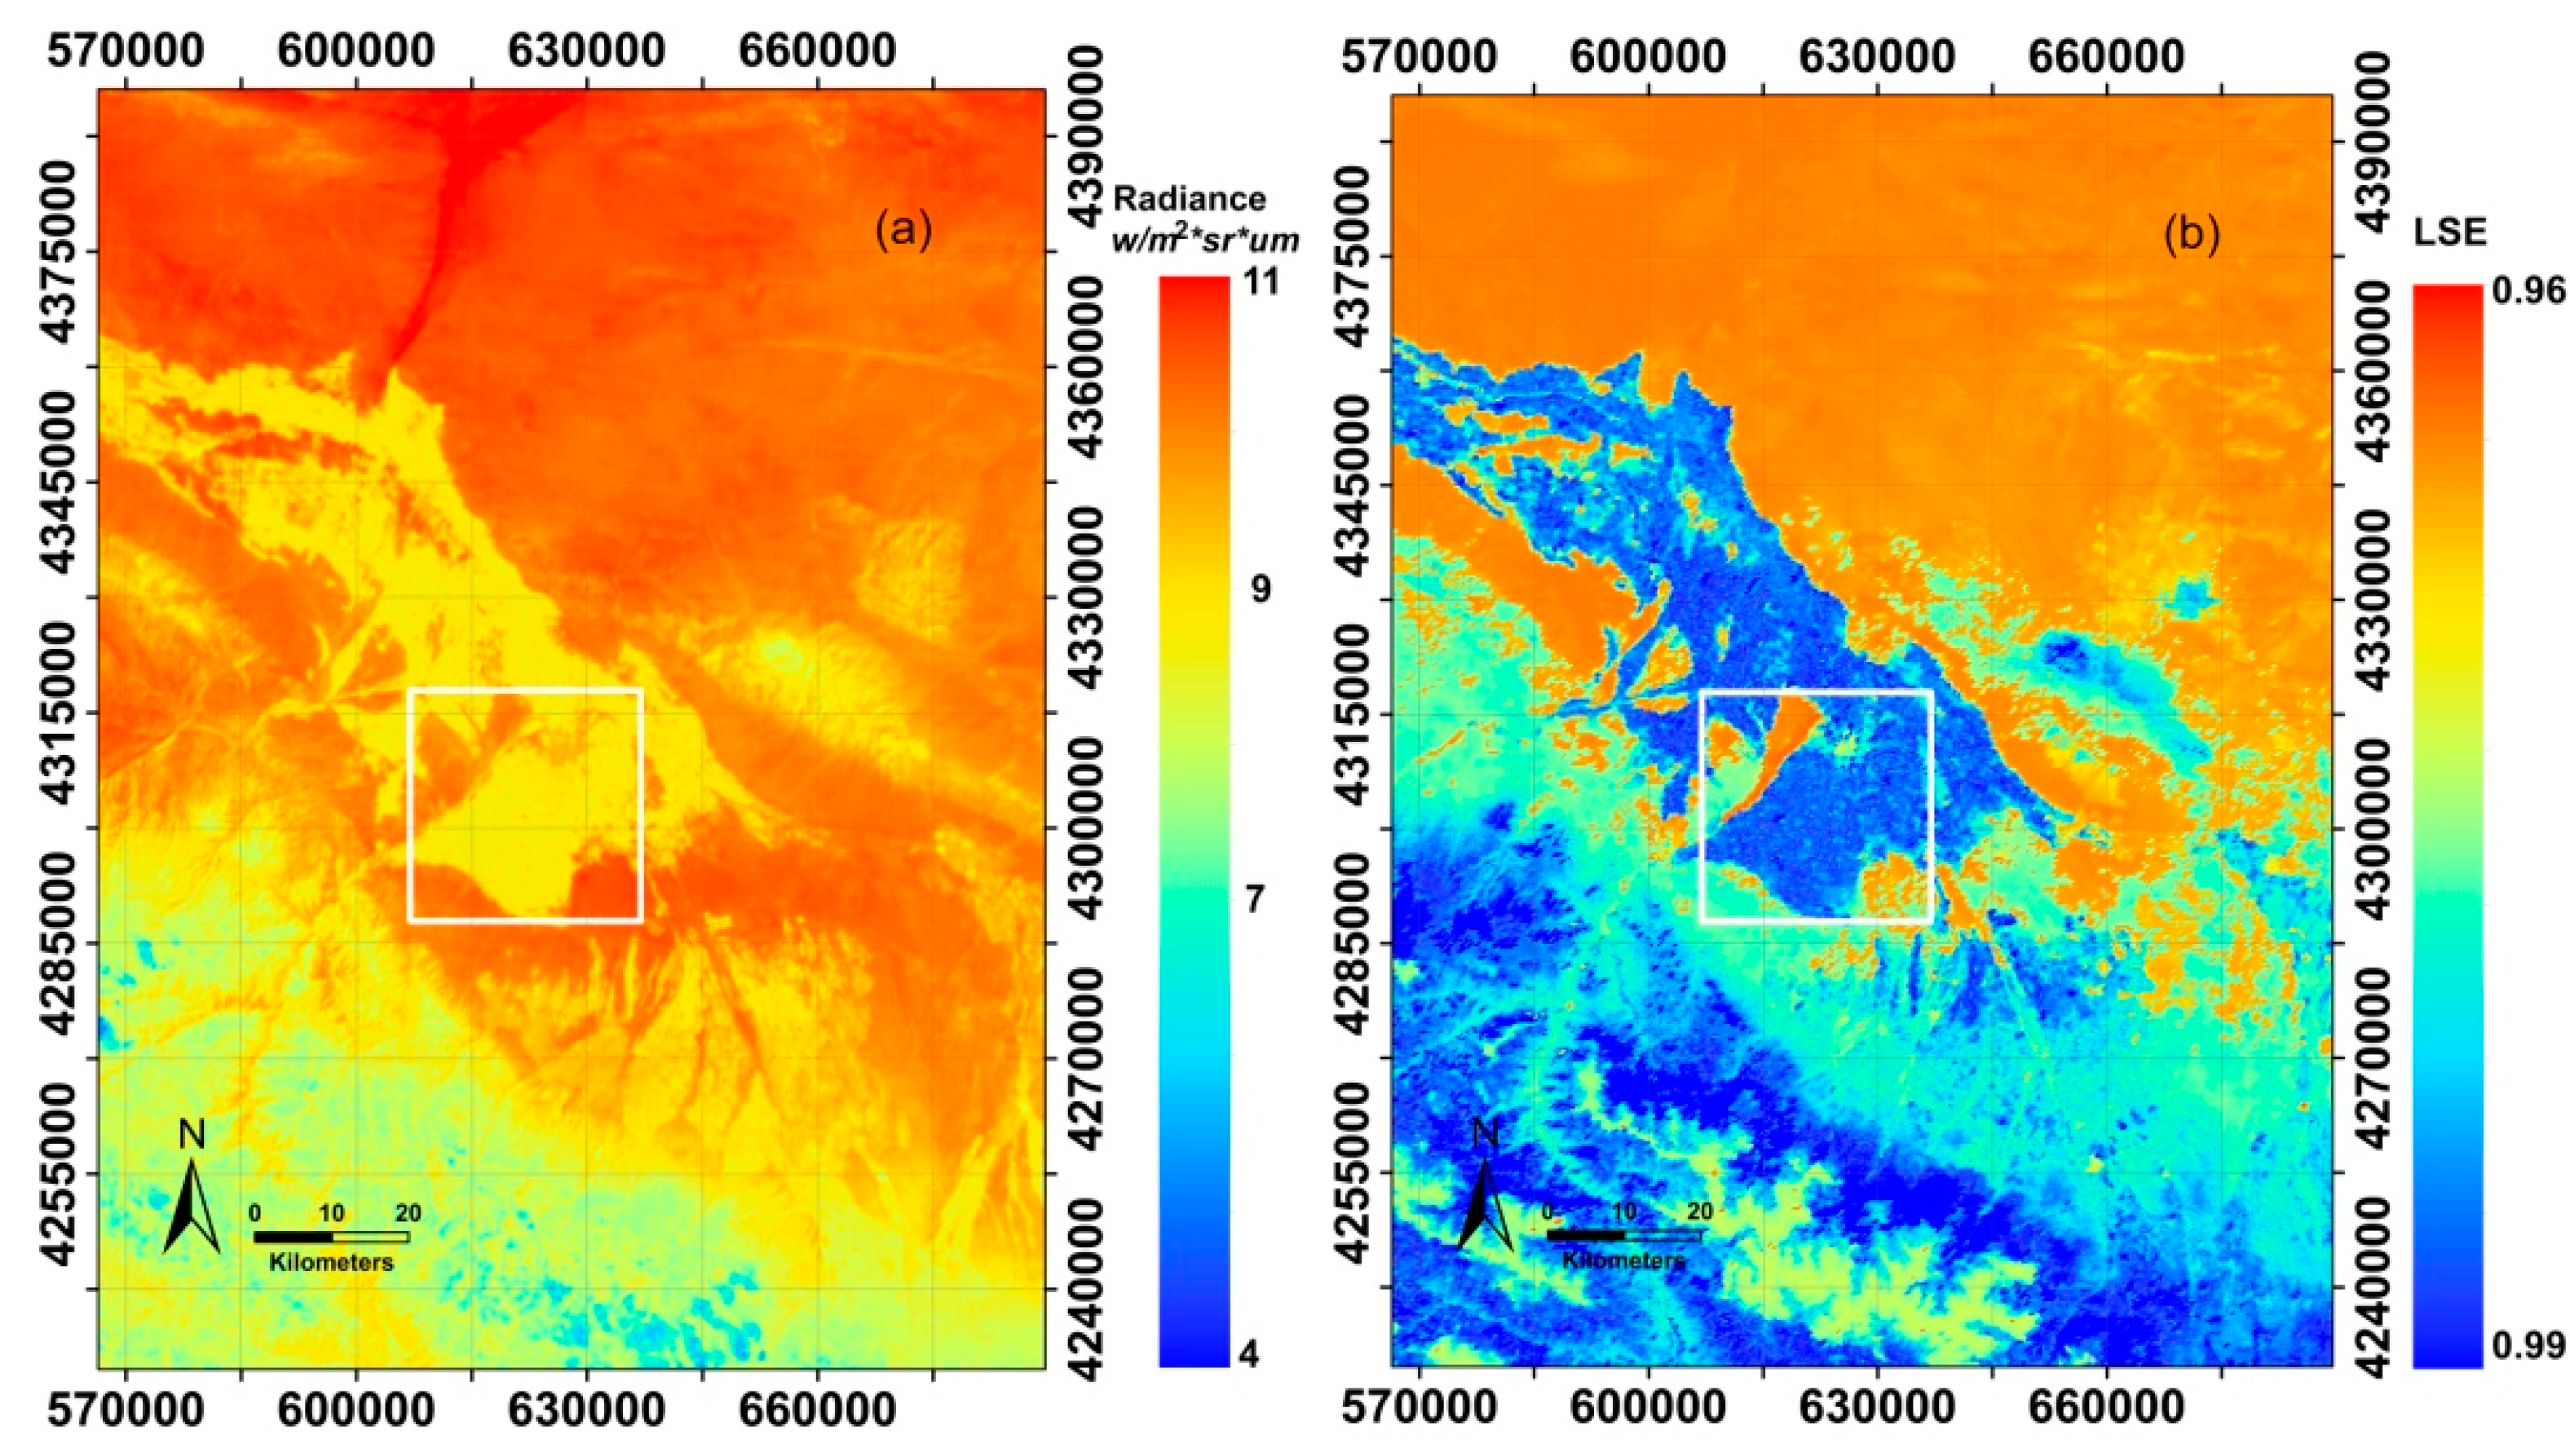
4.3. Spatial Distribution


5. Conclusions
Acknowledgments
Author Contributions
Conflicts of Interest
References
- Li, Z.-L.; Tang, B.-H.; Wu, H.; Ren, H.; Yan, G.; Wan, Z.; Trigo, I.F.; Sobrino, J.A. Satellite-derived land surface temperature: Current status and perspectives. Remote Sens. Environ. 2013, 131, 14–37. [Google Scholar] [CrossRef]
- Wan, Z.; Zhang, Q.; Li, Z.L. Quality assessment and validation of the MODIS global land surface temperature. Int. J. Remote Sens. 2004, 25, 261–274. [Google Scholar] [CrossRef]
- Duan, S.-B.; Li, Z.-L.; Tang, B.-H.; Wu, H.; Tang, R. Generation of a time-consistent land surface temperature product from MODIS data. Remote Sens. Environ. 2014, 140, 339–349. [Google Scholar] [CrossRef]
- Sobrino, J.A.; Jiménez-Mu˜noz, J.C.; Paolini, L. Land surface temperature retrieval from Landsat TM 5. Remote Sens. Environ. 2004, 90, 434–440. [Google Scholar] [CrossRef]
- Duan, S.-B.; Li, Z.-L.; Tang, B.-H.; Wu, H.; Tang, R. Direct estimation of land-surface diurnal temperature cycle model parameters from MSG-SEVIRI brightness temperatures under clear sky conditions. Remote Sens. Environ. 2014, 150, 34–43. [Google Scholar] [CrossRef]
- Roy, D.P.; Wulder, M.A.; Loveland, T.R. Landsat-8: Science and product vision for terrestrial global change research. Remote Sens. Environ. 2014, 145, 154–172. [Google Scholar] [CrossRef]
- Qin, Z.H.; Karnieli, A. A mono-window algorithm for retrieving land surface temperature from Landsat TM data and its application to the Israel–Egypt border region. Int. J. Remote Sens. 2001, 22, 3719–3746. [Google Scholar] [CrossRef]
- Li, H.; Liu, Q.H.; Du, Y.M.; Jiang, J.X.; Wang, H.S. Evaluation of the NCEP and MODIS atmospheric products for single channel land surface temperature retrieval with ground measurements: A case study of HJ-1B IRS data. IEEE J. Stars. 2013, 6, 1399–1408. [Google Scholar]
- Duan, S.-B.; Li, Z.-L.; Wang, N.; Wu, H.; Tang, B.-H. Evaluation of six land-surface diurnal temperature cycle models using clear-sky in situ and satellite data. Remote Sens. Environ. 2012, 124, 15–25. [Google Scholar] [CrossRef]
- Ouyang, X.; Kang, G.; Zeng, F.; Qi, E.; Li, Z.L. Preliminary applications of a land surface temperature retrieval method to IASI and AIRS data. Int. J. Remote Sens. 2013, 34, 3128–3139. [Google Scholar] [CrossRef]
- Hu, C.; Tang, P. Automatic algorithm for relative radiometric normalization of data obtained from Landsat TM and HJ-1A/B charge-coupled device sensors. J. Appl. Remote Sens. 2012, 6, 063509. [Google Scholar] [CrossRef]
- Zhang, R.; Sun, R.; Du, J. Estimations of net primary productivity and evapotranspiration based on HJ-1A/B data in Jinggangshan City, China. J. Mt. Sci. 2013, 10, 777–789. [Google Scholar]
- Jiménez-Muñoz, J.C.; Sobrino, J.A. A generalized single-channel method for retrieving land surface temperature from remote sensing data. J. Geophys. Res. 2003, 108, 1–9. [Google Scholar]
- Sobrino, J.A.; Jiménez-Muñoz, J.C. Land surface temperature retrieval from thermal infrared data: An assessment in the context of the Surface Processes and Ecosystem Changes through Response Analysis (SPECTRA) mission. J. Geophys. Res. 2005, 110. [Google Scholar] [CrossRef]
- Li, H. The Study of Algorithms for Land Surface Temperature Retrieval from HJ-1B/IRS and FY-3A/MERSI Data. Ph.D. Thesis, Institute of Remote Sensing Application, Chinese Academy of Science, Beijing, China, 2010. [Google Scholar]
- Zhao, L.; Yu, T.; Tian, Q.; Gu, X.; Li, J.; Wan, W. Error Analysis of the Land Surface Temperature Retrieval Using HJ-1B Thermal Infrared Remote Sensing Data. Available online: http://europepmc.org/abstract/MED/21322240 (accessed on 20 August 2014).
- Coll, C.; Caselles, V.; Valor, E.; Raquel, N. Comparison between different sources of atmospheric profiles for land surface temperature retrieval from single channel thermal infrared data. Remote Sens. Environ. 2012, 117, 199–210. [Google Scholar] [CrossRef]
- Zhou, J.; Zhan, W.; Hu, D.; Zhao, X. Improvement of mono-window algorithm for retrieving land surface temperature from HJ-1B satellite data. Chin. Geogr. Sci. 2012, 20, 123–131. [Google Scholar] [CrossRef]
- Valor, E.; Caselles, V. Mapping land surface emissivity from NDVI: Application to European, African and South American areas. Remote Sens. Environ. 1996, 57, 167–184. [Google Scholar] [CrossRef]
- Snyder, W.; Wan, Z.; Zhang, Y.; Feng, Y.Z. Classification-based emissivity for land surface temperature measurement from space. Int. J. Remote Sens. 1998, 19, 2753–2774. [Google Scholar] [CrossRef]
- Li, H.; Liu, Q.H.; Jiang, J.X.; Wang, H.S.; Li, Q.; Sun, L. Land surface emissivity retrieval from HJ-1B satellite data using a combined method. In Proceedings of Geoscience and Remote Sensing Symposium (IGARSS), Vancouver, BC, Canada, 24–29 July 2011.
- ASTER Spectral Library. http://speclib.jpl.nasa.gov (accessed on 26 June 2008).
- Wang, Q.; Wu, C.Q.; Li, Q.; Li, J.S. Chinese HJ-1A/B satellites and data characteristics. Sci. Chin. Earth Sci. 2010, 53, 51–57. [Google Scholar] [CrossRef]
- Li, Y.; Clarke, K.C. Image deblurring for satellite imagery using small-support-regularized deconvolution. ISPRS J. Photogramm. Remote Sens. 2013, 85, 148–155. [Google Scholar] [CrossRef]
- Li, X.; Cheng, G.D.; Liu, S.M.; Xiao, Q.; Ma, M.G.; Jin, R.; Che, T.; Liu, Q.H.; Wang, W.Z.; Qi, Y.; et al. Heihe Watershed Allied Telemetry Experimental Research (HiWATER): Scientific objectives and experimental design. Bull. Am. Meteorol. Soc. 2013, 94, 1145–1160. [Google Scholar] [CrossRef]
- Liu, S.M.; Xu, Z.W.; Wang, W.Z.; Bai, J.; Jia, Z.; Zhu, M.; Wang, J.M. A comparison of eddy-covariance and large aperture scintillometer measurements with respect to the energy balance closure problem. Hydrol. Earth Syst. Sci. 2011, 15, 1291–1306. [Google Scholar] [CrossRef]
- Xu, Z.; Liu, S.; Li, X.; Shi, S.; Wang, J.; Zhu, Z.; Xu, T.; Wang, W.; Ma, M. Intercomparison of surface energy flux measurement systems used during the HiWATER-MUSOEXE. J. Geophys. Res. Atmos. 2013, 118, 13140–13157. [Google Scholar] [CrossRef]
- Wan, Z.; Zhang, Y.; Zhang, Q.; Li, Z.L. Validation of the land-surface temperature products retrieved from Terra Moderate Resolution Imaging Spectroradiometer data. Remote Sens. Environ. 2002, 83, 163–180. [Google Scholar] [CrossRef]
- Coll, C.; Caselles, V.; Galve, J.M.; Valor, E.; Niclos, R.; Sanchez, J.M.; Rivas, R. Ground measurements for the validation of land surface temperatures derived from AATSR and MODIS data. Remote Sens. Environ. 2005, 97, 288–300. [Google Scholar] [CrossRef]
- Prata, A.J. Land Surface Temperature Measurement from Space: Validation of the AATSR Land Surface Temperature Product. Available online: http://lst.nilu.no/Portals/73/Docs/Reports/Prata%202003%20-%20Land%20surface%20temperature%20measurement%20from%20space%20-%20Validation%20of%20the%20AATSR%20Land%20Surface%20Temperature%20Product.pdf (accessed on 20 August 2014).
- Reverb. Available online: http://reverb.echo.nasa.gov (accessed on 6 August 2013).
- Taylor, K.E. Summarizing multiple aspects of model performance in a single diagram. J. Geophys. Res. 2001, 106, 7183–7192. [Google Scholar] [CrossRef]
- Lagouarde, J.P.; Kerr, Y.H.; Brunet, Y. An experimental study of angular effects on surface temperature for various plant canopies and bare soils. Agr. Forest Meteorol. 1995, 77, 167–190. [Google Scholar] [CrossRef]
© 2014 by the authors; licensee MDPI, Basel, Switzerland. This article is an open access article distributed under the terms and conditions of the Creative Commons Attribution license (http://creativecommons.org/licenses/by/4.0/).
Share and Cite
Ouyang, X.; Jia, L.; Pan, Y.; Hu, G. Retrieval of Land Surface Temperature over the Heihe River Basin Using HJ-1B Thermal Infrared Data. Remote Sens. 2015, 7, 300-318. https://doi.org/10.3390/rs70100300
Ouyang X, Jia L, Pan Y, Hu G. Retrieval of Land Surface Temperature over the Heihe River Basin Using HJ-1B Thermal Infrared Data. Remote Sensing. 2015; 7(1):300-318. https://doi.org/10.3390/rs70100300
Chicago/Turabian StyleOuyang, Xiaoying, Li Jia, Yingqi Pan, and Guangcheng Hu. 2015. "Retrieval of Land Surface Temperature over the Heihe River Basin Using HJ-1B Thermal Infrared Data" Remote Sensing 7, no. 1: 300-318. https://doi.org/10.3390/rs70100300