NDVI-Based Long-Term Vegetation Dynamics and Its Response to Climatic Change in the Mongolian Plateau


Abstract
: The response of vegetation to regional climate change was quantified between 1982 and 2010 in the Mongolian plateau by integrating the Advanced Very High Resolution Radiometer (AVHRR) Global Inventory Modeling and Mapping Studies (GIMMS) normalized difference vegetation index (NDVI) (1982–2006) and the Moderate Resolution Imaging Spectroradiometer (MODIS) NDVI (2000–2010). Average NDVI values for the growing season (April–October) were extracted from the AVHRR and MODIS NDVI datasets after cross-calibrating and consistency checking the dataset, based on the overlapping period of 2000–2006. Correlations between NDVI and climatic variables (temperature and precipitation) were analyzed to understand the impact of climate change on vegetation dynamics in the plateau. The results indicate that the growing-season NDVI generally exhibited an upward trend with both temperature and precipitation before the mid- or late 1990s. However, a downward trend in the NDVI with significantly decreased precipitation has been observed since the mid- or late 1990s. This is an apparent reversal in the NDVI trend from 1982 to 2010. Pixel-based analysis further indicated that the timing of the NDVI trend reversal varied across different regions and for different vegetation types. We found that approximately 66% of the plateau showed an increasing trend before the reversal year, whereas 60% showed a decreasing trend afterwards. The vegetation decline in the last decade is mostly attributable to the recent tendency towards a hotter and drier climate and the associated widespread drought stress. Monitoring precipitation stress and associated vegetation dynamics will be important for raising the alarm and performing risk assessments for drought disasters and other related natural disasters like sandstorms.1. Introduction
As one of the key components of terrestrial ecosystems, vegetation plays an important role in regulating energy exchange, the carbon cycle, and climate change through photosynthesis, surface albedo, and roughness [1,2] and is recognized as a natural linkage between the pedosphere, atmosphere, and hydrosphere of the Earth’s systems [3–5]. Improved knowledge of vegetation variations and their relationship with climatic variables (mostly focusing on precipitation and temperature) at various spatial and temporal scales is an important and desirable goal for projecting future vegetation growth trends and their responses to climatic change [6,7]. Recently, the response of vegetation to climate change has attracted considerable attention, particularly since the satellite-derived normalized difference vegetation index (NDVI) has been available from the early 1980s [7–11] and has increasingly become a hot topic in climate-change studies [4,5].
The Mongolian Plateau is a unique arid and semiarid region in the world, with various political and economic activities affecting its ecosystems [12,13]. The northern part of the plateau is in the Republic of Mongolia, and the southern part is in the Inner Mongolia Autonomous Region of the People’s Republic of China [14,15]. Previous studies have suggested that the sandstorms that affected northeastern Asia around 2000 most probably originated from the central and southern parts of the plateau [16,17]; that sandstorm frequency tends to increase with increases in drought stress [18,19]; and that vegetation decline in some parts of the plateau contributed to an increase in sandstorms [17,20]. However, very few studies have demonstrated where in the plateau this vegetation decline occurred and when and why it occurred. Although some studies have documented vegetation dynamics and its response to climate change in the plateau [3,21–23], most of them focused only on Inner Mongolia or on some part of Inner Mongolia like the Hulun Buir grassland ecosystem [21,22]. However, few studies focused on Mongolia itself. In particular, studies of vegetation dynamics on the entire plateau, including both Mongolia and Inner Mongolia, have not been available in the scientific literature. In addition, the relevant studies on the plateau were conducted mainly for the period from the early 1980s to the late 1990s [23] or in the last decade [3,21]. Little is known about continuous vegetation dynamics in the entire plateau and the response of vegetation to climate change over the past three decades.
A common way to detect the response of vegetation to climate change is to use a satellite-derived vegetation index. One of the most widely used vegetation indices is the NDVI [24,25]. In particular, time series of NDVI data derived from the National Oceanic and Atmospheric Administration (NOAA) satellite have been widely used to identify vegetation activity due to their relatively long coverage period [7–11]. Recently, the third-generation Global Inventory Modeling and Mapping Studies (GIMMS) NDVI dataset derived from the Advanced Very High Resolution Radiometer (AVHRR) sensors (GIMMS NDVI3g) extended the traditional GIMMS NDVI to quantify regional vegetation dynamics for a sufficiently long term [25,26]. However, to extend vegetation dynamics measurements through time, particularly for future observations, and to overcome the limitation of a single data source, there is a great need to combine the new NDVI time-series dataset from MODIS with the traditional GIMMS NDVI by developing a cross-calibration method between different NDVI datasets from different sensors [27–29].
This study includes a thorough examination of vegetation dynamics in the Mongolian plateau for the period from 1982 to 2010 by integrating the GIMMS NDVI (1982–2006) and the MODIS NDVI (2000–2010) using a pixel-based linear regression model. Specifically, this paper will (1) describe a thorough examination of variations in spatiotemporal vegetation dynamics in the plateau over a 29-year time period; (2) identify the relative contribution of climatic variables to vegetation dynamics throughout the observation period; and (3) examine vegetation variations by vegetation type and their discrepancies in responses to climate variables. In view of the different impacts of political and economic activities on ecosystems in the Inner Mongolia Region of China and in Mongolia, vegetation changes are also compared on both sides of the border.
2. Methodology
2.1. Study Area
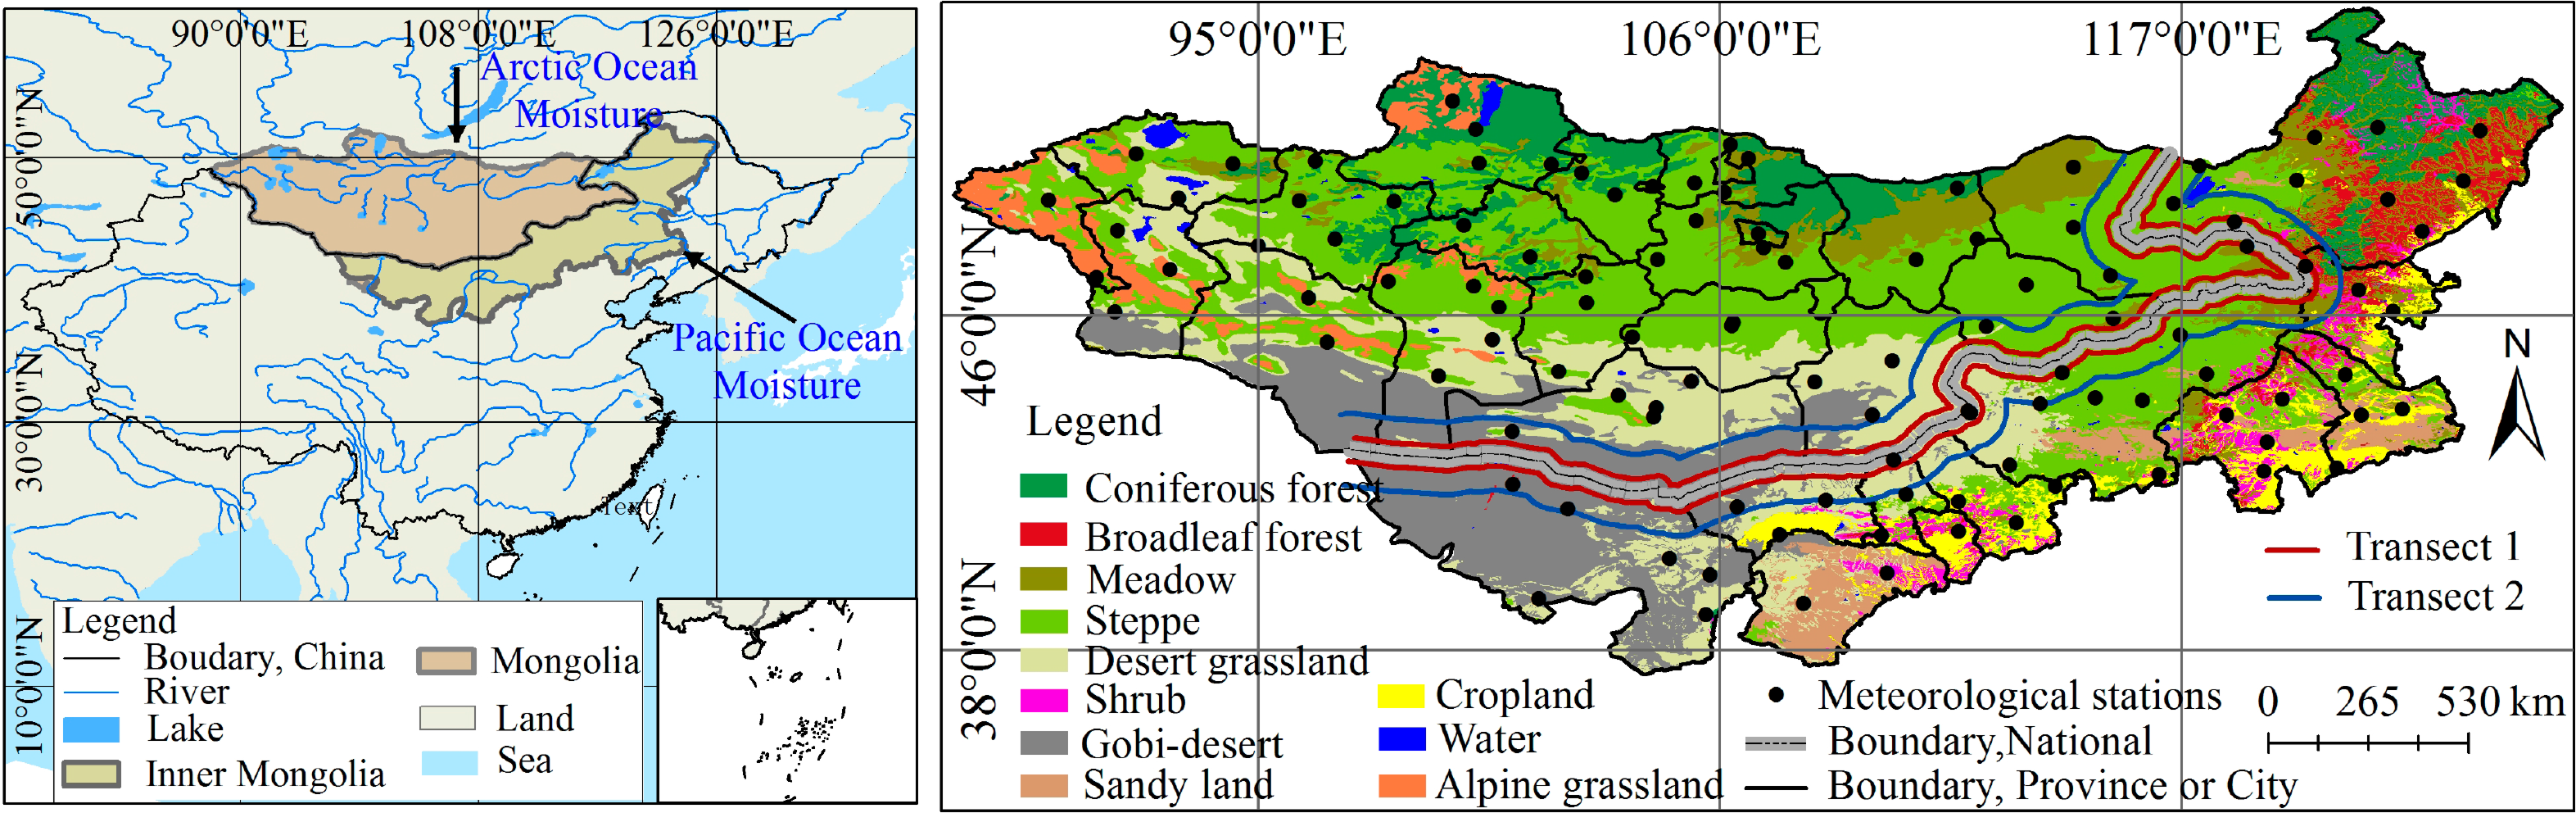
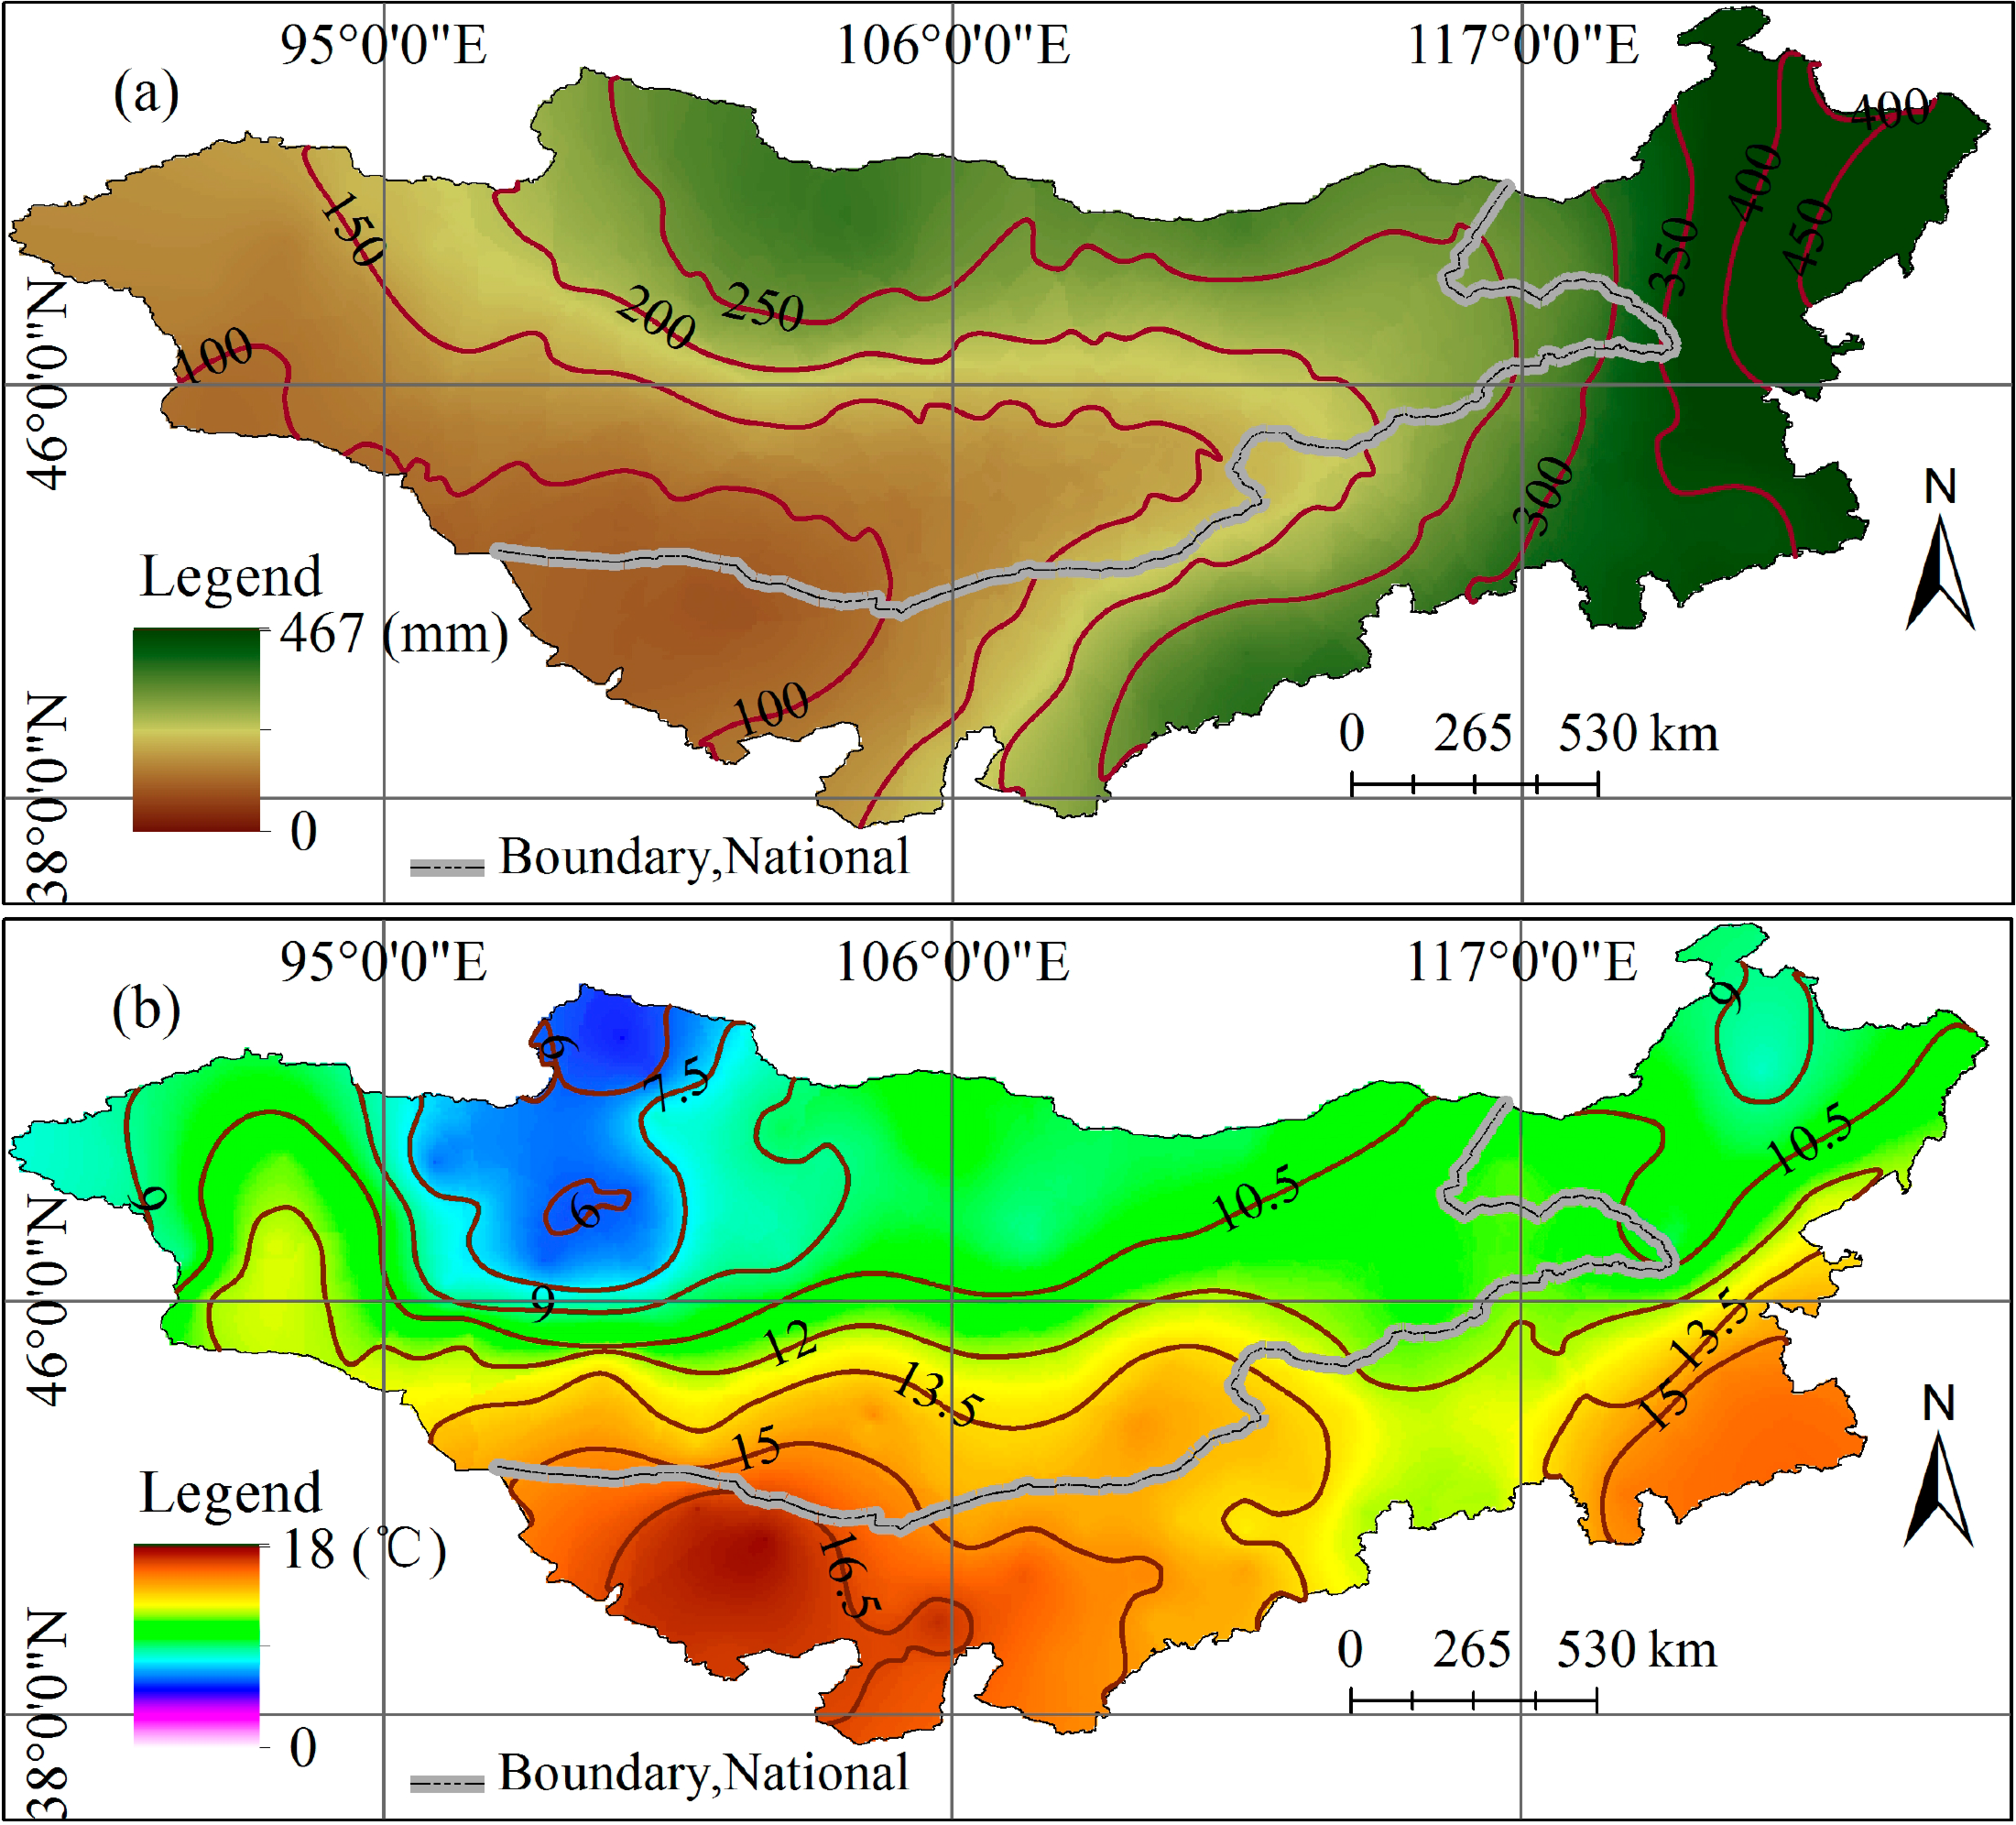
The Mongolian plateau is located in a transitional belt from the Gobi Desert of Central Asia to the Siberian taiga forest, extending from 87°43′E to 126°04′E and from 37°22′N to 53°20′N, with an area of approximately 2.7 × 10⁶ km2 (Inner Mongolia: 1.2 × 10⁶ km2, Mongolia: 1.5 × 10⁶ km2) (Figure 1). The plateau is governed by a typical continental climate regime with hot summers and cold winters. Annual precipitation ranges from <50 mm in the southern and western inland portions of the Gobi Desert to >400 mm in the northeastern forest regions (Figure 2a). Annual mean temperature is primarily latitude-dependent, ranging from <1.5 °C in the northern mountains to >16 °C in the southwestern Gobi Desert (Figure 2b). Under the influence of climatic differentiation, vegetation across the plateau displays an obvious latitudinal zonation. Most vegetation types of arid and semiarid regions, such as transecting forest, meadow, shrub, alpine steppe, steppe, desert steppe, and Gobi Desert vegetation, can be found in the plateau. Steppe grassland accounts for approximately 70% of the plateau.
The plateau includes 33 administrative divisions (Mongolia: 21 provinces, Inner Mongolia: 12 Aimags or cities; Figure 1), with a total population of 24.3 million in 2012 (Mongolia: 2.3 million, Inner Mongolia Region of China: 22 million). The population density in Mongolia is the lowest in the world, with 1.5 persons per square kilometer, and human impacts on the ecosystem are minimal due to the prevalence of nomadic herding over a long time period [12]. This situation provides a unique near-natural ecosystem for studying how vegetation dynamics responds to climate change [30].
2.2. Datasets
The NDVI is often used as a proxy for terrestrial vegetation productivity in studies of vegetation dynamics at regional and global scales because it is closely correlated with biomass, leaf area index, productivity, and potential photosynthesis [8]. The GIMMS NDVI and MODIS NDVI together cover the period from 1982 to 2010. The GIMMS NDVI dataset was produced by the Global Inventory Monitoring and Modeling studies group using the NOAA/AVHRR series satellites (NOAA 7, 9, 11, 14, 16, 17, and 18) data at a spatial resolution of 8 km and a 15-day interval for the period from 1982 to 2006 [31]. This dataset is famous for its high quality, having been corrected to remove some non-vegetation effects caused by solar angle and sensor errors, and has been widely used to monitor long-term trends in vegetation activity from regional to global scales [8,28]. To decrease further the effects of cloud and aerosol scattering, a monthly NDVI dataset was developed in this research by applying the maximum value composite (MVC) method [32] to the two NDVI images for each month, as done in a previous study [9]. The MODIS NDVI dataset used is the MOD13C1 product derived from the Terra MODIS instrument with a spatial resolution of 5.6 km and a 16-day interval from 2000 to 2010. This dataset has been referred to as the “continuity index” with respect to the existing NOAA/AVHRR derived GIMMS NDVI for historical applications in global monitoring of vegetation dynamics [33]. To match the temporal and spatial resolution of the GIMMS NDVI, the MODIS NDVI has been spatially resampled at 8 km and temporally aggregated to monthly values using the MVC method. All monthly NDVI images were then partitioned to the study area to generate a monthly NDVI sequence from 1982 to 2010 with an 8-km spatial resolution. Given that photosynthesis in most plants in the plateau stops during winter and given the effect of winter snow cover, this research focused only on the growing-season NDVI [3,34]. The NDVI from April to October for each year was defined as the growing-season NDVI to quantify vegetation dynamics [35]. Pixels with an average growing-season NDVI < 0.08 were marked as non-vegetated pixels and excluded. This threshold is the median of the 0.05 value proposed by Myneni et al. [36] and the 0.1 value proposed by Piao et al. [35].
Climatic datasets consisting of monthly mean temperatures and monthly precipitation amounts were collected from 108 meteorological stations (Inner Mongolia: 48, Mongolia: 60) across the plateau (Figure 1) and provided by the Inner Mongolia Weather Bureau and the Mongolia Weather Bureau. According to the locations of meteorological stations, monthly climatic data were first interpolated in the ArcGIS environment using the Kriging method at a spatial resolution of 8 km, and rasterized time sequences of growing-season mean climatic variables were then generated to match both temporally and spatially the time sequences of growing-season mean NDVI. The spatial patterns of annual mean temperature and precipitation in the study area are shown in Figure 2.
Information on the distribution of vegetation types was obtained from the vegetation atlas of Mongolia (Mongolian Academy of Sciences, Ulaanbaatar, Mongolia, 2009) and a vegetation map of Inner Mongolia with a scale of 1:1000000. Based on these maps and the criteria of the Editorial Board of Rangeland Resources of China (Editorial Board of Rangeland Resources of China, Rangeland Resources of China, Science Press, Beijing, China, 1996) [37], vegetation types in the plateau were grouped into the following ten types: coniferous forest, broadleaf forest, shrubs, meadow, steppe, desert steppe, alpine steppe, sandy land vegetation, crops, and Gobi Desert vegetation (Figure 1).
2.3. Methods
2.3.1. Cross-Calibration and Consistency Checking between GIMMS and MODIS NDVI Datasets
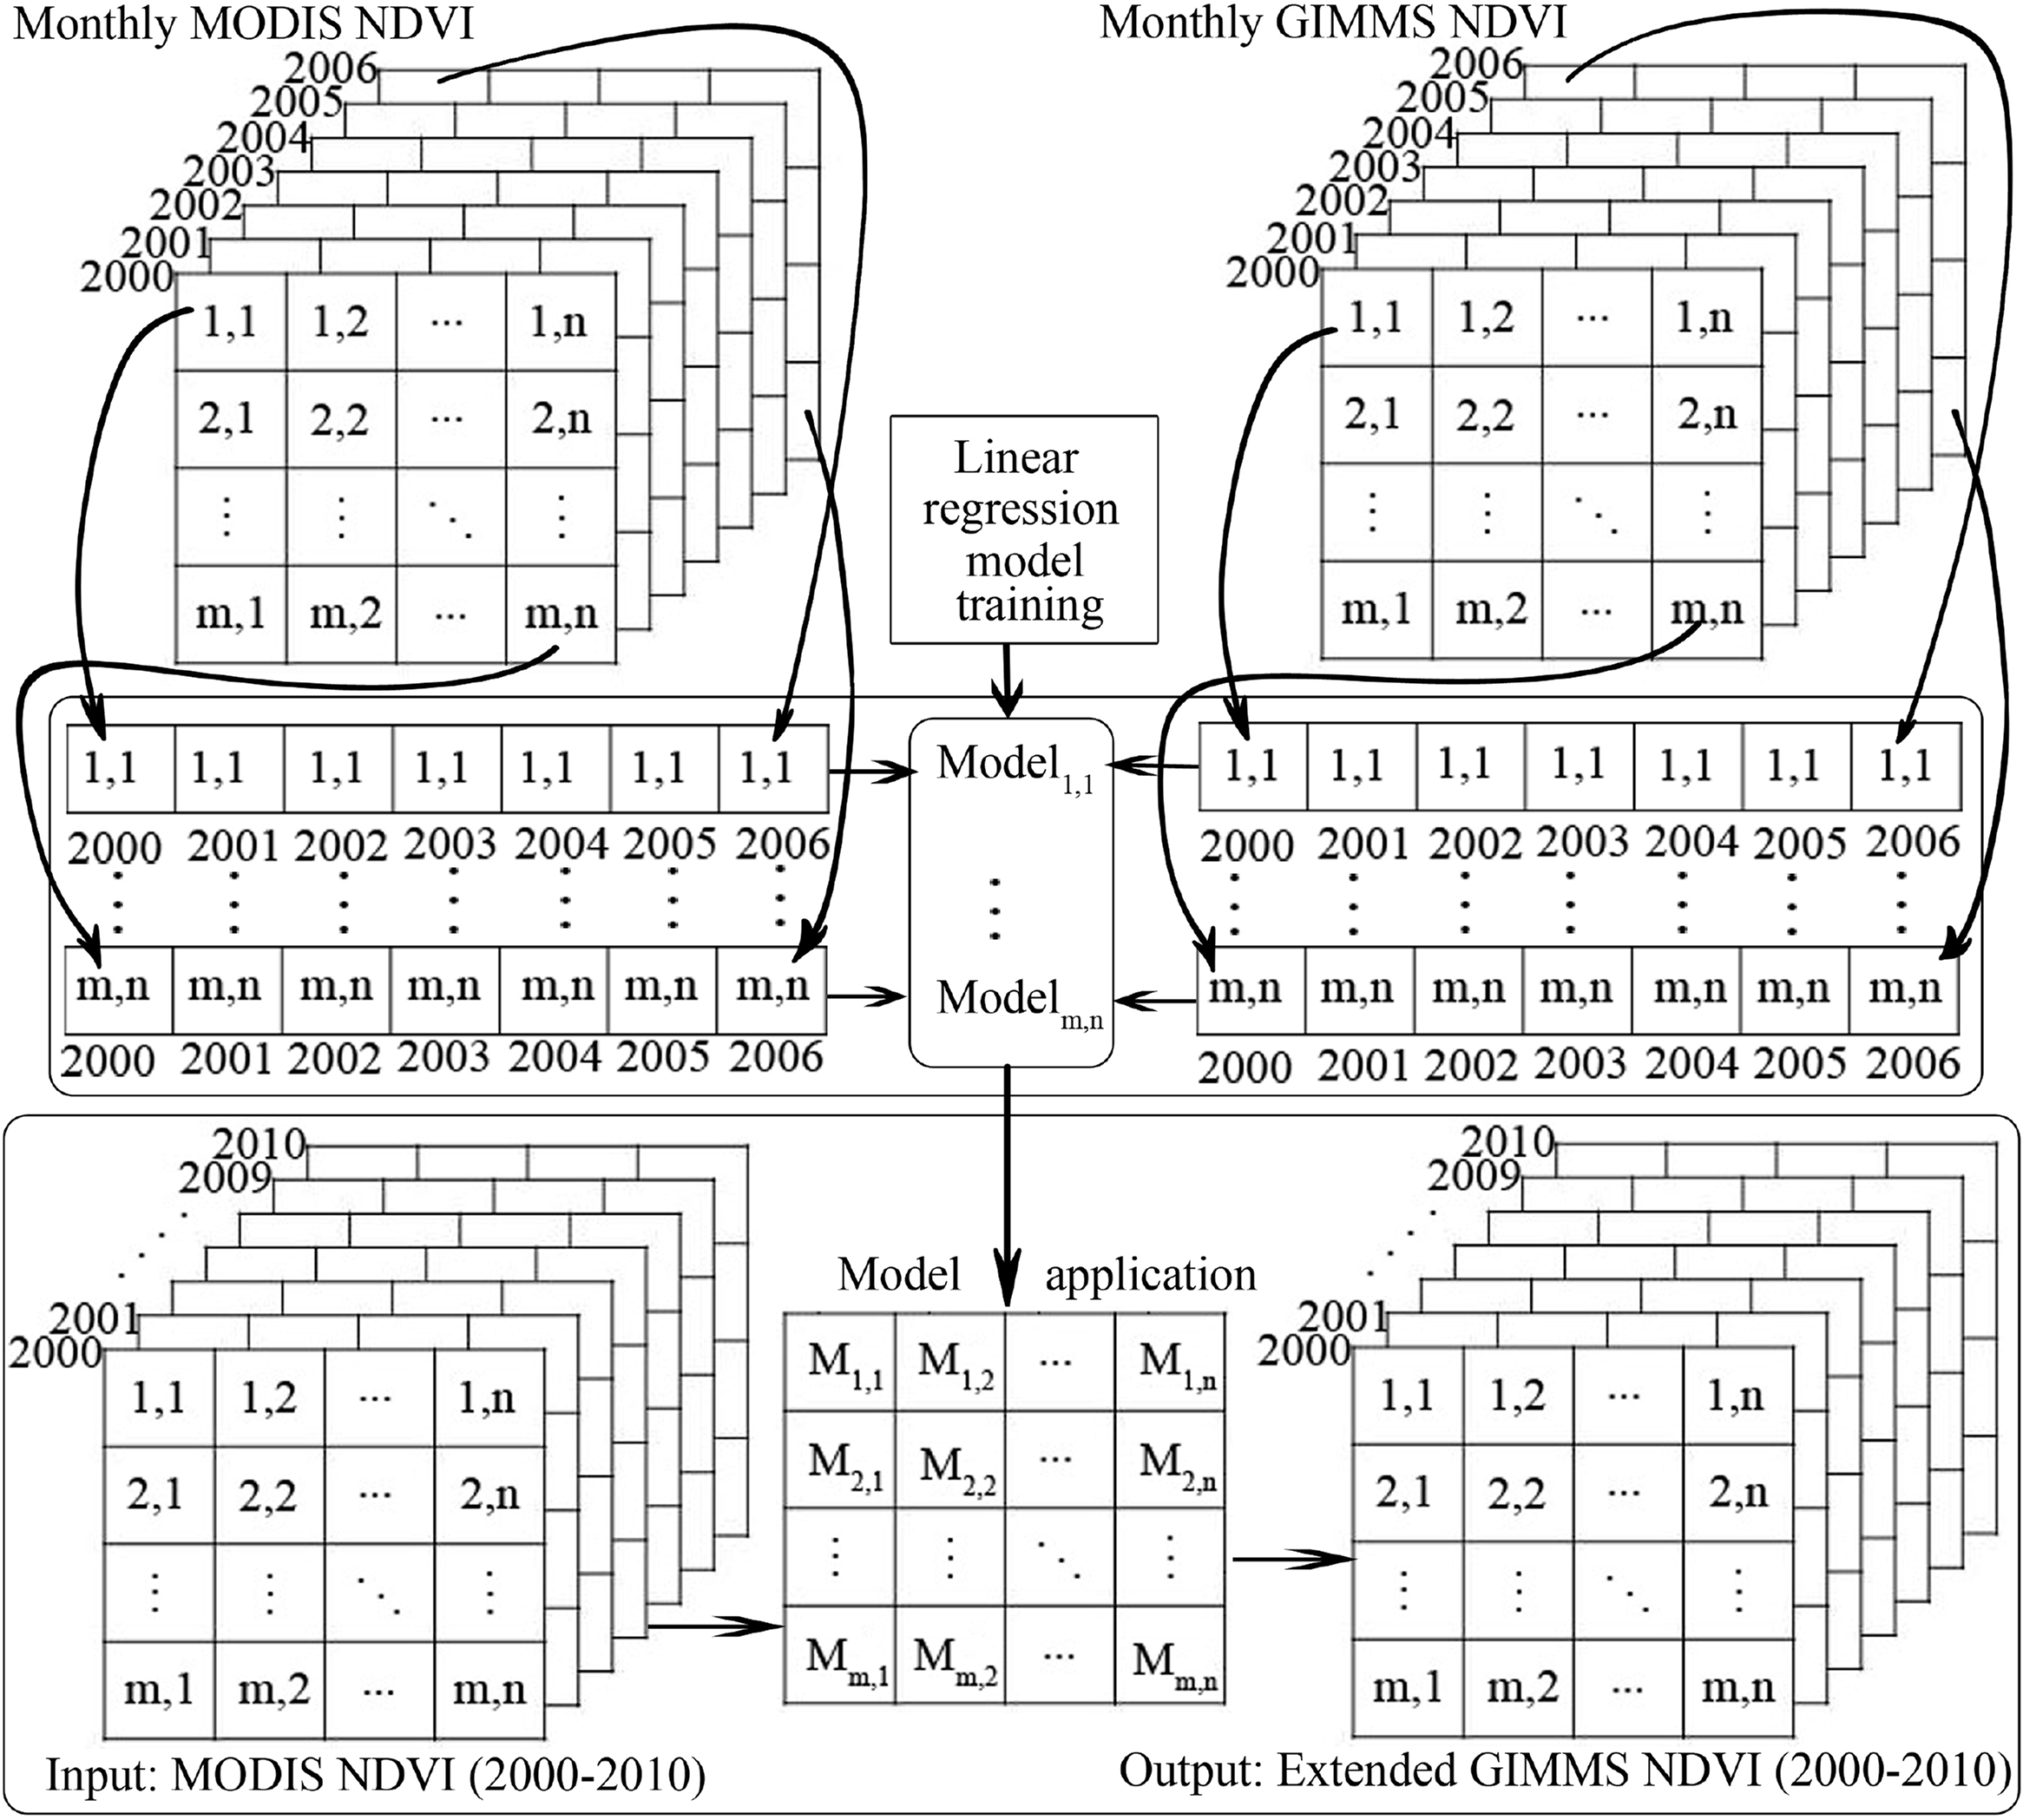
For global applications focusing on vegetation responses to climate change and to extend measurements over time, it is necessary to combine data from more than one observing system to fill gaps in observations [27,29]. However, due to spectral and spatial differences in remote-sensing systems, cross-calibration and consistency checking of NDVI data from different sensors are required before examining long-term vegetation dynamics using multiple-sensor data [28,29]. The GIMMS NDVI and MODIS NDVI datasets have the same time series from 2000 to 2006, and this provides a good opportunity to create a conversion function to calibrate NDVI data from one sensor to another. In the present study, similarly to Mao et al. [28], a linear regression model was established for each pixel and for each month of the growing season by regressing GIMMS NDVI as a function of MODIS NDVI for the overlapping period 2000–2006 (Equation (1)). Subsequently, the resulting functions were applied to the monthly MODIS NDVI data from 2000 to 2010, as shown by the framework in Figure 3, to generate a new dataset with characteristics similar to the GIMMS dataset, which will be referred to as the Extended GIMMS NDVI [28]:
2.3.2. Vegetation Dynamics and Its Response to Climate Change
The mean monthly NDVI and climatic variables were computed from April to October for each year (GIMMS NDVI for 1982–2006, new extended GIMMS NDVI for 2000–2010) and were then used as a proxy for the annual mean status of vegetation growth as proposed by Piao et al. [9] to study vegetation and climatic variations over the study period. Linear time trends were evaluated using the ordinary least-squares method for NDVI and climatic variables to quantify the magnitude of these trends [28,35] (Equations (2) and (3)):
The linear trend was calculated for the spatial average NDVI time series over the plateau, Inner Mongolia, and Mongolia to examine overall trends of regional vegetation growth and their differences across the border. To detect further spatial characteristics of vegetation growth trends, the linear trend for each pixel were also examined. A P value < 0.05 was taken as evidence that the change trend was significant [35,38]. According to the vegetation map, an NDVI value was extracted for each vegetation type to analyze vegetation dynamics at the biome scale. The average NDVI value for a particular vegetation type was calculated from the average of all grid pixels belonging to the same vegetation type.
To understand the climatic factors driving vegetation variation in the plateau, the Pearson correlation coefficients between NDVI and climatic variables were estimated to determine the extent of the relationship between them. Correlation analysis was performed at both the spatial average value scale and pixel scale. The mean temperature and total precipitation for each vegetation type were also extracted on the basis of the vegetation map of the plateau to analyze the response characteristics of particular vegetation types to temperature and precipitation variation.
Considering the differences in social and economic activities along the China–Mongolia political border, two transects parallel to the border in a southwest-to-northeast direction were designed to compare vegetation-cover changes on each side of the international border (Figure 1). Transect 1 was approximately 16 km away from the border, and transect 2 was approximately 96 km away from the border.
3. Results and Discussion
3.1. Consistency Check
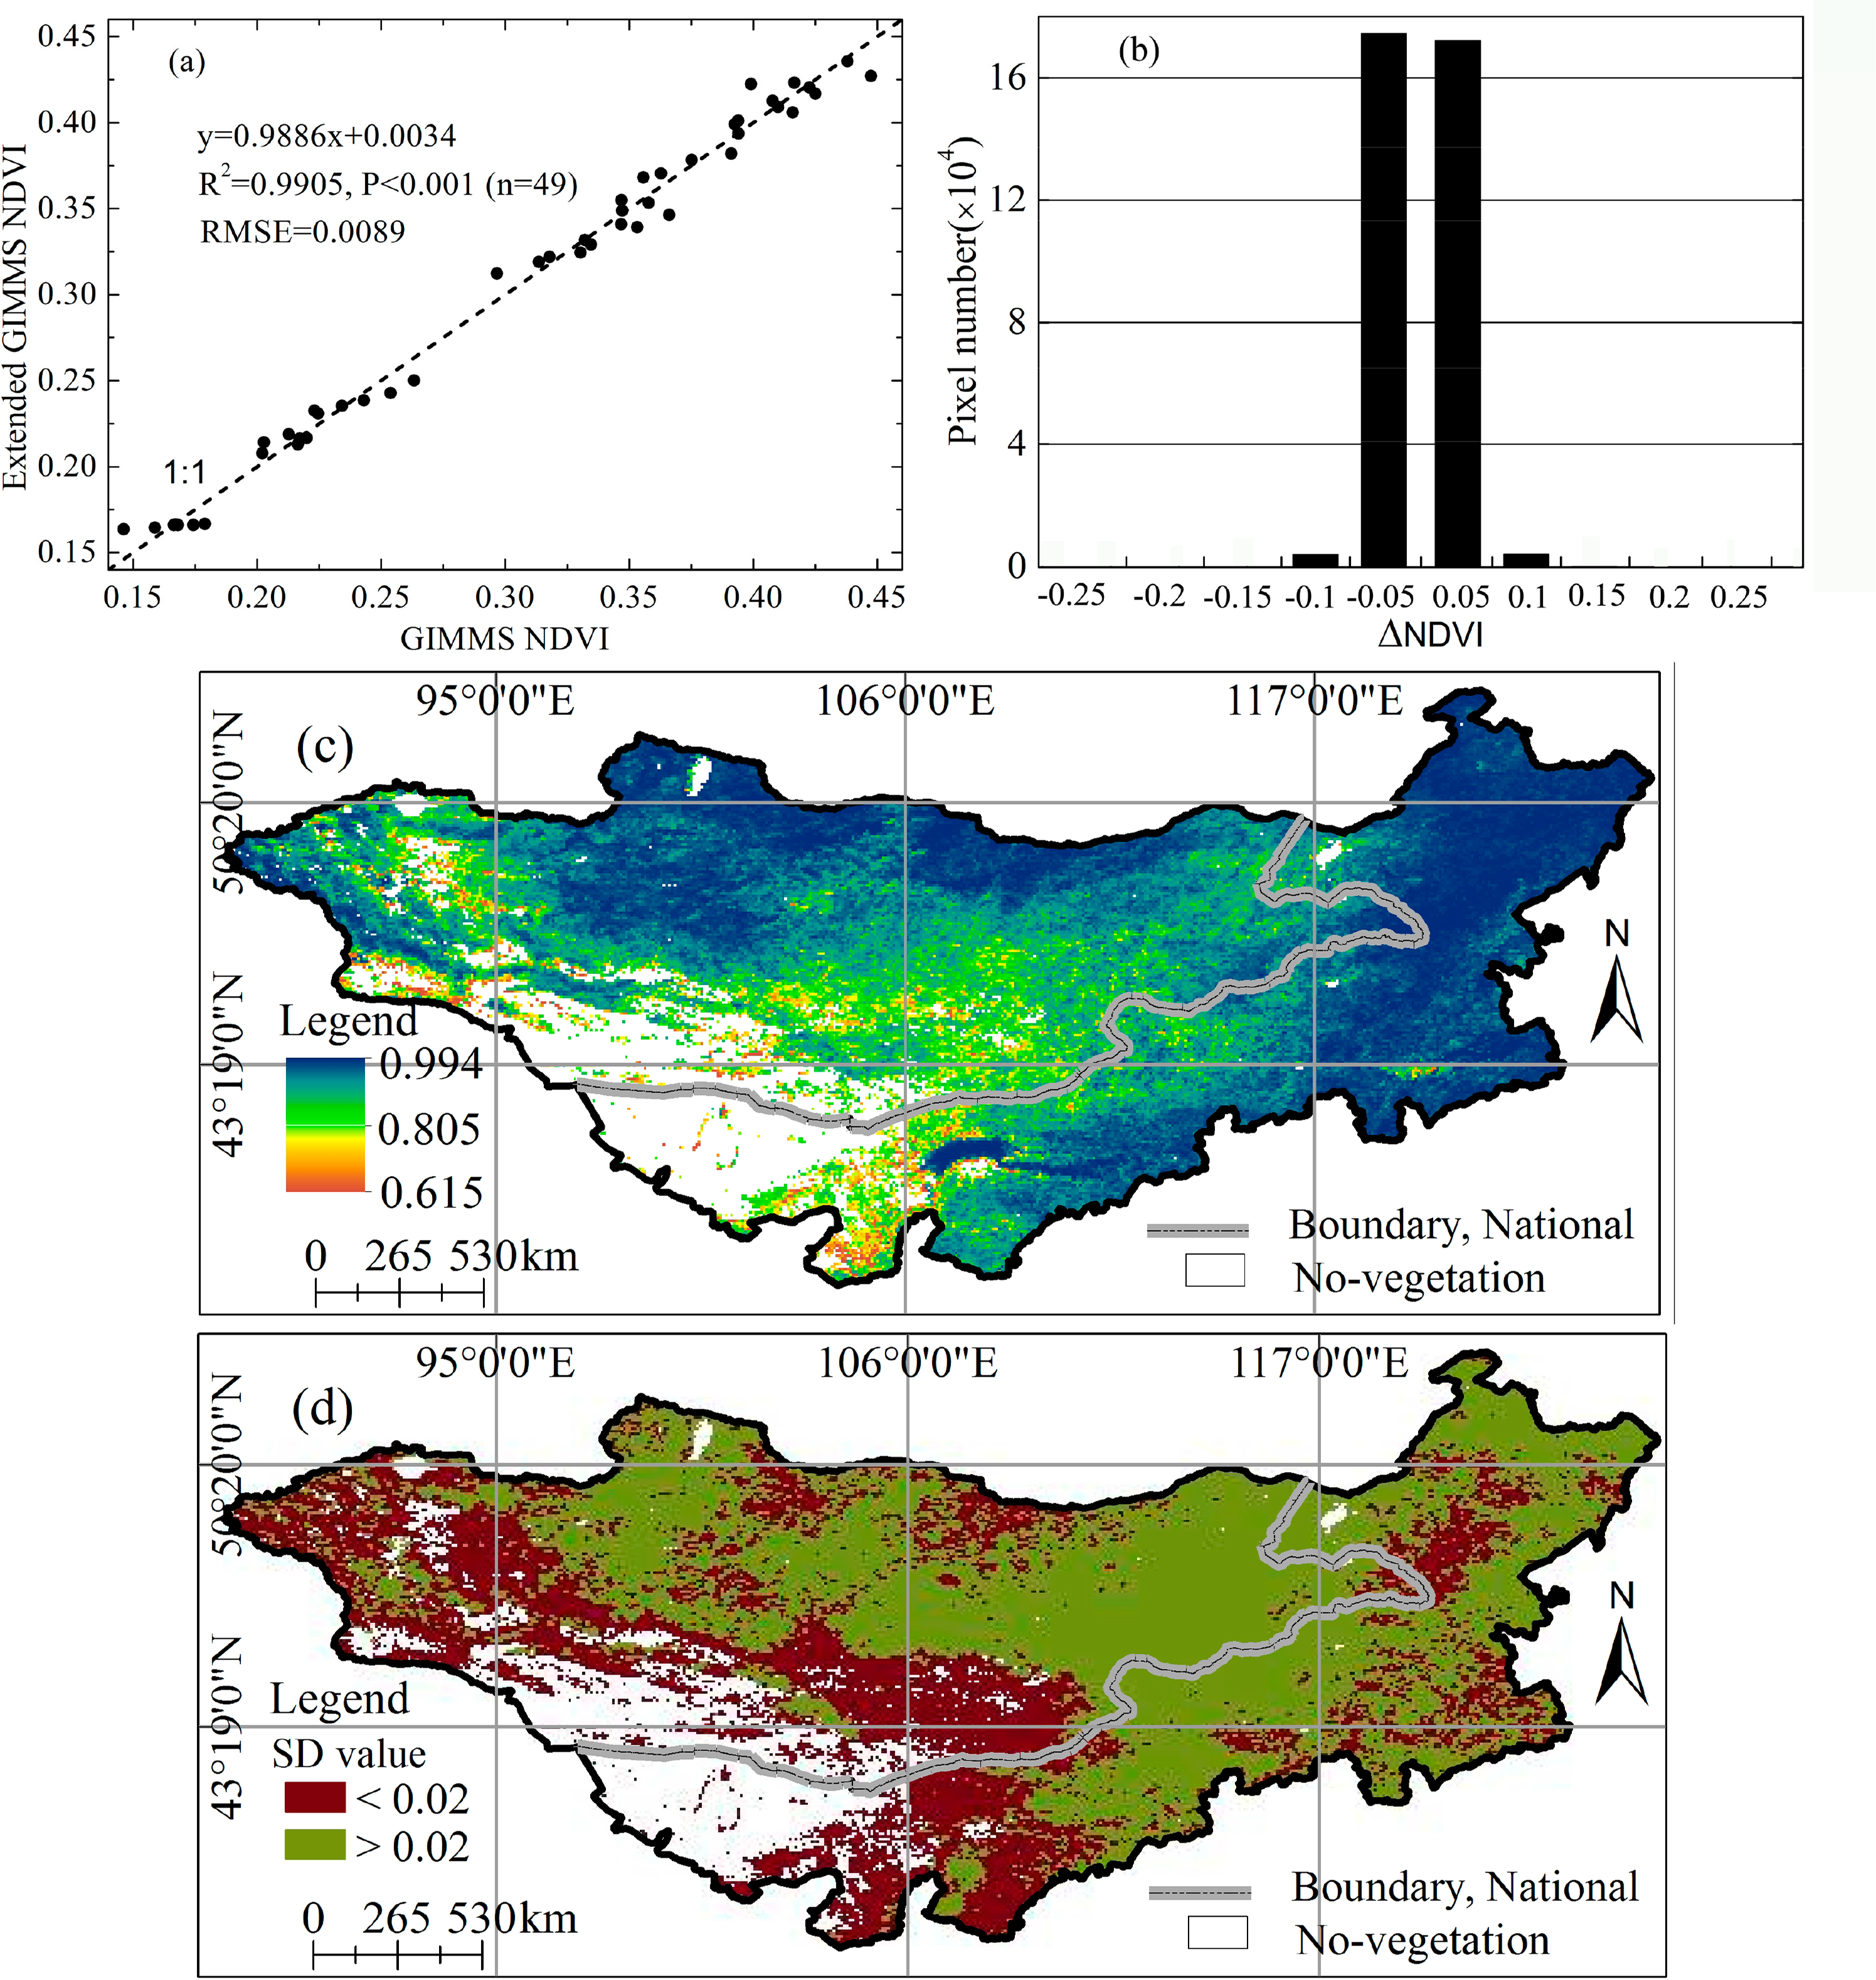
Developing a dataset that combines NDVI datasets from multiple sensors to obtain a consistent and sufficiently long-term NDVI time series is significant for future work because of the limited lifespan of a single satellite and sensor. Figure 4 shows the calibration results from MODIS NDVI to GIMMS NDVI using the per-pixel linear regression model for seven overlapping years (2000–2006). The results revealed that the monthly spatial average of the new NDVI (Extended GIMMS NDVI) is strongly consistent with the traditional GIMMS NDVI, with a coefficient of determination of 0.99 and a relative mean square error (RMSE) of 0.0089 (Figure 4a). Moreover, the difference values between −0.05 and 0.05 in all pixels for mean growing-season NDVI accounted for over 97.6% of all differences, which was comparable to results of previous studies [27,28,38] (Figure 4b). High per-pixel correlations also exist between the two monthly NDVI datasets (Figure 4c). Although areas of sparse vegetation cover in the southwestern part of the plateau generally showed lower R values (above 0.615), the P values for all pixels were <0.001. The lower R values may have been caused partly by the lower annual NDVI standard deviation of <0.02 for these regions in the plateau [39] (Figure 4d), indicating where the variation in annual NDVI is relatively small.
3.2. Spatial Patterns of NDVI in the Plateau
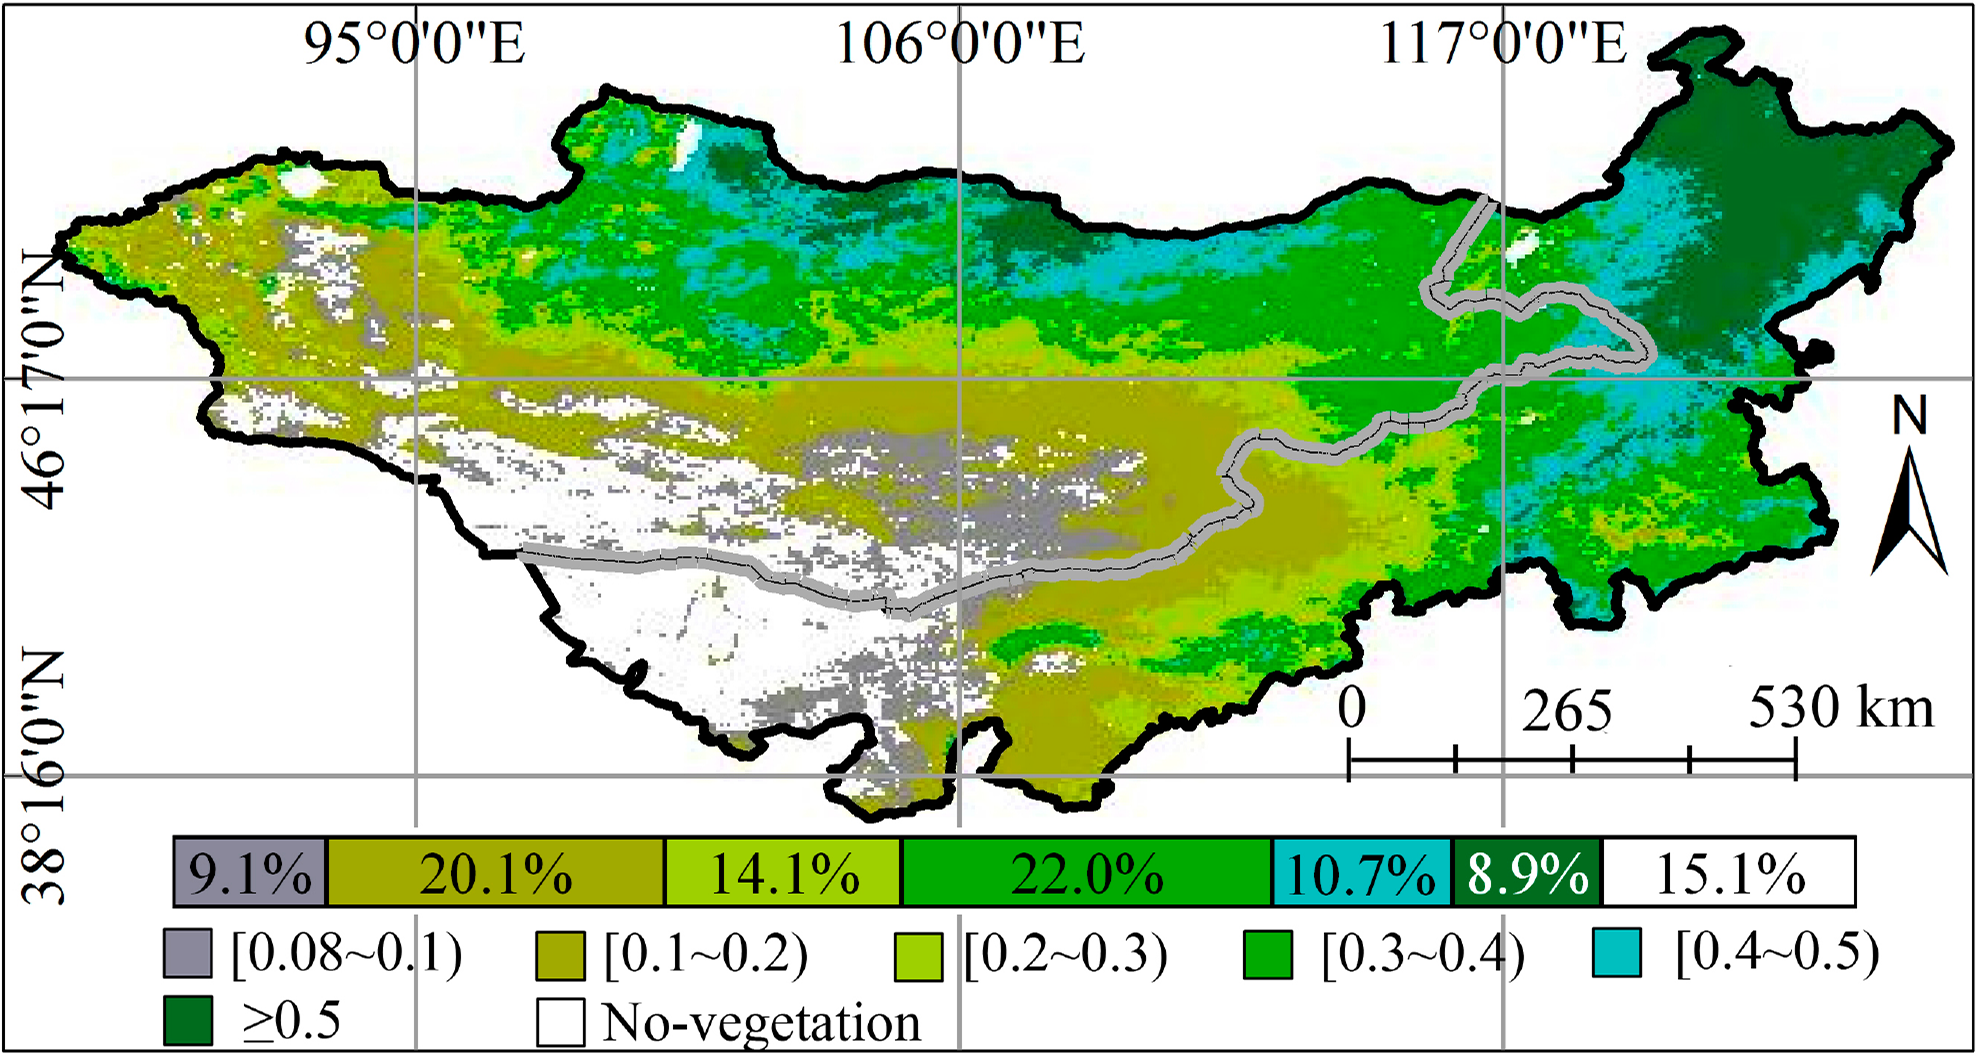
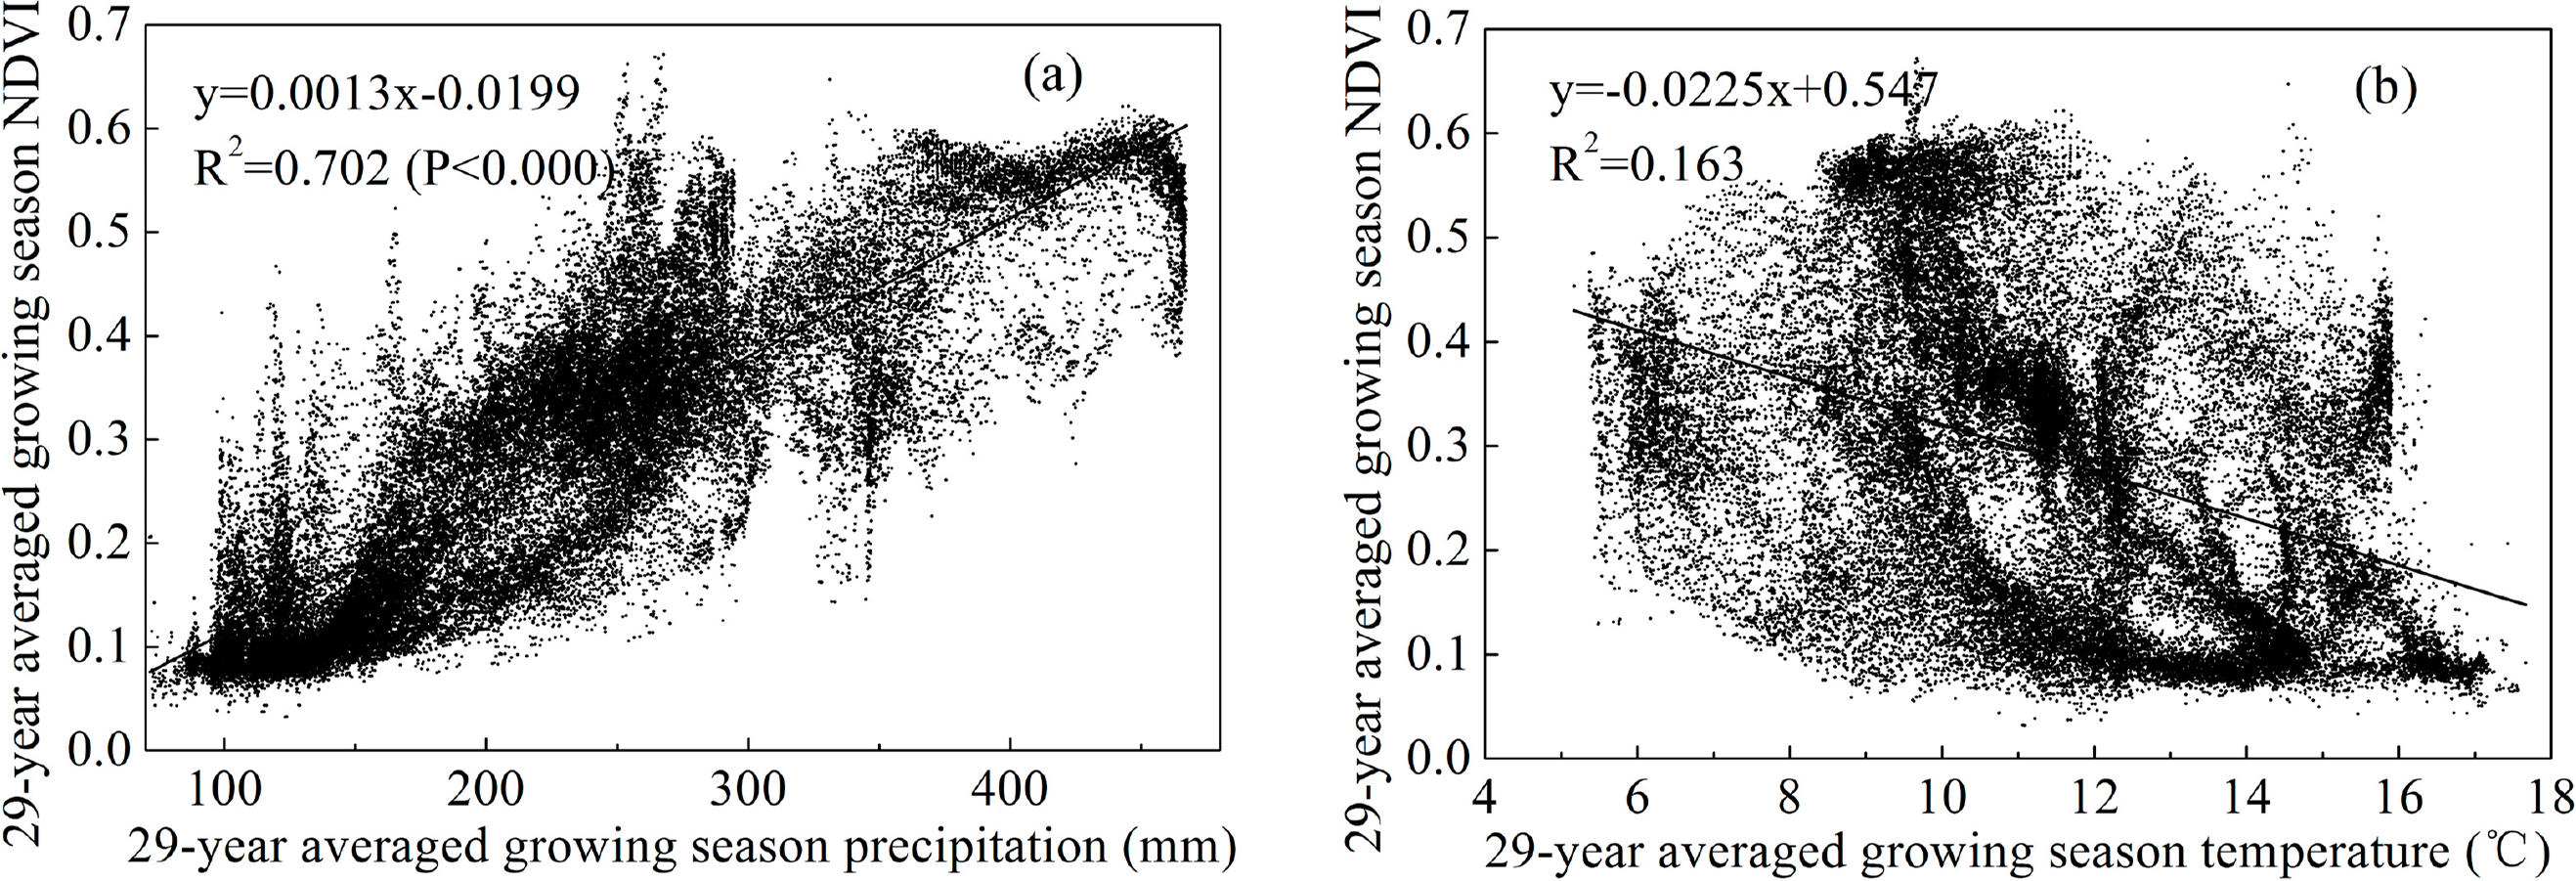
Figure 5 highlights the spatial patterns of the 29-year mean NDVI in the plateau. Consistent with the distribution of vegetation types (Figure 1), the NDVI exhibited a decreasing trend from the northeast to the southwest and from the north to the south. The pixels with an NDVI value >0.5 accounted for 8.9% of the plateau and tended to be distributed over northern Mongolia and Northeastern Inner Mongolia, in areas of high-density forest. Moderately high values between 0.2 and 0.5 are observed in the central parts of the plateau, where the land is dominated by meadow and steppe grassland, accounting for 46.8% of the plateau. Low NDVI values < 0.2 were generally distributed in the dry grasslands of the southwestern and western regions, accounting for 29.2% of the plateau. It is noteworthy that this spatial pattern also appeared to be spatially coupled with the precipitation pattern (Figure 2a), indicating that precipitation is the primary climatic control on vegetation activity in the plateau, although the relatively complex contribution of climatic variables to vegetation growth may be regionally dependent. This result is strongly supported by the significant positive correlation between the NDVI and the precipitation for each pixel (Figure 6a). However, the NDVI was negatively, but non-significantly, related to temperature at the plateau scale (Figure 6b), suggesting that against the background of global warming, the growing-season thermal resources in the plateau are sufficient and that an increase in temperature may restrict vegetation growth because of temperature-related drought [3].
3.3. Comparison of NDVI Variation across the China–Mongolia Border
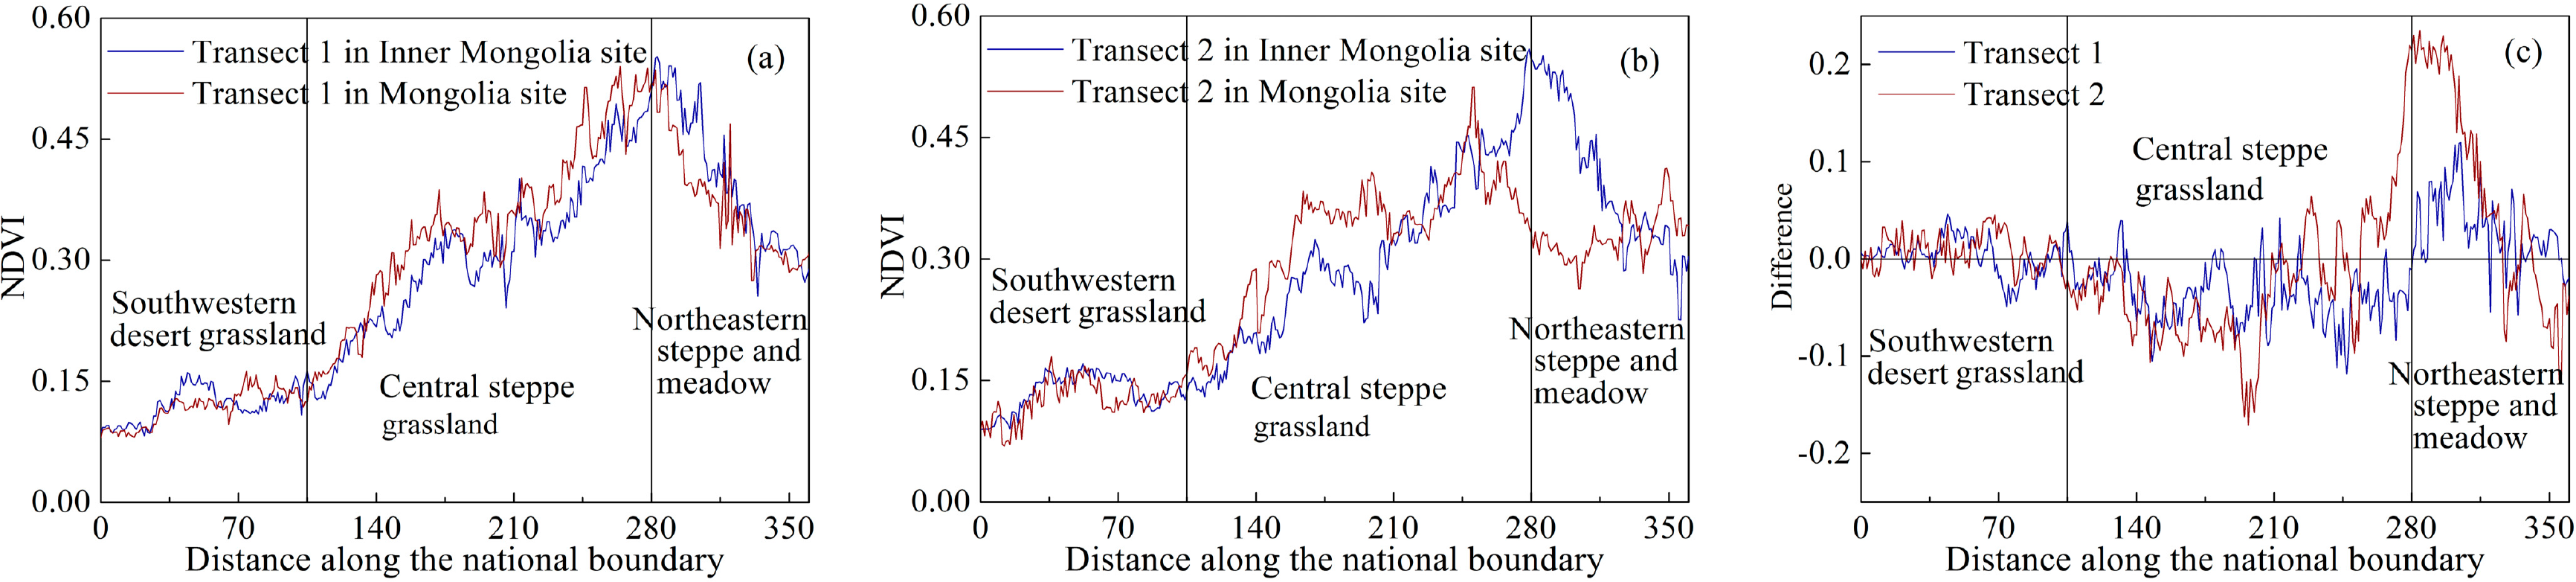
Figure 7 compares NDVI changes across the political border between China and Mongolia based on the transects designed as shown in Figure 1. Unlike the vegetation discontinuity and sharp contrast of vegetation cover observed along other political borders such as between the United States and Mexico [1] and between Israel and Egypt [40], no distinct difference in NDVI patterns was observed along the China–Mongolia border, as can be seen in Figure 5. However, three interesting features can be identified in Figure 7. First, the NDVI in the northeast was generally higher than in the southwest (Figure 7a,b). The NDVI for both Mongolian and Chinese sites usually increased from <0.15 to >0.5 and then decreased afterward to around 0.3. This feature can probably be attributed to distance from the Pacific Ocean. Within a short distance from the ocean in the northeast, the NDVI exhibited higher values than in the southwestern arid region, which is far from the ocean. Second, the NDVI changed differently along the two transects from the southwest to the northeast between Mongolia and Inner Mongolia. In the southwestern desert grassland region, it was difficult to distinguish the difference in the NDVI on both sites of the border. The mean NDVI of the two transects was approximately 0.129 for both Mongolia and Inner Mongolia. In the central steppe grassland region, Mongolia tended to have a relatively higher mean NDVI than Inner Mongolia. The average of the two transects was 0.362 for Mongolian sites and 0.317 in Inner Mongolia. In the northeastern steppe and meadow grassland regions, the NDVI in Inner Mongolia was usually higher than in Mongolia. The average of the two transects was 0.352 for Mongolia and 0.399 for Inner Mongolia. Finally, the differences between transects in Mongolia and Inner Mongolia increased with distance from the border, particularly in the central and northeastern regions (Figure 7c).
3.4. Trends in Spatial Average NDVI and its Relationship with Climatic Variables
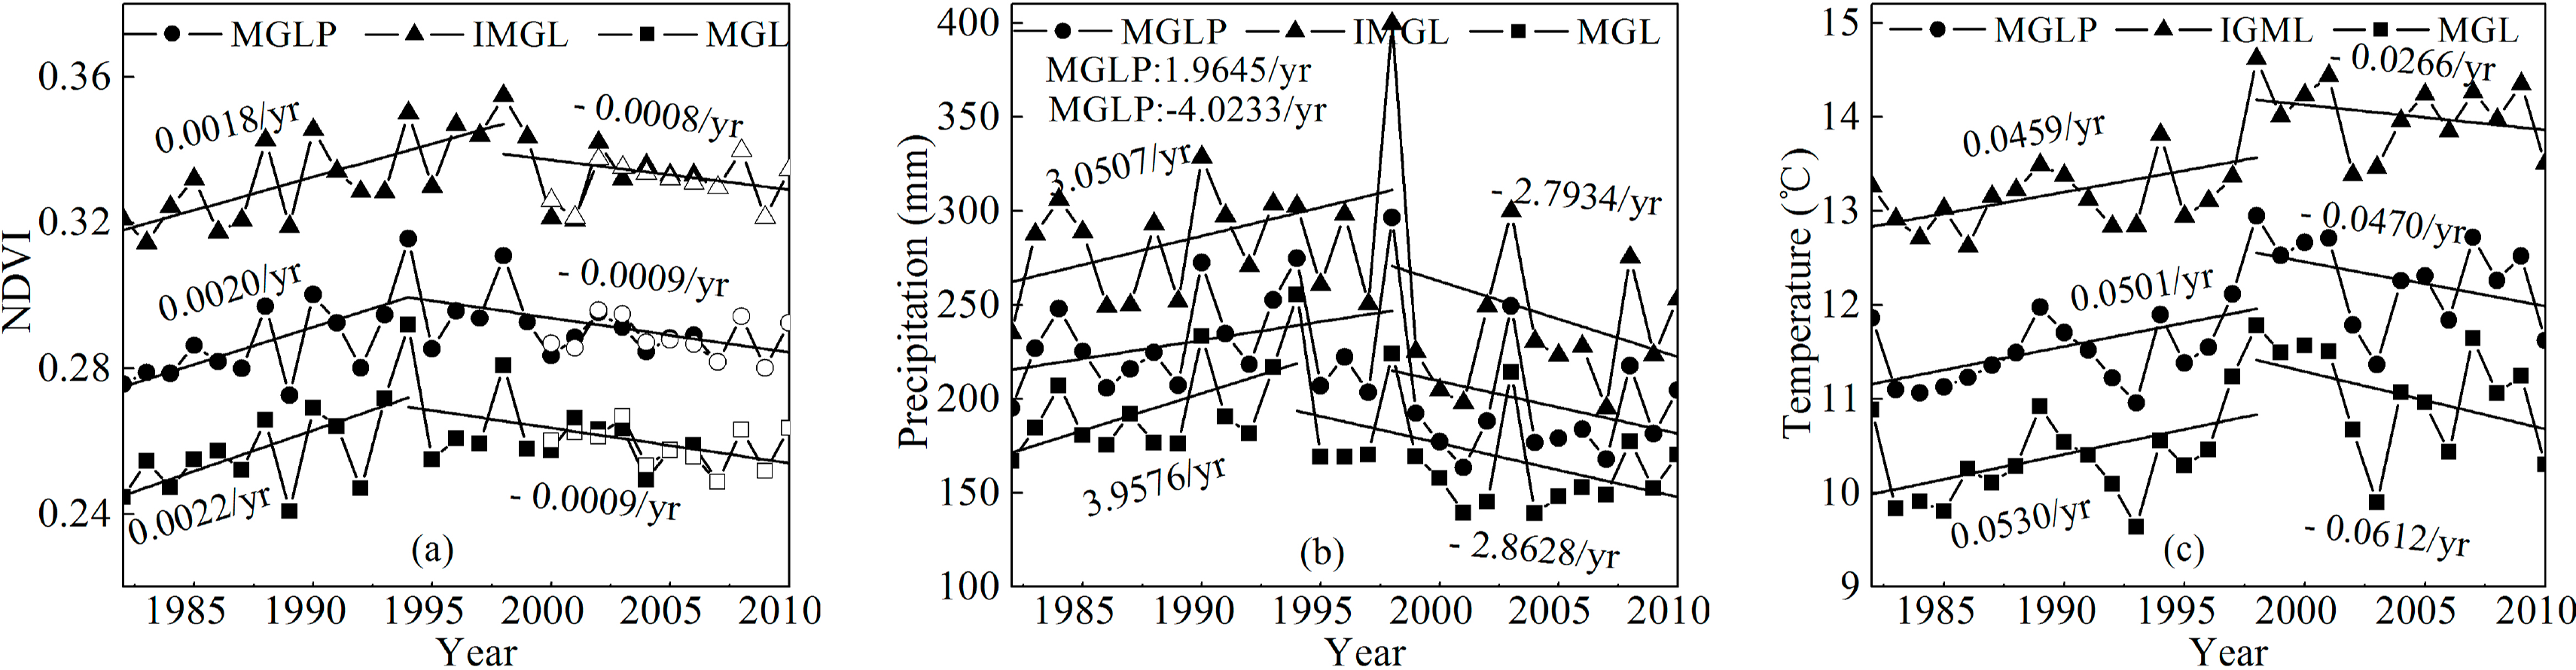
Figure 8a shows the interannual variation of spatial average growing-season mean NDVI for the entire Mongolian Plateau and in the subareas of Mongolia and Inner Mongolia from 1982 to 2010. As discussed in Section 3.1, the high degree of continuity and consistency between the two NDVI datasets can also be clearly observed in Figure 8a (○, ▵, □ represent the extended GIMMS NDVI for the entire plateau, the Chinese part, and the Mongolian part respectively).There was an obvious NDVI trend reversal around the mid- or late 1990s over the plateau. For the Mongolia subarea, NDVI significantly increased at a rate of 0.0022/yr (R = 0.63, p = 0.02) before 1994 and then decreased by −0.0009/yr (R = −0.46, p = 0.07) after 1994. By comparison, for Inner Mongolia, the NDVI trend reversal occurred in 1998, with a significant increasing trend (trend rate: 0.0018/yr, R = 0.73, p = 0.0009) before 1998 and a decreasing trend (trend rate: −0.0008/yr, R = −0.33, p = 0.28) afterwards. At the entire plateau scale, the reversal seems to have been dominated by the reversal in Mongolia, which also occurred in 1994, and with a similar trend magnitude to Mongolia before and after 1994. However, the NDVI in Inner Mongolia was higher than in Mongolia for each year, indicating that the mean vegetation coverage of Inner Mongolia was denser than in Mongolia.
Climate records (temperature and precipitation) showed wetting and warming trends before the mid- or late 1990s and drying and weak cooling trends after that (Figure 8b,c), suggesting that the current drought stress was caused by decreased precipitation and relatively high temperature. This reversal in climate, particularly in precipitation, has led to an NDVI trend reversal in the plateau. This was further confirmed by correlation analysis between the NDVI and climatic variables (Table 1). Regardless of observation period or subarea, the NDVI was strongly and positively correlated with precipitation, but related only weakly, or even negatively, to temperature, implying that precipitation amounts in the growing season are a key factor controlling vegetation dynamics in the plateau over the long term. By comparison, the correlation between the NDVI and precipitation in Mongolia was higher than in Inner Mongolia, suggesting that vegetation water demand in Mongolia is higher than in Inner Mongolia due to its greater distance from the ocean.
This NDVI trend reversal over the plateau is in agreement with reversals observed in Eurasia and North America, where increasing NDVI trends have been stalled or reversed since the mid- or late 1990s [7,9]. However, the magnitude of the increasing trend (0.0020/yr) before the RY (Reversal Year) was higher and that of the decreasing trend (−0.0009/yr) after the RY in the plateau was lower than in Eurasia (before RY: 0.0018/yr; after RY: −0.0013/yr), as reported by Piao et al. [9] (25-year), for a 29-year time scale. Furthermore, the RY in the plateau (1994) was three years earlier than for Eurasia as a whole (1997). The drier and hotter climate in the plateau, which has also been widely observed globally in the last decade [41,42], was a primary contributor to the recent vegetation decline in the plateau. From another perspective, this deterioration of both climate and vegetation in the plateau since the mid- or late 1990s could have aggravated the frequency of sandstorm occurrence and desertification [20]. Recent studies have suggested that the frequency of sandstorms affecting northern China and East Asia has significantly increased since 2000 [16,17], which is most probably related to the NDVI decline and drought except for the occurrence of strong winds in the plateau. Vegetation decline-associated desertification has also been a noteworthy environmental problem in recent years [43].
3.5. NDVI Trends for Different Vegetation and Grassland Types and Their Relationship with Climatic Variables
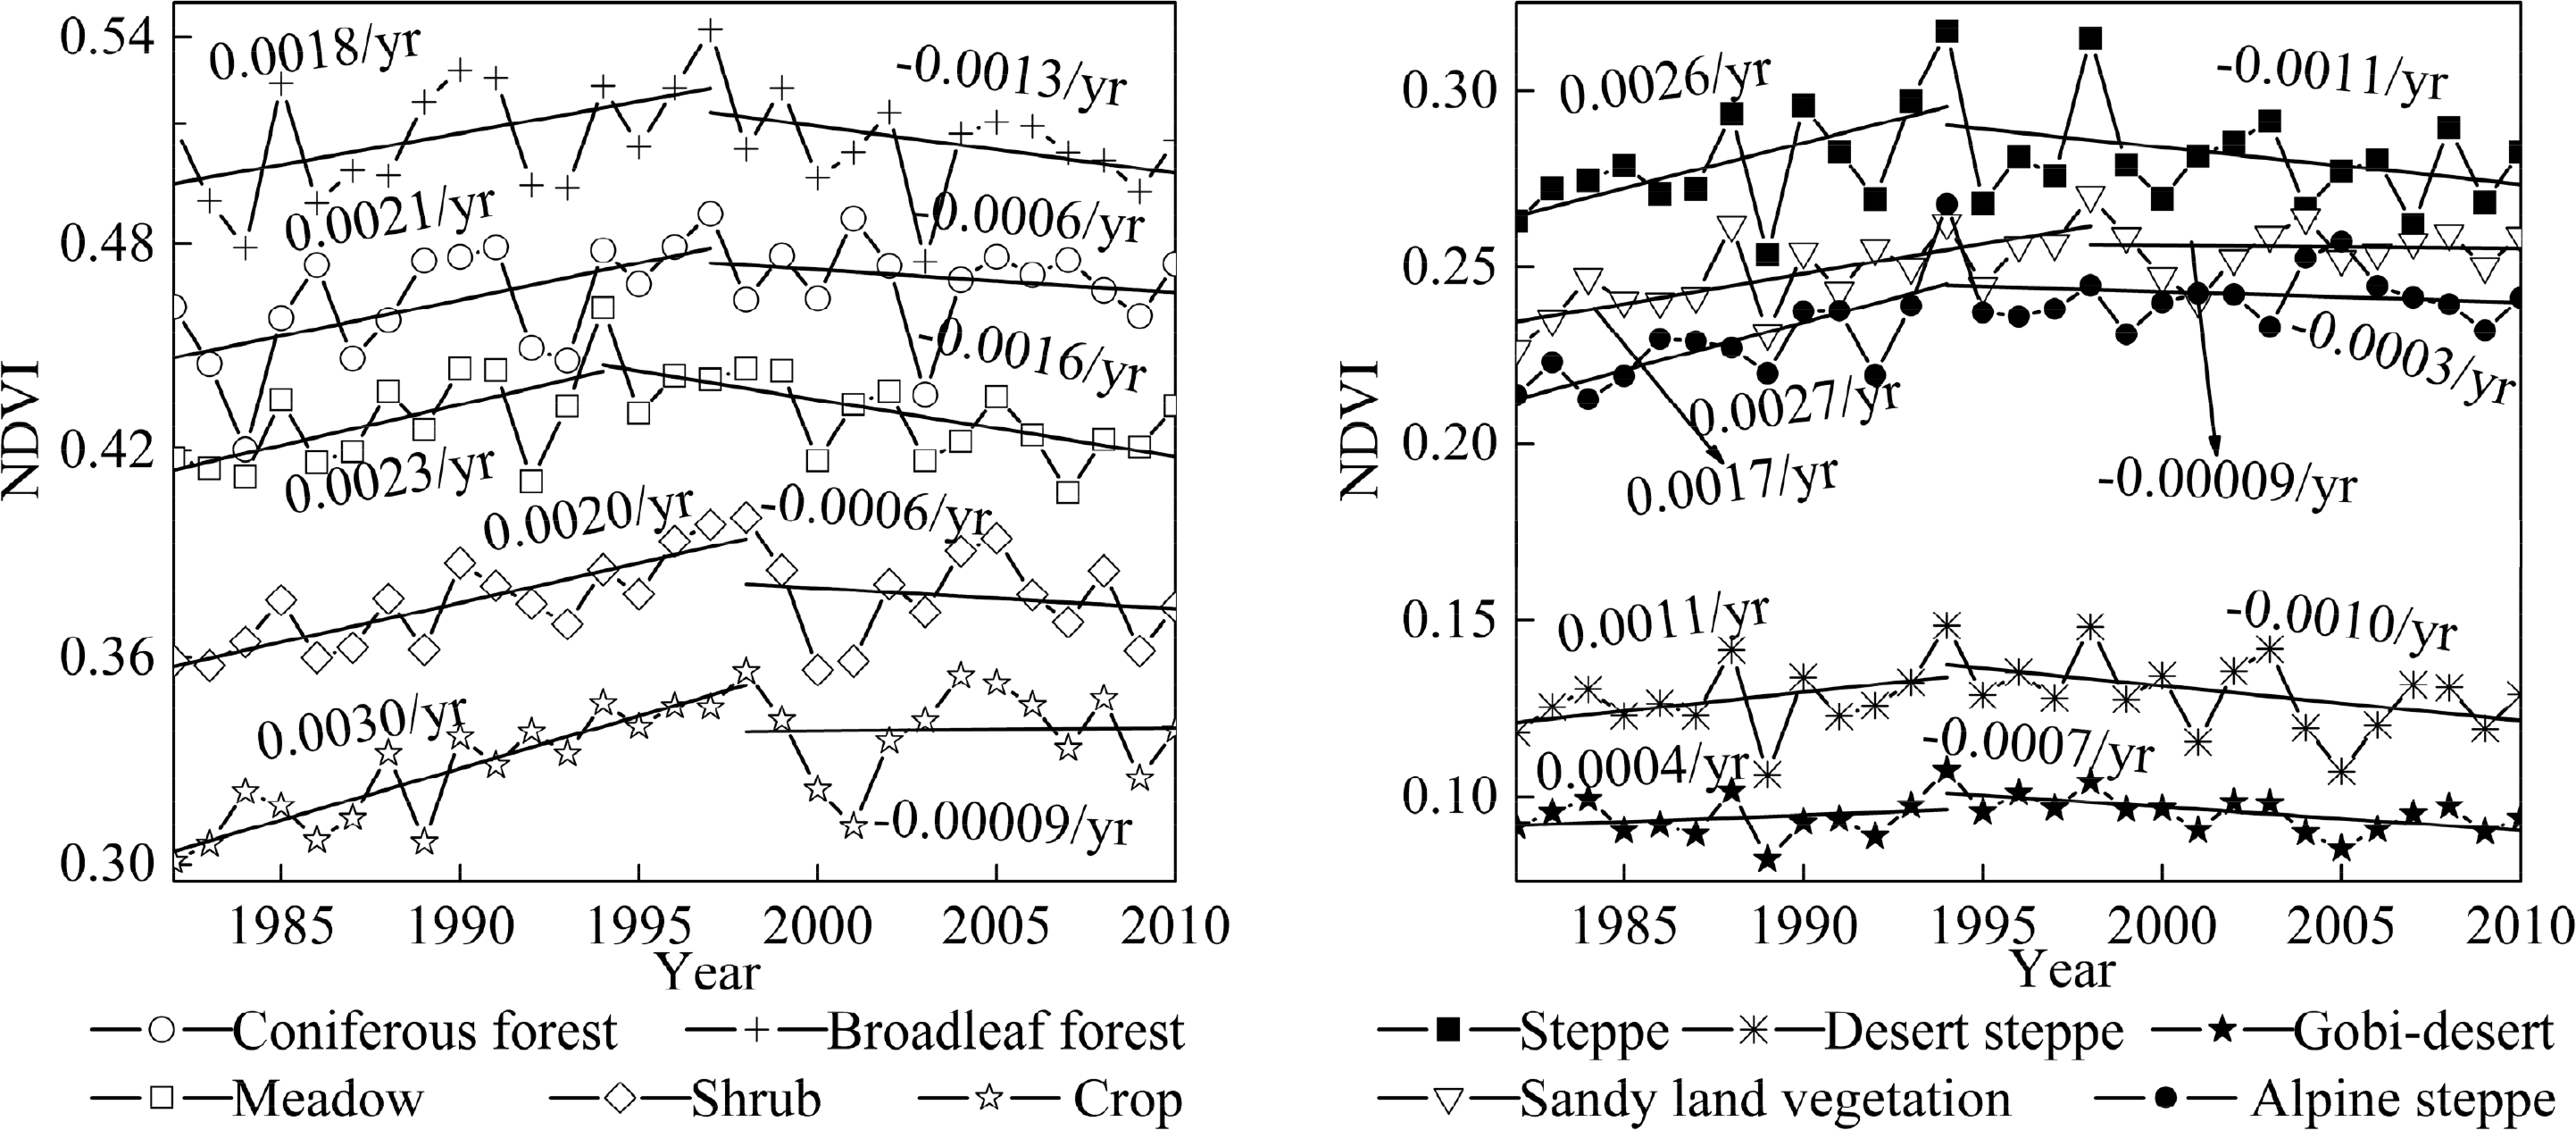
Due to different growth environments, the vegetation dynamics for different vegetation [3] and grassland types [34] responded differently to climate change. In the entire study period, the increasing trends in NDVI for all biomes reversed, with the RY apparently differing by vegetation type (Figure 9). For coniferous and broadleaf forest, the NDVI significantly increased by 0.0021/yr (R = 0.56, p = 0.02) and 0.0018/yr (R = 0.49, p = 0.05), respectively, before 1997. After 1997 coniferous and broadleaf forests, correspondingly, decreased by −0.0006/yr (R = −0.21, p = 0.48) and −0.0013/yr (R = −0.38, p = 0.19). Although the NDVI trend reversals for shrubland, sandy land vegetation, and cropland all occurred in 1998, the NDVI trends of the two latter vegetation types, which are mostly distributed in Inner Mongolia, remained highly stable, and no obvious decreasing trend was observed from 1998. This may be attributed to Chinese ecological conservation projects [44] and improved agricultural practices (irrigation, fertilizer use) [35] that may have effectively relieved or even offset drought/climate-induced vegetation decline for the regions where cropland and sandy land are distributed and may have prevented further desertification [44]. In comparison, the NDVI trend reversal for three widely distributed vegetation types: grasslands in the plateau as meadows, steppe and desert steppe, and sparse vegetation in the Gobi Desert arrived three or four years earlier than in other biomes, in 1994, with respective rates of increase of 0.0023/yr (R = 0.61, p = 0.03), 0.0026/yr (R = 0.59, p = 0.03), 0.0011/yr (R = 0.40, p = 0.17), and 0.0004/yr (R = 0.22, p = 0.46) before 1994 and corresponding rates of decrease of −0.0016/yr (R = −0.64, p = 0.005), −0.0011/yr (R = −0.35, p = 0.17), −0.0010/yr (R = −0.45, p = 0.07), and −0.0007/yr (R = −0.61, p = 0.009) afterwards. In particular, the significant decrease in desert steppe since its RY suggests that desertification is currently a serious environmental issue in the areas where desert steppe is distributed. Frequently occurring sandstorms in the last decade may also have originated from this area. It seems that the reversal (1994) of steppe grasslands dominated the reversal of the whole Mongolian Plateau because these constitute the largest area in the plateau. The alpine steppe increased significantly until 1994 with a yearly increment of 0.0027/yr (R = 0.72, p = 0.005) and then stalled afterward with little variation.
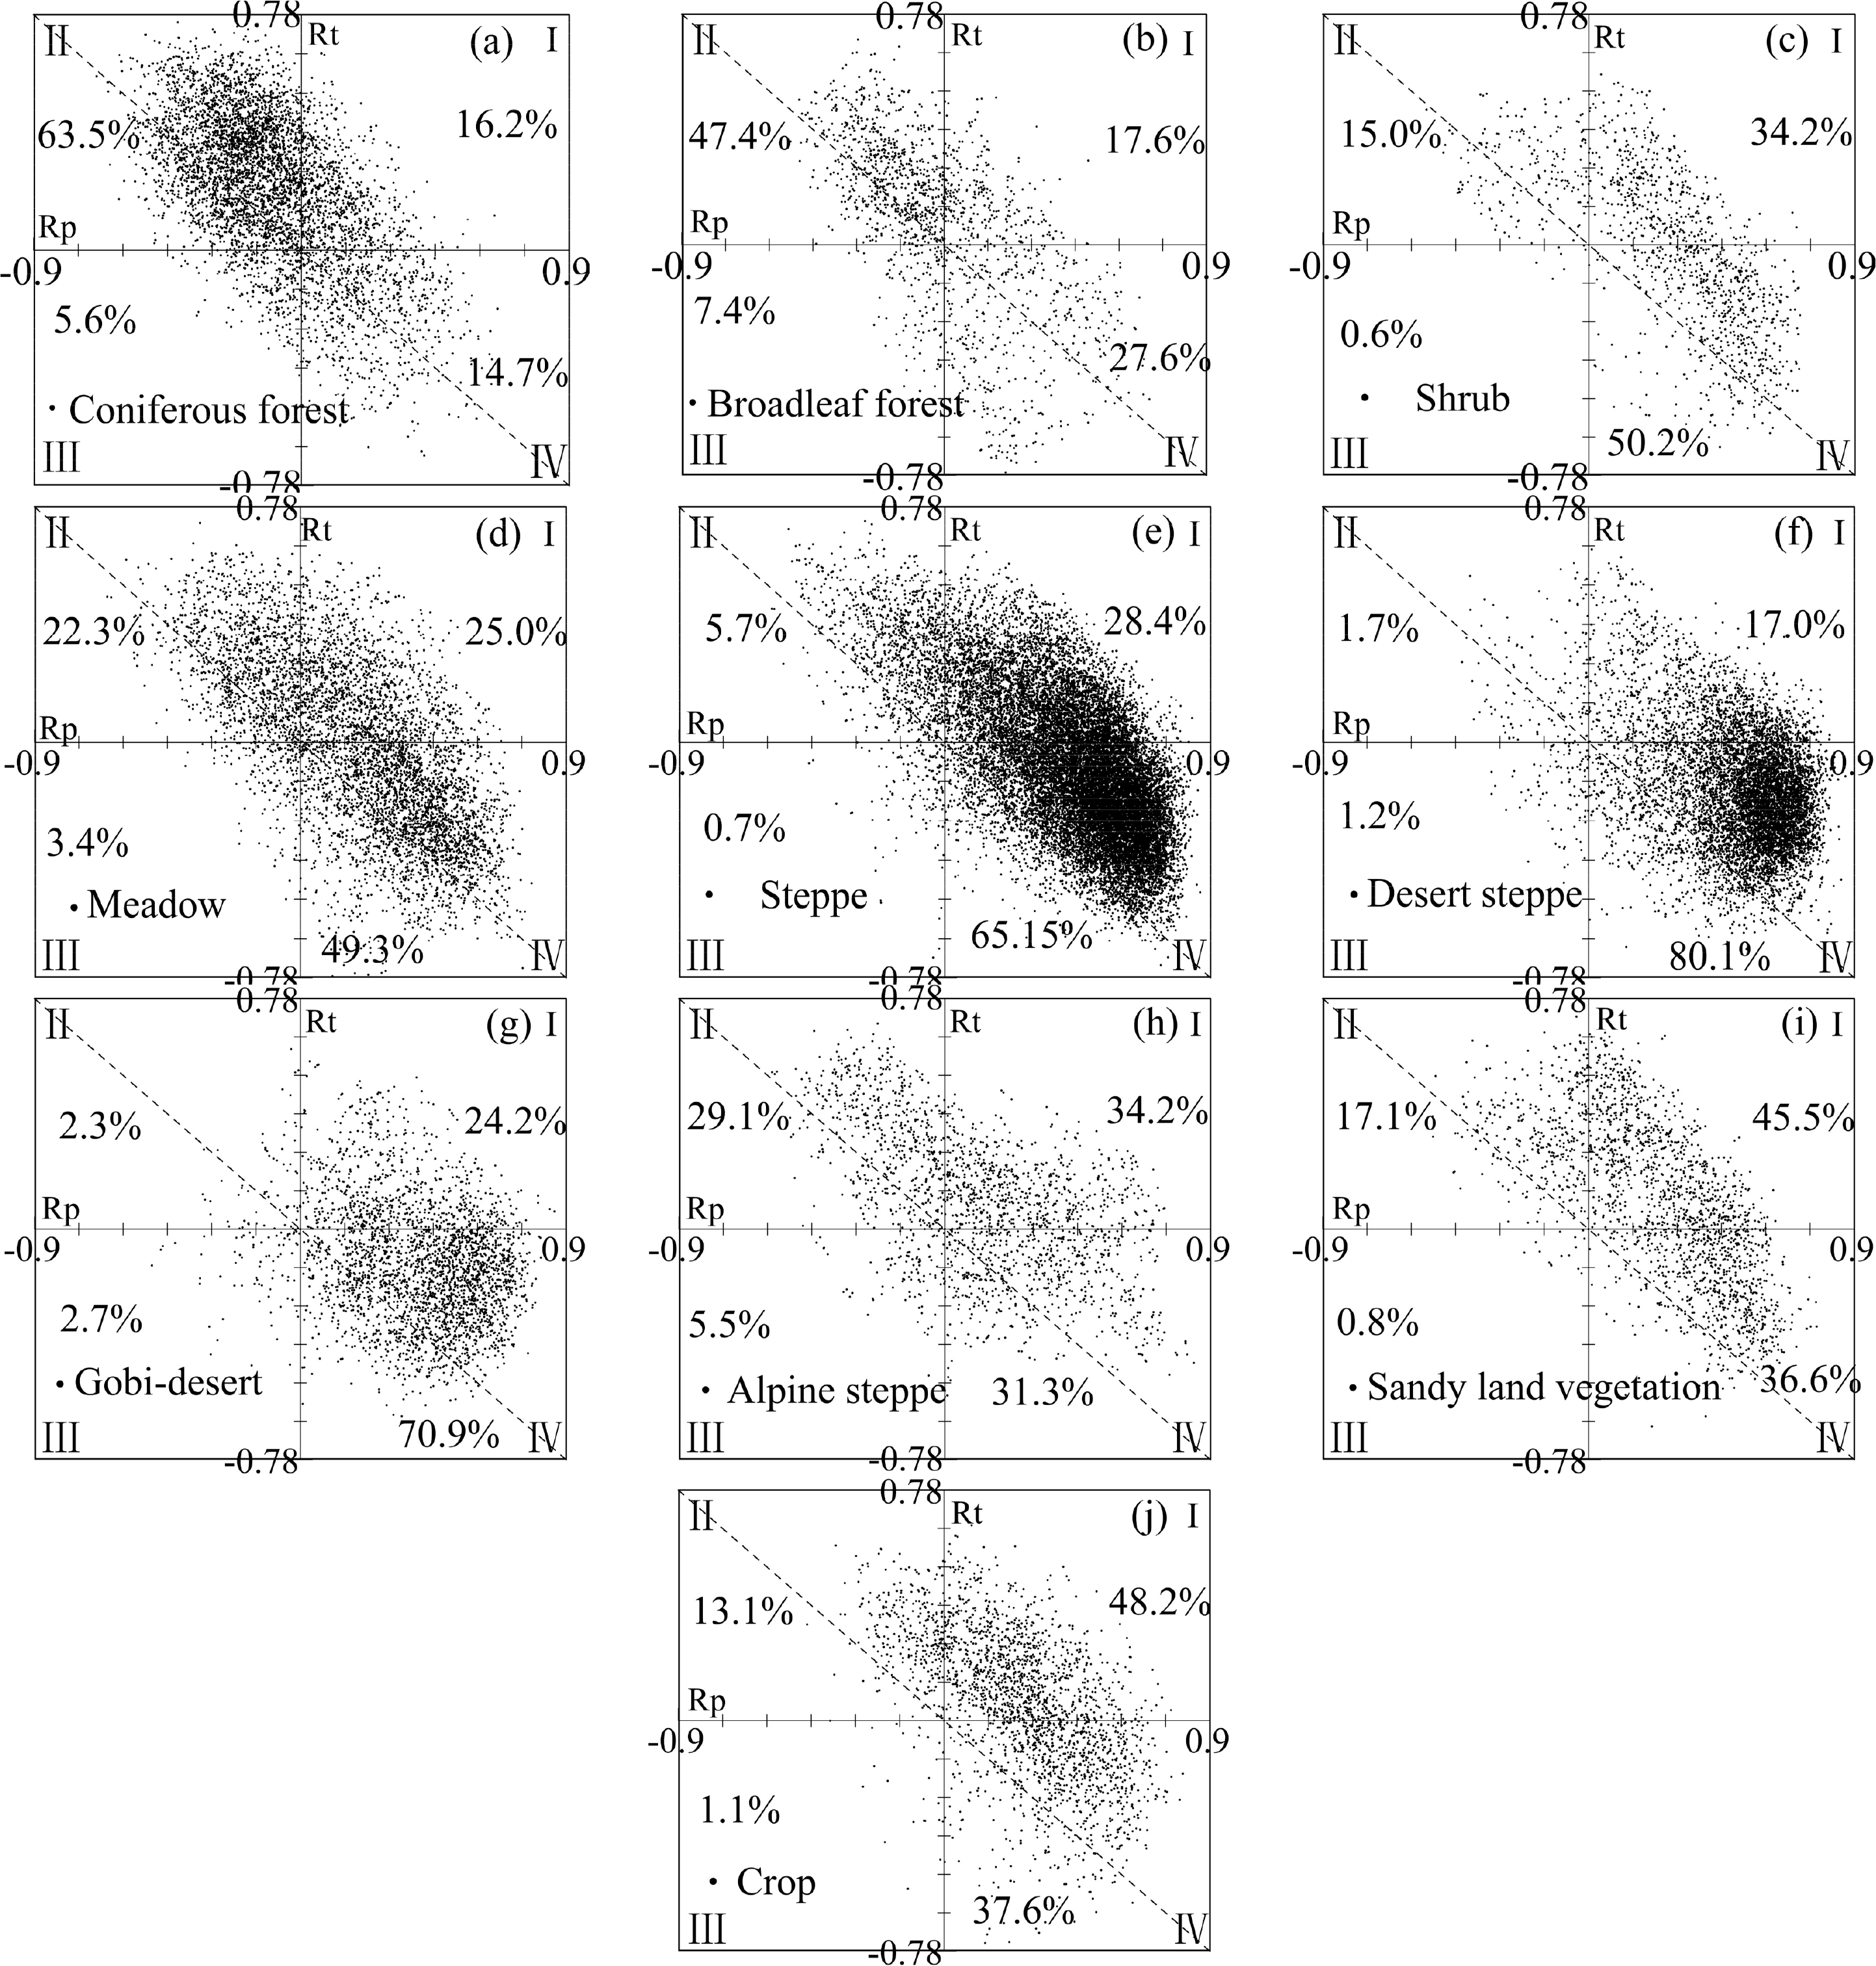
To detect the differences in vegetation response to climate change by vegetation type, correlation coefficients were calculated between the NDVI and the two climatic variables for each pixel and for each vegetation and grassland type (Figure 10). As shown in Figure 10, the relative contribution of climatic variables to vegetation dynamics differed by vegetation and grassland type. For coniferous (Figure 10a) and broadleaf forest (Figure 10b), approximately 79.7% and 65.0%, respectively, of the total pixels of the forest NDVI were positively correlated with temperature and, correspondingly, 69.1% and 54.8% were negatively correlated with precipitation, indicating that temperature may be the key factor regulating forest vegetation growth in the plateau. This may be the case because in the plateau, forest is mostly distributed in areas with cold and humid climates (Figures 1 and 2b), where heat resources are very limited and an increase in temperature could boost forest growth by lengthening the growing period and enhancing photosynthesis [28,45]. Excess precipitation, in contrast, could restrict forest growth. This observation is consistent with the results of Fang et al., who suggested that forest growth tended to decline with increasing precipitation under relatively cold conditions [46] because of the accompanying reductions in temperature [35] and cloud-related solar radiation [28]. Most pixels that correlated positively with temperature are located in the top half of the second quadrant, indicating that the positive effect of temperature is stronger than the negative effect of precipitation in the plateau. Compared to forest, there was an opposite trend in correlations between NDVI and climatic variables for shrub, meadow, steppe, desert steppe, and Gobi Desert vegetation (Figure 10c–g). Approximately 84.4%, 74.3%, 93.6%, 97.1%, and 95.1%, respectively, of the total NDVI pixels for these five vegetation types were positively correlated with precipitation, and, correspondingly, approximately 50.8%, 52.7%, 65.9%, 81.3%, and 73.6% were negatively correlated with temperature. These five vegetation types in the plateau are distributed mostly over areas with a temperate arid and semiarid climate, where rainfall supply is the key factor in vegetation dynamics, an observation, which agrees with previous findings [46,47]. In particular, the proportion of pixels that were positively correlated with precipitation increased from meadow to steppe and then to desert steppe, implying that vegetation water demand strongly increased as aridity increased. The larger magnitudes of negative correlation with temperature suggest that heat conditions are sufficient for growth of these vegetation types in the plateau and that increased temperature may accelerate water evaporation and thus impede vegetation growth [34,48]. However, the proportion of pixels that were positively correlated with temperature was largest for meadow, implying that a temperature increase could also enhance meadow steppe growth. This may be attributed to the locations of meadows. The meadowlands in the study area are mostly distributed in the transitional zone from forest to steppe, where the positive effect of temperature on vegetation growth was also more evident. The largest number of pixels that were correlated positively with precipitation, for these five vegetation types, are located in the top half of the fourth quadrant, indicating that the positive effect of precipitation is stronger than the negative effect of temperature in the plateau. For sandy land vegetation and crops (Figure 10i,j), although the positive effect of precipitation was also predominant (82.1% and 85.8% for sandy land vegetation and crops, respectively), the temperature effect on vegetation growth was more complex. This may be partly attributed to human activities as discussed above. For alpine steppe (Figure 10h), the scatter-plot was almost equally distributed in the first, second, and fourth quadrants, suggesting more complex effects of temperature and precipitation on vegetation growth for alpine steppe in the plateau.
3.6. Spatial Trends of the NDVI and Its Relationship with Climatic Variables
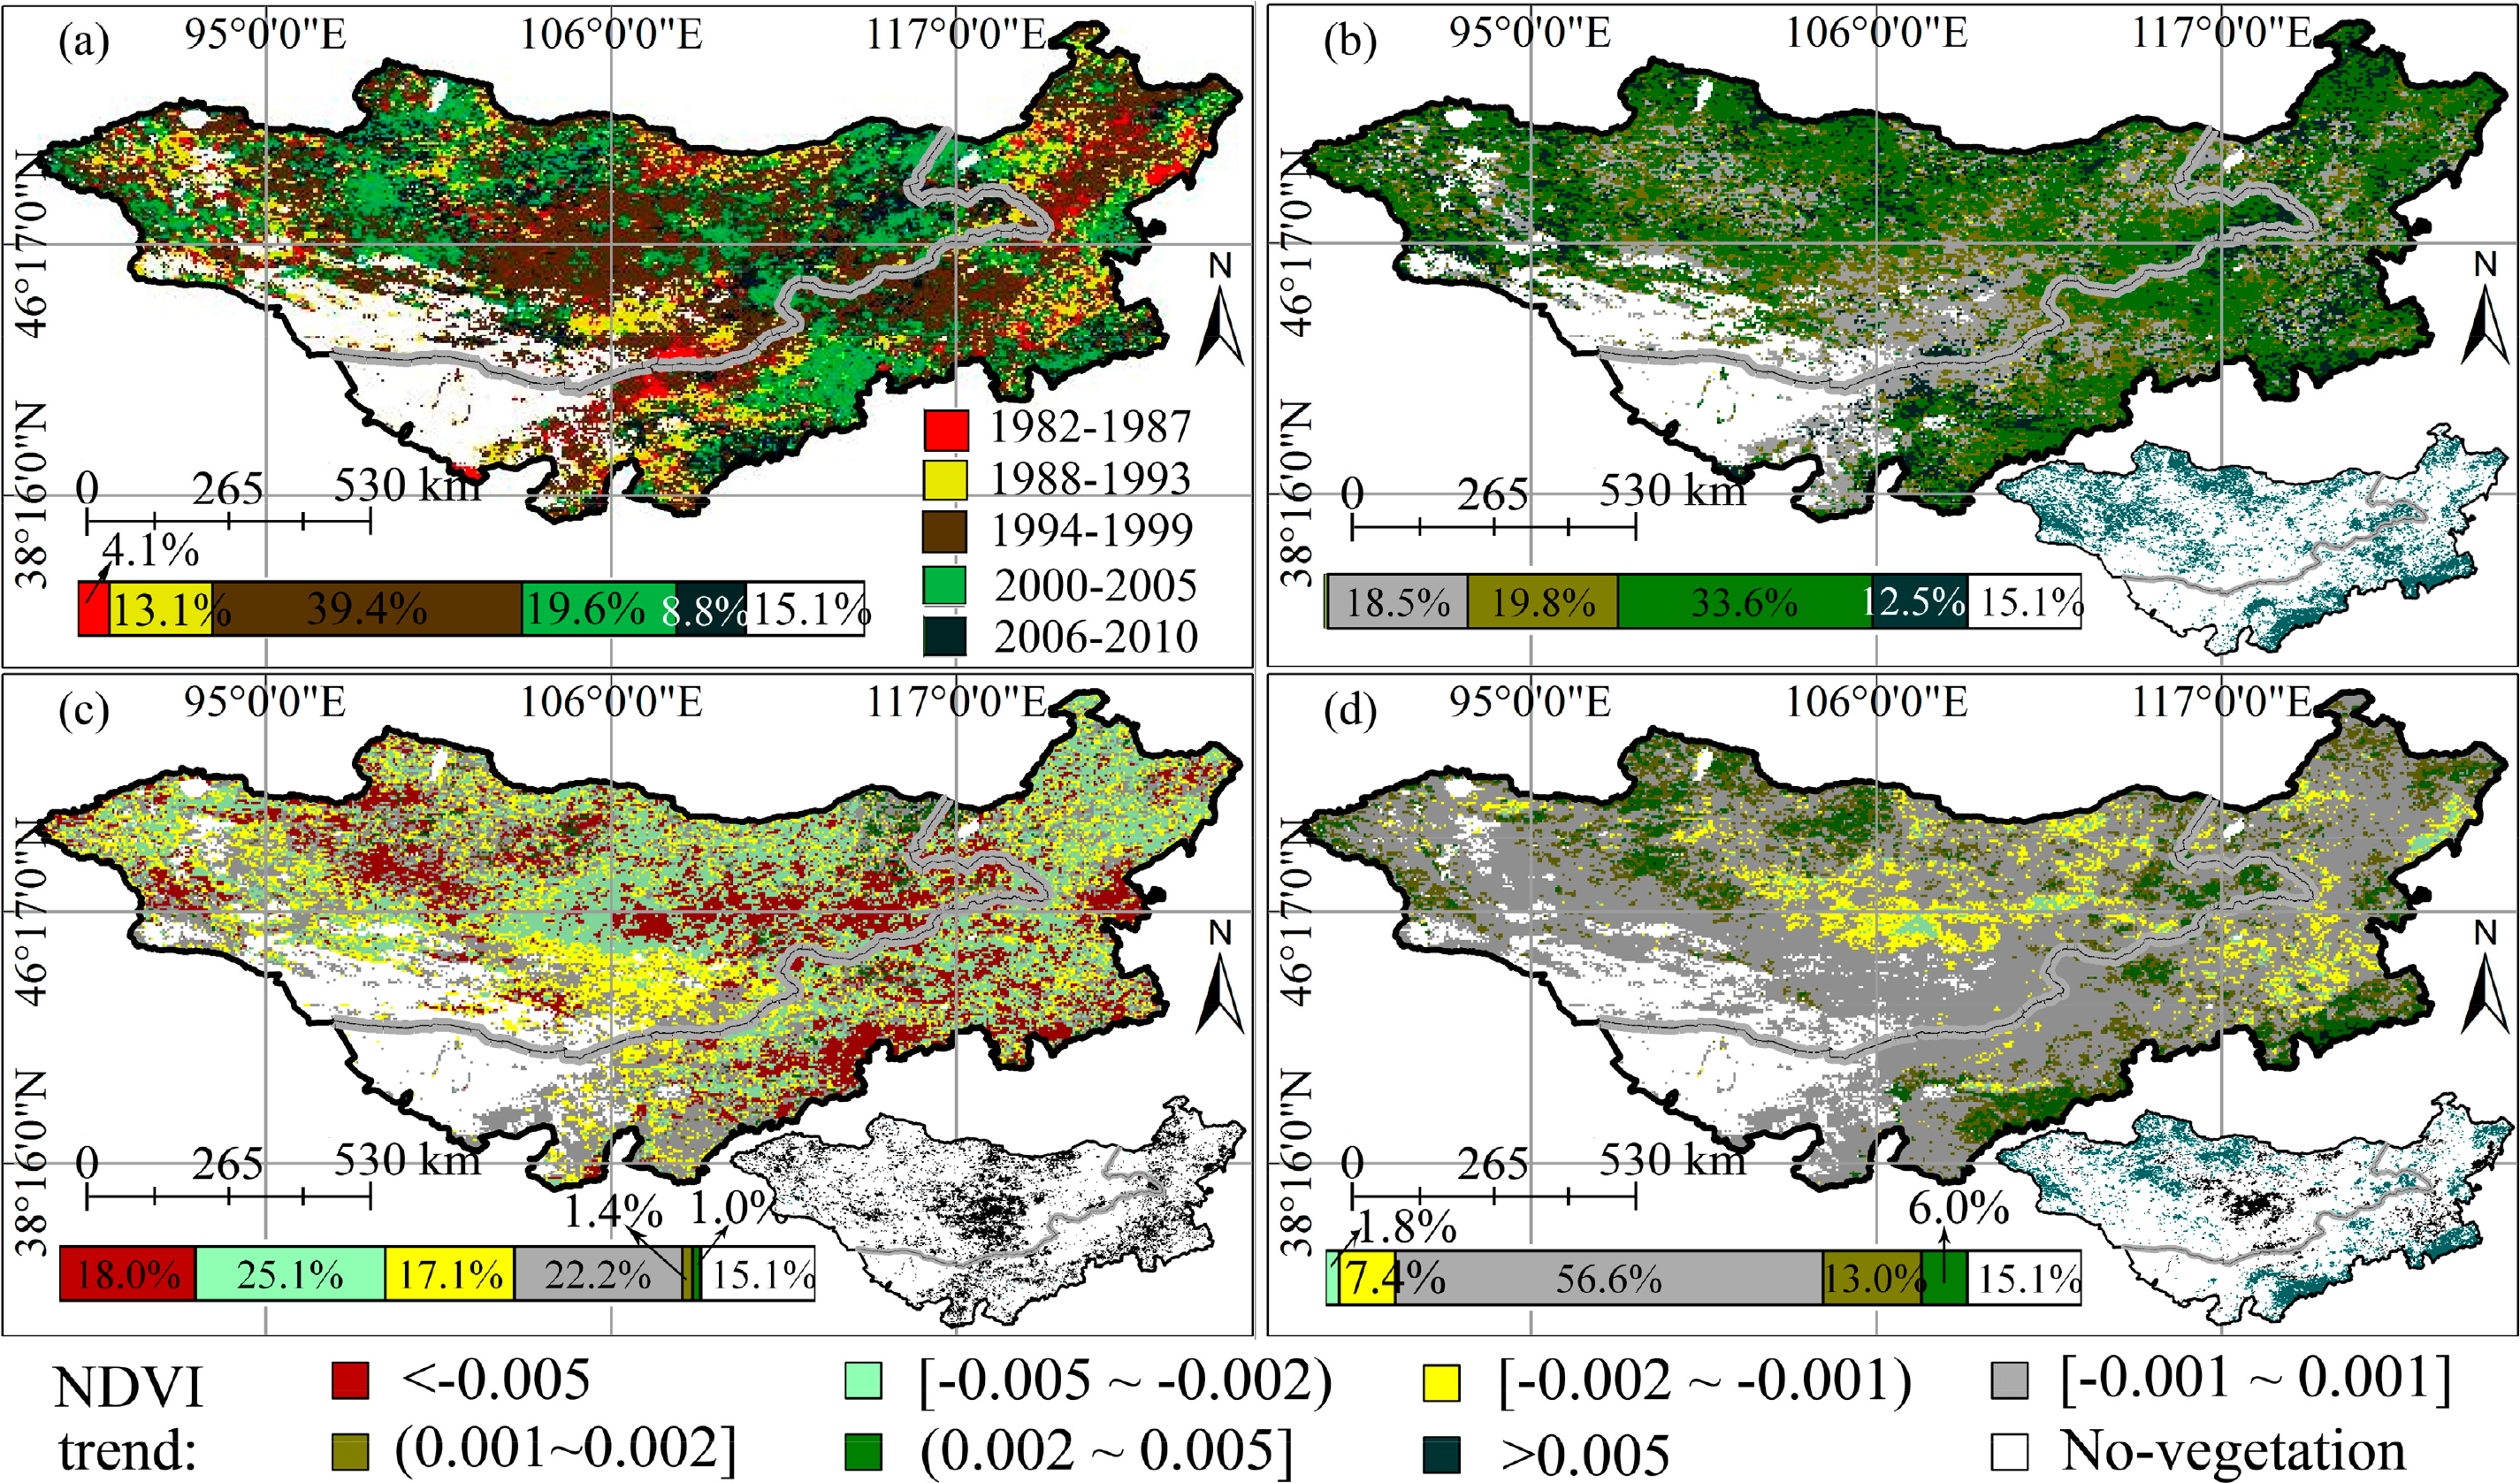
According to the year with the peak NDVI value, the NDVI trend RY was identified for each pixel (Figure 11a). The NDVI trend in approximately 39.4% of the study area reversed between 1994 and 1999, especially in Central and Western Mongolia and Central and Eastern Inner Mongolia. Approximately 19.6% of pixels experienced their NDVI reversal between 2000 and 2005, with these concentrated in the eastern and northwestern parts of Mongolia and the two sandy land regions (Hunshan Dake sand and Horqin sand) of Inner Mongolia. A relatively small number of pixels experienced the NDVI reversal during the periods 1982–1987, 1988–1993, and 2006–2010, accounting for 4.1%, 13.1%, and 8.8% of the plateau, respectively.
Although the NDVI variation seems to have been relatively stable (trend: −0.001–0.001, 56.6%) for the entire study period (Figure 11d), there were clearly opposite trends in the NDVI before and after the RY. Before the RY, approximately 65.9% of the plateau showed an increasing trend, with an average rate of 0.0041/yr; these pixels were distributed over most of the plateau except for the southern desert steppe regions (Figure 11b). On the contrary, approximately 60.2% of the plateau showed a decrease in the NDVI after the RY, with an average rate of −0.0042/yr (Figure 11c). The regions with a significant decrease in NDVI were mostly concentrated in the southern desert steppe (see insert map in Figure 11c) and were most probably related to the origin of sandstorms in the last decade. Almost no pixels showed a decreasing trend before the RY (Figure 11b) and an increasing trend after the RY (Figure 11c). Over the entire observation period 1982–2010 (Figure 11d), the pixels that showed an increasing trend (approximately 19.0%) were mostly distributed in Southern Inner Mongolia and Northwestern Mongolia. However, the pixels with a decreasing trend (9.2%) were concentrated in Central Mongolia and in some regions of Eastern Inner Mongolia.
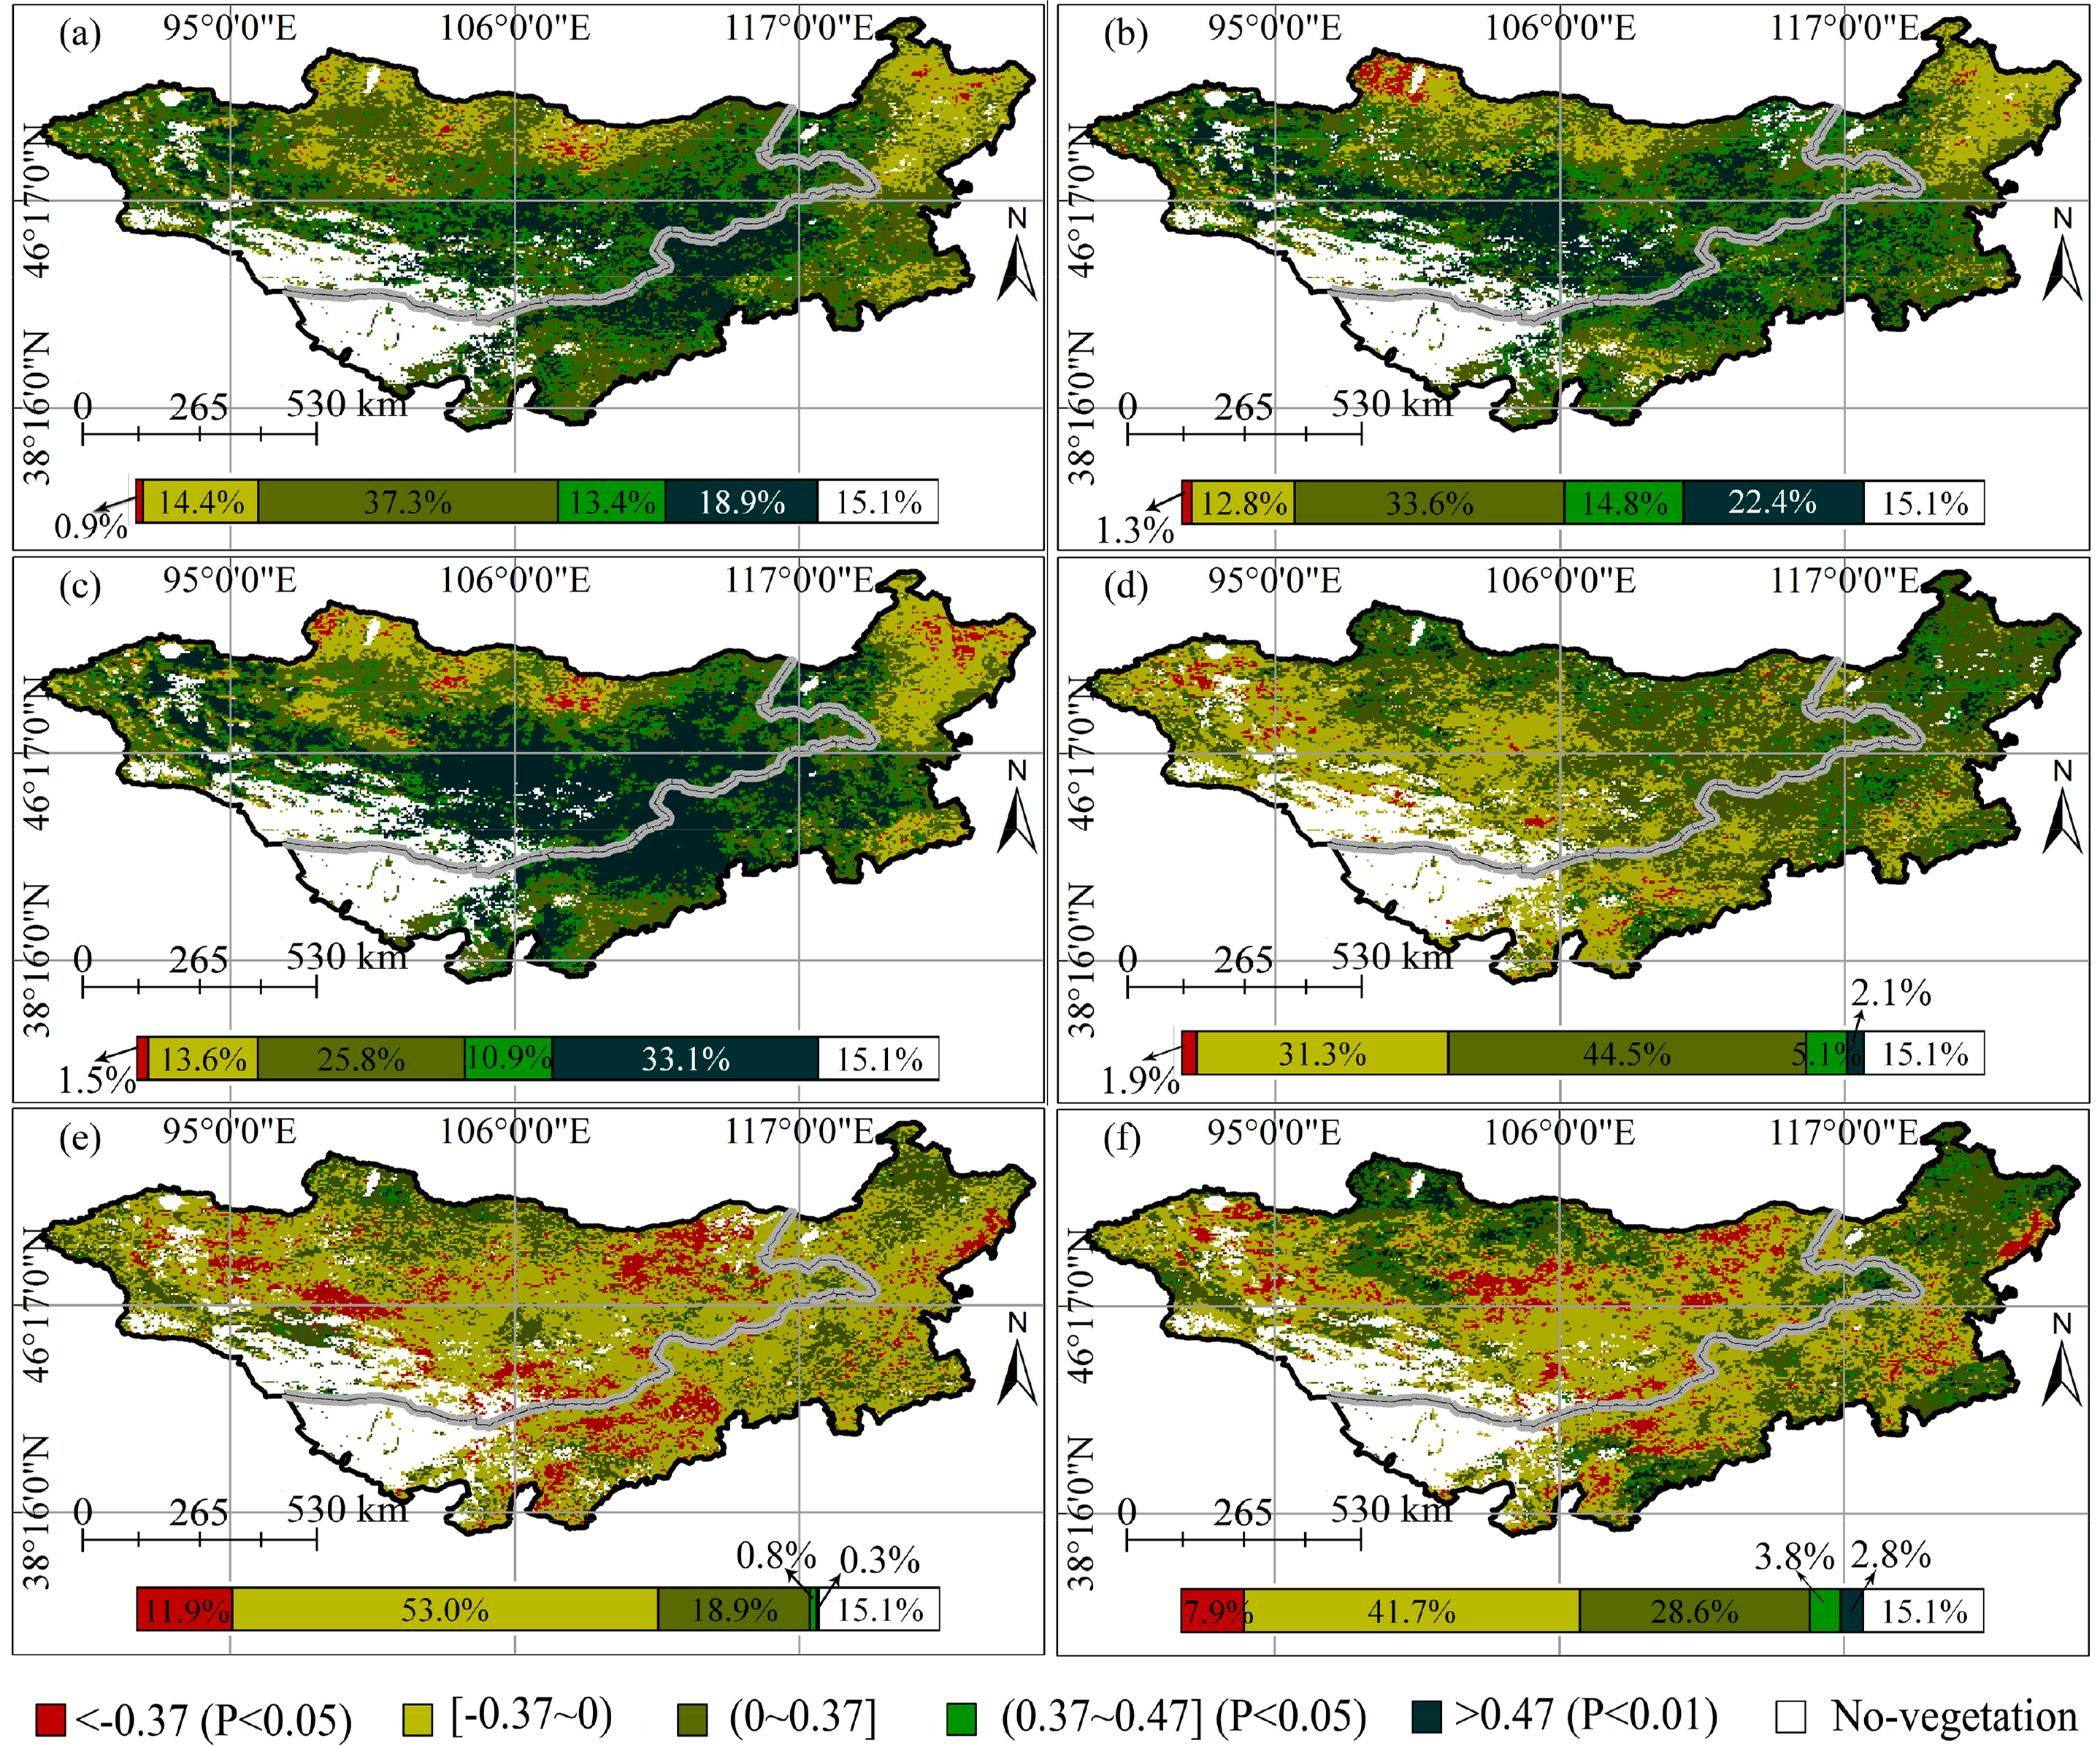
To examine the effects of regional climate on the NDVI trends, correlations between the NDVI and both temperature and precipitation were calculated for the period before and after the RY and for the entire period 1982–2010 (Figure 12). Regardless of the study period considered, there was a similar trend in correlations between NDVI and climatic variables. The NDVI was strongly and positively correlated with precipitation in most areas (before RY: 69.6%, after RY: 70.8%, 1982–2010: 69.8%). Especially in the central open plateau with high-quality grassland under an arid or semiarid climate (Figure 1), the correlation was significant even at the 1% level (Figure 12a–c), suggesting that precipitation is the most direct influencing factor on vegetation dynamics in these regions and may overcome the negative effect of overgrazing. This phenomenon is also in evidence in the temperate grasslands of China [34] and agrees with previous findings in other arid and semiarid regions [46,47]. The high correlation between the NDVI and precipitation in these regions also further implies that precipitation is not abundant and does not exceed the precipitation threshold for vegetation growth in the plateau, although a precipitation threshold exists for vegetation growth [49], and above this threshold, the relationship may weaken [34,50]. However, in forest-dominated areas under cold and humid climate in Northern Mongolia and Northeastern Inner Mongolia (Figure 1), precipitation was negatively correlated with NDVI, which could be attributed to cloud cover accompanying precipitation and related decreases in solar radiation and temperature [28,35]. This phenomenon also suggests that precipitation in forest-dominated areas surpasses the threshold for forest growth in the plateau.
In contrast to precipitation, an opposite pattern was observed in correlations between the NDVI and temperature (Figure 12d–f), i.e., a negative correlation appears to dominate in the central steppe grassland-dominated area, accounting for 33.2%, 64.9% and 49.6%, of the plateau for the period before RY, after RY, and 1982–2010, respectively. Positive correlations occurred mainly in northern forest-dominated regions and high mountain areas. These results further confirmed the finding that temperature impact on vegetation growth differed between different vegetation growth environments and their different responses to climate change [3,34], as discussed in Section 3.5.
In addition to the climatic impact on vegetation changes, the impacts of human activities were also more obvious in some parts of the plateau. For example, significant NDVI increases in southern Inner Mongolia (i.e., the transition zone between agriculture and rangelands in Inner Mongolia) (Figure 11d) could be attributed to Chinese environmental protection and land rehabilitation projects in these areas [44] because the NDVI increased significantly although no significant correlations were observed between the NDVI and the two climatic variables. These observations can also be confirmed by other studies, which have revealed that vegetation cover has improved in Southern Inner Mongolia since the implementation of Chinese vegetation restoration programs such as grazing rotation, seasonal enclosures, and the Grain for Green program [38,51].
4. Conclusions
This research constructed a growing season (April–October) monthly NDVI sequence for the Mongolian Plateau for 1982–2010 by calibrating the MODIS NDVI (2000–2010) to the GIMMS NDVI (1982–2006) through developing a per-pixel linear regression model based on the overlapping period of 2000–2006. The data were comprehensively used to analyze vegetation dynamics from 1982 to 2010 in the plateau and were further correlated with both precipitation and temperature to understand the impact of climate change on vegetation dynamics in the plateau. The main conclusions are as follows:
- (1)
The calibration results from the per-pixel linear regression model demonstrated that the continuity and consistency of the newly constructed NDVI (Extended GIMMS NDVI) is in strong agreement with the traditional GIMMS NDVI, with a coefficient of determination of 0.99 and an RMSE value of 0.0089, implying the feasibility of the per-pixel linear regression model to calibrate NDVI data from one sensor to another. High per-pixel correlations also exist between the two monthly NDVI datasets, which can detect the spatial patterns of vegetation dynamics in the plateau.
- (2)
During the 29-year observation period, a general reversal of NDVI trends occurred over the Mongolian Plateau around the mid- to late 1990s with a high degree of spatial and temporal heterogeneity, separating the 29-year overall trend into a pronounced vegetation greening (i.e., increasing NDVI) before the mid- or late 1990s and a vegetation browning (i.e., decreasing NDVI) afterwards. (a) At the biome scale, the NDVI trend reversals from increasing to decreasing for all four types of grassland and sparse vegetation in the Gobi Desert occurred earliest, in 1994, whereas shrub, crop, and sandy land vegetation reversed latest, in 1998. The NDVI trend reversals for forest occurred in 1997; (b) At the regional scale, approximately 39.4% of the plateau experienced NDVI trend reversal from 1994 to 1999, and were mostly distributed in Central and Western Mongolia and Central and Eastern Inner Mongolia, indicating that widespread vegetation decline-associated desertification has been occurring in these areas of the plateau in recent years; (c) Because of the presence of opposing trends, the 29-year mean overall NDVI trend seemed to be obscured, and no obvious trend was observed except for a significantly increasing trend in the forest-dominated area of Northwestern Mongolia and in the transition zone from pasturing to farming in Southern Inner Mongolia in China.
- (3)
Climate records (temperature and precipitation) showed wetting and warming trends before the mid- or late 1990s and then drying and weak cooling trends after that. This climate change reversal, particularly in precipitation, was a direct contributor to the NDVI trend reversal. This was further confirmed by correlation analysis between the NDVI and climatic variables. Regardless of the observation period or subarea, the NDVI was strongly and positively correlated with precipitation, but related only weakly, or even negatively, to temperature, implying that precipitation amounts in the growing season are a key factor regulating vegetation dynamics at the entire plateau scale. However, in correlation analysis for each pixel and vegetation type, the response of vegetation dynamics to climate change was also spatially heterogeneous, corresponding with regional climate conditions and the growth environment of different vegetation types. Although environmental protection and land rehabilitation projects could have helped to improve vegetation status, drought stress in the plateau tended to increase in the last decade, and a focus on this issue will be important for raising the alarm and performing a risk assessment for drought disasters and other related natural disasters like sandstorms.
- (4)
Comparison between Mongolia and the Inner Mongolia region of China revealed that the NDVI trend reversal in Inner Mongolia in China (1998) seems to have occurred four years earlier than in Mongolia (1994). Transect-based analysis also revealed three features of NDVI changes along the China-Mongolia political border: (a) NDVI generally decreased (from northeast to southwest) with distance from the Pacific Ocean; (b) NDVI changed differently in different parts of transects (southwestern, central, and northeastern parts) between Mongolia and Inner Mongolia; and (c) The differences between the two transects values in Mongolia and Inner Mongolia increased with distance from the border, perhaps indicating different grazing intensity or other human-related activities on the two sides of the border.
The results of this study will not only provide a better understanding of the vegetation dynamics and the complex responses of vegetation to climate change during 1982–2010 in the Mongolian Plateau, a unique geographical region with two different sets of political and economic activities affecting its ecosystems, but also will provide a reference for the studies of other similar ecosystems under different economic and social organizations. However, the mechanisms of vegetation response to climate change are very complex and still remain largely unknown. Separating the relative contributions of different climatic factors and of other driving forces such as anthropogenic activities, natural hazards, and nitrogen deposition to vegetation growth trends remains a great challenge for future studies.
Acknowledgments
This study was supported by the National Basic Research Program of China (973 Program) (Grant No: 2010CB951504), the National Natural Science Foundation of China (Grant No: 41301456) and the national “twelve-five” Technology Support Project of China (Grant No: 2013BAK05B01). The authors are grateful to the anonymous reviewers whose constructive suggestions have greatly improved the quality of our manuscript and are also grateful to the MODIS and AVHRR science teams for their excellent and accessible data products.
Author Contributions
All authors contributed significantly to this manuscript. Specifically, the contributions include data collection (Gang Bao, Amarjargal Sanjjav), data processing and analysis (Gang Bao, Yi Zhou, Amarjargal Sanjjav), methodology design (Zhihao Qin, Yuhai Bao, Wenjuan Li), and manuscript writing (Gang Bao, Zhihao Qin)
Conflicts of Interest
The authors declare no conflict of interest.
References
- Balling, R.C., Jr.; Klopatek, J.M.; Hildebrandt, M.L.; Moritz, C.K.; Watts, C.J. Impacts of land degradation on historical temperature records from the Sonoran Desert. Clim. Chang 1998, 40, 669–681. [Google Scholar]
- Jackson, R.B.; Randerson, J.T.; Canadell, J.G.; Anderson, R.G.; Avissar, R.; Baldocchi, D.D.; Bonan, G.B.; Caldeira, K.; Diffenbaugh, N.S.; Field, C.B.; et al. Protecting climate with forests. Environ. Res. Lett 2008, 3, 044006. [Google Scholar]
- Chuai, X.W; Huang, X.J.; Wang, W.J.; Bao, G. NDVI, temperature and precipitation changes and their relationships with different vegetation types during 1998–2007 in Inner Mongolia, China. Int. J. Climatol 2012, 33, 1696–1706. [Google Scholar]
- Jiang, D.; Fu, X.; Wang, K. Vegetation dynamics and their response to freshwater inflow and climate variables in the Yellow River Delta, China. Quatern. Int 2013, 304, 75–84. [Google Scholar]
- Zhong, L.; Ma, Y.; Salama, M.S.; Su, Z. Assessment of vegetation dynamics and their response to variations in precipitation and temperature in the Tibetan plateau. Clim. Chang 2010, 103, 519–535. [Google Scholar]
- Hoffmann, W.A.; Jackson, R.B. Vegetation-climate feedbacks in the conversion of tropical savanna to grassland. J. Clim 2000, 13, 1593–1602. [Google Scholar]
- Wang, X.; Piao, S.; Ciais, P.; Li, J.; Friedlingstein, P.; Koven, C.; Chen, A. Spring temperature change and its implication in the change of vegetation growth in North America from 1982 to 2006. Proc. Natl. Acad. Sci. USA 2011, 108, 1240–1245. [Google Scholar]
- Nemani, R.R.; Keeling, C.D.; Hashimoto, H.; Jolly, W.M.; Piper, S.C.; Tucker, C.J.; Myneni, R.B.; Running, S.W. Climate-driven increases in global terrestrial net primary production from 1982 to 1999. Science 2003, 300, 1560–1563. [Google Scholar]
- Piao, S.; Wang, X.; Ciais, P.; Zhu, B.; Wang, T.; Liu, J. Changes in satellite–derived vegetation growth trend in temperate and boreal Eurasia from 1982 to 2006. Glob. Chang. Biol 2011, 17, 3228–3239. [Google Scholar]
- Tucker, C.J.; Slayback, D.A.; Pinzon, J.E.; Los, S.O.; Myneni, R.B.; Taylor, M.G. Higher northern latitude normalized difference vegetation index and growing season trends from 1982 to 1999. Int. J. Biometeorol 2001, 45, 184–190. [Google Scholar]
- Zhang, Y.; Gao, J.; Liu, L.; Wang, Z.; Ding, M.; Yang, X. NDVI-based vegetation changes and their responses to climate change from 1982 to 2011: A case study in the Koshi River Basin in the middle Himalayas. Glob. Planet. Chang 2013, 108, 139–148. [Google Scholar]
- Neupert, R.F. Population, nomadic pastoralism and the environment in the Mongolian Plateau. Popul. Environ 1999, 20, 413–441. [Google Scholar]
- Feng, Z.D.; Zhai, X.W.; Ma, Y.Z.; Huang, C.Q.; Wang, W.G.; Zhang, H.C.; Khosbayar, P.; Narantsetseg, T.; Liu, K.B.; Rutter, N.W. Eolian environmental changes in the northern Mongolian Plateau during the past ∼35,000 y. Palaeogeogr. Palaeocl 2007, 245, 505–517. [Google Scholar]
- Liu, J.; Qi, Y.; Shi, H.; Zhuang, D.; Hu, Y. Estimation of wind erosion rates by using 137Cs tracing technique: A case study in Tariat-Xilin gol transect, Mongolian Plateau. Chin. Sci. Bull 2008, 53, 751–758. [Google Scholar]
- Zhang, X.; Hu, Y.; Zhuang, D.; Qi, Y.; Ma, X. NDVI spatial pattern and its differentiation on the Mongolian Plateau. J. Geogr. Sci 2009, 19, 403–415. [Google Scholar]
- Chung, Y.; Kim, H.; Dulam, J.; Harris, J. On heavy dustfall observed with explosive sandstorms in Chongwon-Chongju, Korea in 2002. Atmos. Environ 2003, 37, 3425–3433. [Google Scholar]
- Fujiwara, H.; Fukuyama, T.; Shirato, Y.; Ohkuro, T.; Taniyama, I.; Zhang, T.H. Deposition of atmospheric 137Cs in Japan associated with the Asian dust event of March 2002. Sci. Total Environ 2007, 384, 306–315. [Google Scholar]
- Wang, S.; Wang, J.; Zhou, Z.; Shang, K. Regional characteristics of three kinds of dust storm events in China. Atmos. Environ 2005, 39, 509–520. [Google Scholar]
- Xu, X.; Levy, J.K.; Lin, Z.; Hong, C. An investigation of sand–dust storm events and land surface characteristics in China using NOAA NDVI data. Glob. Planet. Chang 2006, 52, 182–196. [Google Scholar]
- Zou, X.K.; Zhai, P.M. Relationship between vegetation coverage and spring dust storms over northern China. J. Geophys. Res. - tmos 2004, 109, D03104. [Google Scholar]
- Yang, Q.; Qin, Z.; Li, W.; Xu, B. Temporal and spatial variations of vegetation cover in Hulun Buir grassland of Inner Mongolia, China. Arid Land. Res. Manag 2012, 26, 328–343. [Google Scholar]
- Zhang, G.; Xu, X.; Zhou, C.; Zhang, H.; Ouyang, H. Responses of grassland vegetation to climatic variations on different temporal scales in Hulun Buir grassland in the past 30 years. J. Geogr. Sci 2011, 21, 634–650. [Google Scholar]
- Brogaard, S.; Runnström, M.; Seaquist, J.W. Primary production of Inner Mongolia, China, between 1982 and 1999 estimated by a satellite data—Driven light use efficiency model. Glob. Planet. Chang 2005, 45, 313–332. [Google Scholar]
- Tucker, C.J. Red and photographic infrared linear combinations for monitoring vegetation. Remote Sens. Environ 1979, 8, 127–150. [Google Scholar]
- Chen, B.; Xu, G.; Coops, N.C.; Ciais, P.; Innes, J.L.; Wang, G.; Myneni, R.B.; Wang, T.; Krzyzanowski, J.; Li, Q.; et al. Changes in vegetation photosynthetic activity trends across the Asia–Pacific region over the last three decades. Remote Sens. Environ 2014, 144, 28–41. [Google Scholar]
- Eastman, J.R.; Sangermano, F.; Machado, E.A.; Rogan, J.; Anyamba, A. Global trends in seasonality of normalized difference vegetation index (NDVI), 1982–2011. Remote Sens 2013, 5, 4799–4818. [Google Scholar]
- Brown, M.E.; Lary, D.J.; Vrieling, A.; Stathakis, D.; Mussa, H. Neural networks as a tool for constructing continuous NDVI time series from AVHRR and MODIS. Int. J. Remote Sens 2008, 29, 7141–7158. [Google Scholar]
- Mao, D.; Wang, Z.; Luo, L.; Ren, C. Integrating AVHRR and MODIS data to monitor NDVI changes and their relationships with climatic parameters in northeast China. Int. J. Appl. Earth Obs. Geoinf 2012, 18, 528–536. [Google Scholar]
- Steven, M.D.; Malthus, T.J.; Baret, F.; Xu, H.; Chopping, M.J. Intercalibration of vegetation indices from different sensor systems. Remote Sens. Environ 2003, 88, 412–422. [Google Scholar]
- Zemmrich, A.; Manthey, M.; Zerbe, S.; Oyunchimeg, D. Driving environmental factors and the role of grazing in grassland communities: A comparative study along an altitudinal gradient in western Mongolia. J. Arid Environ 2010, 74, 1271–1280. [Google Scholar]
- Tucker, C.J.; Pinzon, J.E.; Brown, M.E.; Slayback, D.A.; Pak, E.W.; Mahoney, R.; Vermote, E.F.; El Saleous, N. An extended AVHRR 8-km NDVI dataset compatible with MODIS and SPOT vegetation NDVI data. Int. J. Remote Sens 2005, 26, 4485–4498. [Google Scholar]
- Holben, B.N. Characteristics of maximum-value composite images from temporal AVHRR data. Int. J. Remote Sens 1986, 7, 1417–1434. [Google Scholar]
- Huete, A.; Justice, C.; van Leeuwen, W. MODIS Vegetation Indices Algorithm Theoretical Basis Document Version 3. Available online: http://modis.gsfc.nasa.gov/data/atbd/atbd_mod13.pdf (accessed on 12 November 2013).
- Piao, S.; Mohammat, A.; Fang, J.; Cai, Q.; Feng, J. NDVI–based increase in growth of temperate grasslands and its responses to climate changes in China. Glob. Environ. Chang 2006, 16, 340–348. [Google Scholar]
- Piao, S.; Fang, J.; Zhou, L.; Guo, Q.; Henderson, M.; Ji, W.; Li, Y.; Tao, S. Interannual variations of monthly and seasonal normalized difference vegetation index (NDVI) in China from 1982 to 1999. J. Geophys. Res 2003, 108. [Google Scholar] [CrossRef]
- Myneni, R.B.; Keeling, C.; Tucker, C.; Asrar, G.; Nemani, R. Increased plant growth in the northern high latitudes from 1981 to 1991. Nature 1997, 386, 698–702. [Google Scholar]
- Guo, L.; Wu, S.; Zhao, D.; Yin, Y.; Leng, G.; Zhang, Q. NDVI-based vegetation change in Inner Mongolia from 1982 to 2006 and its relationship to climate at the biome scale. Adv. Meteorol 2014, 2014, 692068. [Google Scholar]
- Xin, Z.; Xu, J.; Zheng, W. Spatiotemporal variations of vegetation cover on the Chinese Loess Plateau (1981–2006): Impacts of climate changes and human activities. Sci. China Ser. D 2008, 51, 67–78. [Google Scholar]
- Fensholt, R.; Proud, S.R. Evaluation of earth observation based global long term vegetation trends—Comparing GIMMS and MODIS global NDVI time series. Remote Sens. Environ 2012, 119, 131–147. [Google Scholar]
- Qin, Z.; Li, W.; Burgheimer, J.; Karnieli, A. Quantitative estimation of land cover structure in an arid region across the Israel-Egypt border using remote sensing data. J. Arid Environ 2006, 66, 336–352. [Google Scholar]
- Lotsch, A.; Friedl, M.A.; Anderson, B.T.; Tucker, C.J. Response of terrestrial ecosystems to recent Northern Hemispheric drought. Geophys. Res. Lett 2005, 32, L06705. [Google Scholar]
- Park, H.S.; Sohn, B. Recent trends in changes of vegetation over East Asia coupled with temperature and rainfall variations. J. Geophys. Res. Atmos 2010, 115, D14101. [Google Scholar]
- Zhang, X.Y.; Gong, S.L.; Zhao, T.L.; Arimoto, R.; Wang, Y.Q.; Zhou, Z.J. Sources of Asian dust and role of climate change versus desertification in Asian dust emission. Geophys. Res. Lett 2003, 30. [Google Scholar] [CrossRef]
- Zhang, G.; Dong, J.; Xiao, X.; Hu, Z.; Sheldon, S. Effectiveness of ecological restoration projects in Horqin Sandy Land, China based on SPOT-VGT NDVI data. Ecol. Eng 2012, 38, 20–29. [Google Scholar]
- Zhou, L.; Tucker, C.J.; Kaufmann, R.K.; Slayback, D.; Shabanov, N.V.; Myneni, R.B. Variations in northern vegetation activity inferred from satellite data of vegetation index during 1981 to 1999. J. Geophys. Res. Atmos 2001, 106, 20069–20083. [Google Scholar]
- Fang, J.; Piao, S.; Zhou, L.; He, J.; Wei, F.; Myneni, R.B.; Tucker, C.J.; Tan, K. Precipitation patterns alter growth of temperate vegetation. Geophys. Res. Lett 2005, 32, L21411. [Google Scholar]
- Zhao, X.; Tan, K.; Zhao, S.; Fang, J. Changing climate affects vegetation growth in the arid region of the northwestern China. J. Arid Environ 2011, 75, 946–952. [Google Scholar]
- Jobbágy, E.G.; Sala, O.E.; Paruelo, J.M. Patterns and controls of primary production in the Patagonian steppe: A remote sensing approach. Ecology 2002, 83, 307–319. [Google Scholar]
- Tucker, C.J.; Newcomb, W.W.; Los, S.O.; Prince, S.D. Mean and inter-year variation of growing-season normalized difference vegetation index for the Sahel 1981–1989. Int. J. Remote Sens 1991, 12, 1133–1135. [Google Scholar]
- Li, B.; Tao, S.; Dawson, R. Relations between AVHRR NDVI and ecoclimatic parameters in China. Int. J. Remote Sens 2002, 23, 989–999. [Google Scholar]
- Mu, S.; Zhou, S.; Chen, Y.; Li, J.; Ju, W.; Odeh, I. Assessing the impact of restoration- induced land conversion and management alternatives on net primary productivity in Inner Mongolian grassland, China. Glob. Planet. Chang 2013, 108, 29–41. [Google Scholar]


| RY | Precipitation | Temperature | |||||
|---|---|---|---|---|---|---|---|
| Before RY | After RY | Entire Period | Before RY | After RY | Entire Period | ||
| Mongolia | 1994 | 0.79 *** | 0.83 *** | 0.58 *** | 0.07 | 0.10 | 0.03 |
| Inner Mongolia | 1998 | 0.65 ** | 0.74 ** | 0.50 ** | 0.66 ** | 0.13 | 0.24 |
| Mongolian Plateau | 1994 | 0.80 *** | 0.85 *** | 0.57 *** | 0.21 | 0.08 | 0.18 |
Note: *** and ** indicate p < 0.001 and p < 0.01, respectively; RY denote Reversal Year of NDVI trend.
© 2014 by the authors; licensee MDPI, Basel, Switzerland This article is an open access article distributed under the terms and conditions of the Creative Commons Attribution license (http://creativecommons.org/licenses/by/3.0/).
Share and Cite
Bao, G.; Qin, Z.; Bao, Y.; Zhou, Y.; Li, W.; Sanjjav, A. NDVI-Based Long-Term Vegetation Dynamics and Its Response to Climatic Change in the Mongolian Plateau. Remote Sens. 2014, 6, 8337-8358. https://doi.org/10.3390/rs6098337
Bao G, Qin Z, Bao Y, Zhou Y, Li W, Sanjjav A. NDVI-Based Long-Term Vegetation Dynamics and Its Response to Climatic Change in the Mongolian Plateau. Remote Sensing. 2014; 6(9):8337-8358. https://doi.org/10.3390/rs6098337
Chicago/Turabian StyleBao, Gang, Zhihao Qin, Yuhai Bao, Yi Zhou, Wenjuan Li, and Amarjargal Sanjjav. 2014. "NDVI-Based Long-Term Vegetation Dynamics and Its Response to Climatic Change in the Mongolian Plateau" Remote Sensing 6, no. 9: 8337-8358. https://doi.org/10.3390/rs6098337
APA StyleBao, G., Qin, Z., Bao, Y., Zhou, Y., Li, W., & Sanjjav, A. (2014). NDVI-Based Long-Term Vegetation Dynamics and Its Response to Climatic Change in the Mongolian Plateau. Remote Sensing, 6(9), 8337-8358. https://doi.org/10.3390/rs6098337