Detection of Gully-Affected Areas by Applying Object-Based Image Analysis (OBIA) in the Region of Taroudannt, Morocco


Abstract
: This study aims at the detection of gully-affected areas by applying object-based image analysis in the region of Taroudannt, Morocco, which is highly affected by gully erosion while simultaneously representing a major region of agro-industry with a high demand of arable land. As high-resolution optical satellite data are readily available from various sensors and with a much better temporal resolution than 3D terrain data, an area-wide mapping approach to extract gully-affected areas using only optical satellite imagery was developed. The methodology additionally incorporates expert knowledge and freely-available vector data in a cyclic object-based image analysis approach. This connects the two fields of geomorphology and remote sensing. The classification results show the successful implementation of the developed approach and allow conclusions on the current distribution of gullies. The results of the classification were checked against manually delineated reference data incorporating expert knowledge based on several field campaigns in the area, resulting in an overall classification accuracy of 62%. The error of omission accounts for 38% and the error of commission for 16%, respectively. Additionally, a manual assessment was carried out to assess the quality of the applied classification algorithm. The limited error of omission contributes with 23% to the overall error of omission and the limited error of commission contributes with 98% to the overall error of commission. This assessment improves the results and confirms the high quality of the developed approach for area-wide mapping of gully-affected areas in larger regions. In the field of landform mapping, the overall quality of the classification results is often assessed with more than one method to incorporate all aspects adequately.1. Introduction
Situated between the High Atlas and Anti-Atlas, the region around the city of Taroudannt in the Souss Valley is characterized by high population dynamics and changing land use. With its extensive fruit-tree plantations and irrigated greenhouses for bananas and vegetables, it represents one of the most intensive agricultural regions of Morocco. However, the highly prosperous agro-industry, which is strongly related to the European market, is associated with an intense strain on the natural environment, especially through land degradation and aquifer overexploitation. For several centuries, the region has been strongly affected by gully erosion, leading to continuous loss of arable land [1]. Gully erosion is a form of soil erosion that is mainly induced by heavy rainfall events, but that also depends on soil properties, geomorphological factors and land-use management [2]. Particularly in semi-arid regions, gully erosion is considered a major factor contributing to the loss of soil in comparison to other forms of soil erosion. In the Souss, the increasing demand of arable land has now reached marginal land formerly unsuitable for agriculture: the expansion of the agricultural area is today commonly preceded by land-levelling measures, i.e., filling up gullies and badlands with soil material from the surrounding environment using bulldozers or similar equipment. Peter et al. [3] have shown that the rates for the loss of soil increase especially in areas where land-levelling measures take place. In this study, as in many research studies on gully-erosion rates, single gully sites are investigated in detail, whereas investigations of larger areas, on a regional scale, that are affected by gully erosion are rarely conducted. The area-wide mapping of gully-affected regions would enable investigations on the environment in which gullies occur and lead to a better understanding of the (spatial) context of gully erosion [4]. In addition, it would allow quantitative estimations on gully density in a given region and continuous monitoring of gully erosion.
Gullies may be considered as a specific type of landform. Area-wide mapping of specific landforms, in this study of gully-affected areas, requires an appropriate data source: the chosen data source has to contain sufficient information to be used for mapping the target landforms. In this context, information corresponds with landform properties that allow distinct differentiation of this landform from the surrounding environment. As for this approach, only optical satellite data will be used; the properties to be identified are limited to spectral features of gullies and gully-affected areas.
The presented work provides an integrated approach for gully detection based solely on the analysis of optical satellite imagery. A combination of object-based image analysis (OBIA) and expert knowledge from the field of geomorphology is applied for the detection of gully-affected areas as an example of landform mapping. As gullies often affect larger regions, an area-wide analysis on gully distribution is required. Most of the existing approaches focus on single gully sites or lack detail in terms of image resolution due to data non-availability.
This work combines aspects from different scientific fields. Details regarding each of these fields are provided in the the following sections.
1.1. Landform Characterization
Landforms may be considered as geomorphological (bounded) entities of the Earth’s surface that are not necessarily continuous [5]. Although remarkable progress has been achieved in geomorphology and related disciplines, the characterization of landforms on different scales is still a major task in recent literature [6,7]. In fact, the delineation process is driven by the quest for discontinuities that may originate as a result of various processes. Geomorphologists try to link landforms to underlying processes, whereby complex combinations of various processes may have led to today’s view of the Earth’s surface (and the landform under consideration).
The precise delineation of single landforms implies a difficult task due to the human factor, which plays a decisive role at this level of recognition [8]. Different approaches for delineation and mapping of landforms have been carried out: in field-based delineations of landforms, scientists follow some notion of the landform under investigation and typically decide in a Boolean way whether or not a particular entity shall be assigned to a particular landform category. The identification and classification of landforms from remote sensing data is increasingly popular among scientists [5,9–11]. Tasks are carried out at various levels of scale, from global-scale landform classification [12] to a local-scale delineation of landforms [13,14].
1.2. Landform Mapping
In general, the definition of landforms is considered to be crucial for the successful mapping of landforms. Evans [15] has elaborated profoundly on the question of what landforms are, including the fact that geomorphological mapping approaches are not equally suited for all kinds of different landforms. Several approaches proved that the combination of different remote sensing products as input data leads to reliable results for landform mapping approaches. Verstappen [16] provided an overview on former and future trends in geomorphological and landform mapping. Landform mapping is often based on landform properties that may be identified in digital terrain data. Schmidt and Andrew [6] presented an approach applied at various scales of curvature. Eisank et al. [17] recently presented an approach to assess the outcomes of multiresolution segmentation for delimiting drumlins from digital elevation models. However, landform mapping may also be carried out only on satellite images or other 2D information. This requires the identification of unique feature properties within optical or spectral information [14].
Gullies may be considered as a specific landform. For the present approach, their properties and appearance in optical satellite images is required and will be described in the following section.
1.3. Gullies as a Landform in Satellite Images
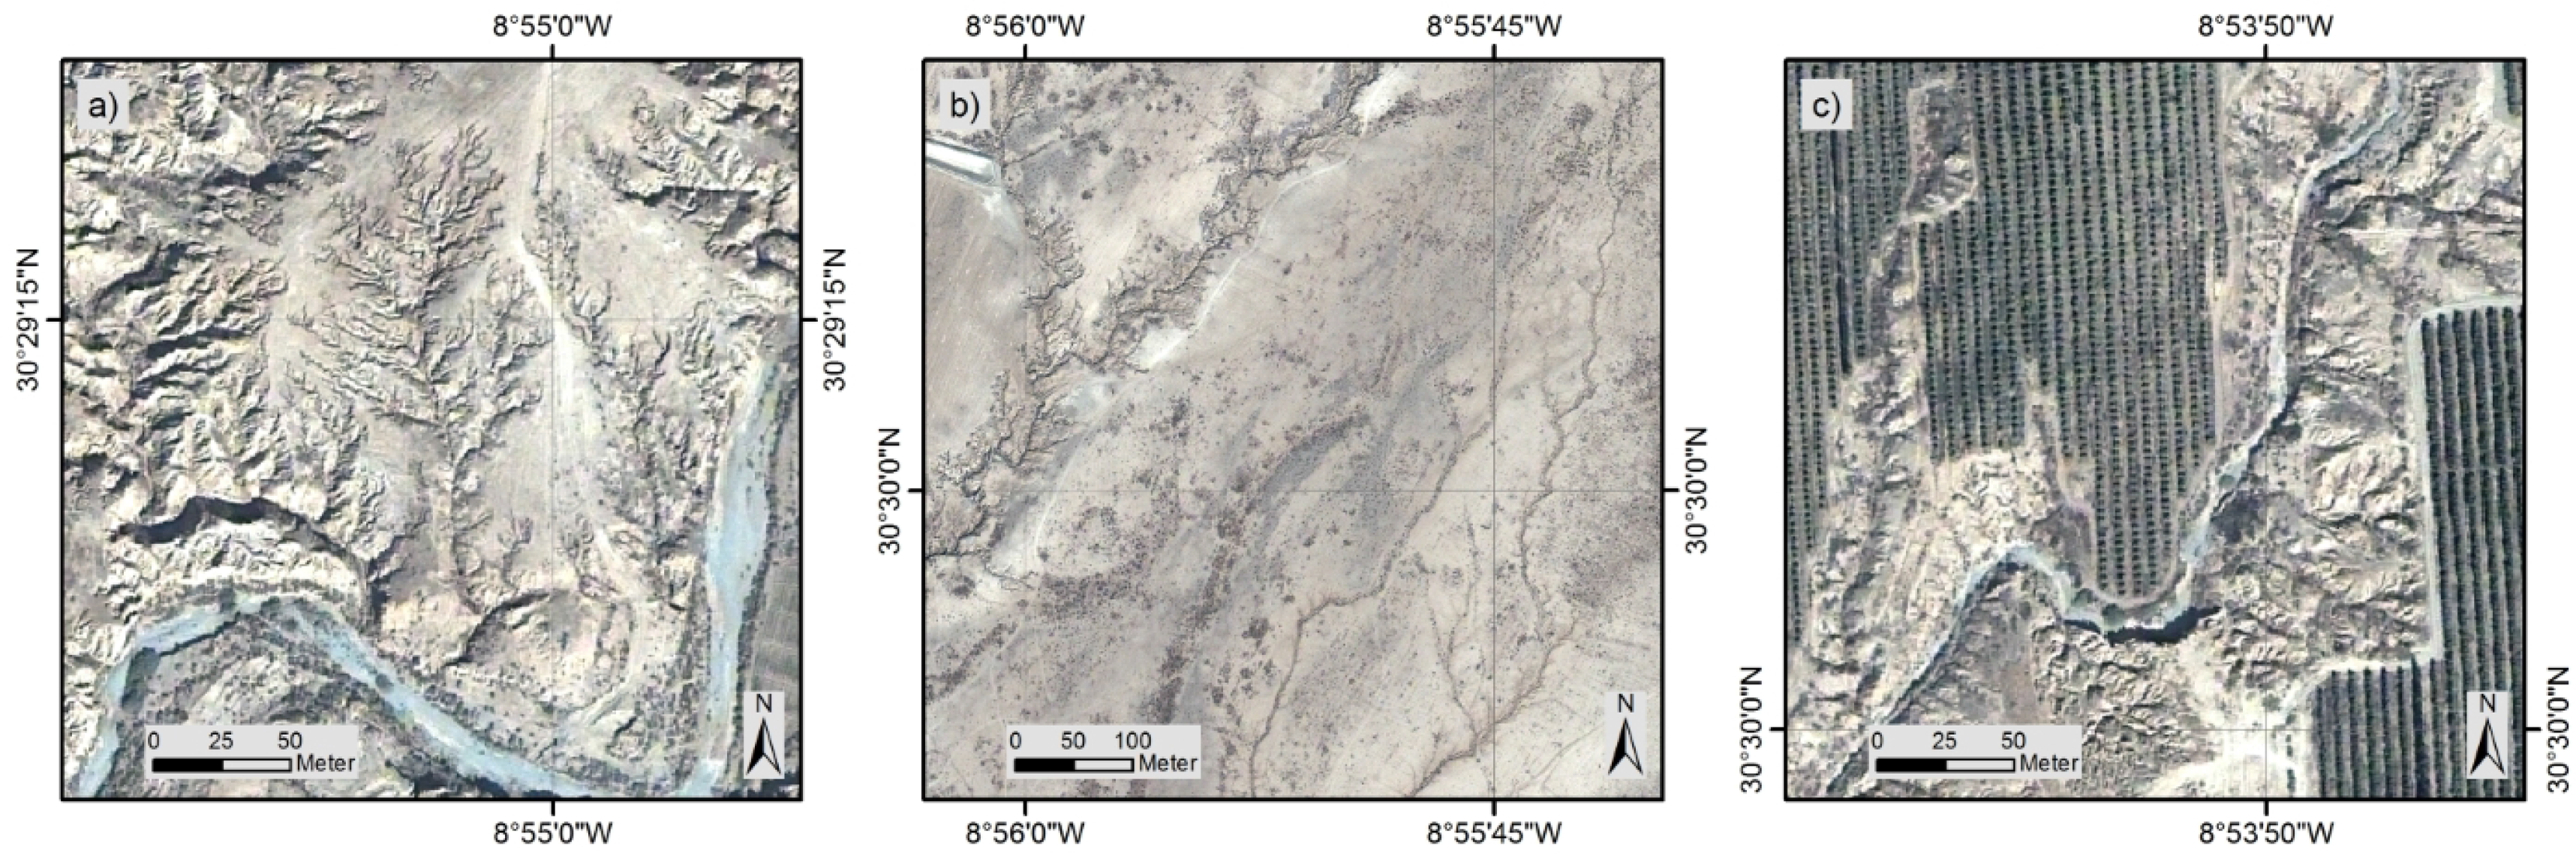
Gullies are three-dimensional erosion forms that may appear in various shapes, sizes and complexities. They range from simple longitudinal linear incisions to deeply incised dendritic networks with V-shaped, U-shaped and even overhanging cross-profiles to complex badlands. Their length may vary between a few meters to hundreds of meters and their width and depths from several decimeters to tens of meters [18]. In optical remote sensing images, the third dimension characterizing gullies as landforms is not directly noticeable or measurable. Thus, automatic classification, as well as visual image interpretation of gullies need to rely on the spectral, textural and shape parameters characterizing these forms.
The most important factor in this context is the shadow cast by the gully walls. Since the incidence angle of light changes relative to the terrain surface, for most gullies, shadow cast is present in optical satellite images. Spectrally, gullies do not generally differ from the surfaces they incise; the spectral properties of the bare soil may be the same within the gully as outside, and vegetation may grow both around and within a gully. The shadow of the Sun-diverted gully walls, however, present a spectral contrast between the surrounding surface and the sunlit opposite gully walls. In addition, the shadow indicates the linear character and shape of the gullies by emphasizing their edges. The pair of shadowed/sunlit slopes may be used for 3D gully monitoring [19], as well as for the delineation of gullies from 2D input data [14]. This is why, depending on the suitability of the image resolution with respect to the gully size, a human image interpreter is able to identify the linear course of individual gullies and gully branches and delineate the edges of a gully system and badlands. Figure 1 shows three types of possible gully appearance in optical satellite data from our study area. These types of appearances are also typical for other regions. In the center of Figure 1a, a dendritic, ramified system with many sharply-edged side branches can be seen. Between the individual branches, smaller flat parts of the original surface remain, but their cumulative area is smaller than the actual gully area. Although the local area contributing to the smaller inner head cuts of this system is now very small, the non-gullied flat areas will further decrease by strong sheet wash erosion and mass wasting at the steeper parts of the gully walls. Thus, the complete area can be considered as gully-affected. In comparison, the erosion forms shown in Figure 1b are much more linear. The long narrow structures in the right part of the image have an appearance rather typical of ephemeral gullies in agricultural land. The linear structures are harder to identify at the typical resolution of the QuickBird-2 satellite-image type due to their confined width and depth, the missing areal characteristics and the related lack of shadowing and contrast with their surroundings. In contrast, a further developed linear gully in the left part of the image is much more deeply incised (as discernibly by the shadowing) and bordered by a wide strip of small side branches cutting into the neighboring field. Findings from field work showed that these gullies are already too wide (2–3 m) and deep (0.5–1.5 m) to be considered ephemeral. Finally, Figure 1c represents gullied areas that are densely covered with deeply dendritic erosion systems with v-shaped slope profiles. No unaffected area remains between the individual gully branches in this typical badlands area that directly borders orange plantations.
An important point to mention here is the aspect of scale. Any chosen satellite data is limited by its respective pixel resolution. Therefore, the minimum spatial extent of the object to be identified, in this case gullies, has to match with the resolution of the input data. In the middle image of Figure 1, the linear gully system is hardly captured by the satellite image resolution and is therefore hard to recognize for the human image interpreter. In such cases, a valuable intermediate scale between satellite images and local scale is provided by UAV-based aerial images [20].
1.4. Existing Mapping Approaches for Gullies
Numerous mapping approaches have been carried out that show the continuously growing need and importance of mapping gullies. In the past, visual interpretation of aerial photographs and coarse satellite imagery was applied for mapping gully erosion [21]. Furthermore, the assessment of gully erosion from two different points in time was based on the manual interpretation of aerial photographs [22]. Vrieling et al. [23] applied a supervised classification approach of the maximum likelihood classifier for automatic identification of gullies based on ASTER imagery in the Brazilian Cerrados. The object-based approach developed by Knight et al. [24] was used to map gully erosion in Australia based on ASTER satellite images. In both cases, medium resolution images were interpreted by software algorithms. Mararakanye and Le Roux [25] recently published an example for mapping gully locations at a national scale for South Africa based on visual interpretation of SPOT-5 data. This clearly highlights the demand for solutions to mapping gullies over large areas based on high resolution satellite imagery with global coverage and a software-based approach to decrease the working time for the human image interpreter.
Aside from 2D input data, such as aerial photographs and satellite images, numerous mapping approaches have been applied based on 3D terrain data. These approaches are partly linked with the field of geomorphometry, i.e., landform analysis based on digital terrain data. For further details, see Pike [26] and Evans [15]. Martinez-Casanovas [27] developed an approach for mapping and quantifying gully erosion based on aerial photographs and digital elevation models. Shruthi et al. [28] presented an approach based on very high resolution (VHR) satellite data and a therefrom derived digital surface model (DSM) that was developed for the extraction of gully features. The detection of gullies in terrestrial LiDAR data based on GIS was recently published by Höfle et al. [29]. Other work based on LiDAR data was carried out by Johansen et al. [30], applying object-based monitoring of the spatial extent and the volume of gullies in northern Australia.
Using VHR optical satellite imagery as input data for gully mapping requires an approach that exceeds traditional per-pixel classification due to the necessity of addressing landform objects as pixel aggregates and to incorporate knowledge into the classification process. This can usually be achieved with object-based image analysis (OBIA) approaches. As described in Section 1.3, gullies do not generally differ from the surrounding environment in terms of spectral values. Yet, a combination of spectral features applied to objects may lead to the definition of gully appearances in optical satellite imagery. An expert may combine the different aspects that allow differentiating gullies from the surrounding area within the satellite image. These combinations can be considered as classification rules that are incorporated in OBIA. Knight et al. [24], Vrieling et al. [23], as well as Johansen et al. [30] applied this approach and took advantage of the possibility to incorporate (expert) knowledge. In the following section, detailed information on OBIA is provided.
1.5. Object-Based Image Analysis (OBIA)
As pixel-based classification approaches may only rely on spectral per-pixel values, the concept of object-based image analysis (OBIA) enables the expert to incorporate manifold aspects, starting from geometry over context to expert knowledge, and this may even be distributed on several vertical and horizontal levels (i.e., scales). According to Blaschke [31], OBIA produces “relatively homogeneous” regions, in regard to any homogeneity criterion. This may come closer to the perception of an expert in the field who will unconsciously and automatically create an object representing the gully landform in his or her mind. In recent years, OBIA has become a successful new methodology or paradigm [32] that goes beyond the “per-pixel approach”. It still uses pixel information, but through the grouping of pixels, additional features can be addressed (e.g., homogeneity of region, within-region variation or differences to neighboring objects). The regions are typically generated through segmentation based on one or more criteria of homogeneity in one or more dimensions. In addition, and sometimes of even greater advantage than the diversification of spectral value descriptions of objects, is the additional spatial information for objects (spatial topology, geometric descriptions, etc.).
Traditional per-pixel approaches deliver results for landform analysis that usually depend entirely on the information of individual pixels and the direct neighborhood only [23]. As stated above, other information that implicitly exists within the data is not considered [31]. This information that is left out in pixel-based approaches may solve several problems of detecting landforms in optical data by incorporating the context as one main aspect of expert knowledge. An example for shape-based classification of spectrally identified objects is given by van der Werff and van der Meer [33]. This is especially necessary in the context of soil erosion [4]. Herein, the main difference with traditional per-pixel approaches and, from the authors’ point of view, a main advantage when utilizing an object-based image analysis approach is the explicit incorporation of neighborhood, distance and proximity parameters.
2. Study Area and Data
The study area is located in the northeast of the City of Taroudannt in the Souss Valley, South Morocco. Based on an alluvial fan, the study area is characterized by a manifold coexistence of different types of land use and land cover, which are all affected by gully erosion. In the south, the alluvial fan is bordered by the wadi Oued Irguitène. In the distal part, the alluvial fan is mostly affected by gully erosion. See Peter et al. [3] for more details on the geomorphology of the study area.
The region is highly dynamic with regards to agro-industrial cultivation of citrus fruits that are produced mainly for the European market. Thus, high pressure on arable land characterizes the agricultural, as well as the residential areas. In addition, possible extensions of agricultural areas are pushed forward wherever possible (see also d’Oleire-Oltmanns et al. [20]). Herein lie the complex difficulties: very often, greenhouses, plantations and settlement areas directly neighbor gullies. The given semi-arid climatic conditions in combination with the rather sandy soil foster the development of gully erosion [3]. Gully erosion may therefore be considered as a direct threat for the population, as well as the farmers. An up-to-date area-wide distribution map of gullies is therefore highly valuable.
Input datum is a multispectral QuickBird-2 satellite image, which was acquired on 10/26/2009 with an off-nadir angle of 18 degree. It includes a pan-chromatic band at 0.6-m spatial resolution with three visible (RGB) bands and one near-infrared (NIR) band at 2.4 m. The image was pan-sharpened to 0.6-m pixel resolution, and all analyses were carried out on this pan-sharpened image. The area covered by this satellite scene is located in Southern Morocco in the Souss Valley. The exact UTM (Zone 29N) coordinates are 499,432/3,386,764 (upper left) and 515,707/3,366,552 (lower right) with WGS84 as the geodetic datum. For further details, see [20].
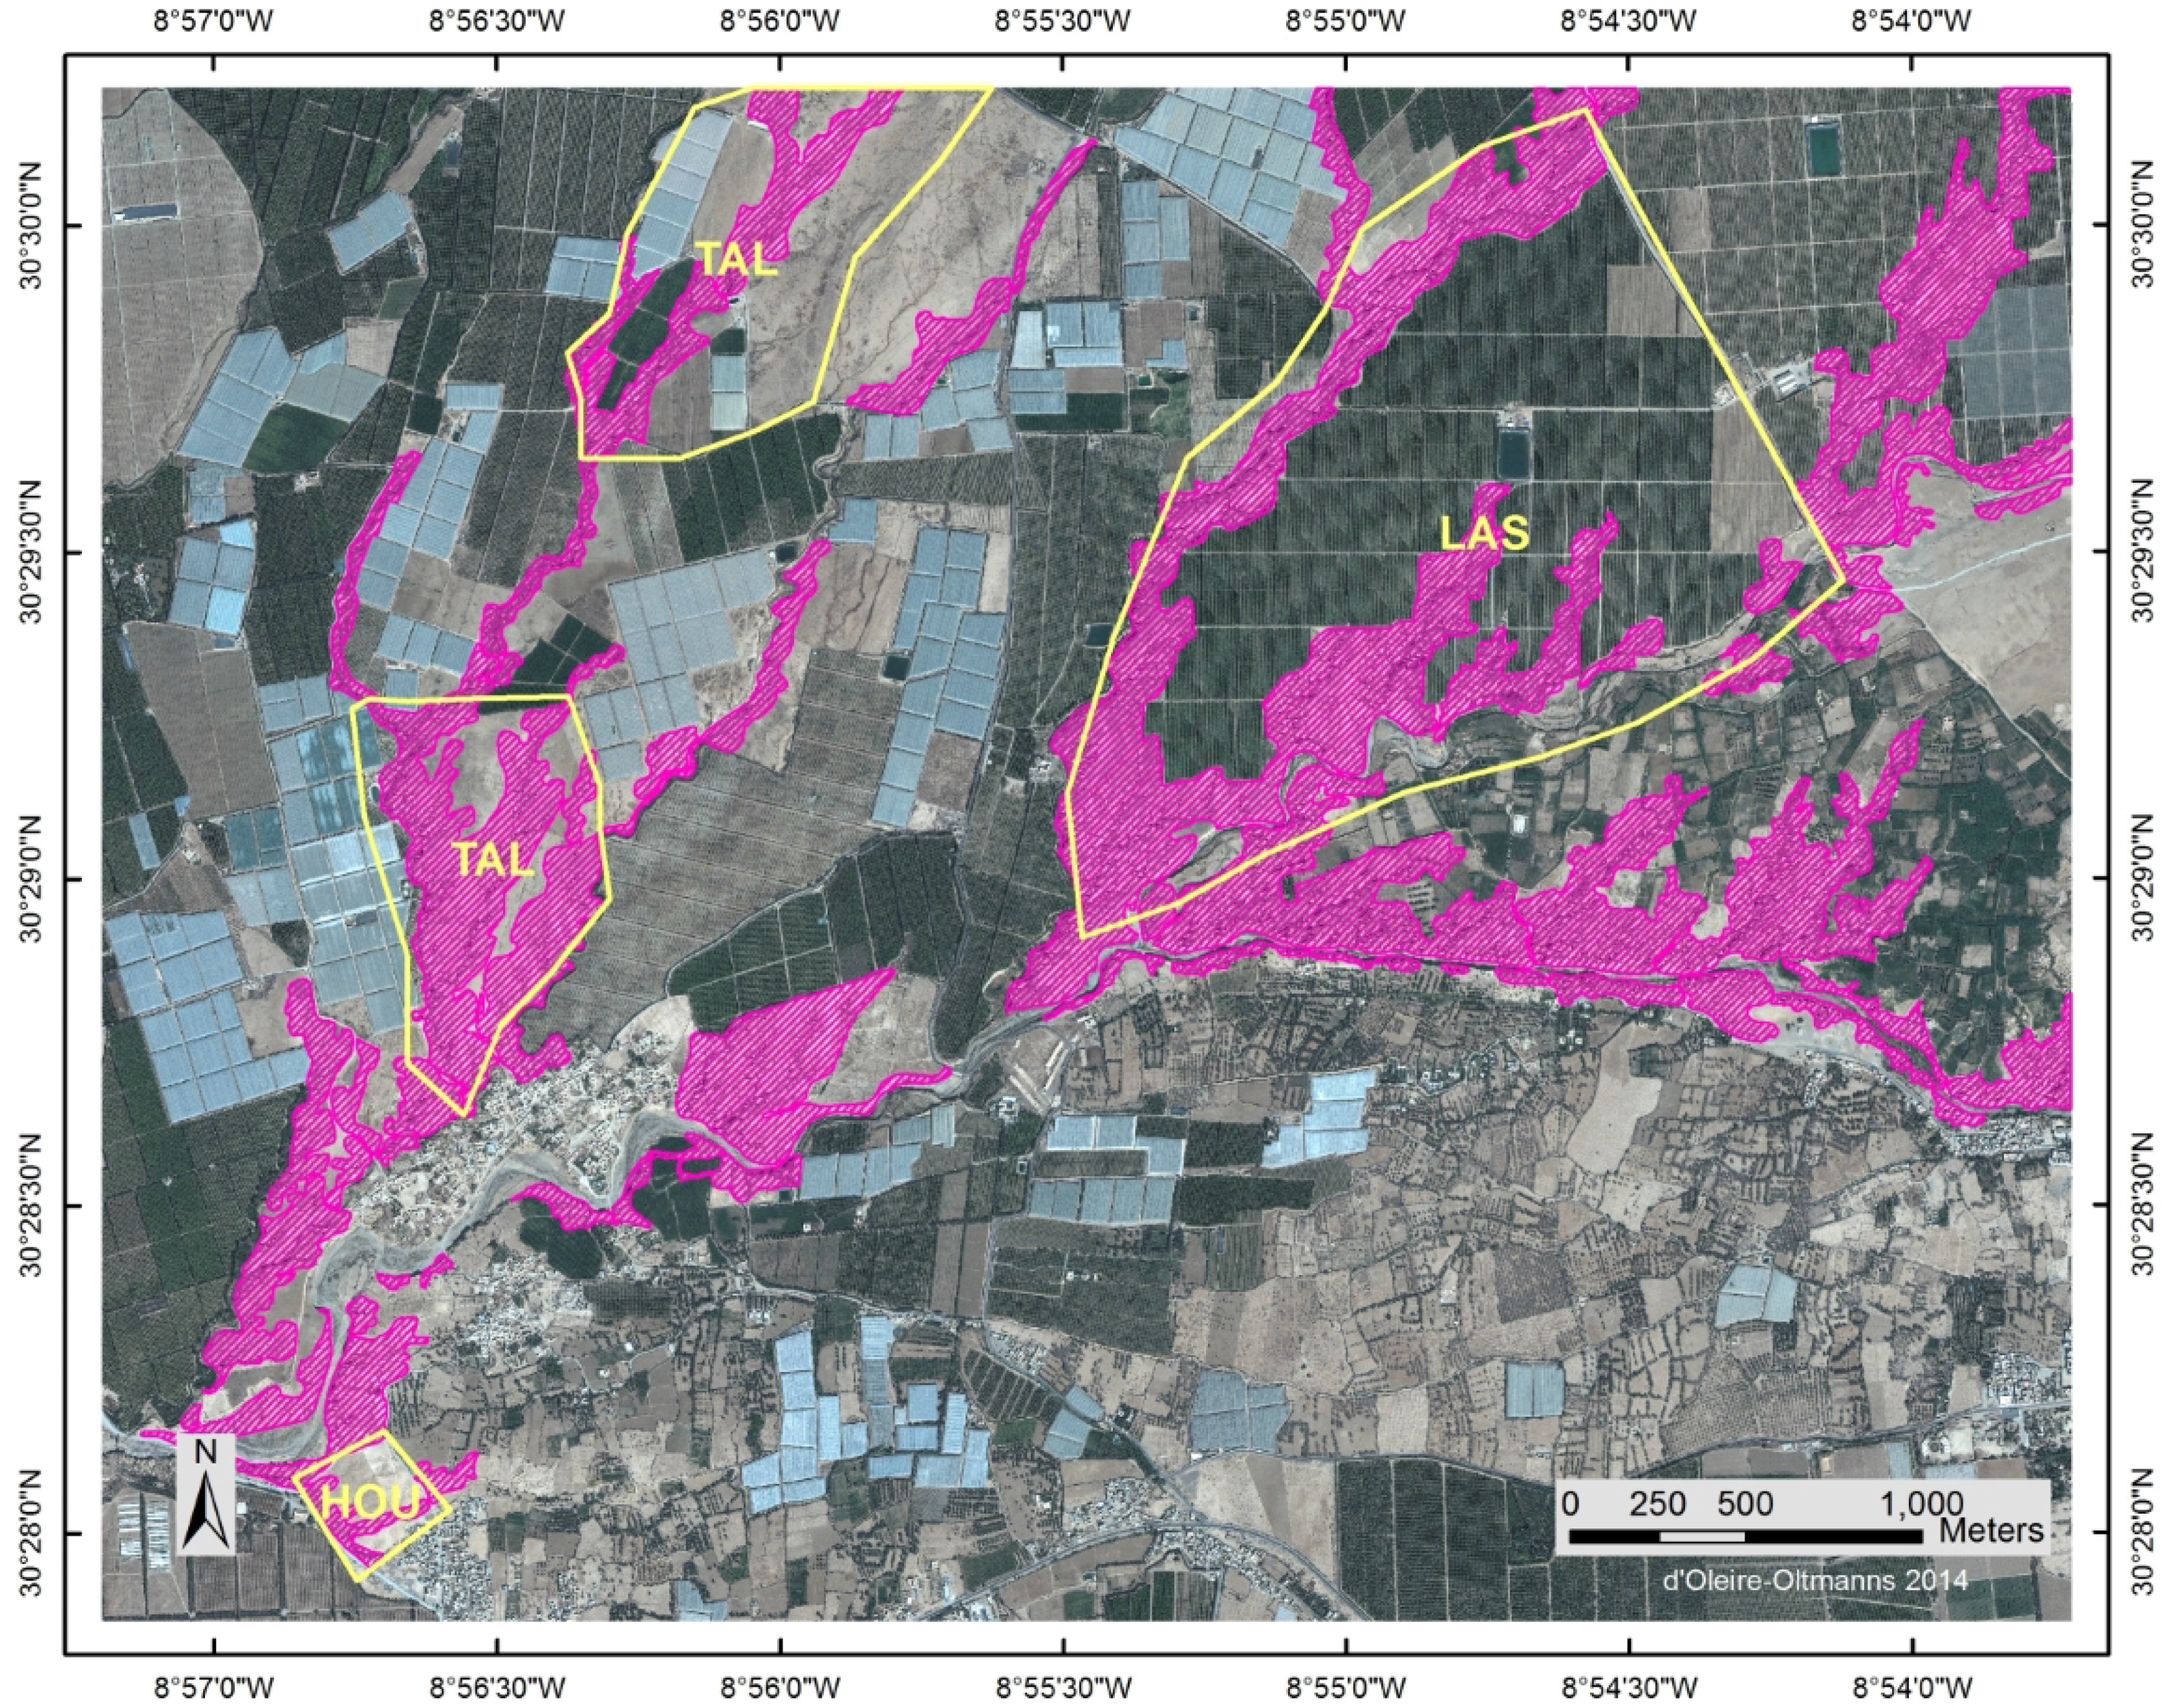
The analyzed subset of this satellite scene has an extent of 5.57 km (length) and 4.33 km (width). The subset was defined fulfilling the following criteria: containing study sites that have been investigated during several field trips by two of the authors, comprising a high degree of heterogeneity in terms of different land use classes, i.e., greenhouses, plantations, bare soil, roads, paths and little settlement areas consisting of several houses only. These little settlement areas were not part of the vector data incorporated (see below). Figure 2 illustrates the whole extent of the analyzed subset, including the four study sites (yellow polygons) that were investigated during several field campaigns [3,20] and the manually delineated reference data set (dashed pink polygons).
Vector layers of residential area and greenhouses were extracted from OpenStreetMap (OSM) and incorporated in the workflow. A visual check confirmed the correct spatial match and reliability of the OSM data. The two vector layers were updated by manual interpretation of the available QuickBird-2 image.
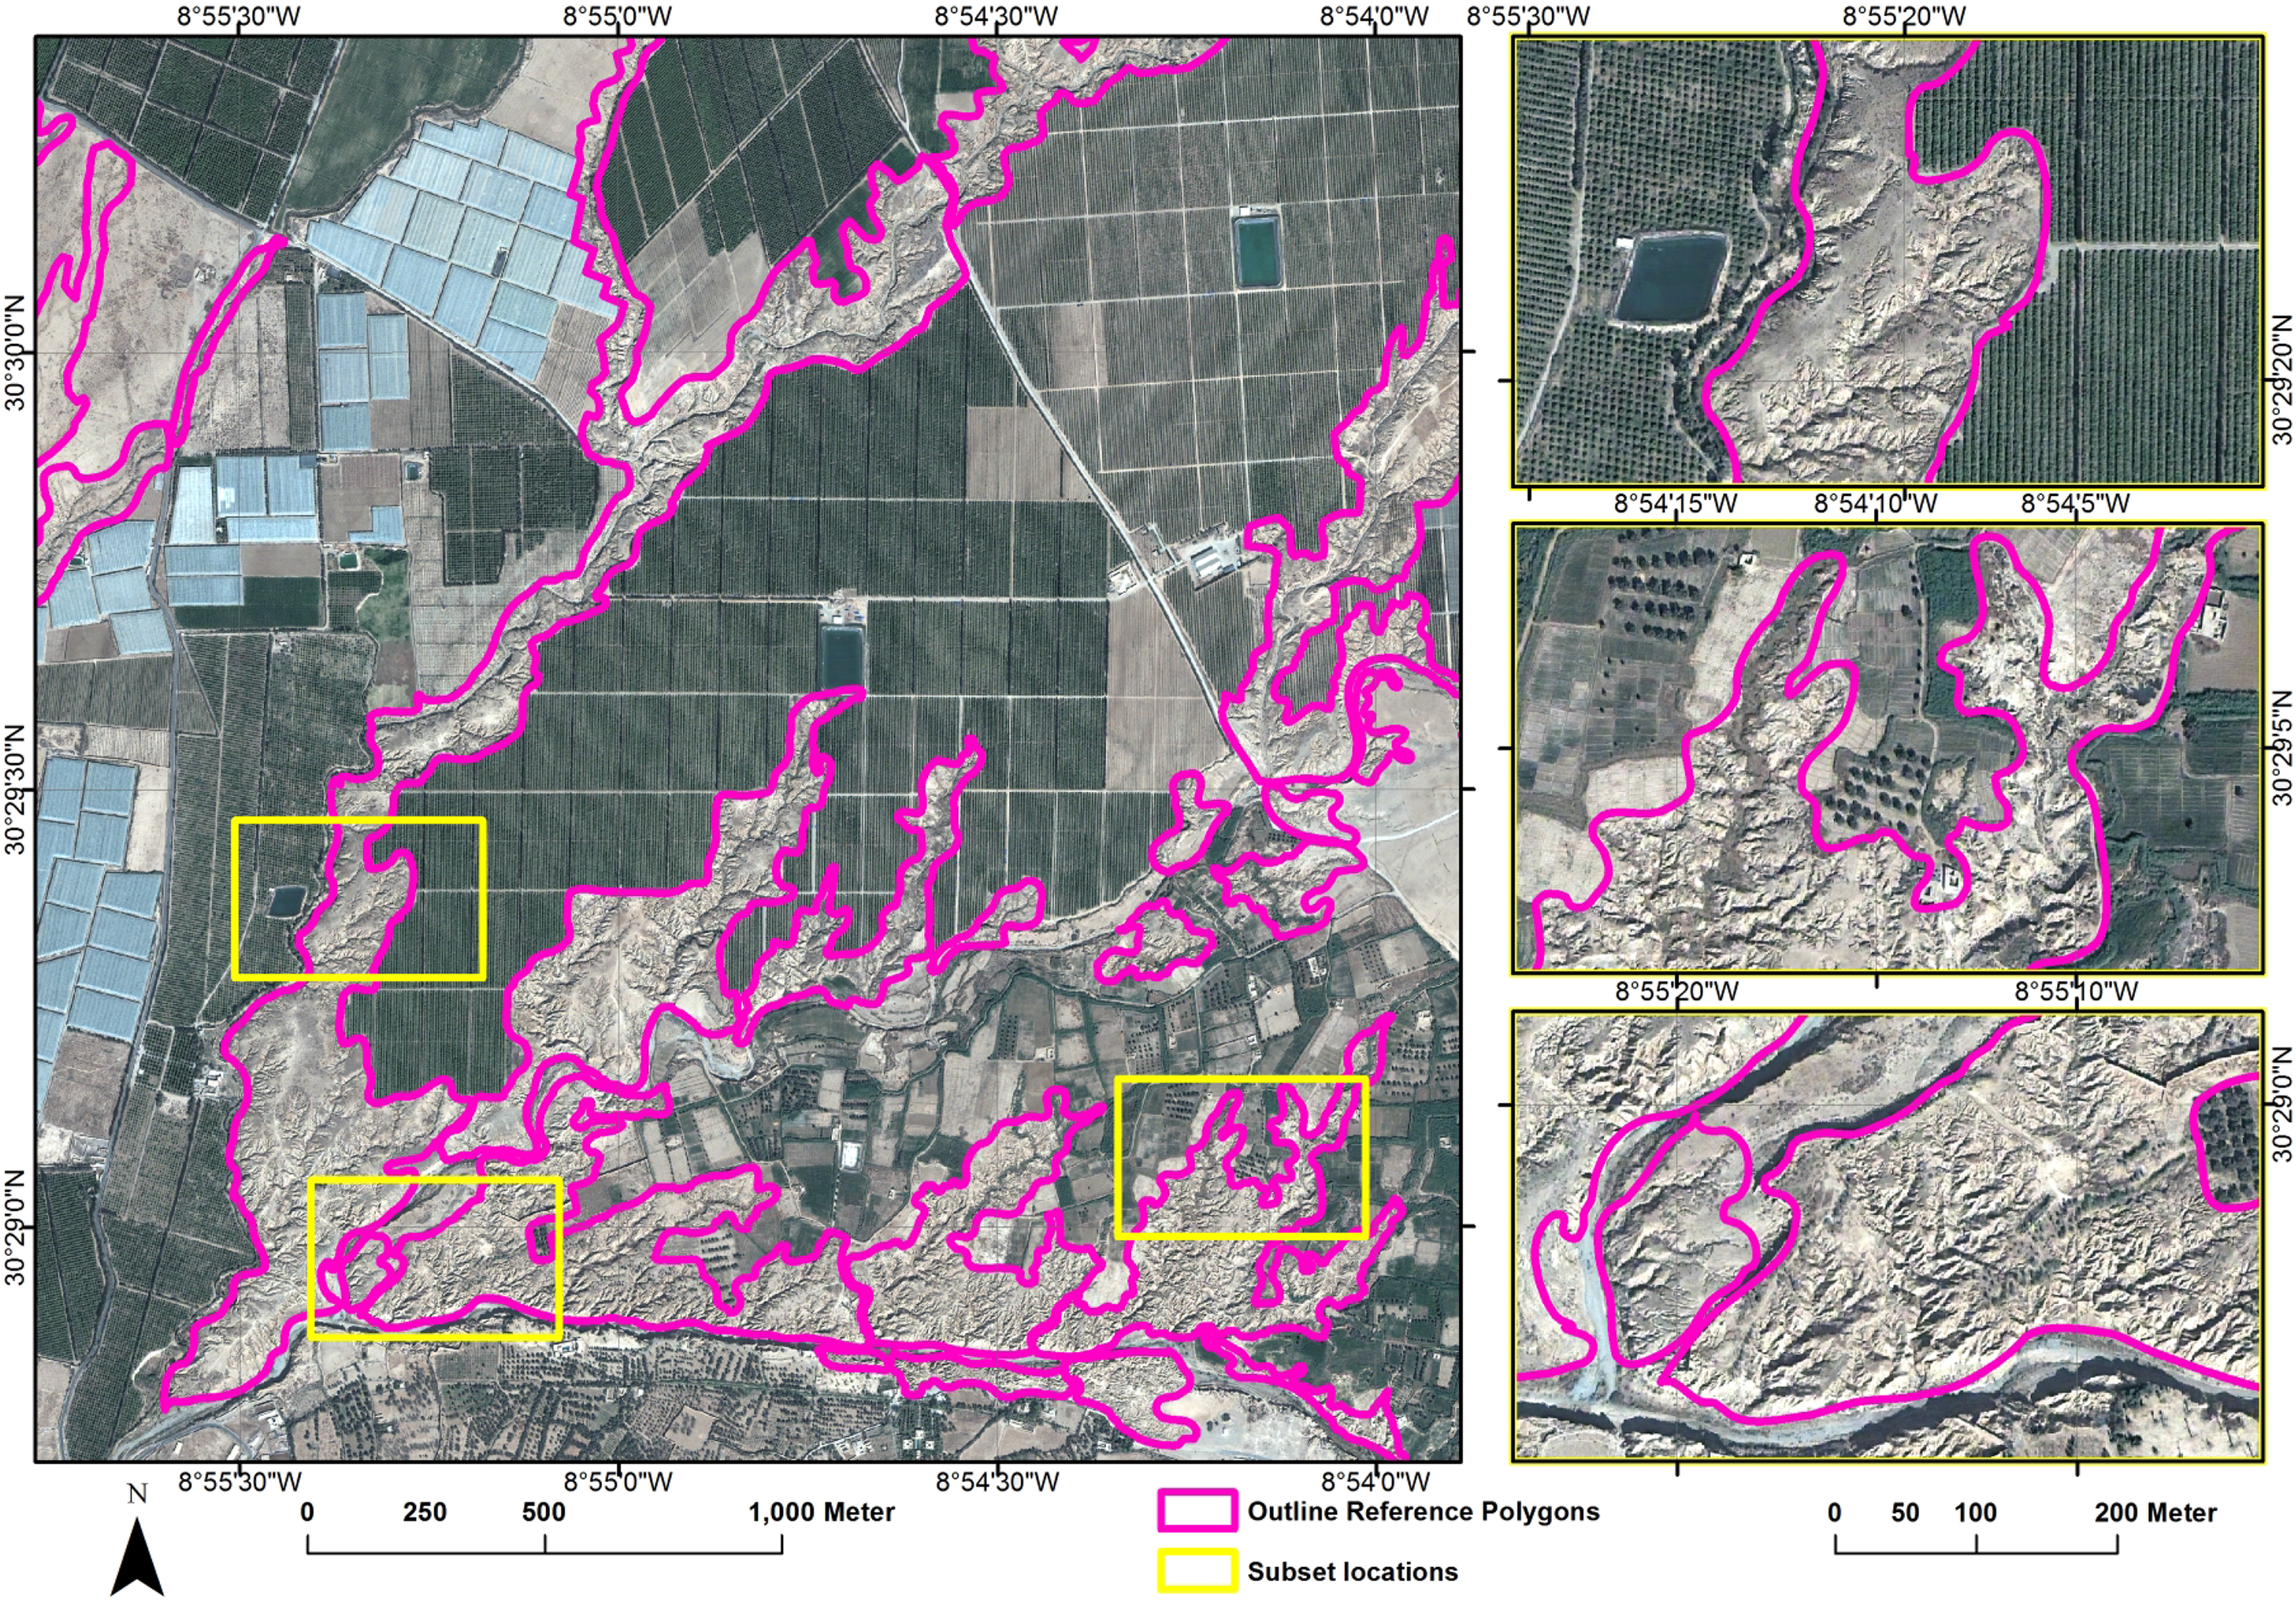
Reference data were derived from the subset satellite image incorporating expert knowledge (from several field campaigns carried out in the study area): Gullies were manually delineated from the QuickBird-2 image at a scale of 1:1500 using the ArcGIS software. The derived polygon data set was refined in a second iteration to increase the validity of the data set. This gully map was applied only as reference data for the accuracy assessment of the classification results. In Figure 3, a close-up of the reference data set, as well as three detailed views are illustrated. From top to bottom, these detail views show: (1) part of a gully neighboring plantation; (2) gullies within a heterogeneous environment; and (3) gully-affected areas that incise riverbanks.
3. Methodology
The presented approach for the detection of gully-affected areas is carried out by applying object-based image analysis (OBIA) on optical satellite imagery using eCognition Developer software (Trimble Geospatial). At an early stage, the vector data from OpenStreetMap (OSM) is incorporated in order to mask out plantations and residential areas.
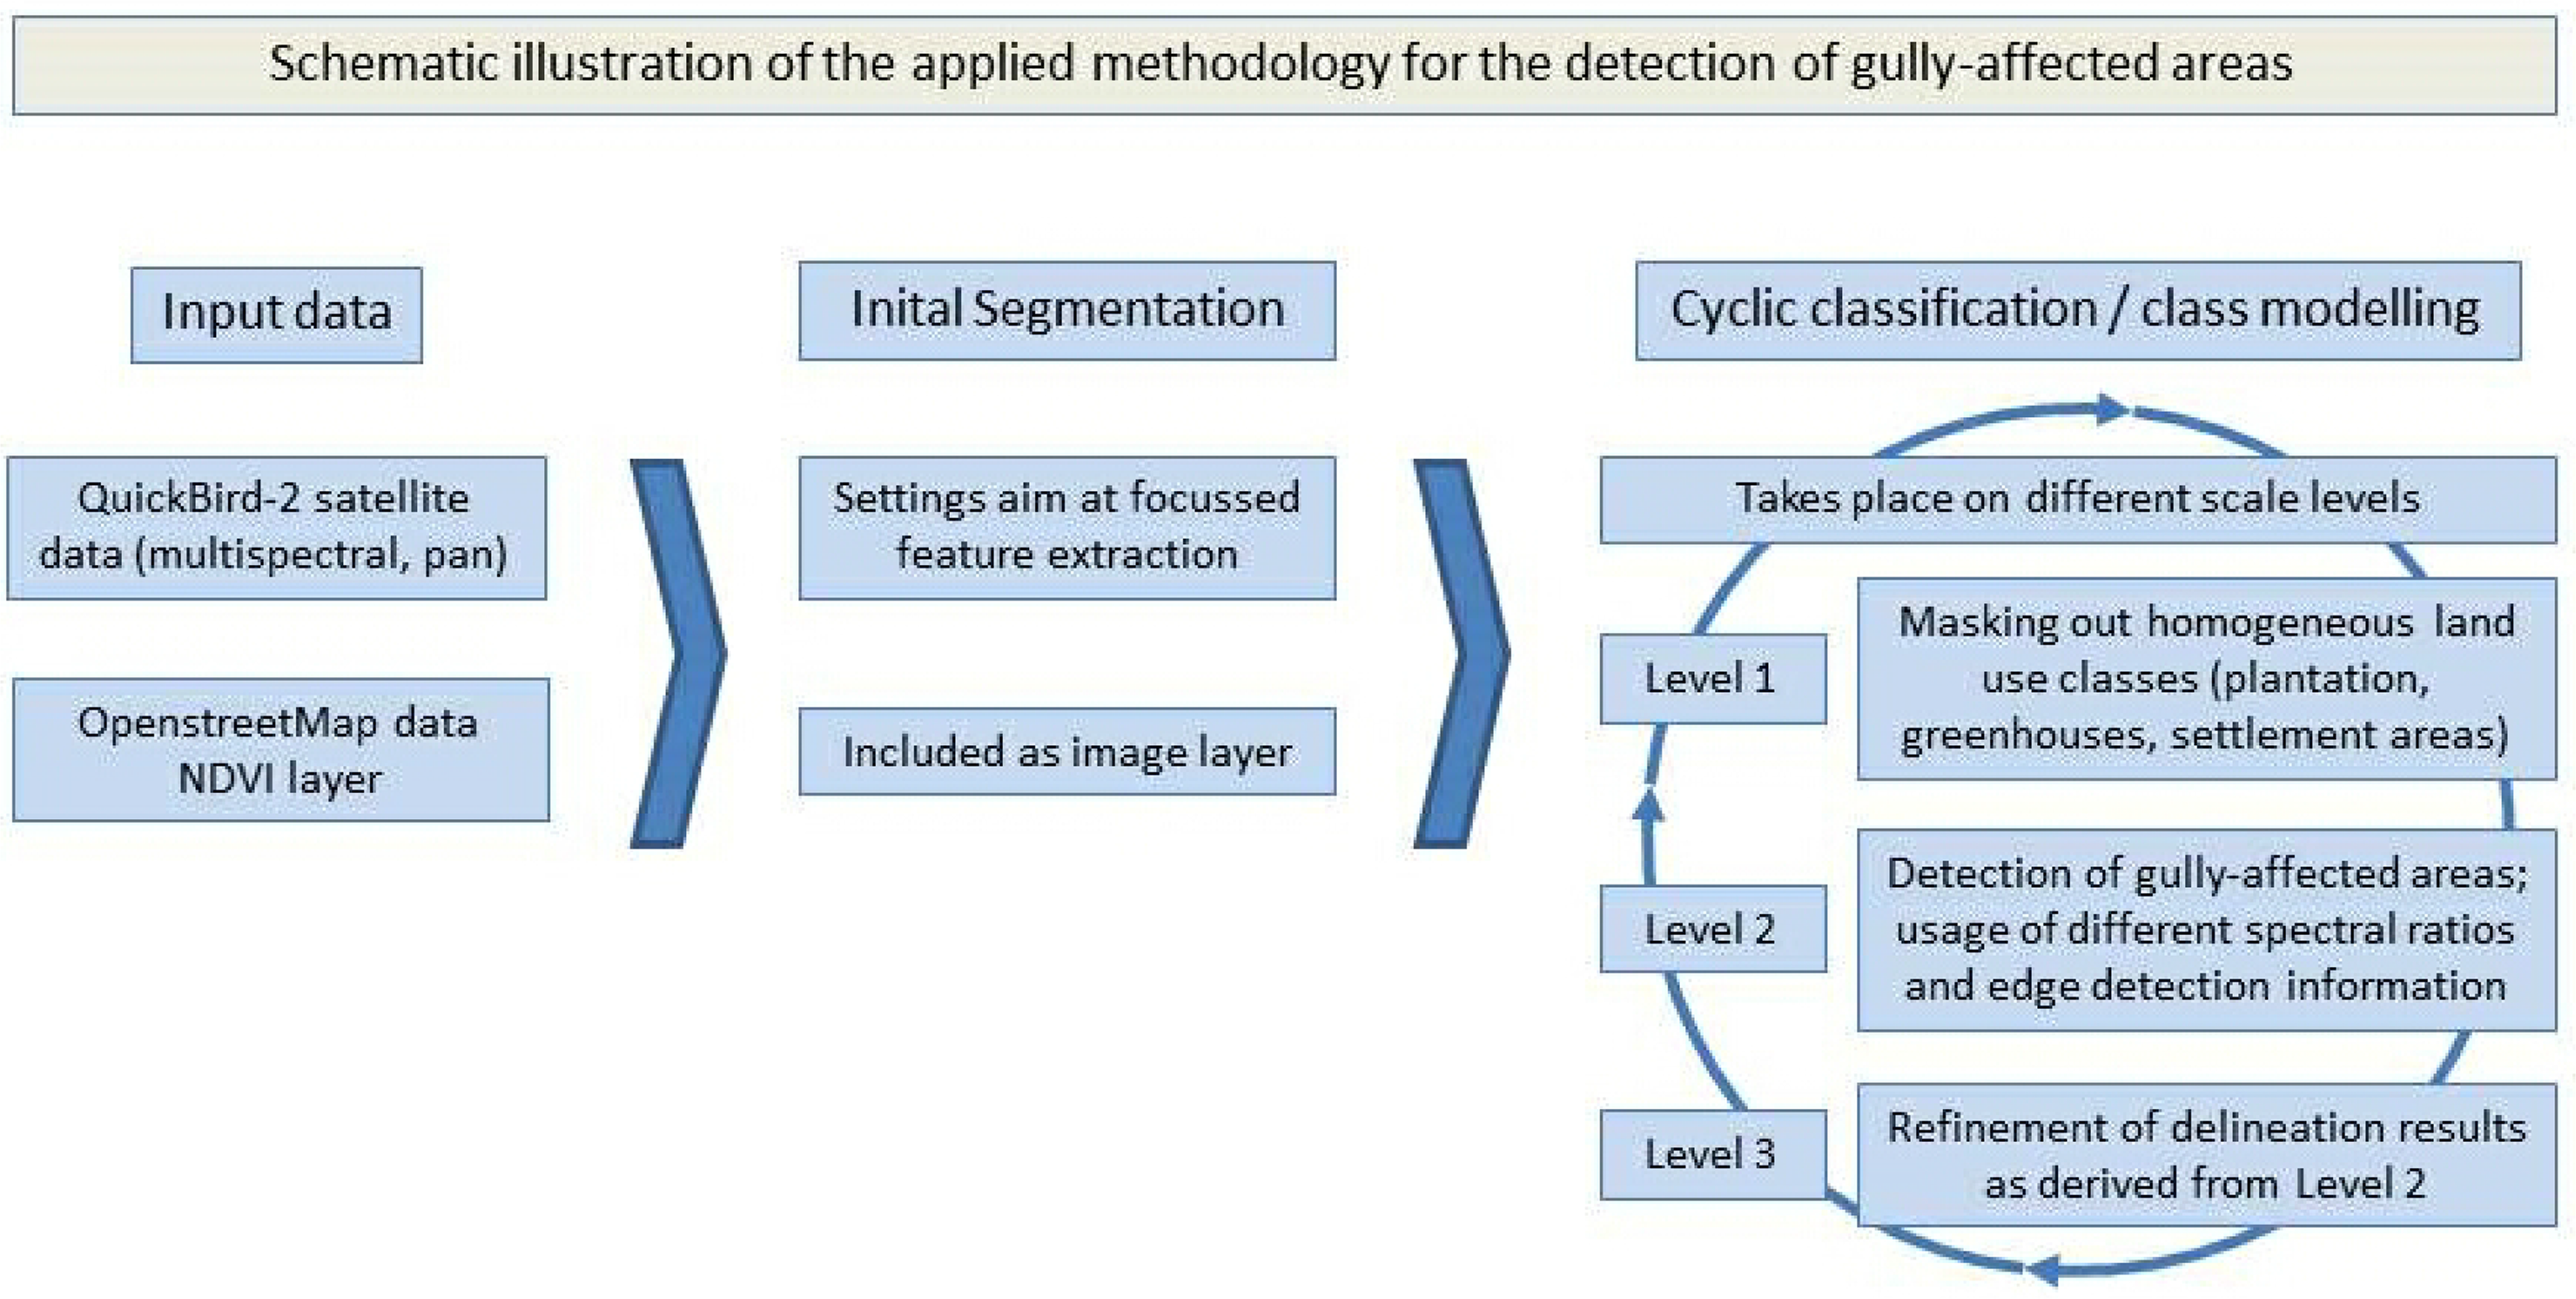
Developing a classification approach using only optical satellite imagery, as the main input data increases the possibility of transferring the classification approach onto other satellite imagery at a later stage. This might allow both a temporal analysis of the same study area by using archive satellite scenes, as well as the possibility of varying the study area, as the classification approach is not location dependent. As already described in Section 1.3, the description of gullies and gully-affected areas in optical imagery is limited due to the lack of a third dimension in the input data. Hence, the extraction is mainly based on general classification rules that are virtually independent of the spectral information provided within a specific satellite image. QuickBird-2 satellite imagery was chosen as the input data, as the resolution of 0.6 m × 0.6 m is definitely finer than the minimum extents of the gullies in the study area. The classification approach is carried out as a top-down approach, within a multi-scale (three level) hierarchy (cf. Figure 4). Masking out homogeneous land use classes, such as plantations, greenhouses and settlement areas, was processed on Level 1, which was segmented with the largest scale value. On this level, the incorporation of the freely-available OSM data took place, as well. The detection of gully-affected areas was then carried out on Level 2, mainly based on different spectral areas and edge detection information. Finally, some refinement of the results derived from Level 2 was performed on Level 3. A schematic illustration of the applied workflow is provided in Figure 4.
More detailed information on the individual working steps, i.e., the segmentation, including thematic layers, as well as the classification approach, is provided in the subsequent sections.
3.1. Segmentation Including Thematic Layers
As the initial step, the input data was segmented to derive objects for further classification steps. The presented approach aims at the extraction of gullies as target objects, rather than a wall-to-wall classification of the complete satellite image. Hence, the initial segmentation settings were adjusted to be optimal for gully-affected areas. Three different levels were used for the classification (see Figure 4). The multiresolution segmentation algorithm [34] was applied for creating the objects at each level. All three visible bands (RGB) and the near-infrared (NIR) were included in the segmentation process for creating the first two levels. The visible bands (RBG) were weighted with a value of 1, and the NIR band was weighted with a value of 2. The third level was created based solely on RGB information.
For the initial segmentation process, resulting in Level 1, the scale value was set to 300, the values for shape and compactness to 0.2 and 0.8, respectively. The low value of 0.2 for shape results in a much higher influence of color (spectral information) on the segmentation process. Nevertheless, setting the value for compactness to 0.8 aimed at delineating more compact objects, i.e., plantations, greenhouses and large areas of bare soil, in the first segmentation process. As gully-affected areas contain a low degree of compactness, due to their heterogeneous appearance, they were over-segmented in this level and the differentiation against homogeneous arable areas surrounding gullies was reached. Two additional layers were incorporated in the segmentation process: (1) the validated OSM data set was incorporated as a thematic layer that was used to mask out greenhouses and residential areas; (2) Normalized Difference Vegetation Index (NDVI) values were calculated for the whole extent of the input data on the pixel level (i.e., independent of any segments derived) and incorporated as an additional image layer. The NDVI is calculated as a ratio of spectral reflectances, where NIR denotes the reflectance in the near-infrared and R denotes the reflectance in the visible red. The respective equation is as follows:
For the second segmentation, resulting in Level 2, the scale value was set to 100, values for shape and compactness to 0.3 and 0.7, respectively. In this step, only areas that remained unclassified from Level 1 were considered. The increase of the value for shape from 0.2 to 0.3 slightly reduced the influence of color. In this step, this allowed for still considering the spectral properties for the segmentation process on this finer level, while reducing the impact of local spectral extrema on the segmentation result. The NDVI layer was incorporated as an additional image layer to directly consider NDVI values as indications for vegetated areas in the creation of segments on this finer level.
For the production of Level 3, the classified gully areas of Level 2 were refined. The segmentation of Level 3 used exactly the same parameters as for Level 2, but it was only based on RGB for the areas that have been classified as gullies in Level 2.
All of the described settings for the segmentation parameters are provided in Table 1.
The analysis of each of the three levels was carried out by translating knowledge into classification rules, which are described in the subsequent section.
3.2. Classification Approach
A classification approach combining the general concept of object-based image analysis (OBIA) with a top-down approach was developed to detect gully-affected areas within the extent of the input data.
In a first step, large homogeneous areas, such as plantations, greenhouses and residential areas, were masked out. Plantations were detected based on high values of the NDVI. The incorporation of the NDVI as the additional image layer into the segmentation process for the first level facilitated a more accurate delineation of objects for the identification of plantations (see Section 3.1). Greenhouses and residential areas were detected by incorporating information from the OSM data. A differentiation between greenhouses and residential areas was not necessary, as both land use types were masked out in this step. Incorporating the OSM data as a thematic layer into the segmentation process resulted in accurate objects (the polygon borders of the OSM data are considered as barrier lines in the segmentation process) that could be classified based on the existence of underlying information within the thematic layer, i.e., a binary condition was applied. After the classification, all polygons belonging to one class were merged to reduce the total number of polygons and also to prepare the input data for the second segmentation process that was carried out on the remaining unclassified areas. These unclassified areas consist of (apart from gully-affected areas) mainly bare soil and heterogeneous environment neighboring small areas of settlement. A heterogeneous environment is considered as areas that consist of small hedges, some trees, bare soil and small roads with some individual buildings.
The second classification step was carried out on Level 2 in order to extract gully-affected areas from the remaining study area. As described above, the approach aims to detect gully-affected areas by describing gullies preferably independent from spectral information that is clearly assigned to a specific satellite image. To fulfill this condition, shadowing characteristics (see Section 1.3) were predominantly considered: gullies often feature a rapid change of bright and shady areas due to their morphology. The different appearances (as described in detail in Section 1.3) feature all sequences of flat areas and incised branches. Depending on the depth of these branches, as well as the shape of the surrounding edges, there is a more or less sharp transition between light and shady areas. Lee sigma filters with a kernel size of 5 were calculated for edge extraction, both for dark and bright values. Subsequently, the values of both layers, i.e., dark and bright edges, were summed up by applying layer arithmetic within the eCognition Developer software. Using the resulting layer as the input information (object statistics), the classification focused on objects with high values. In addition, the contrast feature (CF) developed by [14] was used. Within areas that are defined as possible areas containing gullies, this feature led to an even more detailed differentiation of the potential gully-affected areas.
Further features that were used in classification rules referred to the geometry of gullies and the individual objects they consist of, such as the relation of length to width of these gully sub-objects. In a subsequent loop of the classification, the existence of neighboring objects that were classified as gullies was also taken into account. Starting from an object classified as a gully, the similarity of this gully object with neighboring objects was compared. Similarity here means spectral and spatial characteristics with the neighboring object. If a sufficient degree of similarity were given, the respective object was classified as a gully. Such rules were applied iteratively until a defined threshold of the defined similarity criteria was reached. On the third level, combinations of values from the NDVI layer and the Lee sigma layer were applied to identify areas to be assigned to the class gully, as well as to identify falsely classified areas that were removed from the class gully.
4. Results
4.1. Classification Results
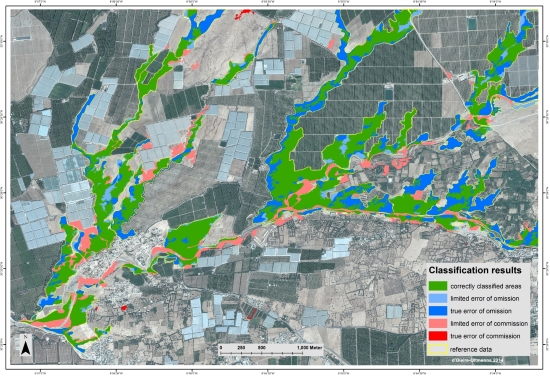
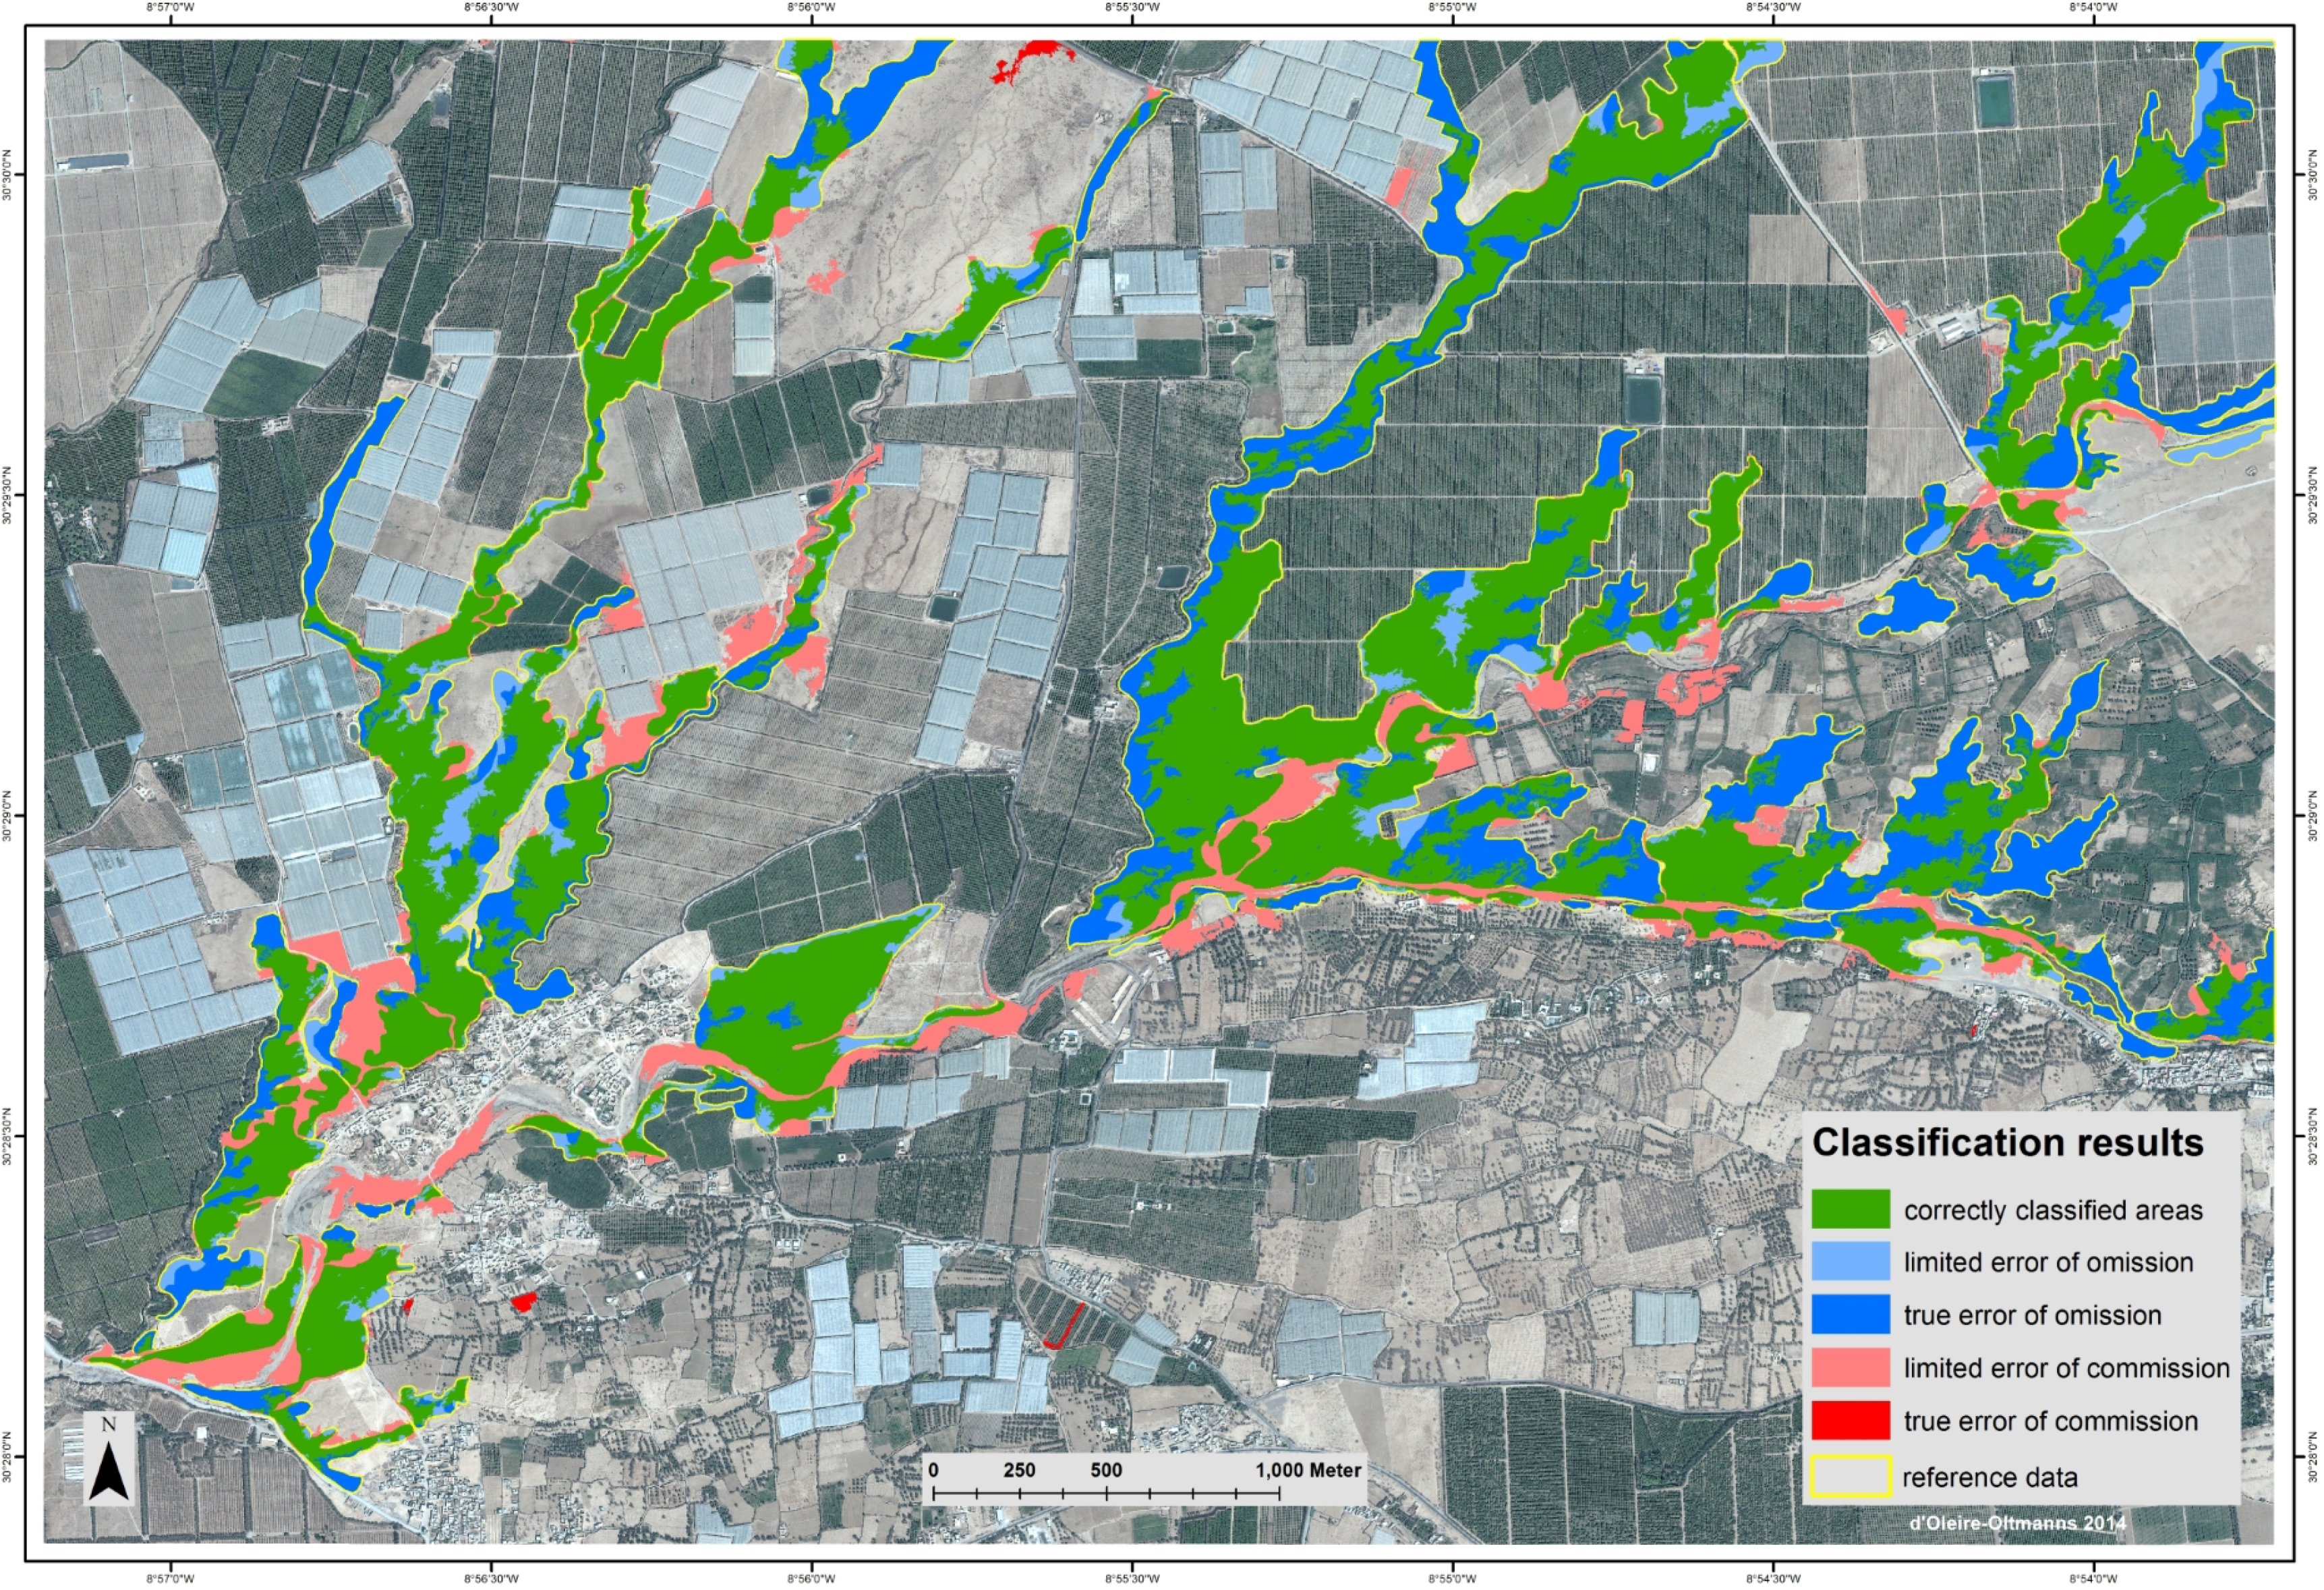
The developed classification approach led to a spatially exhaustive detection of gully-affected areas using only an optical satellite image as the input data set. An overview of the classification result is provided in Figure 5. The green polygons represent accurately classified areas that overlap completely with the reference data set. The light and dark blue polygons illustrate the error of omission. The light and dark red polygons illustrate the error of commission. The reference data are illustrated as yellow polygons. The differentiation of both the error of omission and the error of commission is based on the manual assessment of the classification results and explained in detail in Section 4.2.2.
The masked out areas, such as plantations (large dark green areas), greenhouses (light blue rectangular areas) and residential areas (appearing in the south and southeast), are also identifiable.
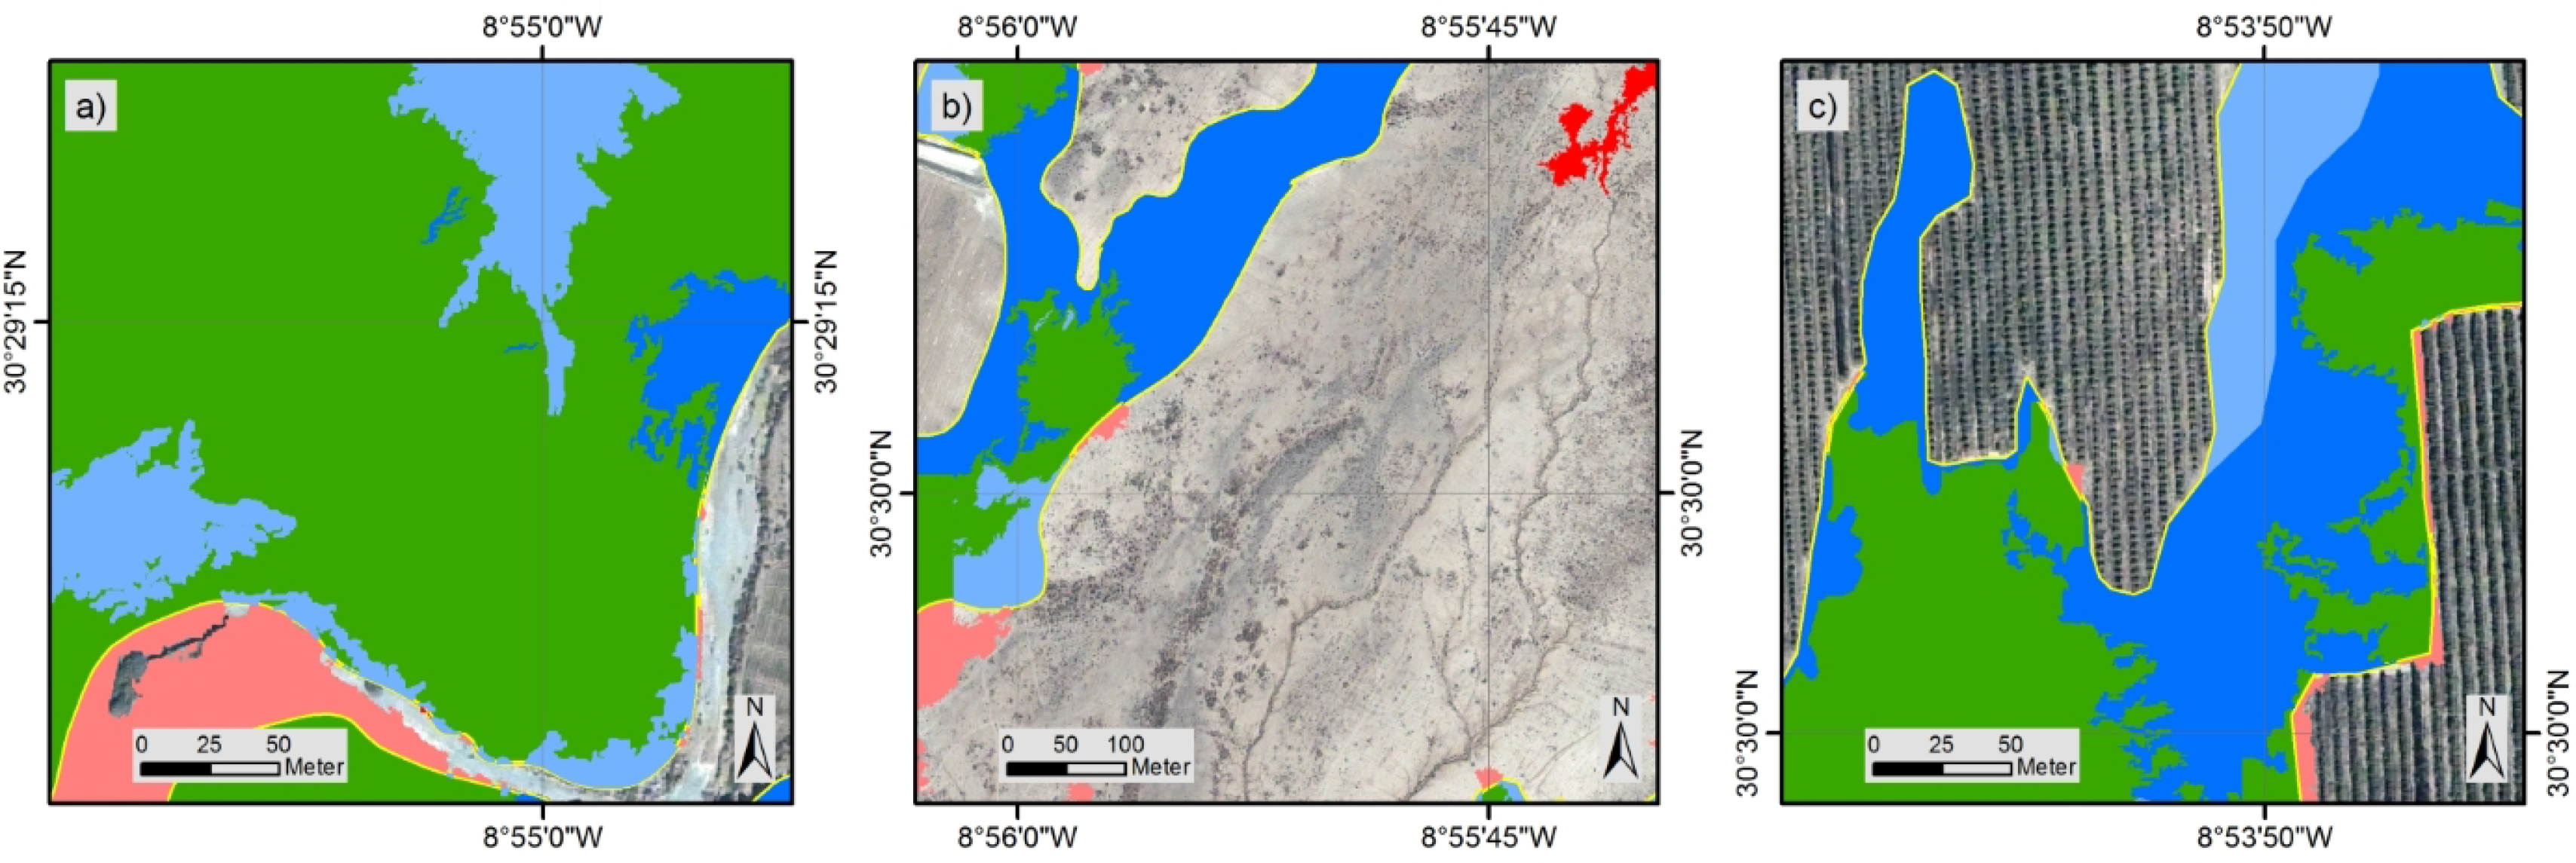
In order to provide detailed insights on the results, three subsets are illustrated in Figure 6. The different types of appearance of gullies in the three subsets are explained in detail in Section 1.3. In Figure 6a, the results show a very good coverage of the dendritic gully system. Figure 6b lacks accurate results for the gully system in the left part of the image where the defined thresholds were not met completely and due to the limited representation of the flat linear gully system in the right part of the image, which refers to the issue of scale, i.e., the resolution of the satellite image seems not to be fine enough. In Figure 6c, the classification provides good results, but does not fully cover the badlands area, which depends on the impact of erosive processes that have reshaped the morphology. Hence, the thresholds included in the classification were not met at these locations. In all three subsets, the classified areas that do not overlap with the reference data are illustrated in light and dark red. Evidently, those areas are partly directly linked with the gully-affected areas, but are not included in the reference data, which refers to the issue of delineating landforms that do not have a sharp border (see [8]). Solely in Figure 6b, little parts with a clear false classification (true error of commission) appear and are illustrated as dark red polygon.
As illustrated with the overall classification results in Figure 5, as well as the results illustrated in more detail in Figure 6, the developed classification approach is able to detect different types of gullies. It is not limited to specific types of gully-affected areas. This enables the initial mapping of gully-affected areas. In the following section, the accuracy of classification results is assessed and outcomes are provided.
4.2. Accuracy of the Classification Approach
Traditional remote sensing applications usually deal with clearly identifiable objects, which may be assessed with accurate reference data. In the case of landform detection, this is not sufficient. As also described by [14], the delineation of geomorphological elements, such as gullies or drumlins, is not a straight-forward task. The borders of such elements vary due to natural influences, i.e., mostly erosion, and are also still not clearly defined. Eisank et al. [17] also treats this topic in detail in a recent study.
For the presented study, a conventional accuracy assessment was performed. This well-known approach distinguishes between correctly and falsely classified areas in comparison to independent reference data. In addition, a manual assessment of areas representing the error of omission and of areas representing the error of commission was carried out. This manual assessment corresponds with the quality of the applied classification approach and the correct detection of gully-affected areas. Every single polygon was compared to the underlying QuickBird-2 satellite image to estimate on the share of partly correctly classified polygons and completely falsely classified areas.
4.2.1. Conventional Accuracy Assessment
In order to estimate the accuracy of the presented classification approach, a reference data set was delineated manually from the satellite image subset. The delineation is based on expert knowledge (several field campaigns in the study area) and aspects of how gullies appear in satellite imagery (see Section 1.3).
The classification results were overlaid with the reference data set, and the intersection area was calculated as a percentage of the reference area, corresponding to an overall classification accuracy of 62%. The under-classification that may be identified—areas mapped as gully-affected in the reference data, but not in the OBIA classification, light and dark blue polygons in Figure 5—is mainly due to the undershoot of the thresholds set in the classification rules. This results in an error of omission of 38%. The remaining areas, light and dark red polygons in Figure 5, that do not overlap with the reference data set would represent the false positives in traditional accuracy assessment attempts, resulting in an error of commission of 16%. These values are illustrated in Table 2.
The error of omission constitutes 38% of the area that was not classified, but that does overlap with the reference data. Developing a robust classification that is based on only optical information requires a precise definition of thresholds, which themselves assure the correct classification of the target feature, in this study of gullies. In Figure 5, areas that lack classification as a gully may be identified in the upper left and the upper middle part of the image. Here, sections of the gullies that were identified during manual delineation were not classified. This is explained by two aspects: firstly, the defined thresholds do not match with these specific areas; secondly, the pixel resolution of the chosen input data is not fine enough to sufficiently illustrate these flat parts of the gullies, leading to an under-representation of the gully as a target object. However, these are the only larger areas that were not correctly classified.
Most areas that were not classified correctly have a much smaller extent and directly neighbor correctly classified areas. The aspect of matching the set thresholds is taking effect again. Due to the existence of diverse gully types in the study area, some segments do not match with the defined thresholds. Still, the majority of the respective gullies are correctly classified and enable a proper identification of gully-affected areas.
4.2.2. Manual Assessment of Classification Results
Only applying a traditional accuracy assessment would ignore important aspects of this study, and therefore, a manual assessment of the classification results was additionally carried out. Drăgut and Eisank [12] have already highlighted the added value of applying more than one method for assessing the quality of classification results. Aspects provided with the concept of a fuzzy accuracy assessment (see [35]) were considered here in terms of the incorporation of intermediate classes that differentiate between limited and true error of omission and error of commission, respectively.
This manual assessment was focused on the areas that were not and not correctly classified. These areas constitute the false negatives with a percentage of 38% and the false positives with a percentage of 16%. These segments were individually checked against the underlying QuickBird-2 satellite imagery. The false negatives and the false positives, respectively, were distinguished into two classes each.
The error of omission consists of two types of segments: firstly, polygons that clearly cover gully-affected areas that were not classified (dark blue polygons in Figure 5) and, therefore, constitute a real error of omission; secondly, polygons that cover areas that are not directly identified as gully-affected areas, but as intermediate areas of bare soil between two gully branches or bordering incised gullies (light blue polygons in Figure 5) and, therefore, constitute a limited error of omission. This approach is substantiated with the following background information: The manual delineation of the gully-affected areas results in rather smooth polygon outlines (see, for example, Figure 6b) where there is no clear border between “gully-affected” and the surrounding area. This is especially the case where there is a transition zone from the local watershed to the gully thalweg, ranging from a “non-affected” area over sheet-wash erosion and, finally, increasingly larger erosion to the actual gully incision. As the parameters of the OBIA classification are optimized for detecting gully-affected areas with sharp edges at the pixel resolution of the QuickBird-2 satellite image, the classification results tend to draw the line within these transition zones between gully and the surrounding area closer to the gully, resulting in much more delicate and fragmented outlines.
The error of commission was also divided into two different types: Light red polygons are considered as limited error of commission in the case that they directly neighbor correctly classified green areas and exhibit similar spectral, textural and geomorphological properties compared with gullies. In the case of a slight distance between correctly classified areas, the evident existence of a very similar spectral, textural and geomorphological appearance to gullies had to be assured to also consider these segments as limited error of commission (light red polygons). Polygons that fulfill all of these criteria are bare soil, river banks, stream courses and recently ploughed agricultural areas.
Polygons were considered as true error of commission (dark red polygons), if they have a clear spatial distance to classified gully areas and do not contain similar geomorphological properties as gullies. These segments were entirely falsely classified. In the presented study, only very few segments were assigned to this dark red class (see Figure 5).
A main finding from this manual assessment is that the limited error of commission represents a percentage of 98% of the total over-classified area. This represents segments that may be considered as part of gully-affected areas due to their spectral, textural and geomorphological properties. In contrast to this, only the remaining share of 2% of the polygons were entirely falsely classified and therefore assigned as true error of commission.
The true error of omission represents a percentage of 77% of the total under-classified area. This represents segments that are part of gully-affected areas. The limited error of omission represents a percentage of 23% of the total under-classified area. These are segments that mainly contain areas of bare soil that often border the gully-affected areas.
Considering the limited error of commission (light red polygons) and the limited error of omission (light blue polygons), in addition to the correctly classified areas (green polygons that overlap with the reference data) leads to the finding that the developed classification approach may be considered as more robust for mapping gully-affected areas compared with the provided findings from only the conventional accuracy assessment. This is considered as an important outcome that strongly underlines the valuable contribution of this study to the field of landform mapping based on only optical satellite image data.
5. Discussion
The presented approach for the classification of gully-affected areas by applying OBIA to only an optical satellite image provides good results considering that no terrain data could be incorporated. The area-wide classification could be proven possible with the developed software-based approach. The presented approach contributes to landform mapping in many different cases and provides added value due to the following reasons: the chosen optical input data, QuickBird-2 satellite imagery, has been available for over ten years, and similar satellite images in terms of spatial and spectral resolution are available from other sensors (e.g., WorldView, GeoEye). In addition to distinct mapping approaches, this also enables the analysis of gully development, as sufficient data for different points in time is available. The spatial resolution of the input data includes two advantages: the detection of smaller landforms, such as gullies, is possible with software-based approaches, as is the simultaneous detection of landforms by a human image interpreter. The detail of the gully mapping is higher than in existing examples as presented by Vrieling et al. [23] and Johansen et al. [30]. The area-wide mapping approach that enables the analysis of the context of the respective landform is also assured by the chosen input data. The (spatial) context is especially important to the topic of land degradation, to which gully erosion as one specific type contributes [4].
In contrast to other approaches [36], the absence of terrain data is considered an advantage from the authors’ point of view, due to the fact that optical input data is more readily available for a broad range of users. Moreover, the rather dynamic geomorphology of gullies leads to a constant change of shape, extent and volume. Dendritic systems expand and develop towards a higher number of branches and much ramified sub-branches, leading to an areal expansion. Induced by ongoing erosional processes, the growing depth of gullies leads to an increase in volume. Predominantly, natural factors, such as rainfall and aeolian influences, are factors to be considered for gully growth. Apart from gully growth, there are also gully developments in the reverse direction, i.e., their areal extent and volume decreases mainly due to anthropogenic land levelling measures. Aside from these directly visible changes in gully characteristics, we also need to consider changes that are continuously taking place: very recently developed gullies often have sharp edges, which tend to be smoothed over time by fluvial and aeolian influences. Terrain data acquired at one certain point in time would enable precise detection of volume and spatial extent. However, the frequency of possible updates on the previous findings would be rather difficult, due to the availability of new input data. Hence, the presented use of only optical input data is considered more valuable for an area-wide approach.
The pan-sharpened input data used for the analysis of the presented work may contain some loss of spectral information, but still represents a good compromise between spectral information and spatial resolution that is required for the detection of gully-affected areas. Additionally, this pushed the development of a classification approach that is less dependent on spectral information and more focused on context. Witharana et al. [37] evaluated the impacts of data fusion, such as pan-sharpening. They pointed out that the influence of different pan-sharpening algorithms is of much less importance in object-based frameworks than in a pixel-based analysis, since most of the analyses are based on statistical values of groups of pixels. Based on these findings and our own experiences, the classification is not greatly influenced by differences in the pan-sharpening algorithms. The segmentation can be slightly influenced, but since in the presented approach a cyclic classification process/class modeling is applied, the objects are again merged (if needed) based on pre-classification, which will greatly reduce the dependence on the initial segmentation.
Although the initial segmentation already aims at producing optimal objects to classify the target objects, the concept of class modeling (see [38]) allows refinement of the classification in a cyclic approach. The detection of individual gullies in every detail is not possible with this approach due to the limitations given by the available spatial resolution of the QuickBird-2 satellite data. However, the area-wide detection of gully-affected areas was carried out with success in absence of terrain data.
For the area-wide extraction of landforms, as presented within this specific study for gullies, the aggregation of properties remains crucial. The identification of target object properties was achieved, which are virtually spatially independent and appear in optical input data. The main classification approaches are based on the sequence of light and shady areas: this represents the spectral configuration of gully-affected areas. The limiting aspects are the context, i.e., the surrounding environment from which the respective landform is extracted [4], as well as a scale level that is sufficient for the target landform (see [9]. The study area in this work is characterized by a very high heterogeneity in terms of different types of LC/LU, which makes the analysis very difficult.
The accuracy of the presented approach would not be assessed sufficiently with only a conventional accuracy assessment where the results from the classification were compared with a reference data set. In order to assess the quality of the developed approach, the results were checked with a conventional accuracy assessment approach against manually delineated reference data and with a manual assessment against the QuickBird-2 satellite image.
As the delineation of landforms is still not concretely defined amongst geomorphologists, the outlines of the reference data varies, depending on the expert who delineated the data. Several publications treat the aspect of assessing the accuracy of landform mapping approaches with more than one method in order to derive a more comprehensive estimation on the overall quality of the classification results [14,17,29,39].
The conventional accuracy assessment derived that 62% of the results overlap with the reference data and show a quite satisfying result if taking into consideration that no terrain data were incorporated into the classification process. The error of omission with a percentage of 38% is not yet optimal. However, the identification of gully-affected areas is only slightly influenced: most of the false negatives are segments of small spatial extent and directly neighbor correctly classified segments (true positives). The differentiation into a limited and a true error of omission with a percentage of 23% and 77%, respectively, confirms this finding: the general linear structures of gully-affected areas may be initially identified properly. This proves the satisfactory quality of the developed approach aiming at an initial extraction of gully-affected areas from larger regions. The light red polygons that constitute the limited error of commission often neighbor the gully-affected areas. These segments are classified due to underlying very similar spectral, textural and geomorphological properties, such as gullies.
To put it in a nutshell, the developed classification approach for an initial extraction of gully-affected areas from larger regions is more robust than estimated if only taking into account the results from the conventional accuracy assessment. It has to be considered that in the field of landform mapping, the sharp delineation of landform borders is often not feasible, and therefore, a combination of different methods to assess the quality of classification results is required.
The developed classification approach incorporates freely available vector data, and the basic concept of the developed rule-set mainly focuses on characteristics that are virtually spatially independent. Aiming at the initial area-wide mapping of gully-affected areas, this spatial independence of the defined rules is considered crucial for the future extension of the study area to be processed. In order to apply the rule-set on an extended study area, only minor adaptions to the threshold settings within the rule-set are expected to be necessary.
6. Conclusions
The need for area-wide landform mapping approaches, especially in terms of land degradation, can be ascribed to the fact that within area-wide landform mapping approaches, the (spatial) context of erosional landforms is considered by providing additional information on the physiography neighboring the distinct landform. The presented area-wide mapping approach of gully-affected areas by applying object-based image analysis (OIBA) was successfully carried out. The very heterogeneous region of Taroudannt, Morocco, was chosen as the study site. The solicited heterogeneity refers to the existing manifold types of land use and land cover that reflect the diversity and dynamics of this region and simultaneously addresses the high impact and susceptibility of existing agro-industrial areas and settlement areas to soil erosion.
The classification rule-set was developed with a clear focus on virtual spatial independence within the software environment of eCognition Developer. This allows the incorporation of knowledge about the target objects under investigation. Only optical QuickBird-2 satellite data and freely-available OpenStreetMap (OSM) vector data were used as input data. The OSM vector data were incorporated in order to mask out plantations and residential areas. Optical input data are more readily available for a broad range of users compared to terrain data, which is considered to be a major advantage.
The description of gullies and gully-affected areas in optical imagery is limited due to the lack of a third dimension in the input data. Thus, the definition of the classification rules within the cyclic OBIA approach is mainly based on edge detection and context characteristics of neighboring segments. The use of only optical satellite imagery and utilizing spatially independent characteristics within the classification rules maintains the possibility of transferring the classification approach with only minor adaptions. On the one hand, this may enable a temporal analysis of the same study area by using archive satellite scenes. On the other hand, a different study area may be chosen, as the classification approach is not locally dependent.
The accuracy was checked with a conventional approach against manually delineated reference data and a manual assessment against the QuickBird-2 satellite image. Sixty two percent of the results overlap with the reference data and show a quite satisfying result when taking into consideration that no terrain data was incorporated into the classification process. Additionally, a manual assessment of the classification results was carried out that confirmed the good quality of the developed approach: the differentiation into a limited type and a true type of both the error of omission (23%/77%) and the error of commission (98%/2%) revealed that the initial identification of gully-affected areas is feasible, as true classification errors are present, but do not fundamentally influence the results.
The difficulty in differentiating gully-affected areas from the very heterogeneous land cover and land use types appearing in the satellite image was overcome with satisfactory results. As the area-wide mapping was prioritized, a slightly lower value of accuracy does not overall correspond to the quality of the results.
The developed approach will be further improved with the aim of transferring it onto other study areas and onto satellite scenes from other dates, which would then lead to the assessment of the development of gully erosion over time in the study area.
Acknowledgments
This work was funded by the following grants, which are gratefully acknowledged: research project “AGASouss-Assessment of gully erosion in agro-industrial landscapes of the Souss Basin (Morocco)”, granted by the German Research Foundation (DFG) under research Contracts MA 2549/3 and Ri 835/5, and the Austrian Science Fund (FWF) through the Doctoral College GIScience under Grant DK W 1237-N23.
We acknowledge Clemens Eisank and Isabella Merschdorf for revising the paper. We would like to thank the four anonymous reviewers for their constructive comments and critiques, which improved the quality of this paper.
Author Contributions
Sebastian d’Oleire-Oltmanns developed the classification approach and wrote large parts of the article. Irene Marzolff contributed with her knowledge on the geomorphology of gullies, the linkage to remote sensing and contributed to the writing and the structure of the article. Dirk Tiede contributed with his knowledge on OBIA to the methodological part, the accuracy assessment and revised the respective parts of the article. Thomas Blaschke contributed with his knowledge on the development on OBIA and supported the main author in developing the general structure of the paper.
Conflicts of Interest
The authors declare no conflicts of interest.
References
- Aït Hssaïne, A. Le cadre physique de la Dépression du Souss et la dégradation de l’environment sédimentaire. In L’espace Rural dans le Souss: Héritage et Changements.; Bouchelkha, M., Ed.; Université Ibn Zohr, Faculté des lettres et des sciences humaines, Agadir, Groupe d’études et de recherches sur le sud marocain: Agadir, Maroc, 2002; pp. 22–27. [Google Scholar]
- Valentin, C.; Poesen, J.; Li, Y. Gully erosion: Impacts, factors and control. CATENA 2005, 63, 132–153. [Google Scholar]
- Peter, K.D.; d’Oleire-Oltmanns, S.; Ries, J.B.; Marzolff, I.; Ait Hssaine, A. Soil erosion in gully catchments affected by land-levelling measures in the Souss Basin, Morocco, analysed by rainfall simulation and UAV remote sensing data. CATENA 2014, 113, 24–40. [Google Scholar]
- Warren, A. Land degradation is contextual. L. Degrad. Dev 2002, 13, 449–459. [Google Scholar]
- Evans, D.J. Glacial landsystems of Satujökull, Iceland: A modern analogue for glacial landsystem overprinting by mountain icecaps. Geomorphology 2011, 129, 225–237. [Google Scholar]
- Schmidt, J.; Andrew, R. Multi-scale landform characterization. Area 2005, 37, 341–350. [Google Scholar]
- Minár, J.; Evans, I.S. Elementary forms for land surface segmentation: The theoretical basis of terrain analysis and geomorphological mapping. Geomorphology 2008, 95, 236–259. [Google Scholar]
- Smith, B.; Mark, D.M. Do mountains exist ? Towards an ontology of landforms. Environ. Plan. B 2003, 30, 1–22. [Google Scholar]
- Gustavsson, M.; Kolstrup, E. New geomorphological mapping system used at different scales in a Swedish glaciated area. Geomorphology 2009, 110, 37–44. [Google Scholar]
- Corbane, C.; Raclot, D.; Jacob, F.; Albergel, J.; Andrieux, P. Remote sensing of soil surface characteristics from a multiscale classification approach. CATENA 2008, 75, 308–318. [Google Scholar]
- Hiller, J.K.; Smith, M. Residual relief separation: Digital elevation model enhancement for geomorphological mapping. Earth Surf. Process. Landf 2008, 33, 2266–2276. [Google Scholar]
- Drăgut, L.; Eisank, C. Automated object-based classification of topography from SRTM data. Geomorphology 2012, 142, 21–33. [Google Scholar]
- Lane, S.N.; James, T.D.; Crowell, M.D. Application of digital photogrammetry to complex topography for geomorphological research. Photogramm. Rec 2000, 16, 793–821. [Google Scholar]
- D’Oleire-Oltmanns, S.; Eisank, C.; Drăgut, L.; Blaschke, T. An object-based workflow to extract landforms at multiple scales from two distinct data types. IEEE Geosci. Remote Sens. Lett 2013, 10, 947–951. [Google Scholar]
- Evans, I.S. Geomorphometry and landform mapping: What is a landform? Geomorphology 2011, 137, 94–106. [Google Scholar]
- Verstappen, H.T. Old and new trends in geomorphological and landform mapping. In Geomorphological Mappong Methods and Application, 1st ed.; Smith, M., Paron, P., Griffiths, J., Eds.; Elsevier: Amsterdam, The Netherlands, 2011; Chapter 2; p. 635. [Google Scholar]
- Eisank, C.; Smith, M.; Hillier, J. Assessment of multiresolution segmentation for delimiting drumlins in digital elevation models. Geomorphology 2014. [Google Scholar]
- Poesen, J.; Nachtergaele, J.; Verstraeten, G.; Valentin, C. Gully erosion and environmental change: Importance and research needs. CATENA 2003, 50, 91–133. [Google Scholar]
- Giménez, R.; Marzolff, I.; Campo, M.A.; Seeger, M.; Ries, J.B.; Casalí, J.; Álvarez Mozos, J. Accuracy of high-resolution photogrammetric measurements of gullies with contrasting morphology. Earth Surf. Process. Landf 2009, 34, 1915–1926. [Google Scholar]
- D’Oleire-Oltmanns, S.; Marzolff, I.; Peter, K.; Ries, J. Unmanned Aerial Vehicle (UAV) for monitoring soil erosion in Morocco. Remote Sens 2012, 4, 3390–3416. [Google Scholar]
- Fadul, H.M.; Salih, A.A.; Ali, I.A.; Inanaga, S. Use of remote sensing to map gully erosion along the Atbara River, Sudan. Int. J. Appl. Earth Obs. Geoinf 1999, 1, 175–180. [Google Scholar]
- Daba, S.; Rieger, W.; Strauss, P. Assessment of gully erosion in eastern Ethiopia using photogrammetric techniques. Image Process 2003, 50, 273–291. [Google Scholar]
- Vrieling, A.; Rodrigues, S.C.; Bartholomeus, H.; Sterk, G. Automatic identification of erosion gullies with ASTER imagery in the Brazilian Cerrados. Int. J. Remote Sens 2007, 28, 2723–2738. [Google Scholar]
- Knight, J.; Spencer, J.; Brooks, A.; Phinn, S. Large-area, high-resolution remote sensing based mapping of alluvial gully erosion in Australia’s tropical rivers. In Proceedings of the 5th Australian Stream Management Conference. Australian Rivers: Making a Difference, Charles Sturt University, Thurgoona, NSW, Australia, 21–25 May 2007; 2, pp. 199–204.
- Mararakanye, N.; Le Roux, J.J. Gully location mapping at a national scale for South Africa. S. Afr. Geogr. J 2012, 94, 208–218. [Google Scholar]
- Pike, R.J. Geomorphometry-diversity in quantitative surface analysis. Prog. Phys. Geogr 2000, 24, 1–20. [Google Scholar]
- Martínez-Casasnovas, J. A spatial information technology approach for the mapping and quantification of gully erosion. CATENA 2003, 50, 293–308. [Google Scholar]
- Shruthi, R.B.; Kerle, N.; Jetten, V. Object-based gully feature extraction using high spatial resolution imagery. Geomorphology 2011, 134, 260–268. [Google Scholar]
- Höfle, B.; Griesbaum, L.; Forbriger, M. GIS-based detection of gullies in Terrestrial LiDAR data of the Cerro Llamoca Peatland (Peru). Remote Sens 2013, 5, 5851–5870. [Google Scholar]
- Johansen, K.; Taihei, S.; Tindall, D.; Phinn, S. Object-based monitoring of gully extent and volume in north Australia using LiDAR data. In Proceedings of the 4th GEOBIA, Rio de Janeiro, Brazil, 7–9 May 2012; I, pp. 168–173.
- Blaschke, T. Object based image analysis for remote sensing. ISPRS J. Photogramm. Remote Sens 2010, 65, 2–16. [Google Scholar]
- Blaschke, T.; Hay, G.J.; Kelly, M.; Lang, S.; Hofmann, P.; Addink, E.; Queiroz Feitosa, R.; van der Meer, F.; van der Werff, H.; van Coillie, F.; et al. Geographic object-based image analysis—Towards a new paradigm. ISPRS J. Photogramm. Remote Sens 2014, 87, 180–191. [Google Scholar]
- van der Werff, H.; van der Meer, F. Shape-based classification of spectrally identical objects. ISPRS J. Photogramm. Remote Sens 2008, 63, 251–258. [Google Scholar]
- Baatz, M.; Schäpe, A. Multiresolution segmentation—An optimization approach for high quality multi-scale image segmentation. In Angewandte Geographische Informationsverarbeitung; Strobl, J., Blaschke, T., Griesebner, G., Eds.; Wichmann-Verlag: Heidelberg, Germany, 2000; pp. 12–23. [Google Scholar]
- Congalton, R.; Green, K. Assessing the Accuracy of Remotely Sensed Data: Principles and Practices, 2nd ed.; CRC Press: Boca Raton, FL, USA, 2008; p. 183. [Google Scholar]
- Shruthi, R.B.; Kerle, N.; Jetten, V.; Abdellah, L.; Machmach, I. Quantifying temporal changes in gully erosion areas with object oriented analysis. CATENA 2014. [Google Scholar] [CrossRef]
- Witharana, C.; Civco, D.L.; Meyer, T.H. Evaluation of data fusion and image segmentation in earth observation based rapid mapping workflows. ISPRS J. Photogramm. Remote Sens 2014, 87, 1–18. [Google Scholar]
- Tiede, D.; Lang, S.; Albrecht, F.; Hölbling, D. Object-based class modeling for cadastre-constrained delineation of geo-objects. Photogramm. Eng. Remote Sens 2010, 76, 193–202. [Google Scholar]
- Eisank, C. An Object-Based Workflow For Integrating Spatial Scale and Semantics To Derive Landforms From Digital Elevation Models. Ph.D. Thesis, University of Salzburg, Salzburg, Austria,. 2013. [Google Scholar]


| Name of Level | Scale | Shape | Compactness | Additional Layers |
|---|---|---|---|---|
| Level 1 | 300 | 0.2 | 0.8 | NDVI, OSM data |
| Level 2 | 100 | 0.3 | 0.7 | NDVI |
| Level 3 | 100 | 0.3 | 0.7 | – |
| Layer | Area (m2) | Color |
|---|---|---|
| Percentage | % | Figures 5 & 6 |
| Total gully-affected area (reference data) | 3,372,145 | - |
| Total gully-affected area (OBIA classification) | 2,636,150 | - |
| Accordance reference data & OBIA classification | 2,088,410 | green |
| Overall classification accuracy (true positives) | 62% | |
| False negatives | 1,245,782 | light & dark blue |
| Error of omission | 38% | |
| False positives | 547,743 | light & dark red |
| Error of commission | 16% |
© 2014 by the authors; licensee MDPI, Basel, Switzerland This article is an open access article distributed under the terms and conditions of the Creative Commons Attribution license (http://creativecommons.org/licenses/by/3.0/).
Share and Cite
D'Oleire-Oltmanns, S.; Marzolff, I.; Tiede, D.; Blaschke, T. Detection of Gully-Affected Areas by Applying Object-Based Image Analysis (OBIA) in the Region of Taroudannt, Morocco. Remote Sens. 2014, 6, 8287-8309. https://doi.org/10.3390/rs6098287
D'Oleire-Oltmanns S, Marzolff I, Tiede D, Blaschke T. Detection of Gully-Affected Areas by Applying Object-Based Image Analysis (OBIA) in the Region of Taroudannt, Morocco. Remote Sensing. 2014; 6(9):8287-8309. https://doi.org/10.3390/rs6098287
Chicago/Turabian StyleD'Oleire-Oltmanns, Sebastian, Irene Marzolff, Dirk Tiede, and Thomas Blaschke. 2014. "Detection of Gully-Affected Areas by Applying Object-Based Image Analysis (OBIA) in the Region of Taroudannt, Morocco" Remote Sensing 6, no. 9: 8287-8309. https://doi.org/10.3390/rs6098287