Successful Applications of Geotechnologies for the Evaluation of Road Infrastructures


Abstract
: This work reports the results obtained over several years of research into the application of different geomatic techniques in the field of civil engineering and, in particular, in their application to the management of road systems and associated structures. Among the main advances obtained are the quantification of parameters during the inventorying and inspection of infrastructures, the metric quality of the results and the development of hardware and software tools for the automation of road systems management.1. Introduction
The infrastructure of a country plays a crucial role in the national economy. Conservation of such systems is key to improving a country’s economic strength. Transport systems are the most intensely demanded infrastructures, and investments in road networks usually represent the highest percentage of all investments in transport. For example, 5317 million euros were invested in Spain in 2012, which represents 45.2% of the total investment in transport infrastructure [1]. The overall set of communications networks in developed countries is huge, and in Europe, in recent years, Spain has been outstanding, with more than 165,000 km of roads, which represents 3% [1]. Thus, in view of the costs of constructing new transport systems, the maintenance of extant systems should be a strategic objective. In this sense, roads and associated structures require conservation and maintenance, and these must be guaranteed in order to optimize economic resources and to maintain a productive economy for a country. Furthermore, within a scenario such as the present one, scourged by a lack of economic resources, it is crucial to prioritize investments, making use of mechanisms that will help to make decisions based on objective facts about resource allocation. Aspects, such as the exploitation and safety of road networks, are now hot-spots in current Spanish society, where traffic accidents are one of the major problems facing the various administrations. For instance, 89,519 accidents happened in Spain in 2013, 10% being due to a lack of conservation of infrastructure [2]. Current inspection systems are mainly based on reports drafted by technicians, who base their findings on the visual inspection of the infrastructures (experience); although the degree of technical know-how of these individuals is considerable, in most cases, the reports consist merely of the acquisition of digital images and georeferencing of the data gathered during visits. The use of these traditional procedures contrasts with the need to have objective, quantifiable data that will allow the best decisions to be made and the actions proposed to be prioritized. In [3], we can find a highway research program report developed in the USA that is focused on the use of advanced geospatial data, technologies, tools and information in the department of transportation projects. The key objectives were to summarize and document the current state of the practice through detailed online questionnaires and literature reviews. Interesting conclusions have been obtained, such as that nearly 85% of the departments of transportation (DOTs) surveyed seems to regularly use geospatial technologies, with more than 50% indicating that they are proactive in researching new technologies. Almost two-thirds of the DOTs stated that most divisions had integrated advanced geospatial technologies into their daily workflows. The top three barriers to technology adoption are cost, inertia and technical expertise. The technologies most frequently used by DOTs are global positioning systems (GPS), geographical information systems (GIS) and video logging. However, newer technologies, such as cloud computing, machine control, electromagnetic imaging, unmanned airborne vehicles (UAVs) and interferometric synthetic aperture radar (inSAR/ifSAR), are not yet well integrated. On the other hand, the DOTs are experiencing a paradigm shift in their geospatial workflows as the technology moves from two-dimensional (2D) to three-dimensional (3D).
In recent years, geomatic methods have undergone an important series of developments. Currently, some technologies have now reached maturity in other engineering applications (3D laser scanning, thermography, ground penetrating radar, etc.), whose adaptation to the 3D cartography of roads has been an important challenge. In this sense, the investigation reported here does not only address the adaptation of geotechnologies to this field, but also pursues the exploitation of the data acquired and their usefulness in tasks involving geometric inventorying, the inspection of wear (fissures, leakages, cracks, etc.) and damage assessment, as well as their incorporation into more advanced procedures, such as the structural assessment of infrastructures associated with road networks.
Here, we offer a compendium of the work carried out between 2006 until the present. The analysis focuses on the application of geomatic methods (photogrammetry, laser scanning and the integration of both) in the field of structures. The work summarized here includes the definition of sensors and the acquisition of data, together with the development of informatics applications that, on the one hand, allow the information provided by geometric sensors to be consulted and interpreted and, on the other, input these into the databases stipulated by Spanish legislation for the geometric inventorying of roads and associated infrastructures and as guidelines for damage assessment.
2. Materials
The materials used to digitize infrastructures in 3D comprised conventional topographic instrumentation (as a method for validating the results) and the basic instruments to obtain a geometric and radiometric reconstruction of objects: photographic cameras for the case of photogrammetric methods and a laser scanner for the case of laser scanning approaches. Different tools were used as auxiliary supports in the various experiments carried out.
2.1. Photographic Cameras
With a view toward facilitating the use of geomatic methods in the work involving the inspection and assessment of infrastructures, one important aspect to be taken into account is the simplicity of the devices to be used, which must, at the same time, ensure the quality of the documents generated. Thus, the photogrammetric methods developed here were based on simple methodologies for data acquisition that would not require advanced knowledge of geomatic methods. In this sense, different single-lens reflex (SLR) cameras with fixed-focus lenses were used, depending on the requirement of the work to be undertaken.
Geometric Calibration of the Cameras
To exploit the photographic data correctly, and hence, generate geometric models with precision, it is necessary to reconstruct the mathematical model of the generation of the image in the camera. This process is known as internal orientation of the photogrammetric process and is achieved by a process of camera calibration at the laboratory with fixed acquisition parameters before data are collected in the field. To calibrate the camera, different commercial software packages were employed, among them the calibration module of Photomodeler Pro™ and the AICON 3D system photogrammetric restitution platform. The calibration procedure was accomplished using standards with markers of known position, which enabled the problems (principal distance, position of principal point of the image and distortions of the lens) to be solved simply. The internal orientation parameters obtained for the various cameras used can be consulted in [4].
Considering the distances involved in this work and the pixel size of the sensors, it was possible to attain spatial resolutions at the sub-centimeter level, which makes the technique highly appropriate for acquiring the geometry of linear structures.
2.2. Laser Scanning Systems: Terrestrial and Mobile
2.2.1. Static Laser Scanning System (TLS) (Riegl LMS Z390i)
In the cases addressed here, we used a time of flight (ToF) scanning device from Riegl, model LMS-Z390i [5]. The measurement window ranged between 1.5 m and 400 m, with a nominal error in distance measuring of 6 mm at 55 m under normal conditions of lighting and reflectivity. This device used an infra-red laser with a wavelength of 1.54 μm. The spherical field of vision encompassed 80° on the vertical plane and 360° on the horizontal one. The maximum scanning resolution was 0.002°, with a divergence of the laser of 0.3 mrad, and the point acquisition ratio was 11,000 points per second. The radiometric resolution of the intensity attribute was 8 bits.
2.2.2. Mobile Scanning System (MLS) (Lynx Mobile Mapper)
The mobile system used was a Lynx Mobile Mapper, manufactured by Optech Inc. [6]. The Lynx system comprises two LiDAR sensor heads with a nominal error of 8 mm that form a 90° angle between their respective rotation axes and 45° with respect to the trajectory of the vehicle, optimizing the avoidance of occlusions. The acquisition range of this system reaches 500,000 points per second, with a field of view on the scanning plane of 360° (each sensor head). The navigation system used was an LV 520 from Applanix that integrates an inertial measurement unit with an azimuth determination system comprising two antennas (GAMS), with an angular resolution of 0.015° and 0.005° in roll and pitch, together with a positioning precision of 0.02 m on XY and 0.05 m on Z. All of these values were obtained after post-processing differential correction using GPS bases [7]. The Optech LiDAR devices provided up to four echoes per pulse, with their respective attributes of radiometric resolution intensity of 12 bits.
3. Methodologies
3.1. Photogrammetric Methods: 3D and 2D Geometric Reconstruction
In this work, we used different approaches for the metric documentation of infrastructures associated with roads from photographic images. Two basic methodologies can be defined, one of them oriented towards obtaining flat metric documents (that is, in two dimensions) and the other focused on the generation of three-dimensional models of objects.
3.1.1. 2D Photogrammetric Modeling
The method chosen to acquire 2D metrics was governed by the need to have a low-cost method that would guarantee reliable metric results when using simple documentation operations. To accomplish this, we used a method based on photogrammetric rectification, by means of which the geometry of the center of perspective of the images captured is transformed into a Euclidean projection, allowing metric measurements to be performed on a plane [8].
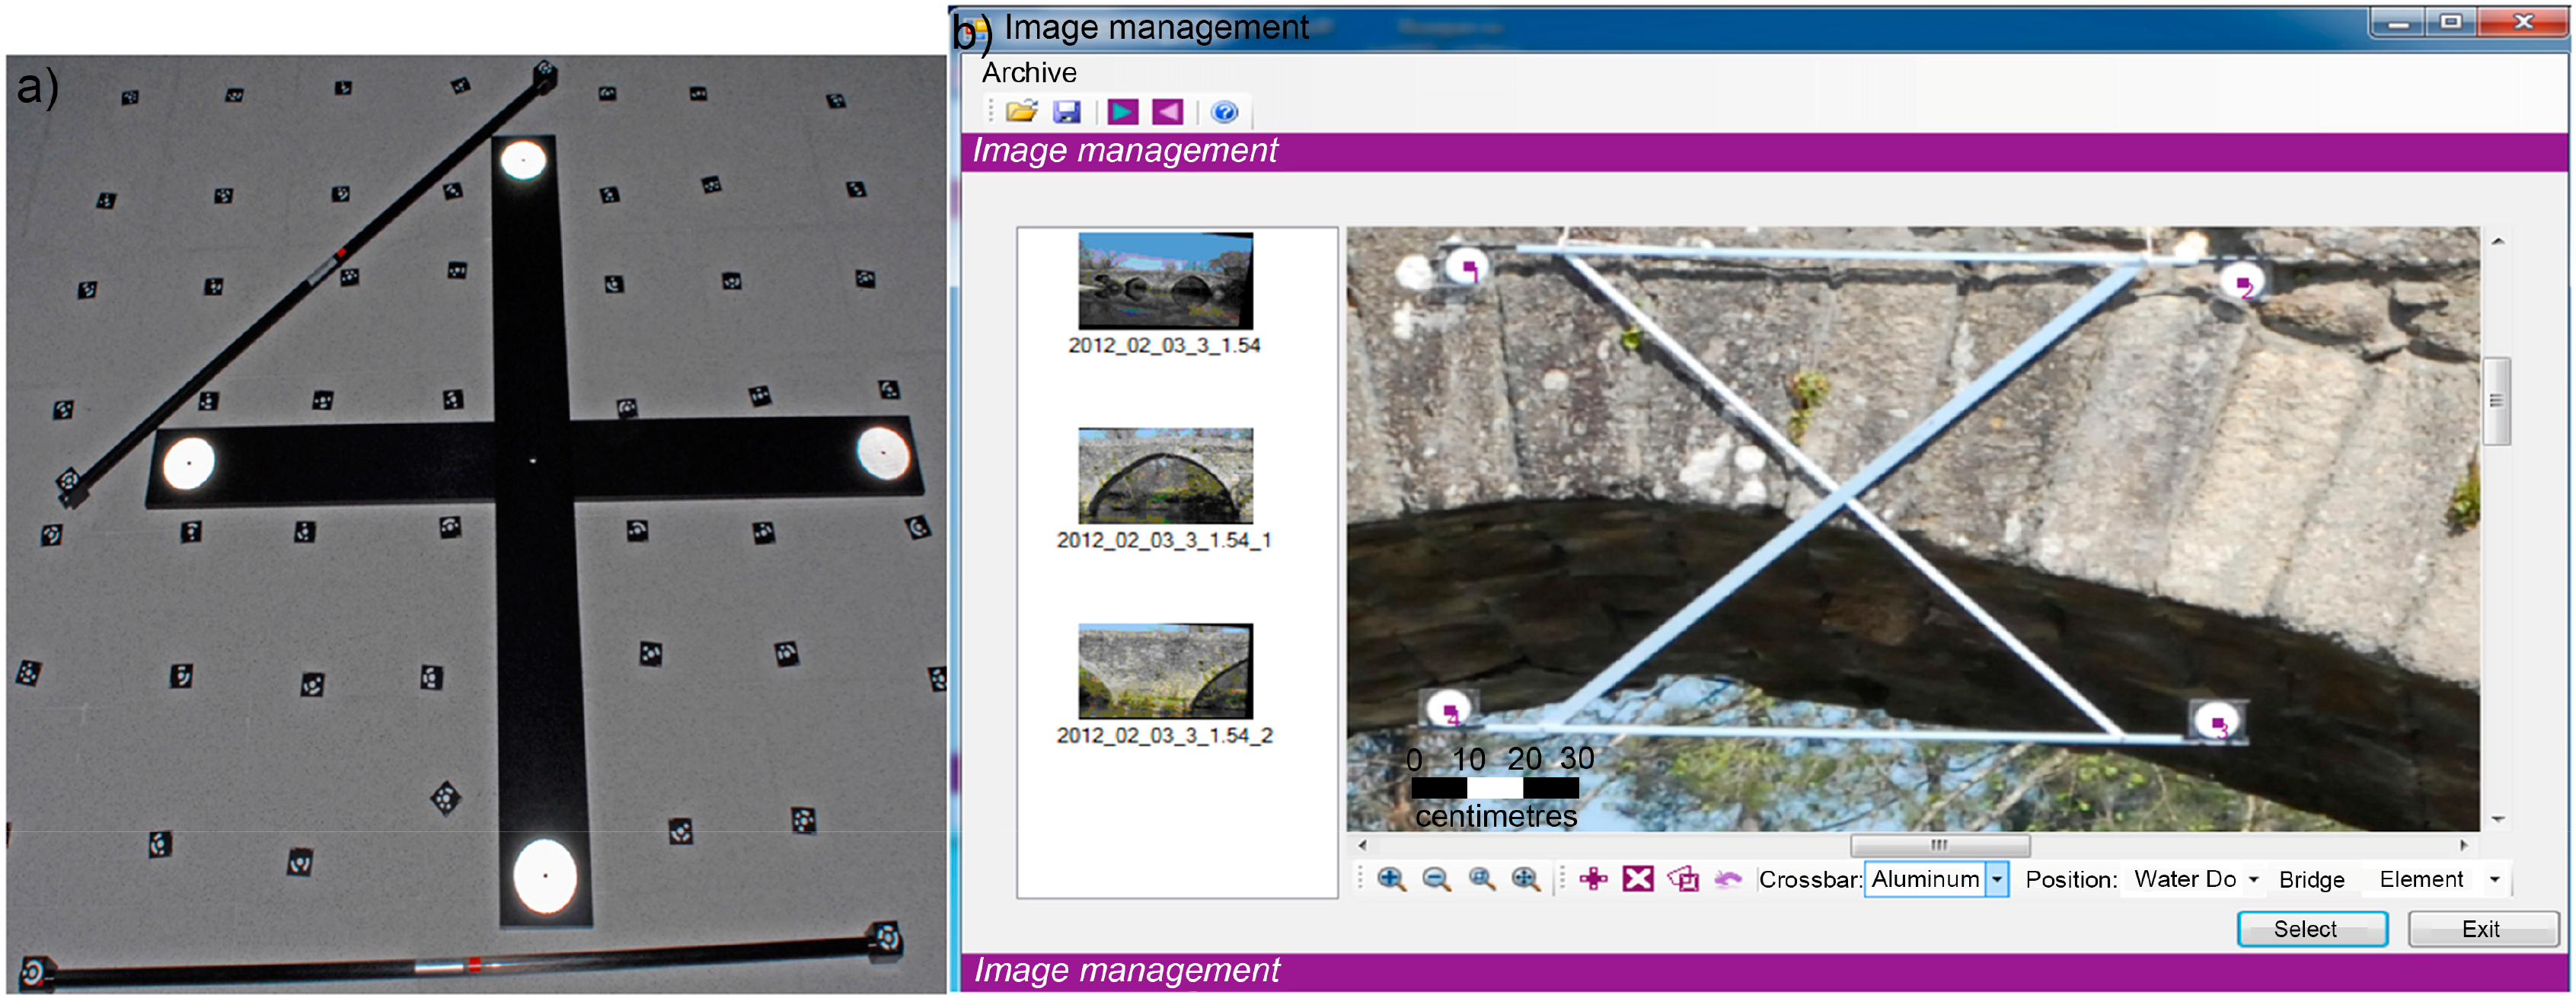
To achieve this transformation, it is necessary to know the coordinates of at least four unaligned control points located on the same plane (which defines the projection plane). To apply this method to the documentation of infrastructures, such as the spandrel walls and abutments of bridges, surfaces and pavements, etc., auxiliary support tools were developed for control points, whose relative position was known after calibration at the laboratory. The next figure (Figure 1a) shows an example of a crossbar developed during the calibration in the laboratory and during data acquisition in the field on a stone-block bridge arch (Figure 1b).
3.1.2. Acquisition of Images
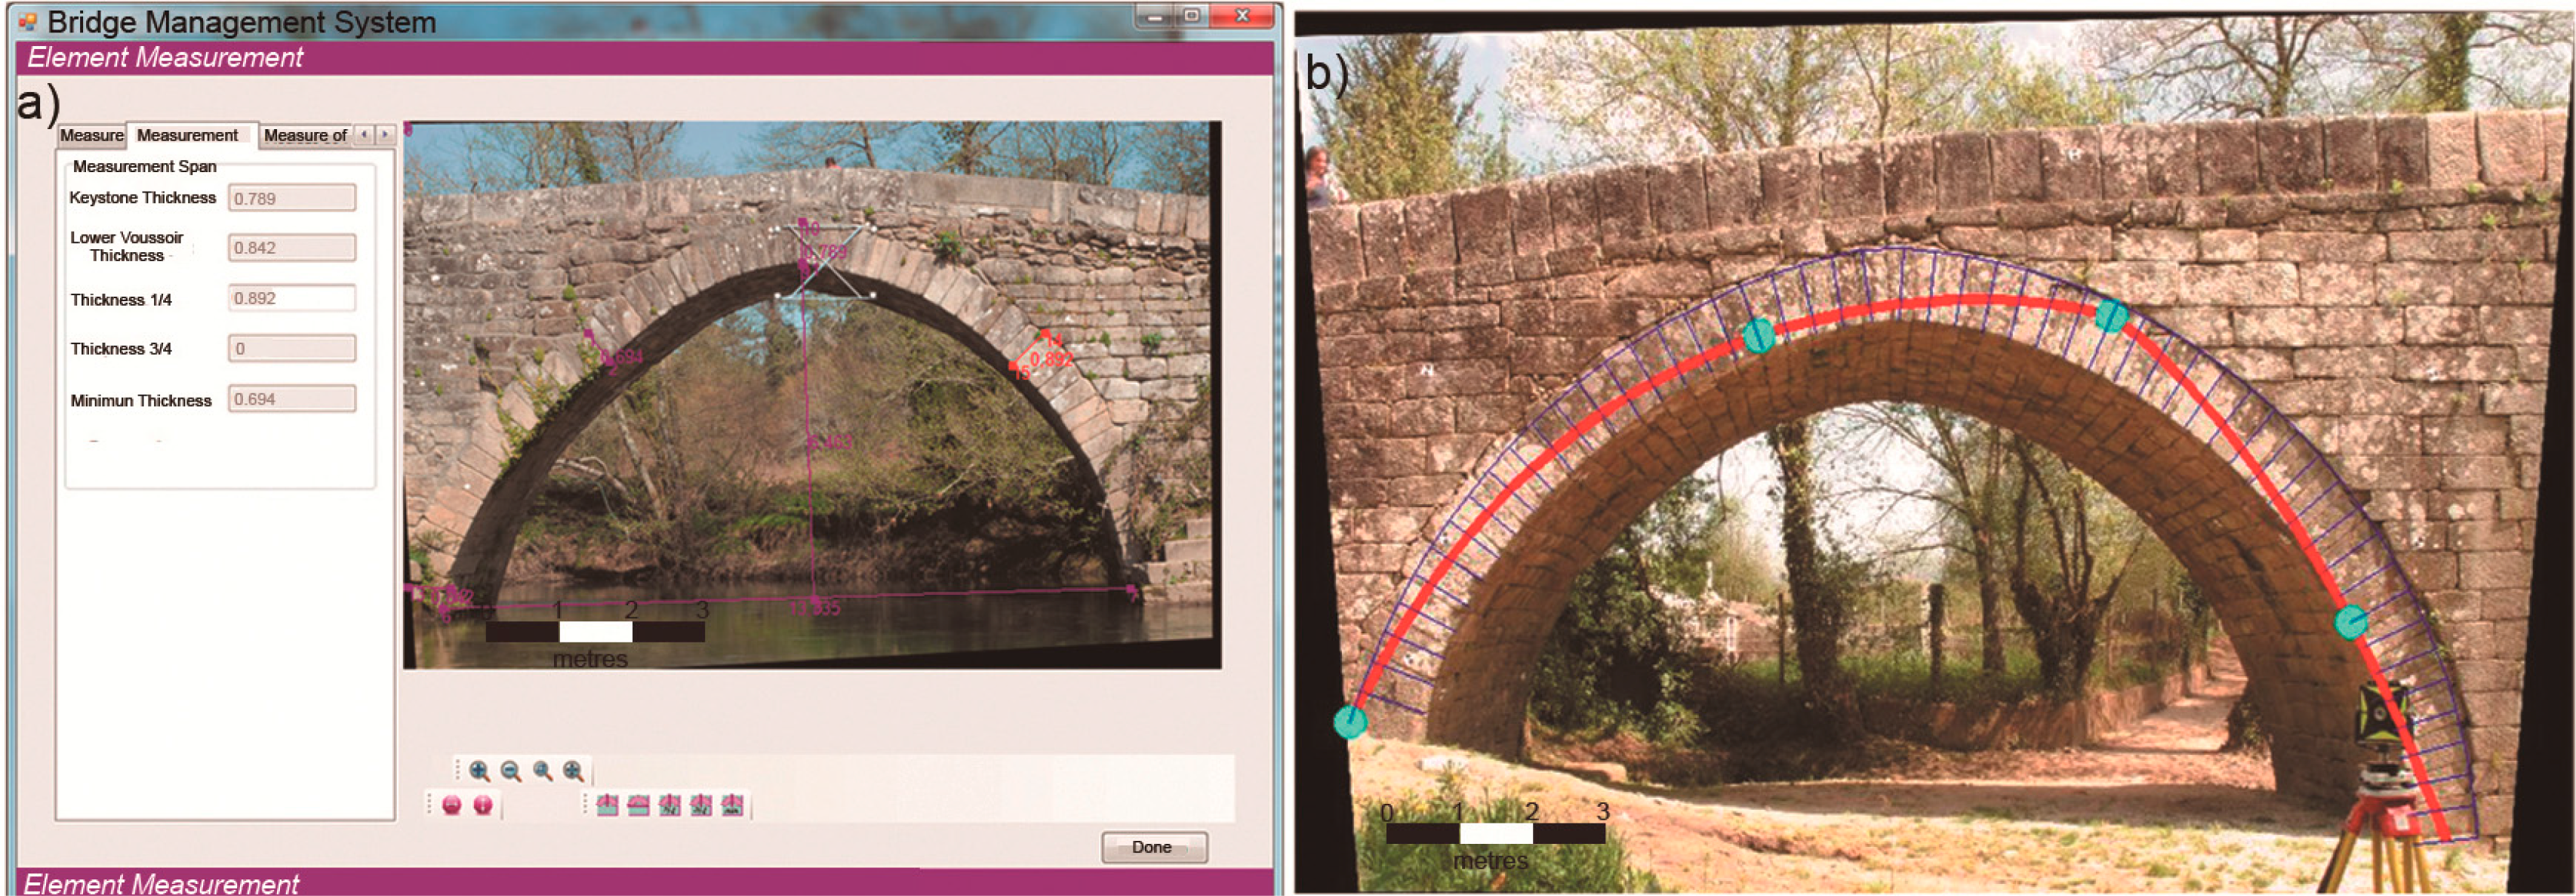
The methodology used for data acquisition consisted simply of taking photographs with calibrated cameras or even with conventional cameras without needing to calibrate the camera beforehand. Once the control points in the images had been identified and the photogrammetric algorithms had been implemented, it was possible to obtain the metric properties on the principal rectification plane. Since we were dealing with images, it was not only possible to extract certain specific measurements of the structures or their wear (fissures, leaks, etc.), but also to perform a precise demarcation of the damage or characteristics of the structural element (cracks, displaced elements, loss of material, surface wear, etc.). The next figure (Figure 2) shows the demarcation of a rectified image corresponding to the stone arch after this methodology had been implemented using software designed for the in situ inspection and structural assessment of stone arches. This software incorporates a database for geometric inventorying according to the guidelines of geometric inventorying [9] and basic inspection of passage works [10].
Finally, knowledge of the geometry of the arch, at the barrel ends, of these structures allows the information to be exploited during the process of structural assessment according to the theory of limit analysis, as reported in the Results section.
3.1.3. 3D Photogrammetric Modeling
The second strategy of photogrammetric reconstruction was based on the principles of convergent multi-station photogrammetry. This strategy allows the reconstruction of 3D objects with great precision, using bundle bock adjustment. During the process, the calculation of the coordinates of all of the points is done simultaneously, using an iterative process based on least-squares fitting, so that the errors in the calculation of the 3D position of the points of interest can be minimized.
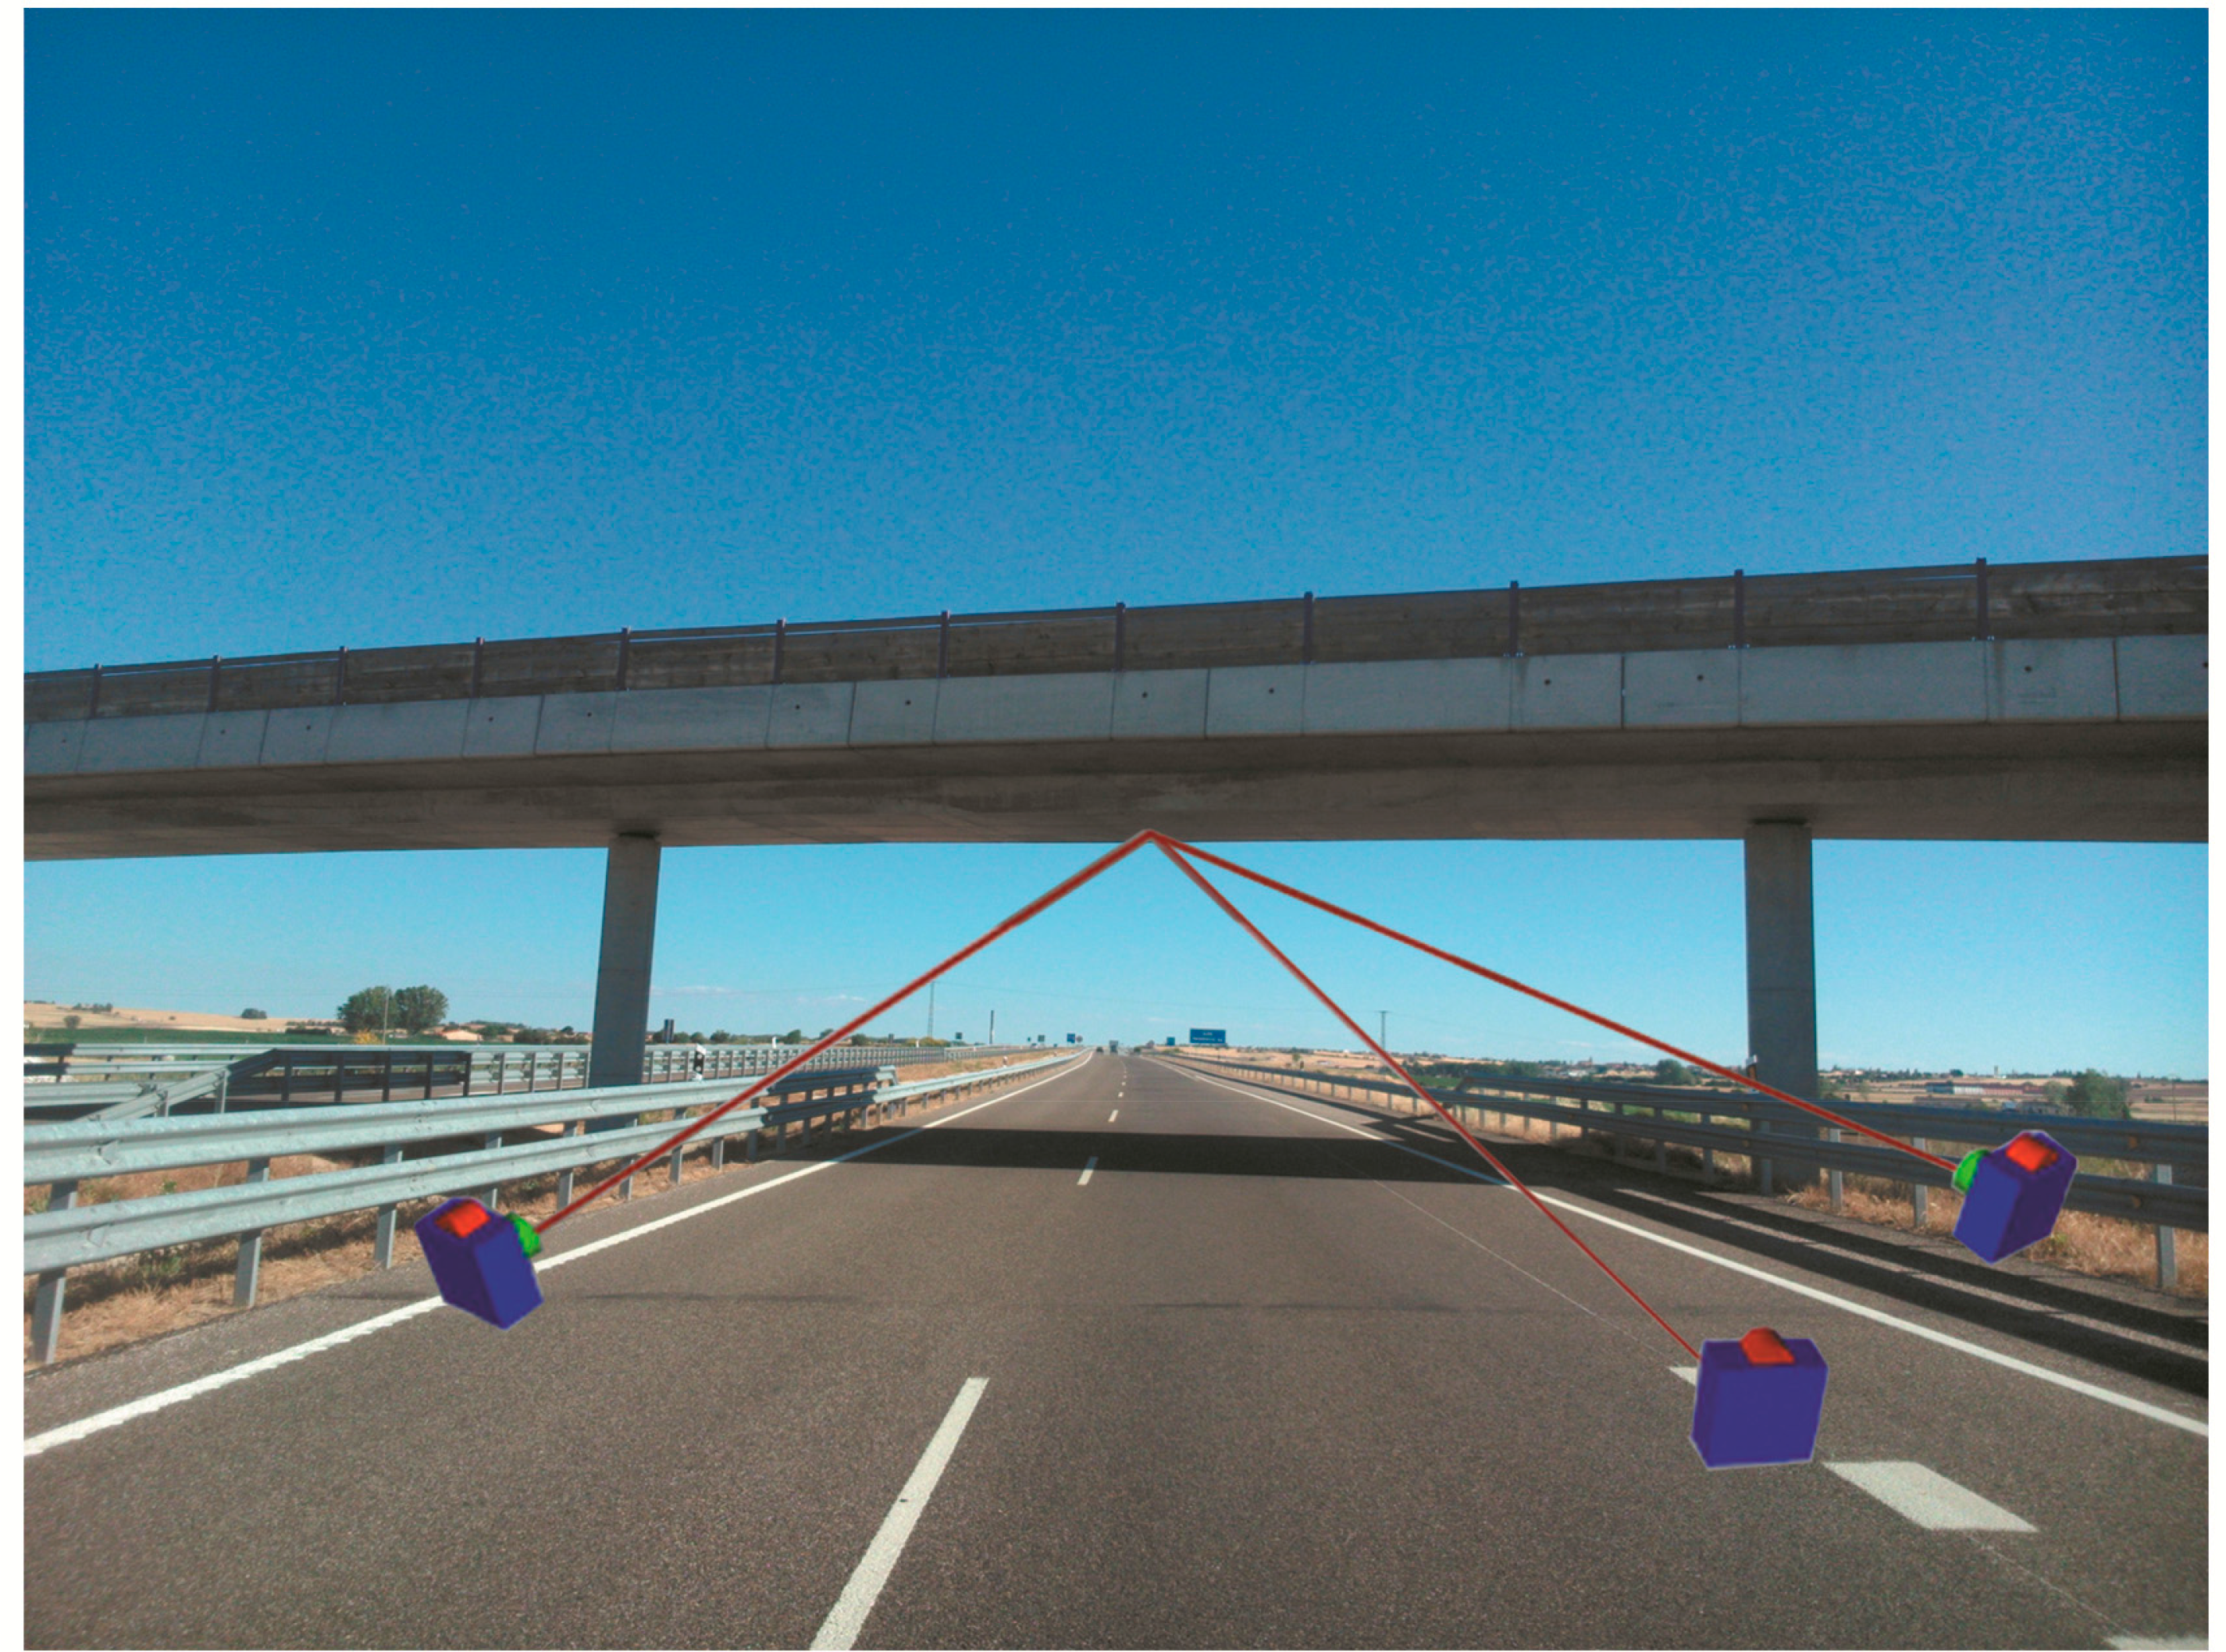
When using convergent photogrammetry, it is crucial to ensure the correct design of the station network. In this sense, it is necessary to seek optimum convergence angles of 90° between cameras. This angle is defined as the smallest angle formed by the straight lines defined by the principal distance of the camera at each station. It is also necessary to maintain overlaps above 60% between photographs in order to guarantee the generation of a precise model. The following figure (Figure 3) shows an optimum configuration for cameras during the inspection of vertical clearance of bridges on a highway.
It is also necessary to count reference points on the object in order to endow the 3D model generated with scale. To accomplish this, it is usual to take control points using topographic instruments, such as total stations when accurate models and quality control of the measurements are required, or more portable instruments, such as scale bars, when the priority is freedom of movement and portability during data acquisition, as happens in inventory or damage assessment campaigns.
The 3D coordinates of the points identified in the images are usually computed simultaneously to the relative orientation of the cameras, and this is done by identifying a minimum of six points on overlapping images and using least-squares fitting [11]. To obtain a dense point cloud that will allow the contours of interest to be delimited, massive restitution is performed (manually or automatically). This merely consists of finding the intersection of the laser beams (spatial intersection).
3.2. Laser Scanning of Roads and Associated Infrastructures
As detailed in the Introduction, the process of generating 3D point clouds differs between static and mobile systems. This makes it necessary to perform a pre-processing of the different types of information, and hence, very different methodologies are used during data acquisition in the field.
3.2.1. Terrestrial Laser Scanning
Laser scanning is appropriate when the aim is to document objects or specific structures in detail. This is the case of bridges, walls, deterioration on certain stretches of roads, etc.
When the objective is to carry out an investigation using this technique, the planning and optimization of the station network with the instrument become paramount, since it is necessary to acquire the important details of the structure, and at the same time, to ensure that all of the point clouds acquired from the different points of view can be recorded later in the same coordinate system.
The data acquisition phase, or scanning of the study object, is usually divided into two steps: a preliminary low-resolution scan (low point cloud density) is performed to determine the geometry of all of the surroundings of the scanner and to locate the linking points between the different stations (or control points when their absolute position is known). Following this, a detailed scan is performed on the area of interest, allowing the object or damage to be modeled in detail.
Finally, to obtain radiometric information about the surfaces of objects, as well as intensity data, it is customary to take photographic images, which, after the inner and exterior orientation parameters have been determined, can be used to texturize the point clouds collected by the scanner.
Once the field work has been completed, it is necessary to define the coordinate reference system (CRS) and then record it, either by linking points when common points have been taken between stations or by making use of the geometry itself of the object to achieve the assembly of the global point cloud.
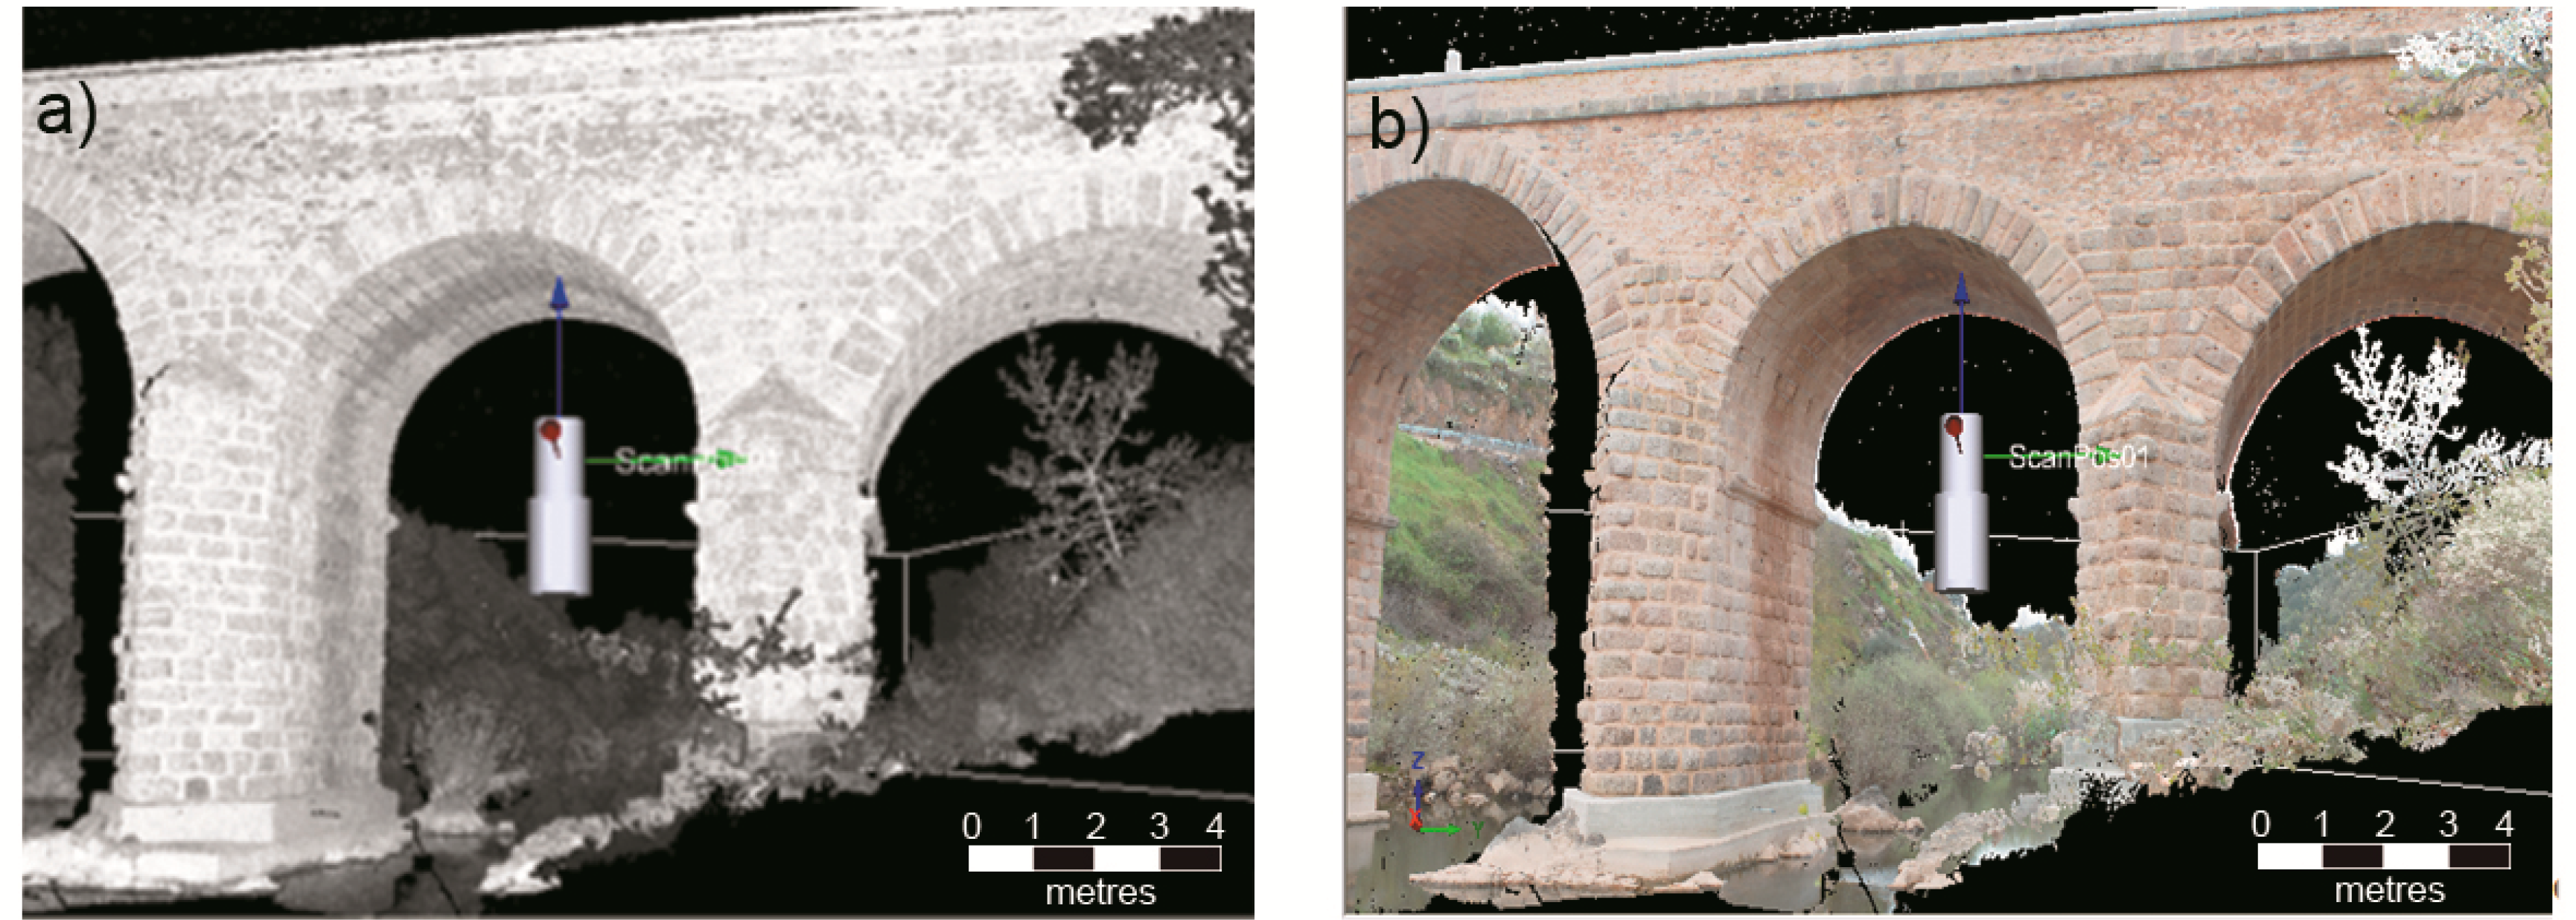
Once the point cloud that defines the 3D reality has been created, different filters are used to homogenize its density, remove undesired points in the modeling and delete redundant information that would only distort the final model. This process is performed using the software Riscan Pro©, from the laser company, Riegl. The next figure (Figure 4) shows a view of the point cloud of the Segura Roman Bridge, on the international highway from Castelo Branco (Portugal) to Cáceres (Spain), using two different visualizations: the first using only the intensity data recorded for each point (Figure 4a) and the second incorporating RGB information after orienting the photographic images (Figure 4b).
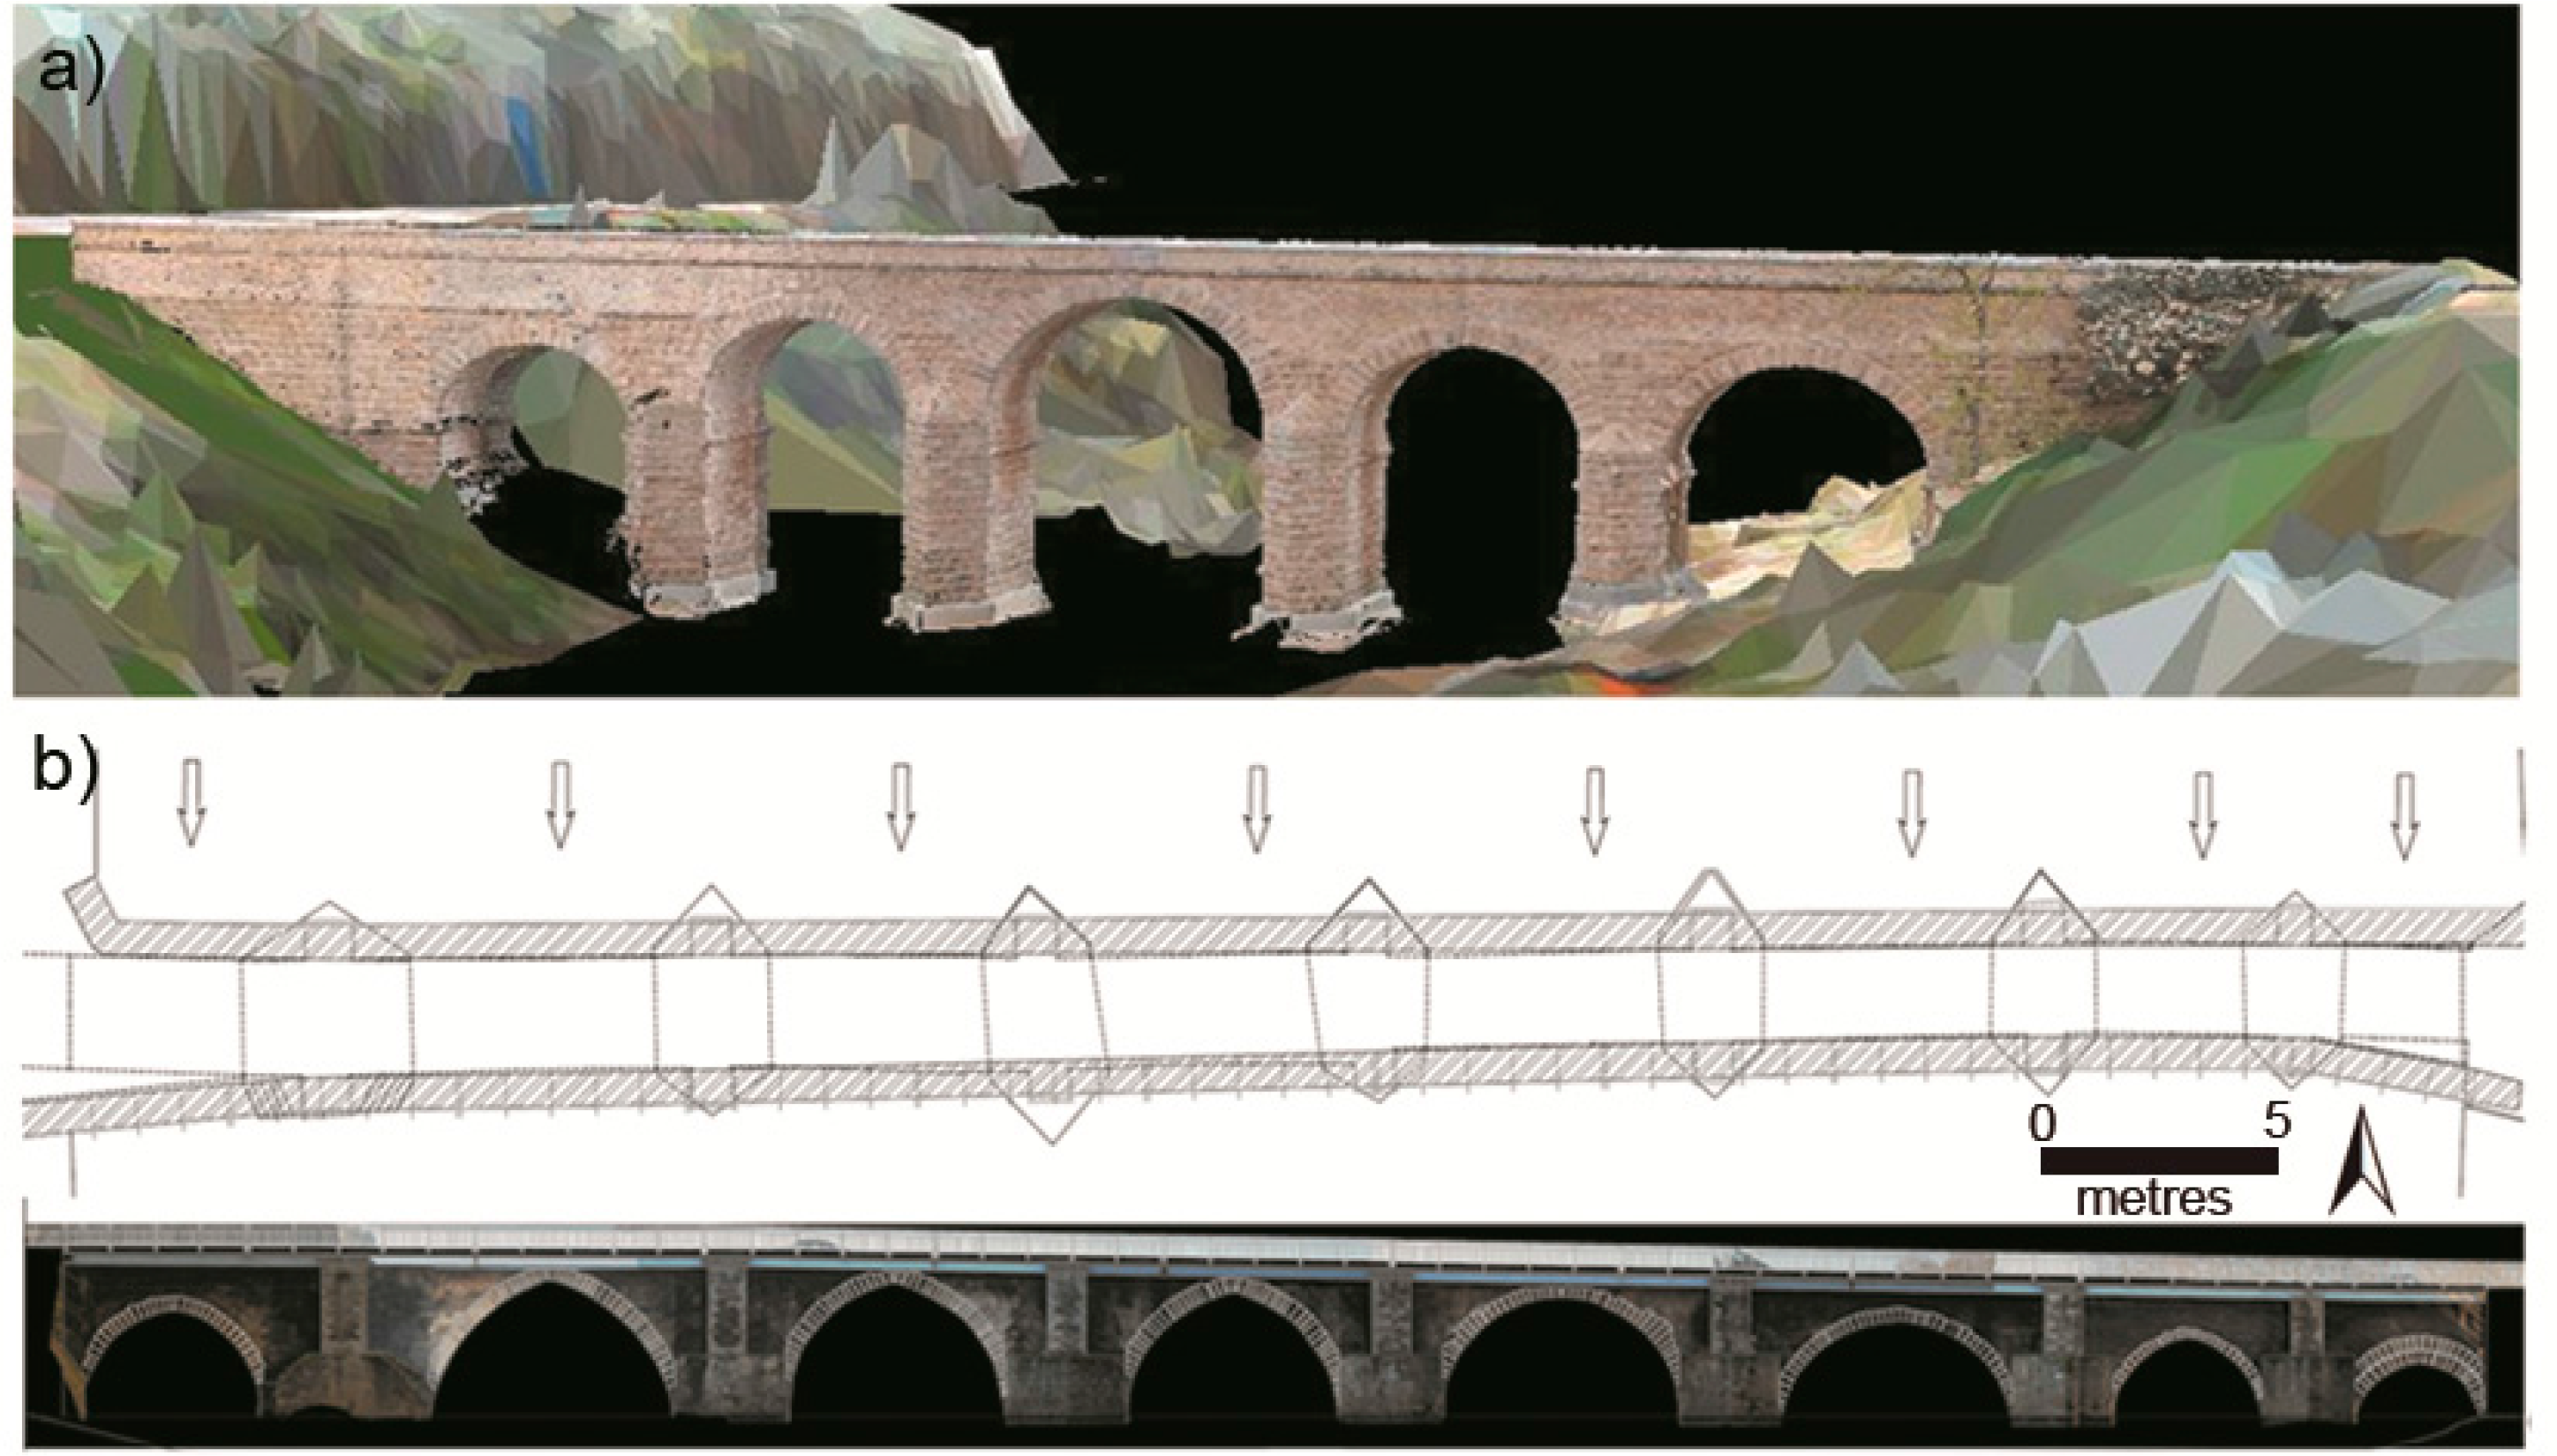
When it is desired to exploit the 3D model of the object, for example for structural assessment, it is common to triangulate the point cloud in such a way that it generates a 3D model of the surfaces of the bridge, similar to digital terrain models (DTM), and then export this to an exchange file of a CAD model. When detailed plans of the structure or orthoimages are required, a texturing process is employed, consisting of the projection of texture onto each of the triangles. The next figure (Figure 5) shows a photorealistic model of the Segura Roman Bridge and the detailed maps generated at the Roman Bridge in Lugo before its restoration.
3.2.2. Mobile Laser Scanning
As explained in Section 2.2, the construction of the point cloud in a mobile scanning system depends on two subsystems: the navigation system and the LiDAR sensor. These sensors are synchronized though the time stamp and GPS information from the navigation system. The Applanix POS 520 navigation system uses the LV-POSView software. This system is the first one that must be initiated, since it is responsible for ensuring the synchronicity of the other devices. It also allows the frequency of data acquisition to be selected, typically 200 Hz for the inertial system and 1 Hz for the GPS.
The software that controls the LiDAR systems is called LYNX Survey, and for it to function properly, (a) it needs to have the Applanix system connected previously and (b) it must be sending data. It allows the frequency of LiDAR data acquisition to be set between 75 kHz and 500 kHz for each of the scanners. In this software, there is a library that also permits the acquisition of photos obtained from cameras.
Regarding data processing, the first step consists of generating a precise trajectory on which the data from the others sensors are synchronized, in this case, the LiDAR data and cameras, if they are oriented inside the vehicle. To do so, the software that allows the import of the RINEX files corresponding to the base stations close to the survey site is used to correct the GPS data. Additionally, by applying algorithms based on the Kalman filter [12], it is possible to integrate the different navigation sensors (GPS system, inertial system and encoder), in which there is precise information about the trajectory and the measurement of the GPS time corresponding to each point.
Once the trajectory has been generated, the next step is to fuse the navigation data with the LiDAR data. The LiDAR system of a mobile unit is a 2D measuring system that requires the navigation file for the generation of 3D point clouds. Furthermore, since the origin of both systems of coordinates is different, the use of a calibration file that implements the translation and rotation matrix between both coordinate systems (external orientation of the sensors in the vehicle) is essential.
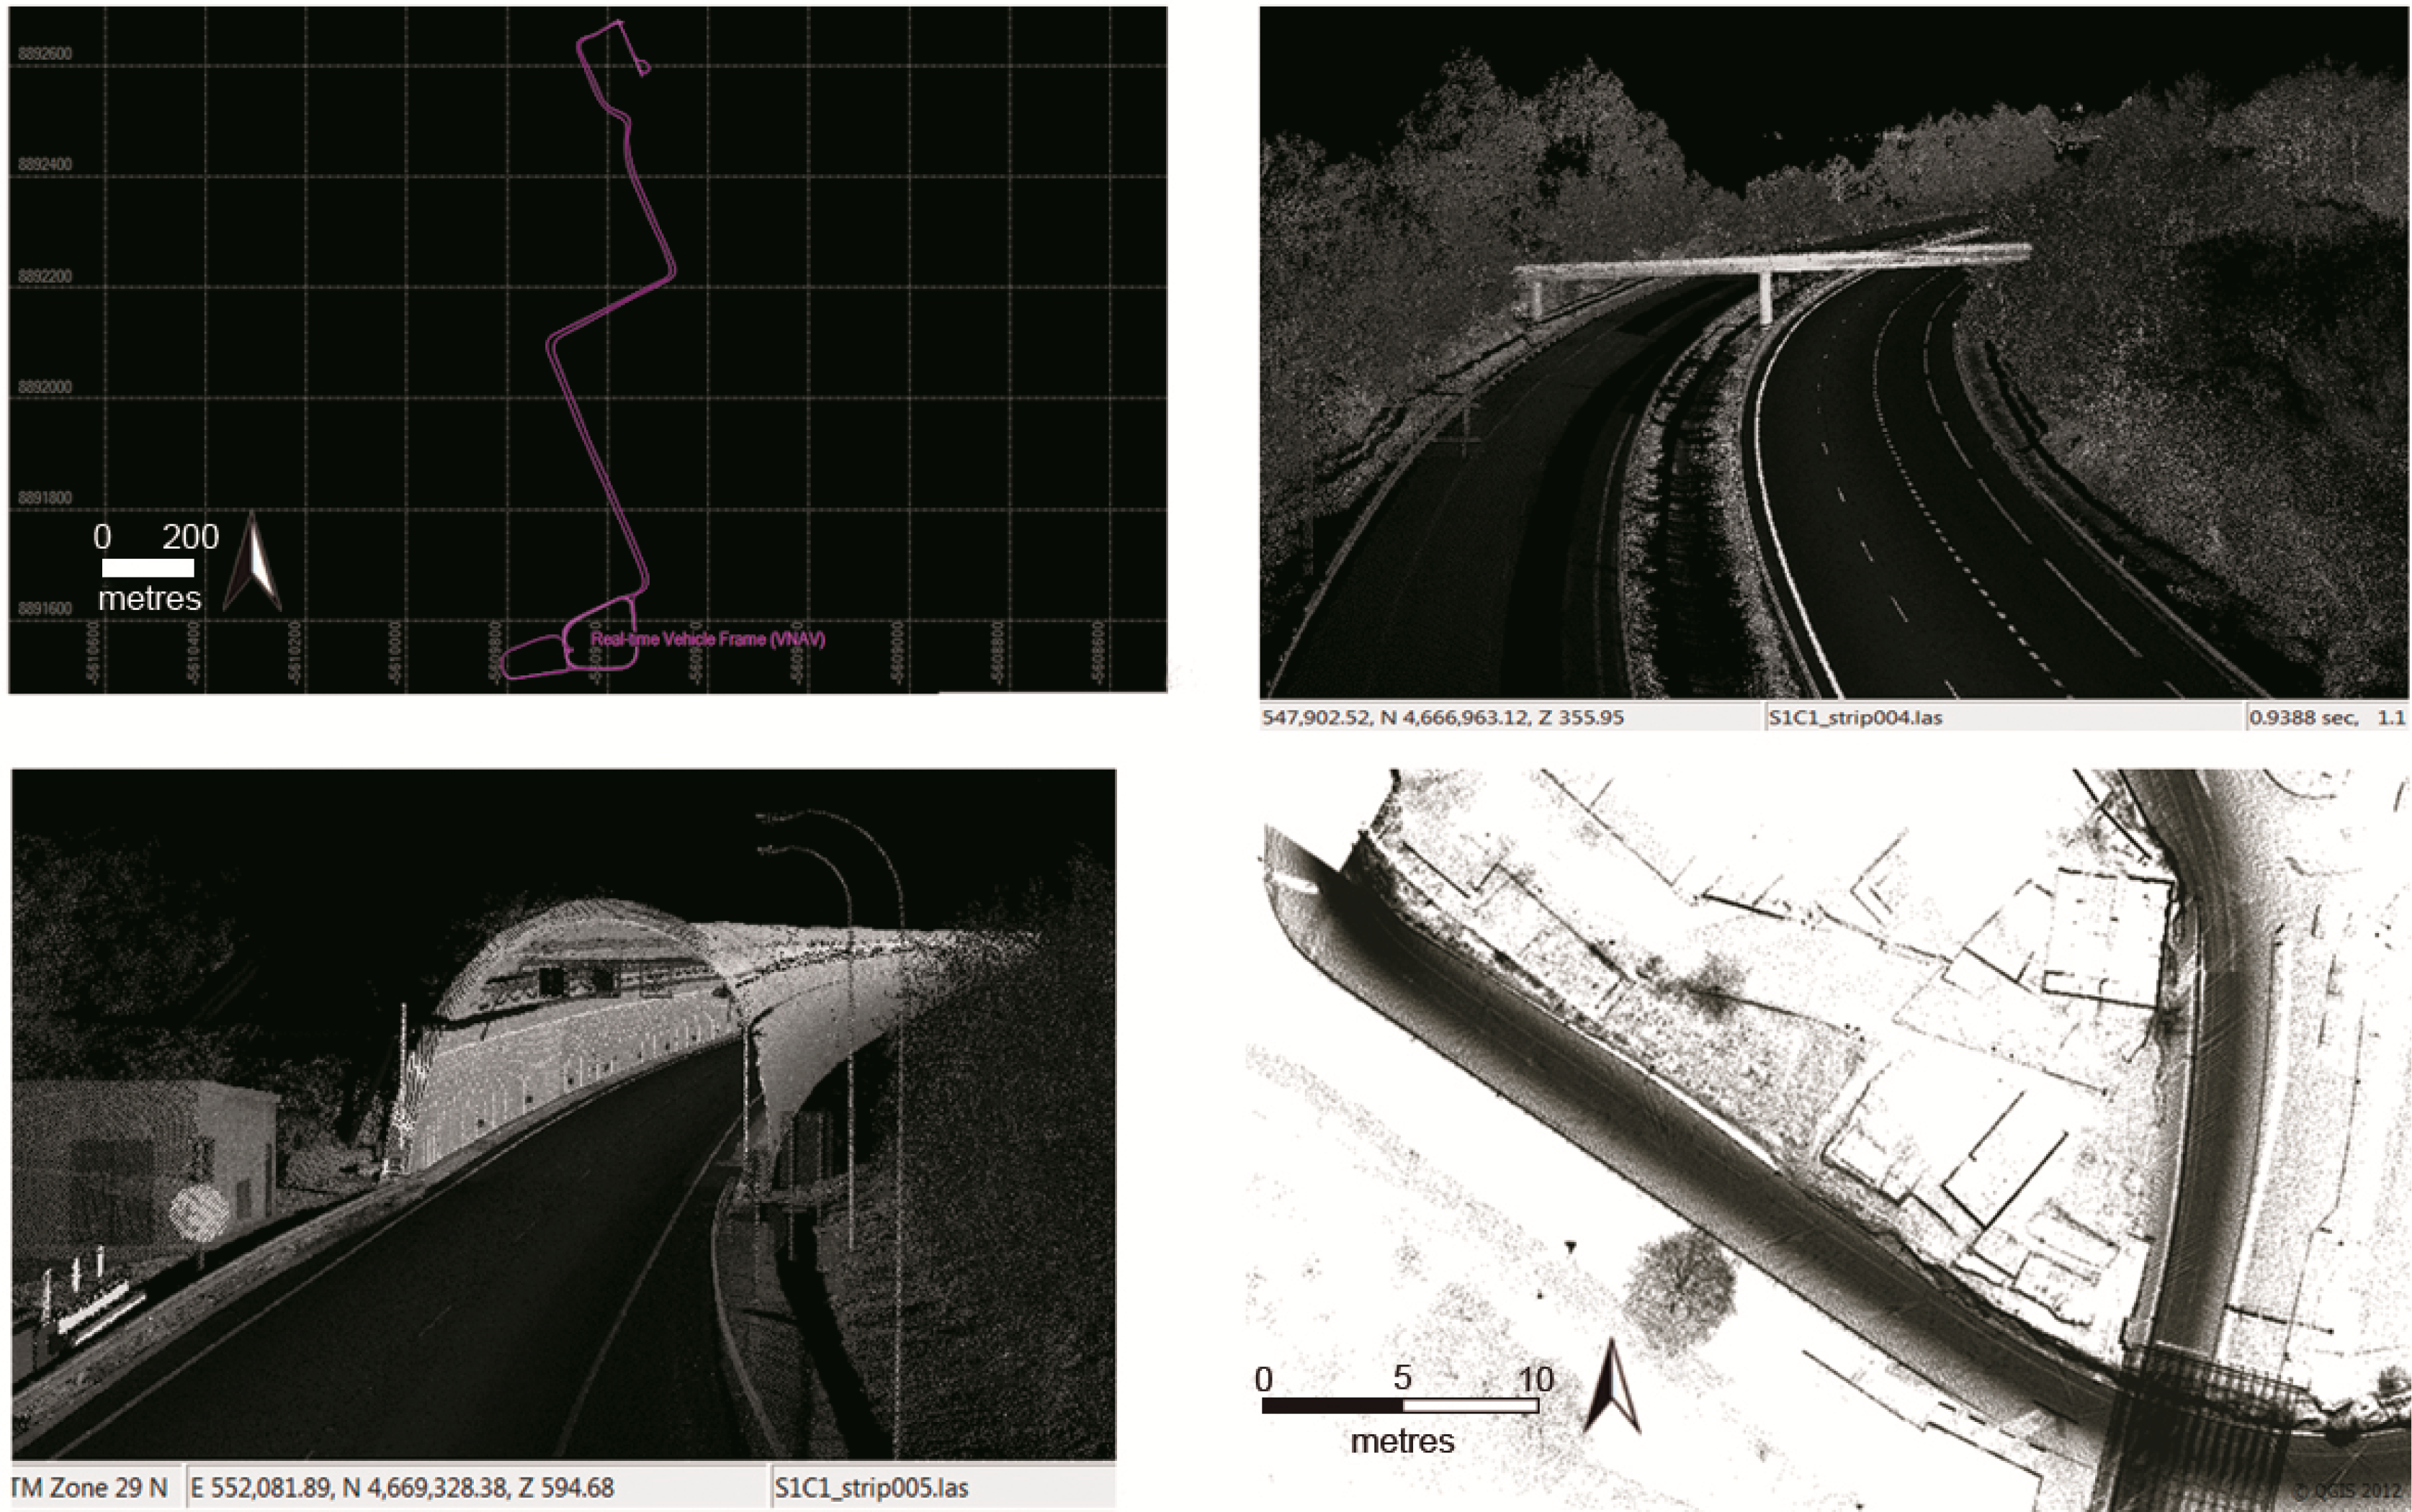
Once the point cloud has been reconstructed, the operations coincide with those explained in the previous section. One particularity of the data acquired from mobile systems is related to the huge computational volume they occupy, which may also correspond to large extensions of terrain. Thus, the incorporation of the data in geographical information systems (GIS), and, in particular, with the road network, now means that the technique is a very useful tool for management, as detailed in the Results section. Moreover, not only do the files allow one to work based on 2D GIS, but also, the technique becomes ideal for the input of information into 3D GIS.
The next figure (Figure 6) shows a cartographic representation of the trajectory calculated for a road survey together with several point clouds of infrastructures associated with roads in the Regional Community of Galicia, together with LiDAR data converted to SHP (ESRI Shapefile) and loaded in Quantum GIS.
3.3. Structural Evaluation of Road Infrastructure
The methodologies for geometric reconstruction presented above were applied for structural purposes. The aim was to build geometric models that could be imported into the tasks of structural assessment. In this sense, for the particular case of stone or concrete structures, it is particularly useful to build the detailed 3D model of the construction in order to be able to carry out more realistic structural calculations. Successful examples of application follow.
3.3.1. Structural Assessment of Arch Bridges Based on Limit Analysis Theory: The 2D Approach
The first set of experiments performed consisted of the use of flat metric documents, such as rectified images and the delineation on the elevation plane of the bridge arches to carry out structural assessment work. To do so, within the framework of limit analysis theory, we considered methods for the analysis of the structural stability of masonry arches.
Masonry arches are hyperstatic structures, which imply the possibility of infinite numbers of pressure lines [13]. For a structure subjected to pure compression to remain at equilibrium, the pressure lines must be kept inside the arch ring defined by the intrados and extrados. Accordingly, equilibrium in a stone arch can be visualized via a pressure line. Thus, on the basis of the geometric information extracted from the structure, as well as the mechanical properties of the material, it is possible to evaluate different collapse mechanisms of bridges by varying the position and value of the load. In this sense, according to the different hypotheses concerning the formation of hinges in the arch, it is possible to determine the lowest load value that would cause the arch, and hence the bridge, to collapse. The results of the present work can be consulted in detail in the work by [14]. Likewise, since the arch thickness of the inner parts of the vaults may not necessarily coincide with the thickness measured at the vault ends, an integral methodology was developed by integrating ground penetrating radar, aimed at determining the values of arch thickness across the entire vault. Details of this work can be found in [15].
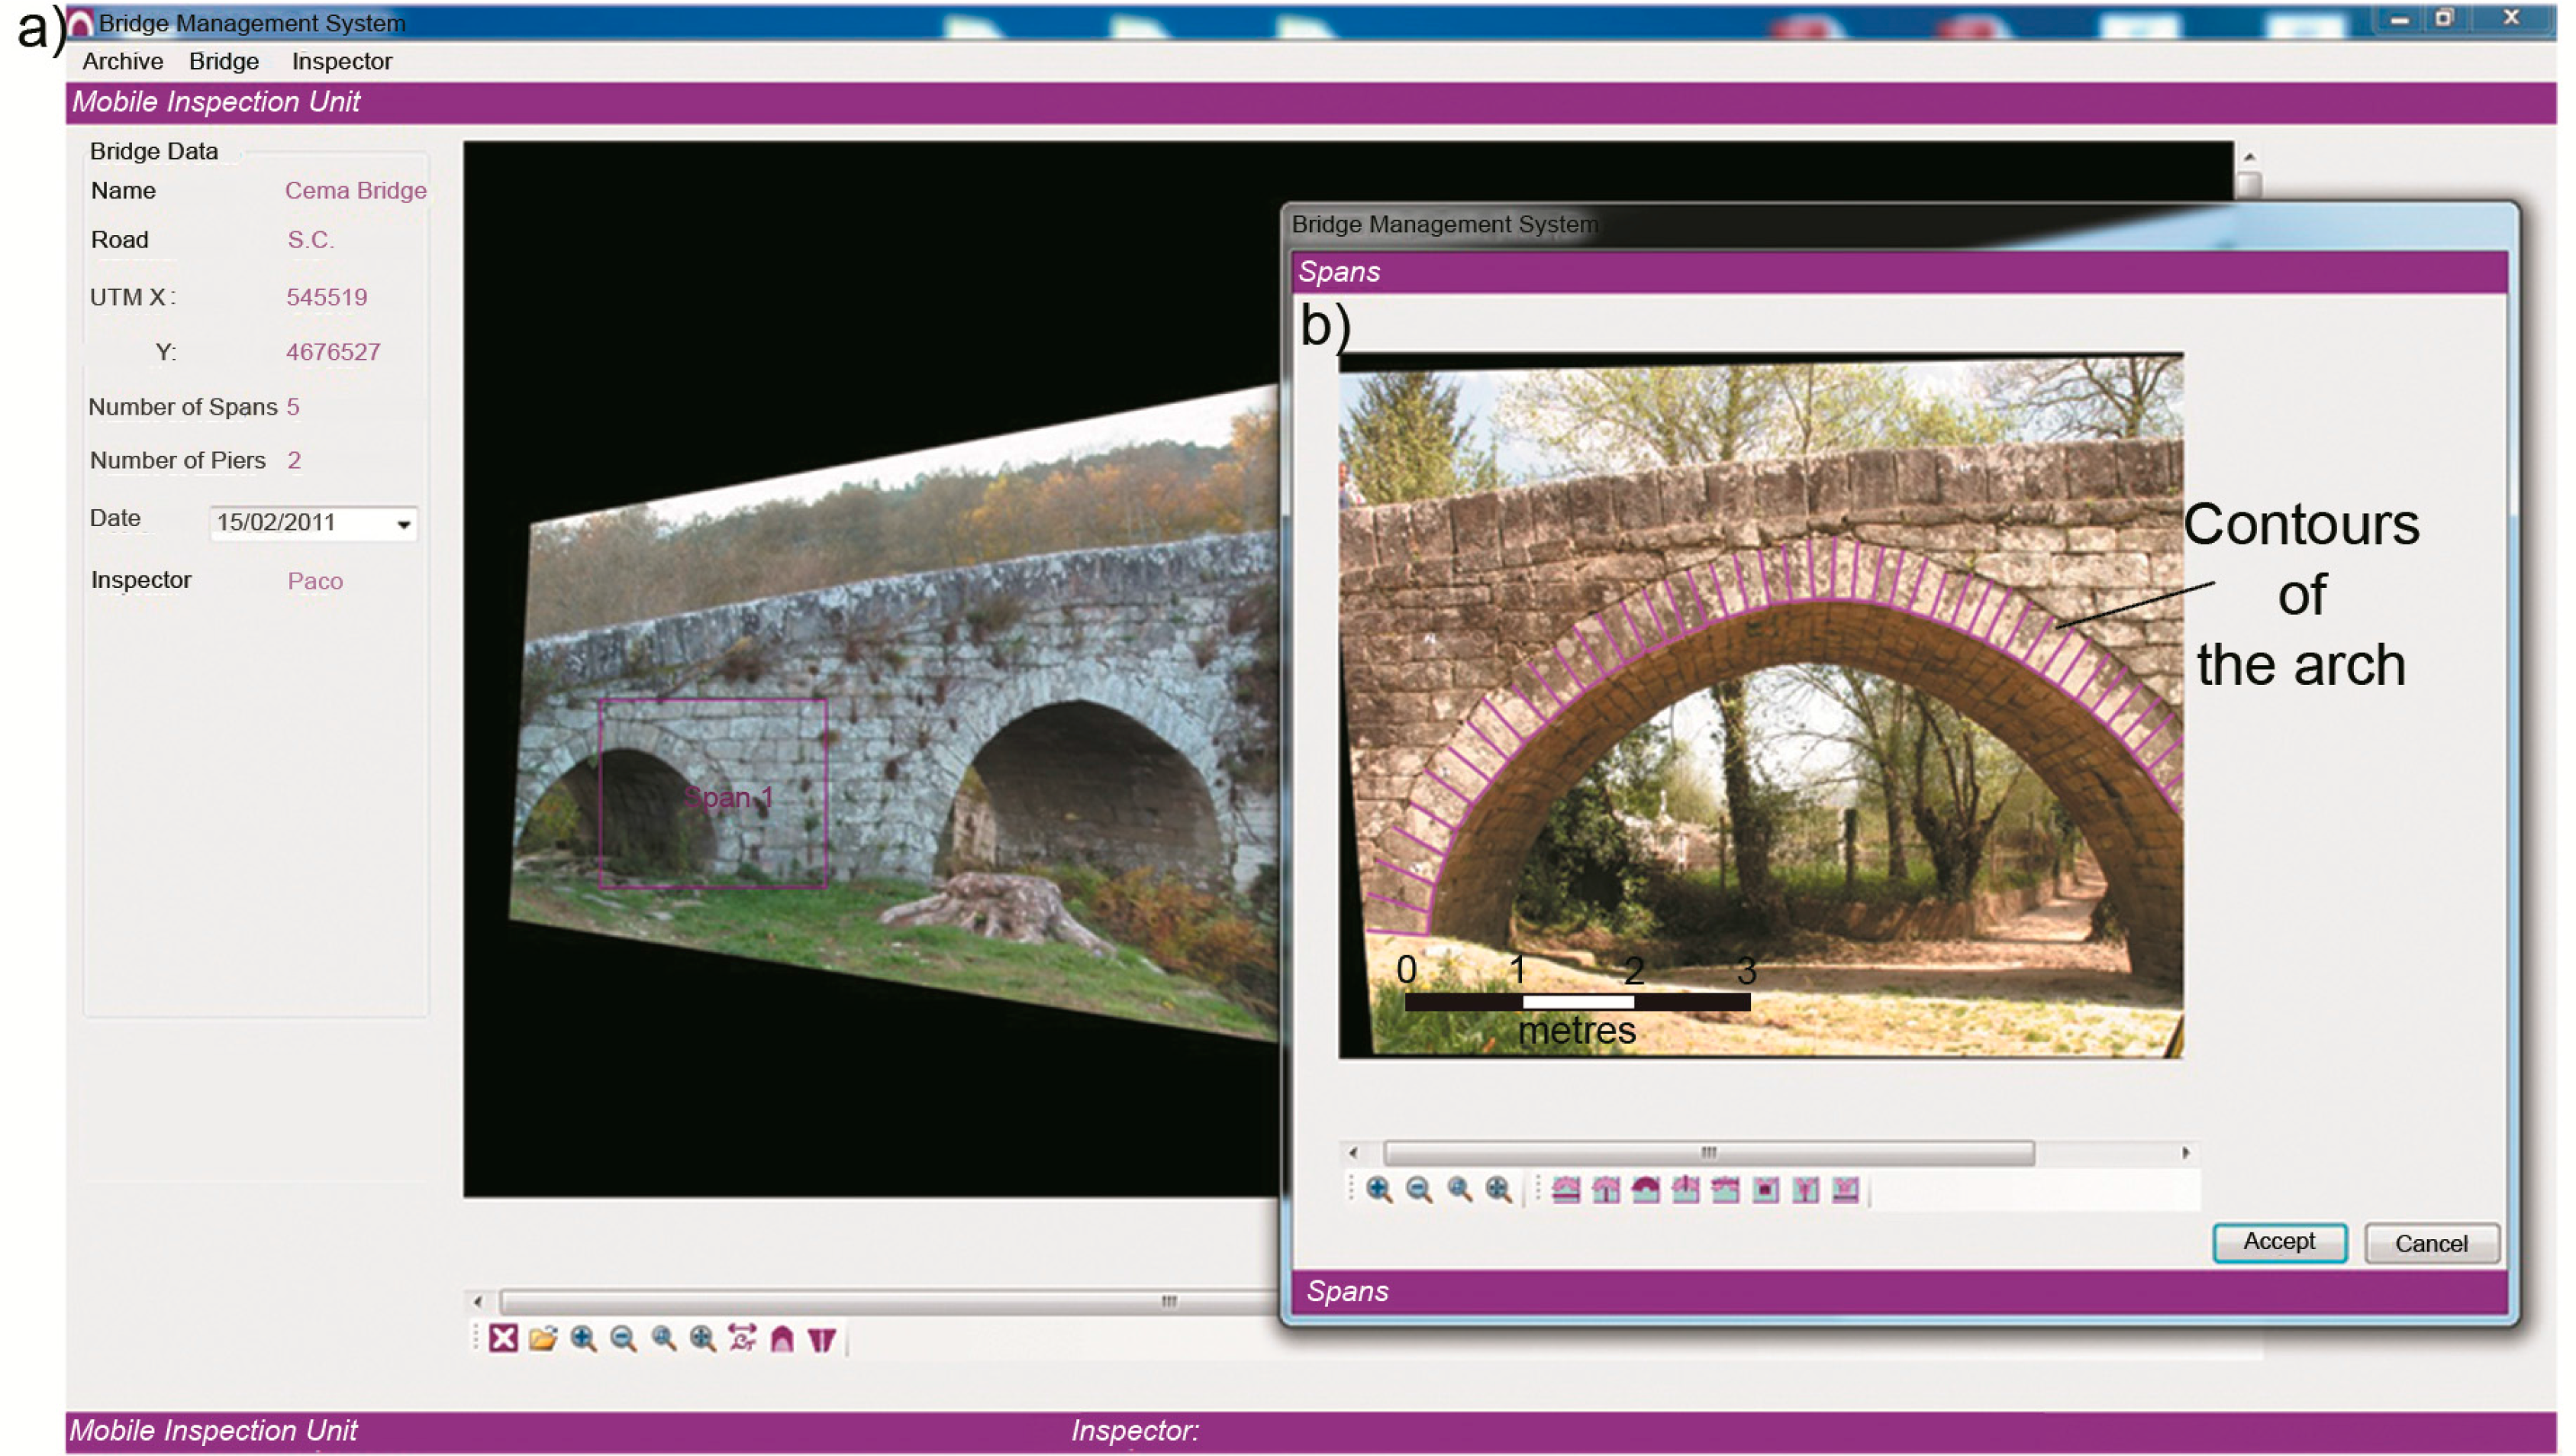
Similarly, the above methodology was implemented in the metric inspection tool of arches based on image rectification. This application, therefore, has photogrammetric rectification tools that allow metric documents to be obtained for use in the calculation of structural stability, as well as to perform both geometric inventories and routine inspections of the bridges. Within the framework of a bridge management system, this approach allows access to the real geometry of the structure in a simple way for the operator (improving safety and access), together with data digitalization and in situ structural assessment. The next figure (Figure 7) shows a photo of the geometric inventory module over an image interactively, together with the results of the stability analysis of one of the arches studied.
3.3.2. 3D Structural Assessment Using Micromodeling Technique and Finite Element Modelling
In order to build more realistic structural models, the detailed 3D geometry of the structures was exported to platforms involving more sophisticated methods for the structural analysis, such as the case of the finite elements method (FEM). One of the methods consisted of modeling an arch bridge as a discontinuous model of voussoirs. This model was chosen according to the formulation of the plastic analysis that allows masonry arches to be analyzed through the line of pressure that transforms the arch into a mechanism, when the truss line reaches the limit of the arch ring at a sufficient number of points (joints).
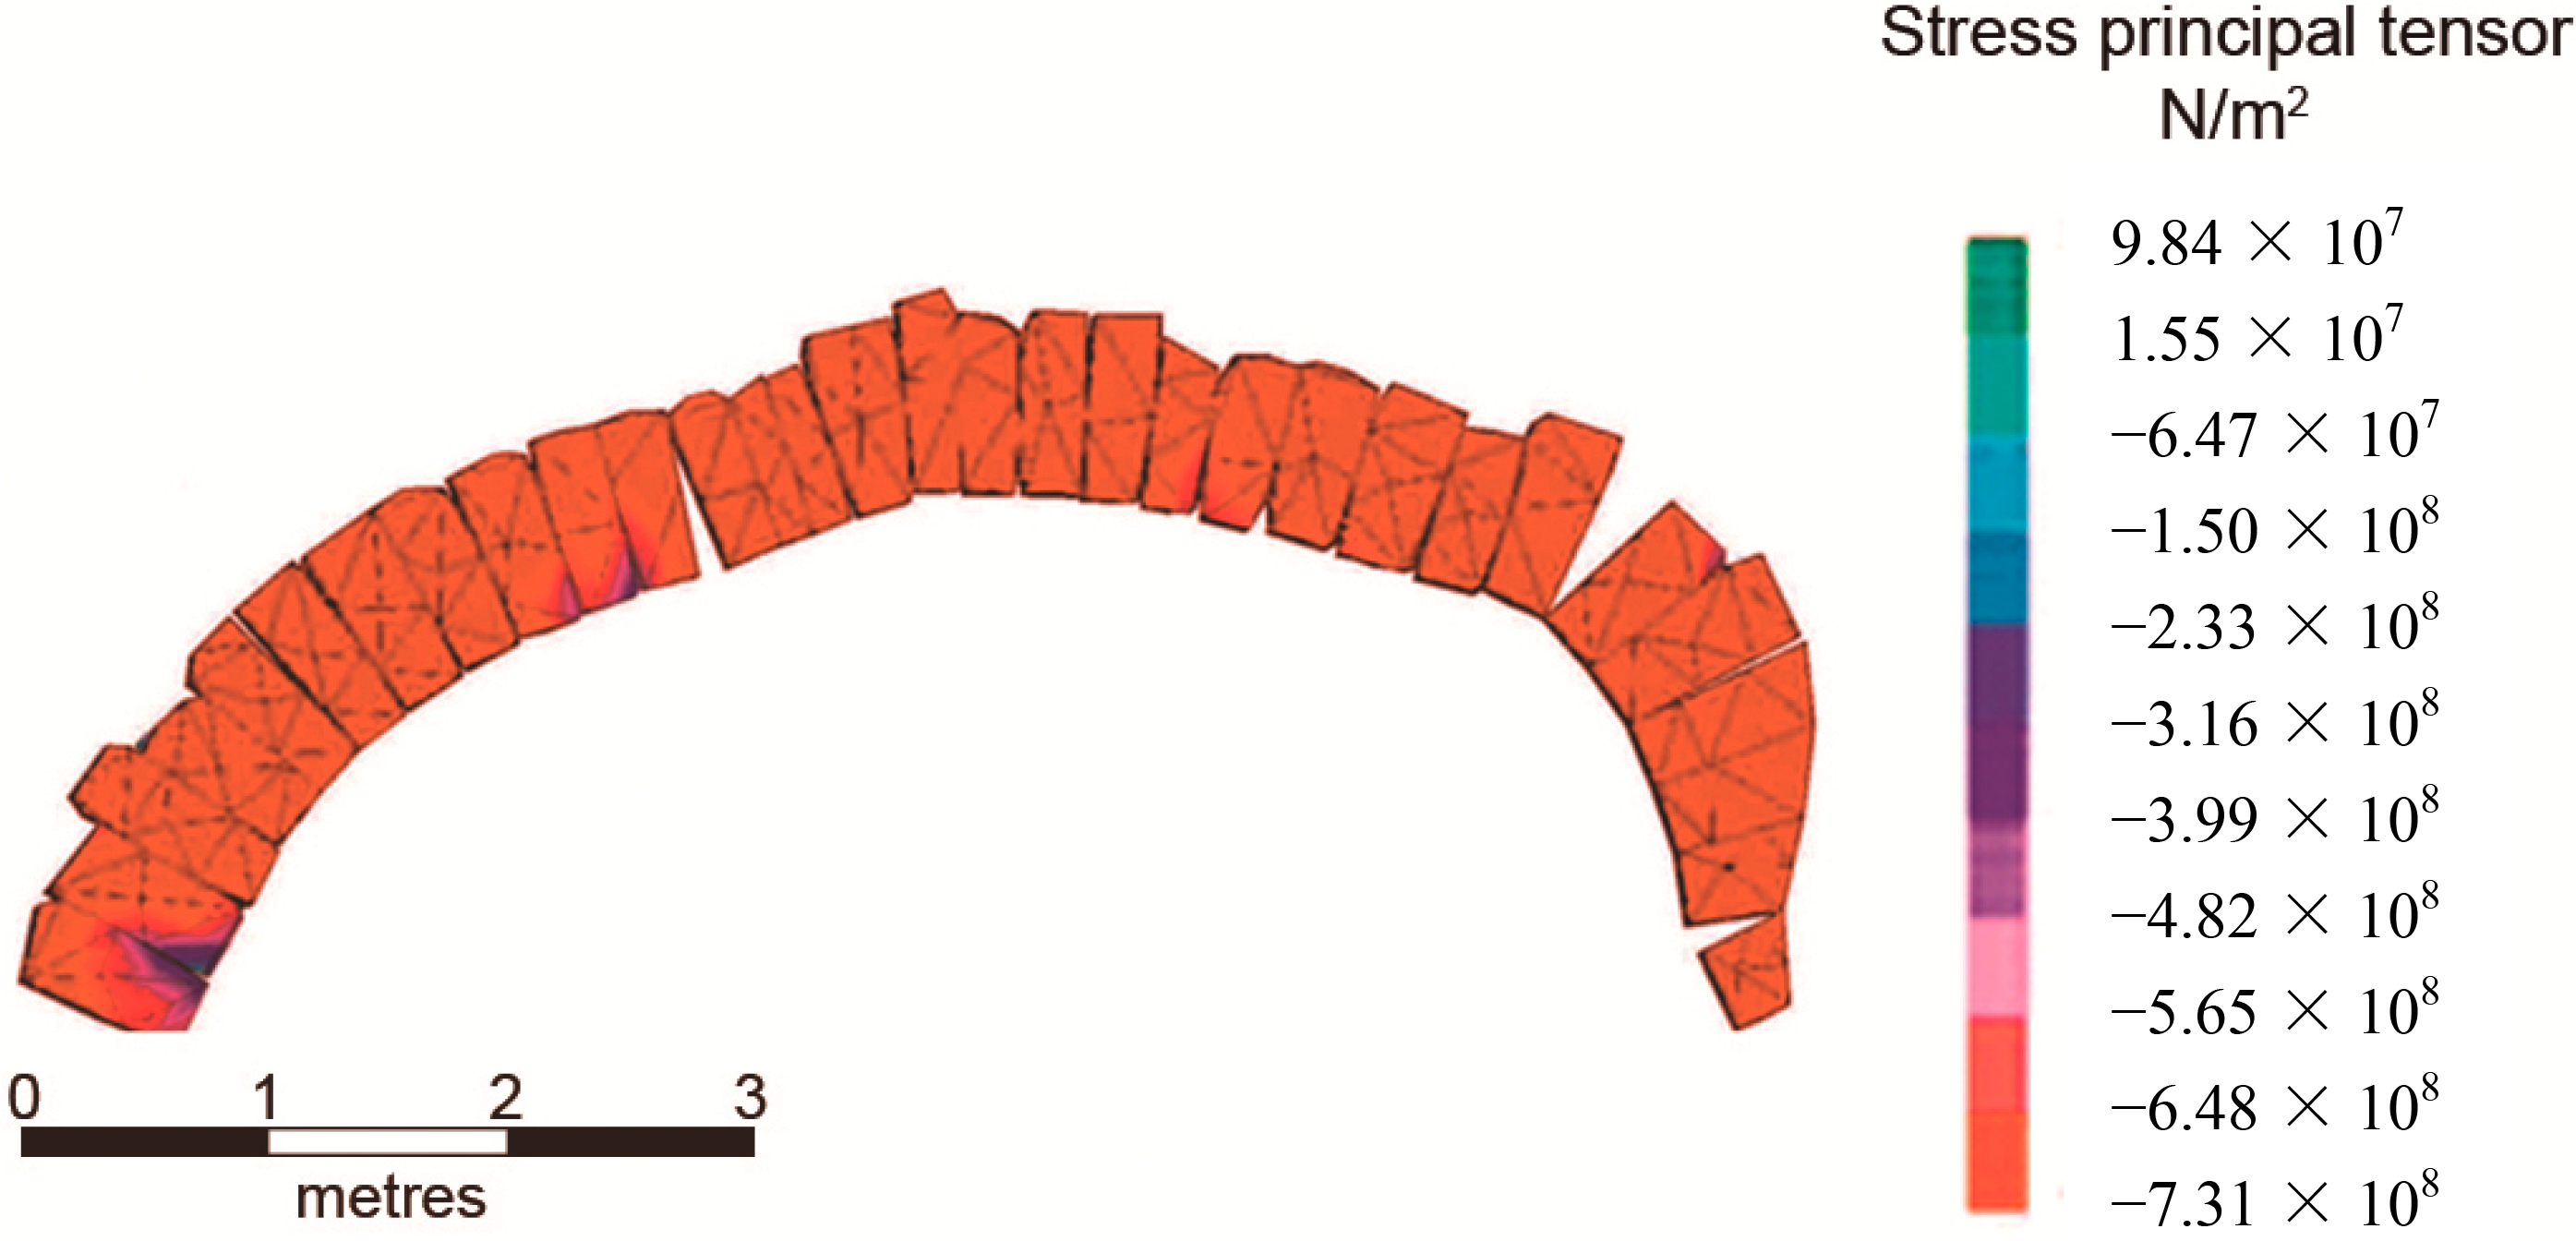
The discontinuous model was created by photogrammetric restitution of the points that delimit each of the granite voussoirs of the arch. Joints between voussoirs do not transmit tensile stresses, so contacts were modeled, allowing only the transmission of compression stresses, with no displacements between the blocks and no resistance to traction. The stone was assumed to deform elastically, and the behavior of the arch was evaluated under monotonic variation of loading. In the model built, it was possible to estimate the collapse loads from the diagram that related load and displacement between blocks, obtained by varying the loads in an iterative process, determining load peaks. For each voussoir and load level analyzed, a finite-element model was built, determining the distribution of stresses inside each block and at the interfaces. The FEM model of the voussoirs was built using tetrahedral elements with second-order interpolation, with three degrees of freedom per node (translation). The contact defined between voussoirs allows the connection between nodes and faces of contiguous elements [16]. The next figure (Figure 8) shows the distribution of stresses in the 3D model, in which it is easy to note the formation of the collapse mechanism. The details of the methodology used for this case can be consulted in [16].
3.3.3. Determination of the Structural Failure of Arches on the Basis of Information from the First Hinge: FEM in 2D
As in the previous case, starting out with detailed information about the geometric reality of masonry aches, it was possible to validate methodologies for the determination of critical loads using elastic frame analysis. To accomplish this, accurate elevation plans of bridges were imported into software for planar structural analysis using the finite elements method. The methodology consisted of defining the arch ring in detail from the photogrammetric restitution. Following this, the analysis consisted of assessing the internal forces for the loads applied assuming elastic behavior for the material, since the deformations caused by the loads are minimum. Based on the information about the first hinge, a plastic analysis was performed until the mechanism appeared. It was thus possible to compare the critical load values for both situations. A detailed description of this can be seen in [17].
4. Preliminary Findings in the Automation of Road Monitoring: Results and General Discussion
4.1. New Tools for Road Inventory
From the experience obtained in the above investigations, in 2010, a project was started up based on the same technologies, but was much more ambitious: the development of a mobile mapping unit with the final aim of automating the geometric inventorying and inspection of both roads and their associated infrastructures. The core idea was to obtain high productivity in performing the inspection works and avoiding subjectivity in the diagnosis of the current state of the infrastructures.
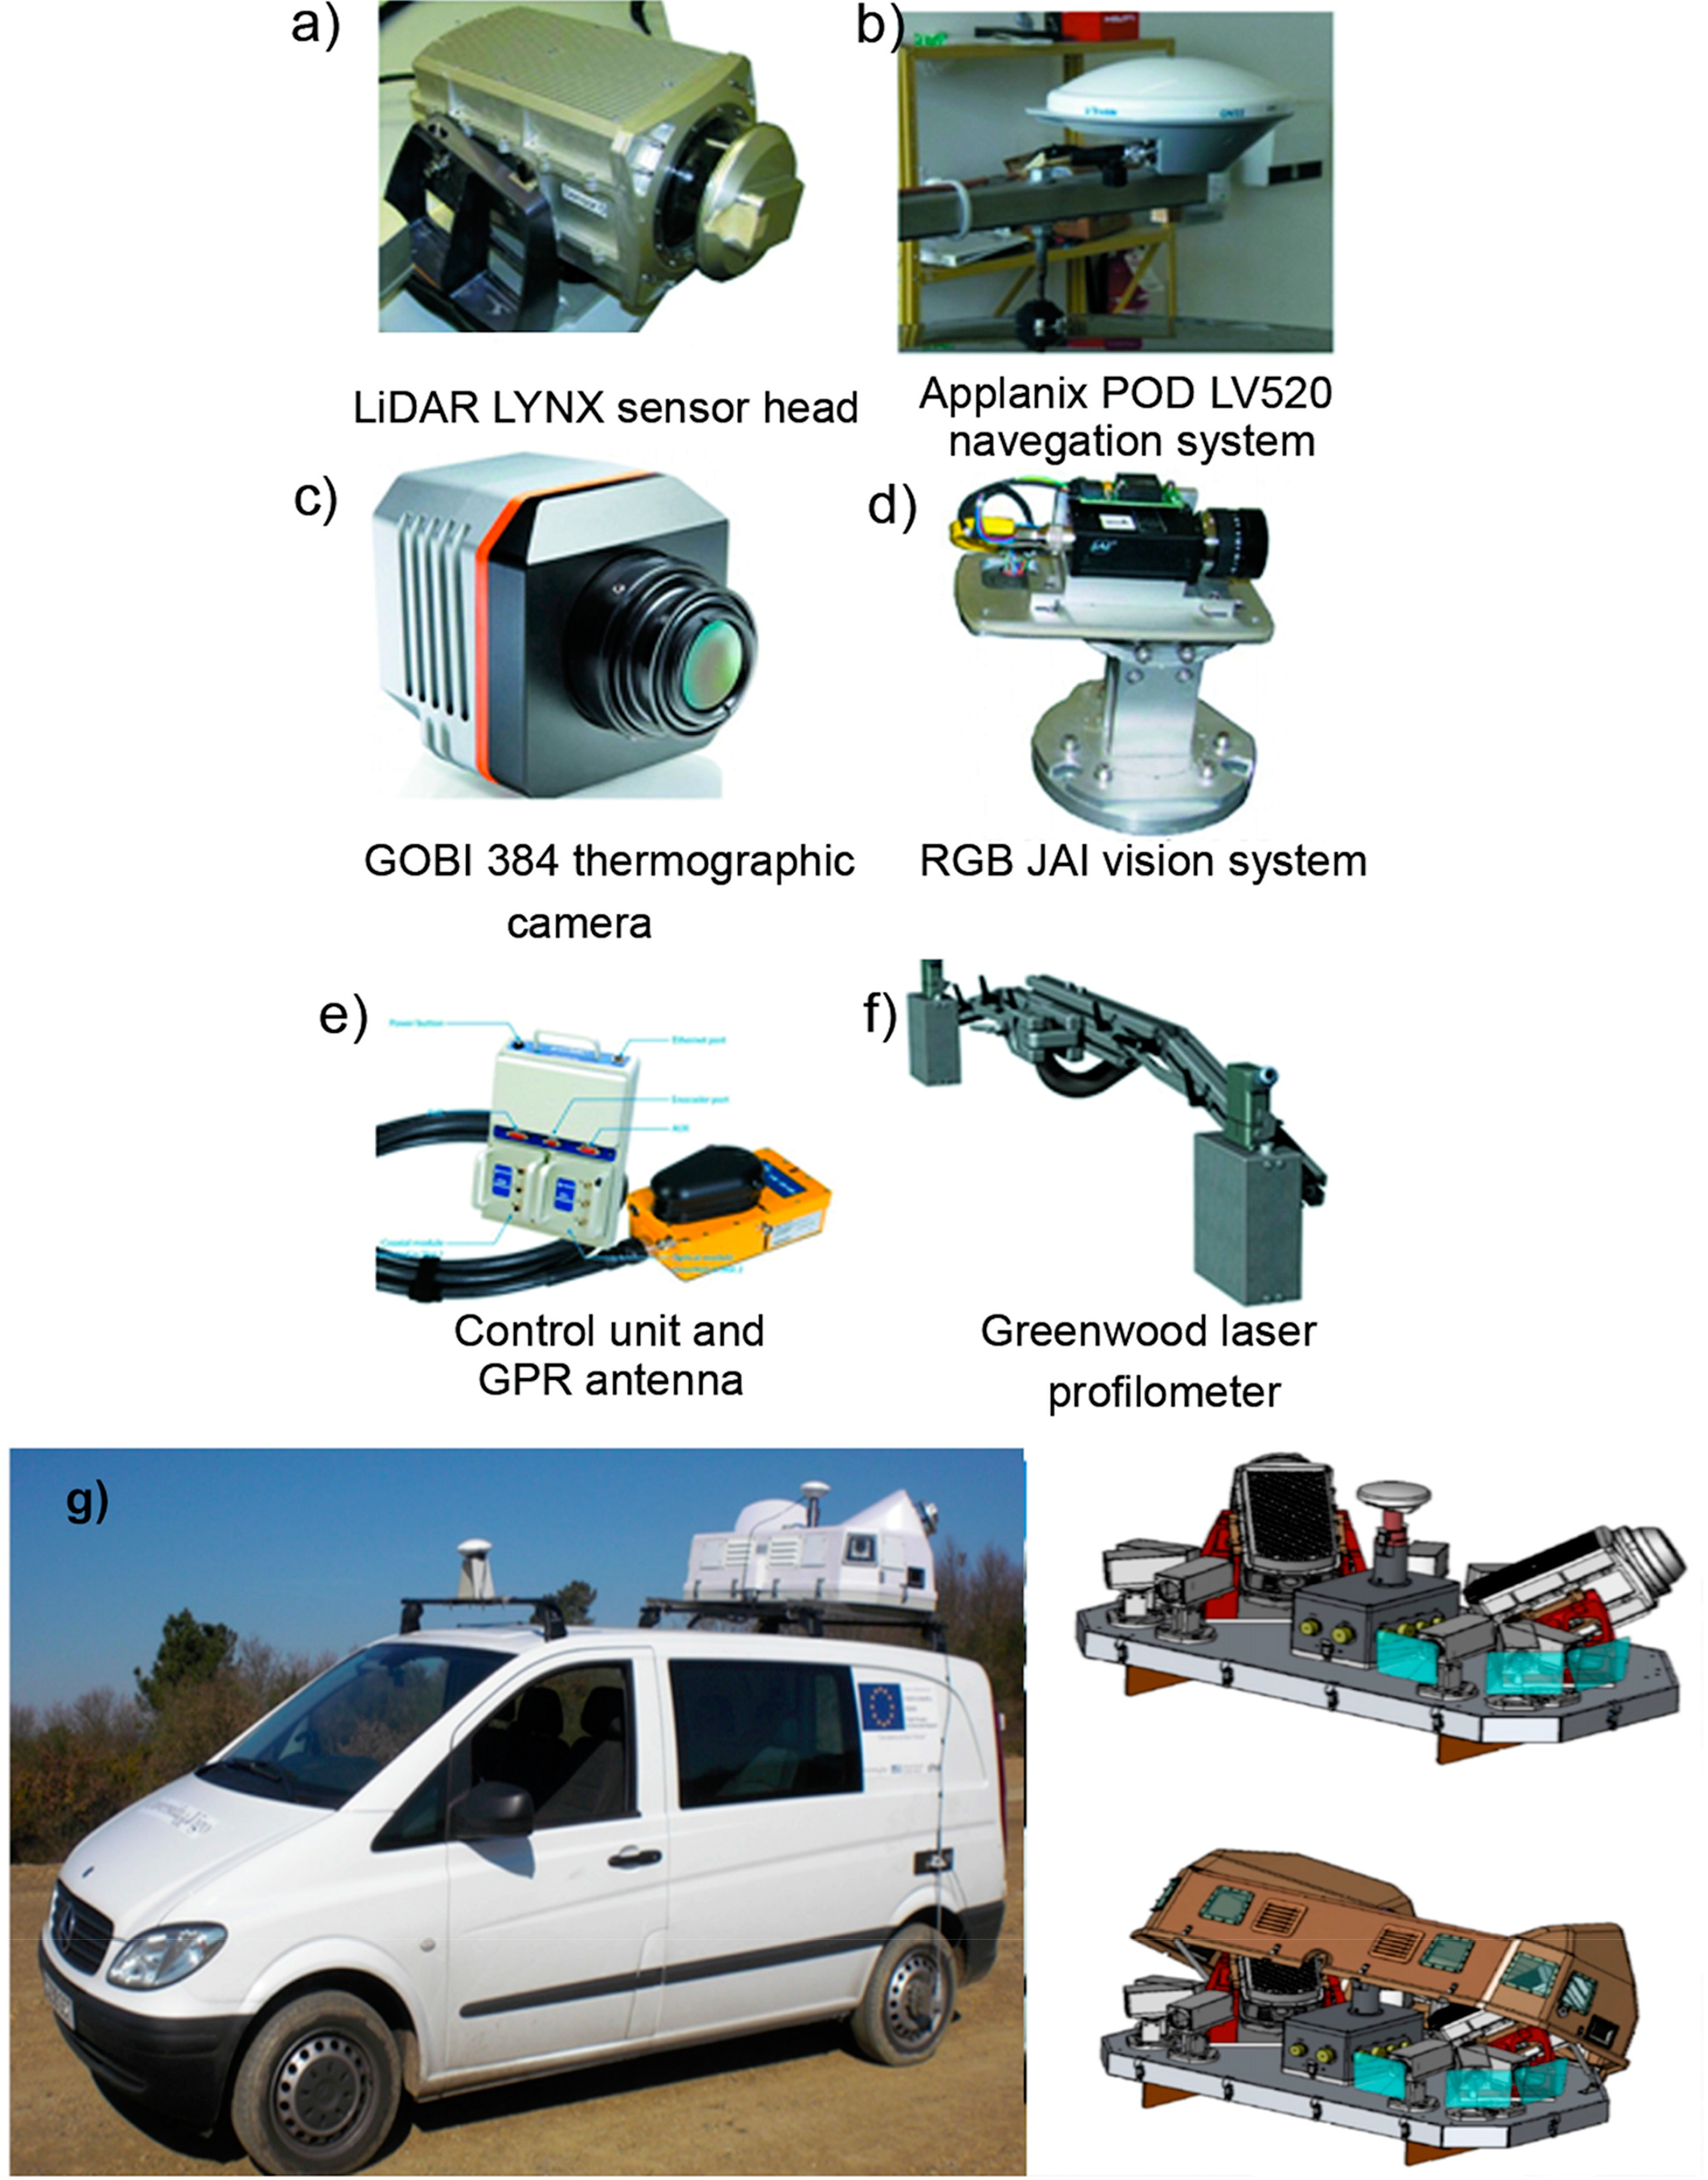
The need therefore arose to have a vehicle-laboratory that would allow the acquisition and management of all of the field data, with the best degree of automation possible. This led to the creation of a mobile inspection unit, composed of different geomatic elements or sensors necessary for the collection of data of the infrastructures, together with software applications and processes for the synchronization of sensors and georeferencing of the information gathered. The mobile mapping system allows the massive monitoring of elements (pavements, tunnels and slopes) and functions synchronously with the motion of the vehicle, as explained in Section 3.2, so that measurements can be georeferenced automatically. The inspection unit is integrated by:
A laser scanning system composed of two LiDAR sensor heads; the system is the Lynx Mobile Mapping from Optech (Section 2.2) (Figure 9a).
A navigation system for georeferencing information and synchronizing the data acquired. The unit installed in the vehicle was the LV 520 from Applanix (Section 2.2) (Figure 9b).
A thermographic camera. This sensor allows the capturing of thermographic images in motion with the purpose of detecting thermal differences on the surfaces measured. The thermographic camera selected for the vehicle was a GOBI 384 camera from Xenics (Figure 9c).
A multi-camera computer viewing system. A set of four JAI RGB cameras was installed for the capture of images in motion (Figure 9d).
A ground penetrating radar, integrating an antenna with several frequencies, which allows the inspection of the subsoil between 0 and 1 m. A Ground Couple system from MALA Geosciences was used (Figure 9e).
A laser profilometer from the Danish company, Greenwood, which allows the measurement of the International Regularity Index (IRI) [18] of roads by means of the use of two laser rangefinders (Figure 9f).
The vehicle offers a step forwards in the state-of-the-art of road inspection in which the various sensors used have been integrated for the first time (Figure 9g).
Each time the vehicle sets off on a measuring excursion, it is able to reconstruct the 3D geometry of the surroundings (up to 200 m) of the route followed by it, with centimeter precision.
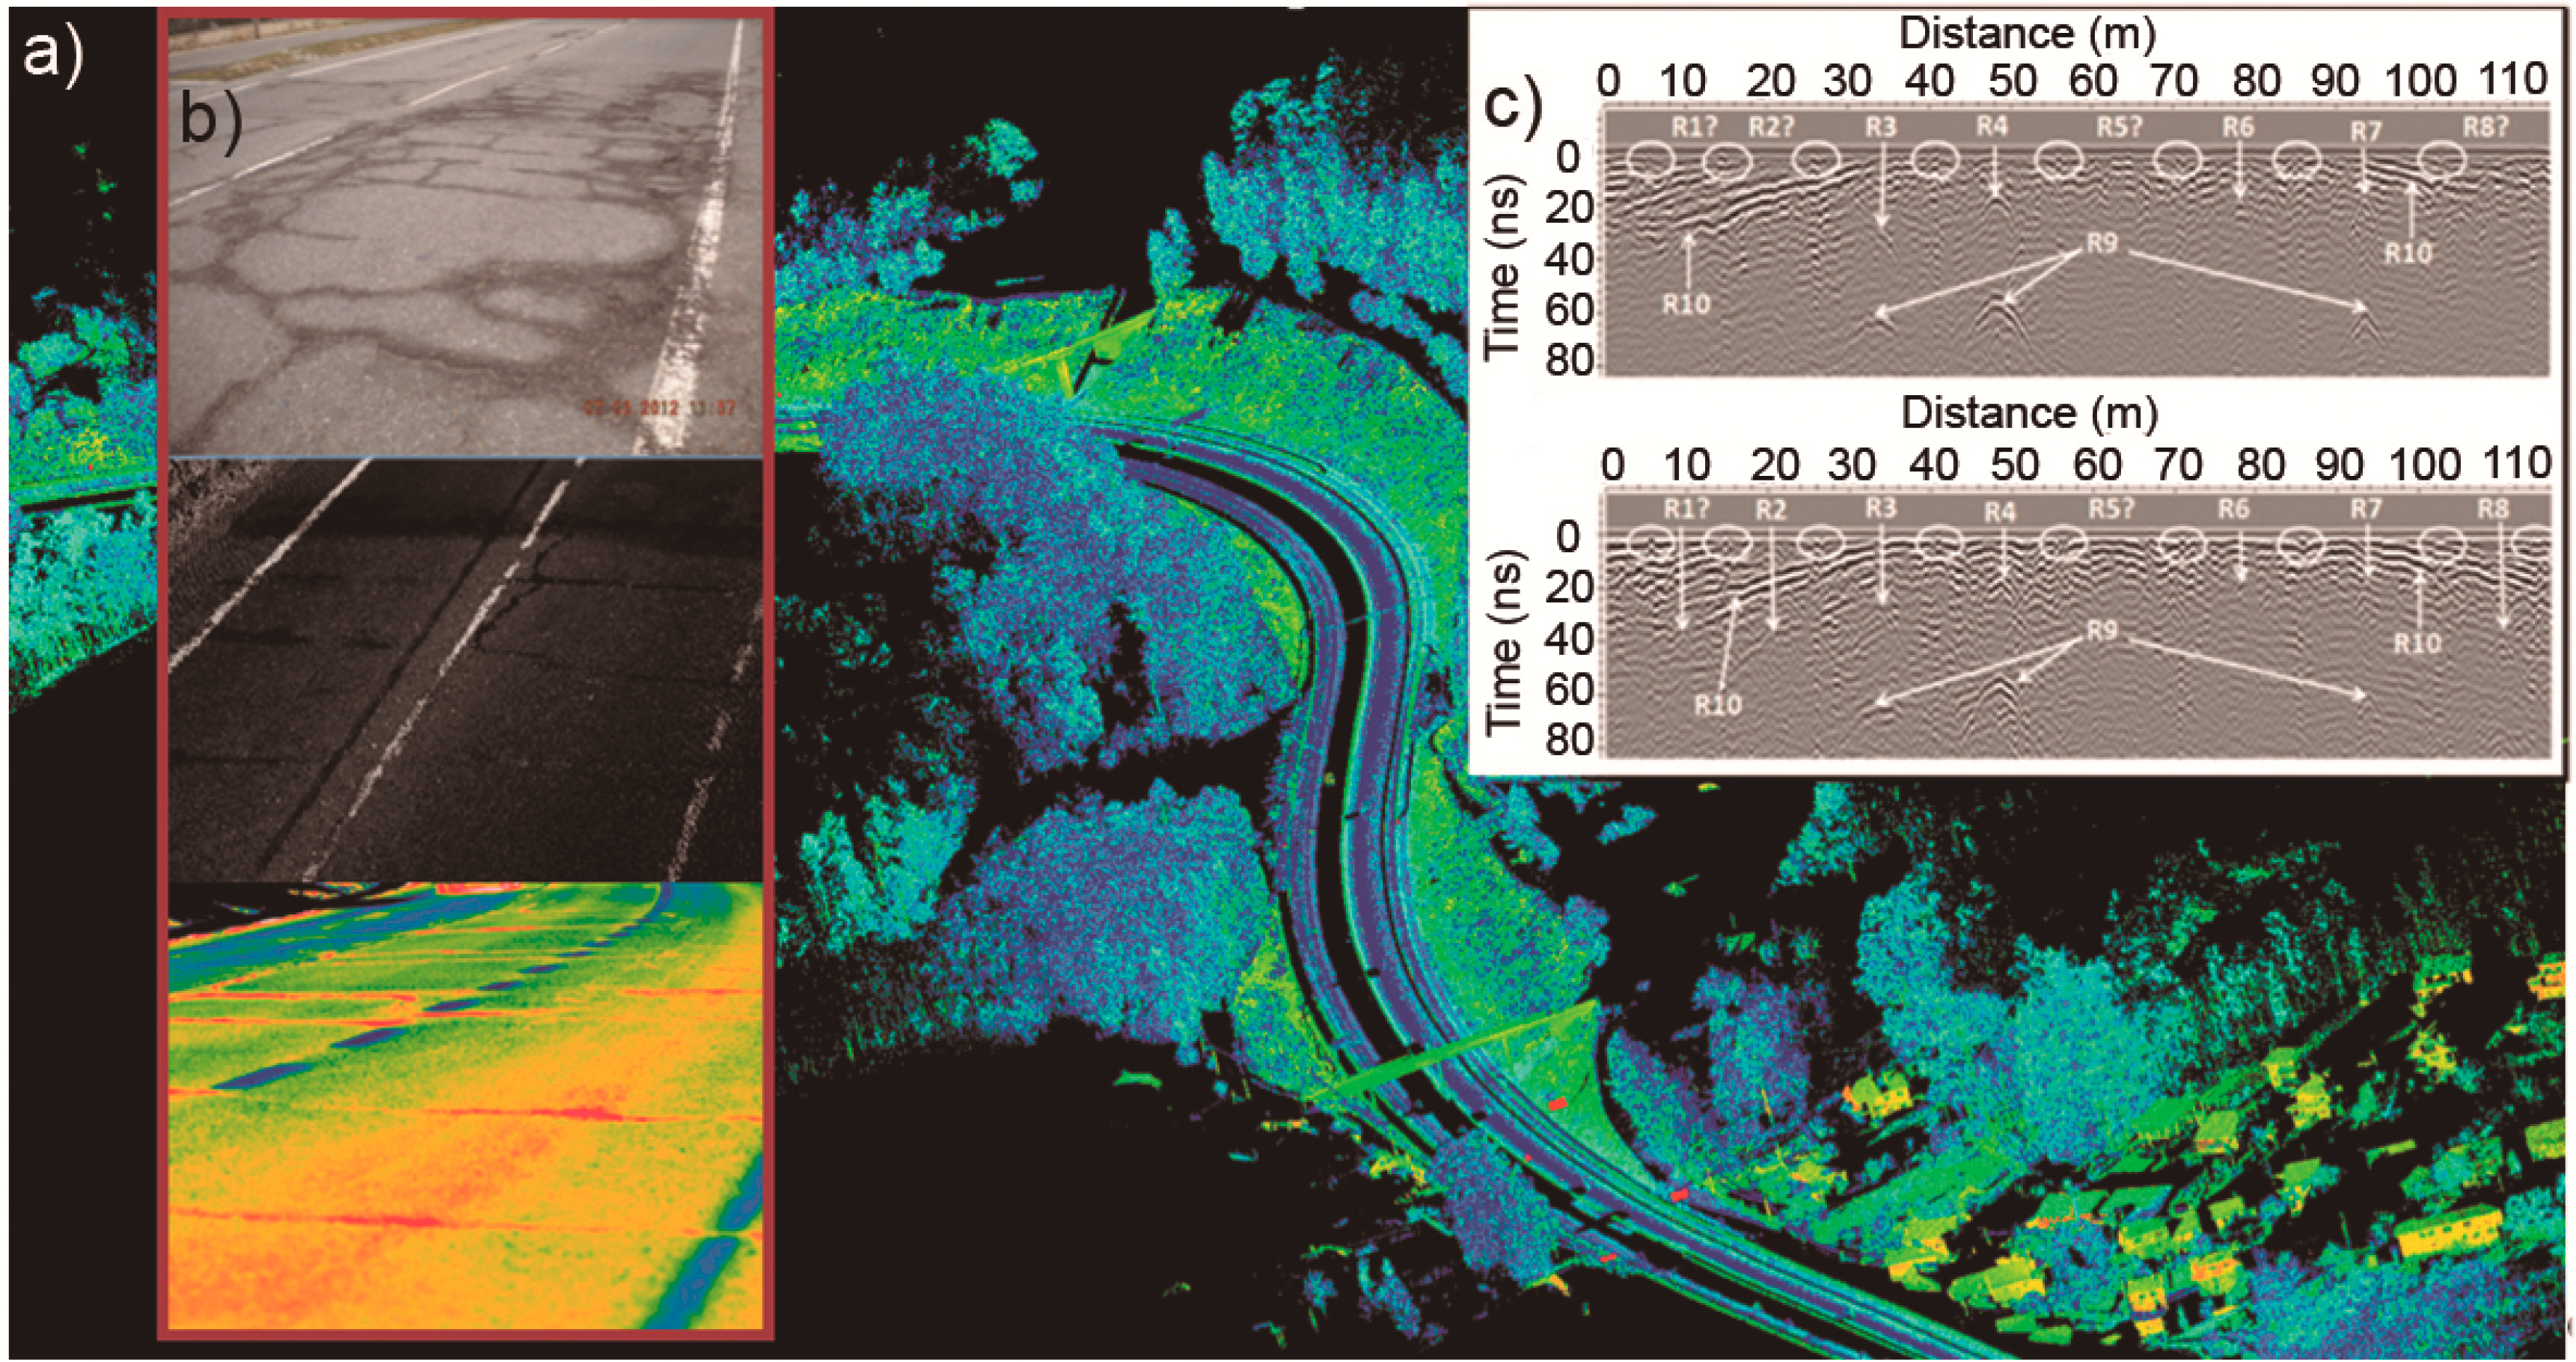
At the same time, the vehicle records visible and thermographic images of elements of interest (pavement, structures, etc.). Figure 10 shows some of the data recorded by the different sensors integrated in the vehicle. The data provided by each sensor are used for inspections and individual analyses of each element and, at the same time, feed the geometric inventory parameters of the road and associated elements
4.2. Management Software
For the handing of all of the information gathered by the inspection unit, a software application was developed that allows the visualization and editing of the database that constitutes a management system of road infrastructures. The software application consists of a tree view, which encloses those elements imported from the different sensors. By means of this tree view, it is possible to achieve the configuration, pre-visualization and access to certain properties of the elements.
The right-hand side of the screen is a visualization area. As mentioned, since all of the elements are linked to the trajectory data, it is possible to navigate through the elements synchronically with the trajectory. The application allows the advance in the trajectory to be configured at 1, 5 and 20 m, and it is also possible to increase or decrease the duration of this interval. Furthermore, it is possible to move the visualizing point to a particular milestone of the road to provide the inventory or inspection data required by the database of the management system.
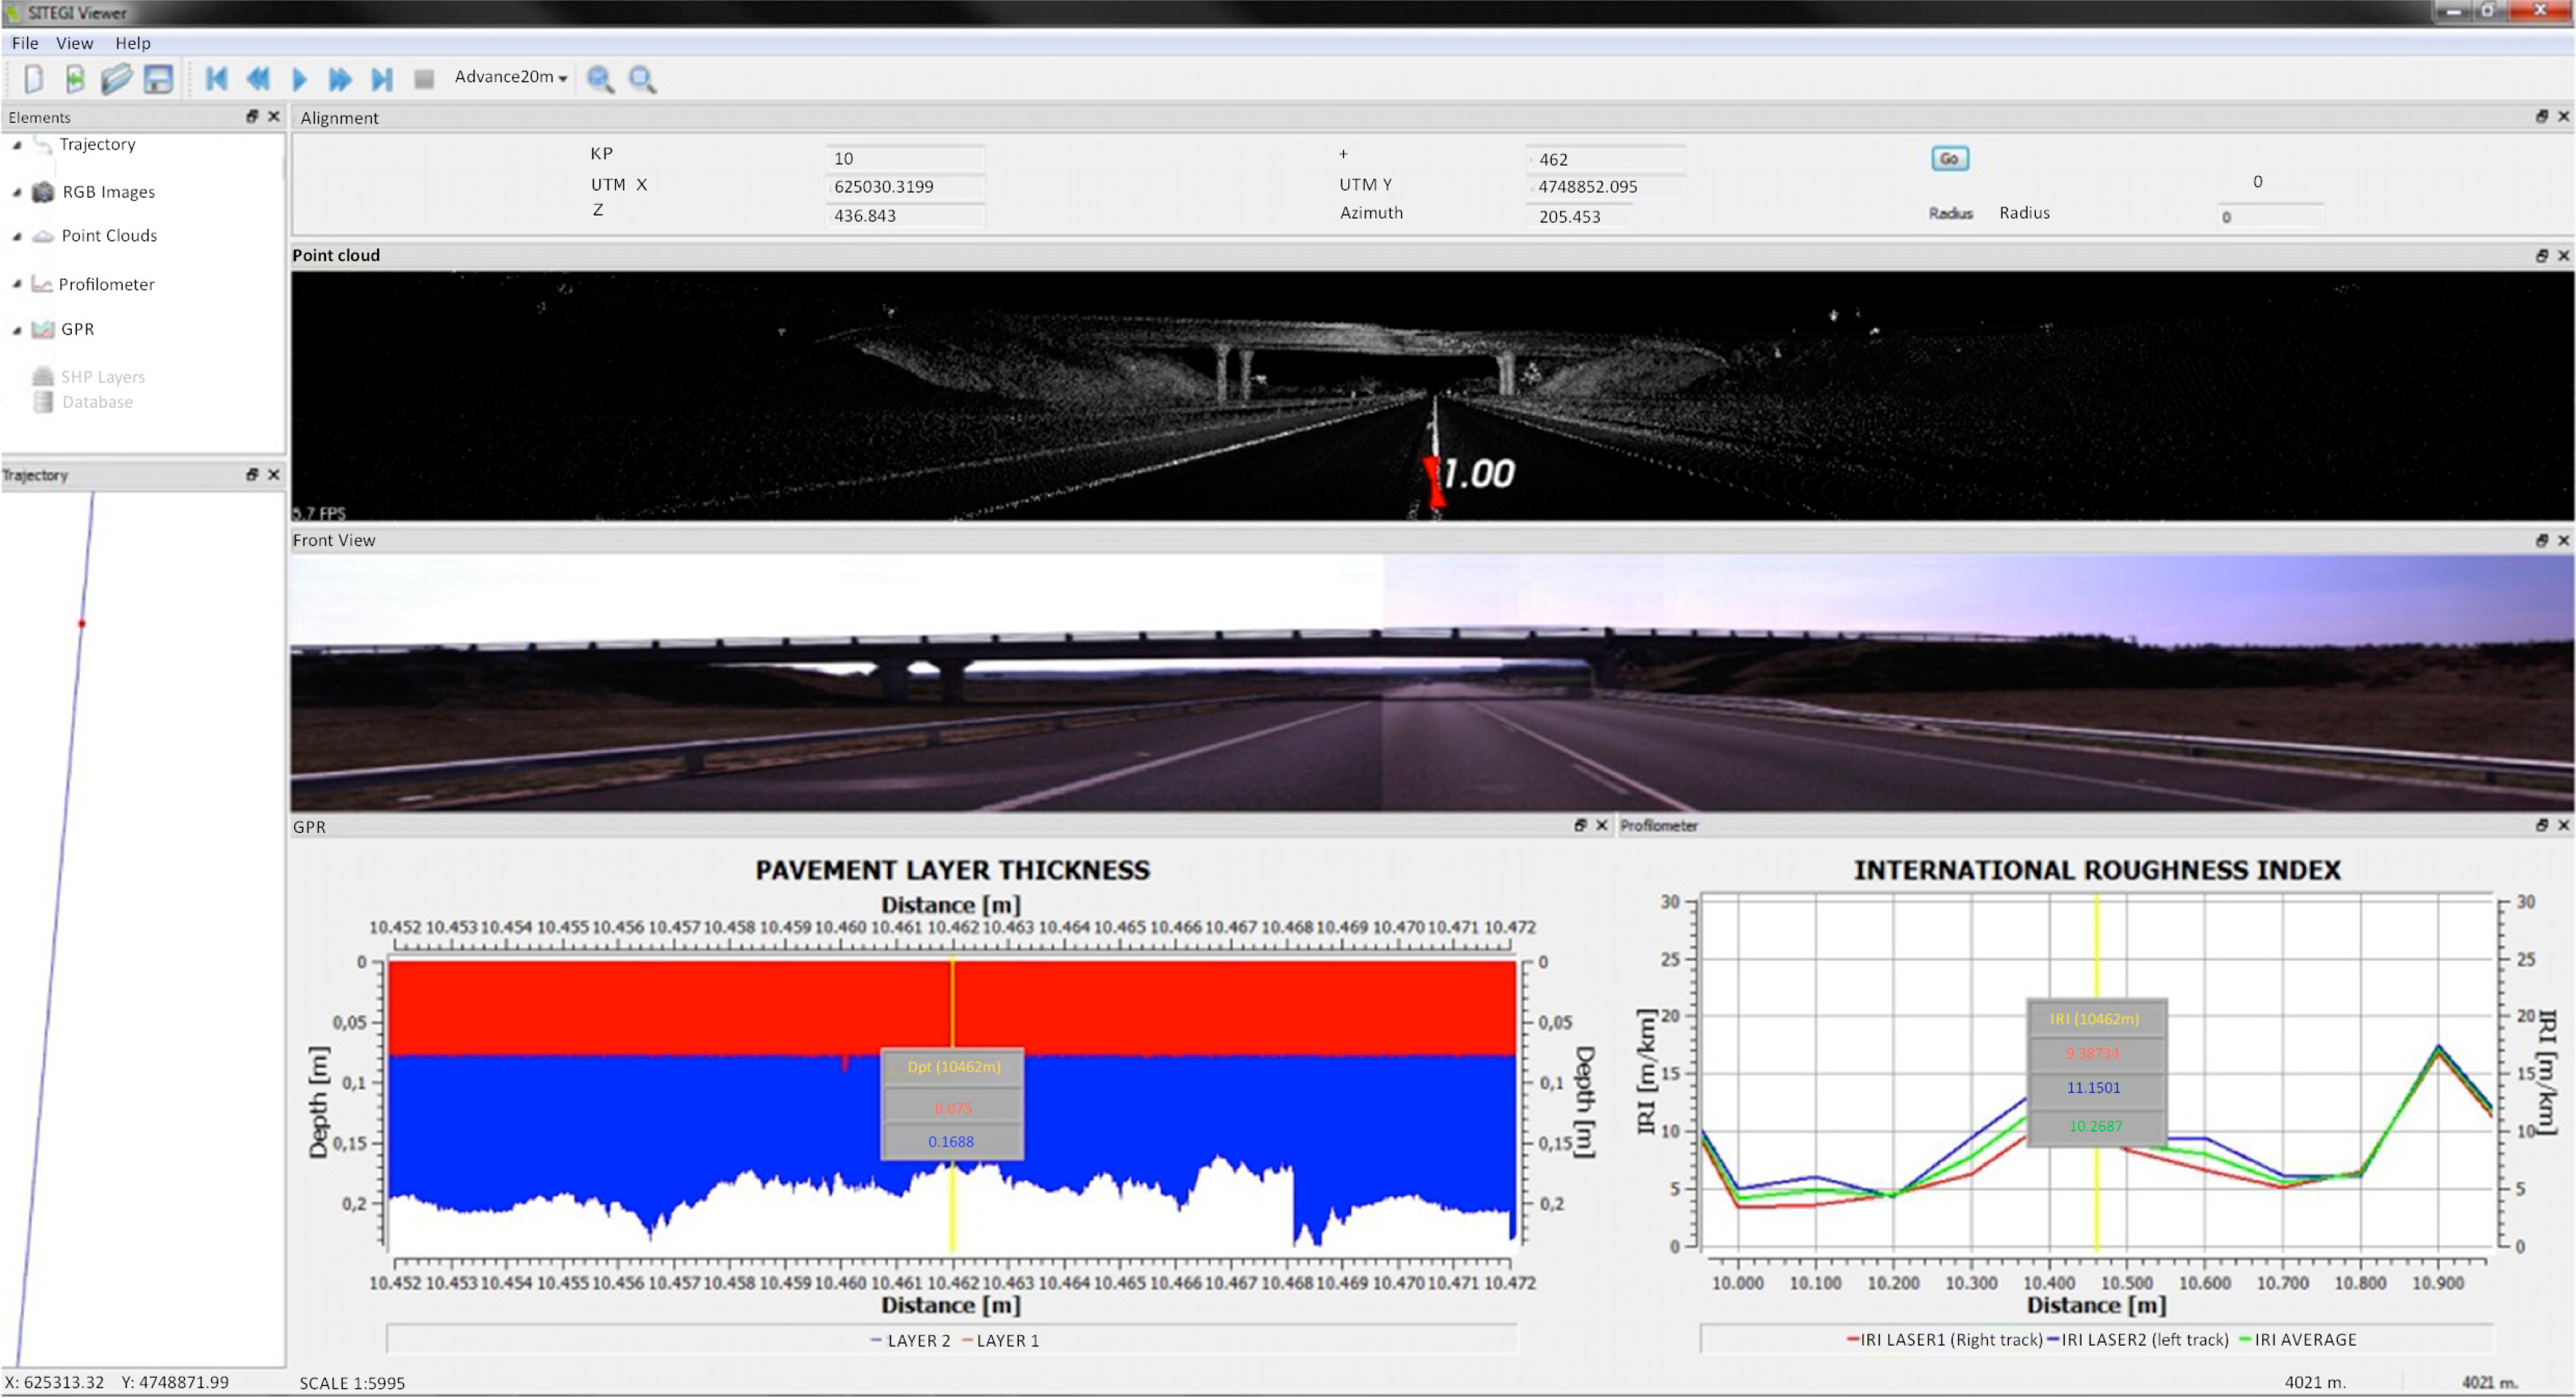
The next figure (Figure 11) shows the application interface in which (from left to right and from top to bottom) the following can be seen: the window with the trajectory of the vehicle, a colored point cloud with intensity data concerning the return of the laser beam, a RGB panoramic image, a window to evaluate pavement thickness derived from GPR data and a window with the IRI of the pavement in that stretch.
4.3. Geometric Road Inventory and Trends toward Automation
One of the original aims of the project was to develop a management system that integrates the geometric inventory and routine inspection database, whose data is directly extracted from massive inspection campaigns with the mobile inspection unit. The database developed is able to store all of the information established in the codes of the Spanish Transport Administration. These tables are fed with the geometric and radiometric data recorded by the different geomatic sensors once they have been processed. It should be noted that the description of the inventory parameters is established not only on the basis of visible measurements, but also on the basis of the measurement of non-visible elements (pavement thicknesses and the presence of anomalies on the road surface).
In recent years, the scanning technique has proven to be highly suitable for different applications that require data processing adapted to specific individual problems. Accordingly, existing methodologies must be improved to guarantee the quality of the results sought in each case. This has meant that research into geomatic technologies has advanced towards the development of automatic data-processing algorithms. The issue is further exacerbated by the fact that the management of the information acquired with geotechnologies is no trivial task and normally demands advanced knowledge of geomatics. Along these lines, another important limitation is the need to use highly specific software packages, which are usually expensive to purchase and maintain.
The use of platforms, such as MATLAB, is a highly suitable option, because they operate with a high-level technical computing language and offer an interactive environment for numerical calculus, visualization and the programming of algorithms for the automatic processing of point clouds. Several algorithms oriented towards the automation of the processes required for the inspection of road infrastructures, and structural assessment, can be found in the works of [19–22].
5. Conclusions
This work offers a review of the circumstances in which geomatic technologies were successfully applied to the structural assessment of infrastructures associated with roads. Initially, the photogrammetric and scanning laser techniques were successfully exploited to construct structural models that allowed an assessment of the structural safety of bridges. In these works, the detailed geometric models generated with the geomatic technologies were adapted for integration in different methods and calculation theories of these structures, from both 2D and 3D perspectives. Following this, thanks to the development of the scanning technique for mobile technology, vehicles integrating several synchronized geomatic sensors were built up for the documentation and assessment of road infrastructures.
Within a strategy aimed at automation during the management and maintenance tasks involved in road infrastructures, the development of new instruments for advanced inventorying/inspection that will allow the necessary information to be gathered from the efficient management of road infrastructures is considered to be crucial. The challenge addressed here consisted in the use of new vehicles with automated sensor systems for the acquisition of large volumes of geolocalized data that were later digitalized in situ (laser scanner, georadar, thermography, RGB cameras, profilometry, etc.). The development of an integrated management platform that offers a further step forwards as regards the objectivity and quality of the results of the inspection provides a noteworthy improvement in the productivity of all of the associated tasks and an improvement in the safety conditions of operators.
To exploit the whole volume of data, an integrated management platform was developed. Supported by a 3D GIS, this permitted the management of the geometric inventorying and inspection tasks of linear structures according to State norms concerning roads. This management platform allows operators to get into a virtual reality environment to complete all of the inspection tasks.
The present work shows that geomatic methods can not only contribute to documenting structures, but also that they are steadily becoming the basic sensors for the exploration, management and efficient maintenance of roads and their associated infrastructures.
Acknowledgments
This work has been partially supported by the Spanish Ministry of Economy and Competitiveness through the project “HERMES-S3D: Healthy and Efficient Routes in Massive Open-Data based Smart Cities (Ref. TIN2013-46801-C4-4-R) and by Xunta de Galicia (Grant No. CN2012/269).
Author Contributions
All authors contributed extensively to the work presented in this paper.
Conflicts of Interest
The authors declare no conflict of interest.
References
- Dirección General de Tráfico. Principales Cifras de la Siniestralidad Vial España 2013; Dirección General de Tráfico: Madrid, Spain, 2013. [Google Scholar]
- Ministerio de Fomento. Los Transportes, y Las Infraestructuras Informe Anual 2012; Centro de Publicaciones Secretaría General Técnica: Madrid, Spain, 2013. [Google Scholar]
- Transportation Research Board 2013. In National Cooperative Highway Research Program 2013; National Academy of Sciences USA: Washington, DC, USA, 2013.
- González, H.; Riveiro, B.; Armesto, J.; Arias, P. Verification artifact for photogrammetric measurement systems. Opt. Eng 2011, 50. [Google Scholar] [CrossRef]
- Riegl Laser Measurement Systems. Available online: http://www.riegl.com/nc/products/terrestrial-scanning/ (accessed on 5 June 2013).
- OPTECH. Homepage of the Company OPTECH. Available online: http://www.optech.ca (accessed on 5 June 2011).
- Puente, I.; González, H.; Martínez, J.; Arias, P. Review of mobile mapping and surveying technologies. Measurement 2013, 46, 2127–2145. [Google Scholar]
- Luhmann, T.; Robson, S.; Stephen, K; Harley, I. Close Range Photogrammetry: Principles, Methods and Applications; Whittles Publishing of Caithness: Caithness, UK, 2006. [Google Scholar]
- de Carreteras, D.G. Ministerio de Fomento. In Guía para la Realización de Inventario de Obras de Paso; Centro de Publicaciones Secretaría General Técnica: Madrid, Spain, 2009. [Google Scholar]
- de Carreteras, D.G. Ministerio de Fomento. In Guía para la Realización de Inspecciones Básicas de Obras de Paso; Centro de Publicaciones Secretaría General Técnica: Madrid, Spain, 2009. [Google Scholar]
- Ghilani, C.D.; Wolf, P.R. Adjustment Computations: Spatial Data Analysis, 4th ed.; John Wiley and Sons: New Jersey, NJ, USA, 2006. [Google Scholar]
- Kalman, R.E. A new approach to linear filtering and prediction problems. J. Basic Eng 1960, 82, 35–45. [Google Scholar]
- Lourenço, P.B. Computational Strategies for Masonry Structures; Delft University: Delft, The Netherlands, 1996. [Google Scholar]
- Riveiro, B.; Morer, P.; Arias, P.; de Arteaga, I. Terrestrial laser scanning and limit analysis of masonry arch bridges. Constr. Build. Mater 2011, 25, 1726–1735. [Google Scholar]
- Riveiro, B.; Solla, M.; de Arteaga, I.; Arias, P.; Morer, P. A novel approach to evaluate masonry arch stability on the basis of limit analysis theory and non-destructive geometric characterization. Autom. Constr 2013, 31, 140–148. [Google Scholar]
- Riveiro, B.; Caamaño, J.C.; Arias, P.; Sanz, E. Photogrammetric 3D modelling and mechanical analysis of masonry arches: An approach based on a discontinuous model of voussoirs. Autom. Constr 2011, 20, 380–388. [Google Scholar]
- Carr, A.J.; Jáuregui, D.; Riveiro, B.; Arias, P.; Armesto, J. Structural evaluation of historic masonry arch bridges based on first hinge formation. Constr. Build. Mater 2013, 47, 569–578. [Google Scholar]
- Sayers, M.W.; Gillespie, T.D.; Paterson, W.D. Guidelines for the conduct and calibration of road roughness measurements. World Bank Tech 1986, 46. [Google Scholar]
- Milani, G.; Esquivel, Y.W.; Lourenço, P.; Riveiro, P.; Oliveira, D.V. Characterization of the response of quasi-periodic masonry: Geometrical investigation, homogenization and application to the Guimarães Castle, Portugal. Eng. Struct 2013, 56, 621–641. [Google Scholar]
- Gonzalez, H.; Puente, I.; Martínez, J.; Arias, P. Automatic segmentation of road overpasses and detection of mortar efflorescence using mobile LiDAR data. Opt. Laser Technol. 2013, 54, 353–361. [Google Scholar]
- Riveiro, B.; González, H.; Varela, M.; Jauregui, D.V. Validation of terrestrial laser scanning and photogrammetry techniques for the measurement of vertical underclearance and beam geometry in structural inspection of bridges. Measurement 2013, 46, 784–794. [Google Scholar]
- Holgado, A.; Gonzalez-Aguilera, D.; Arias, P.; Martinez, J. Semiautomatic extraction of road horizontal alignment from a mobile LiDAR system. Comput.-Aided Civil Infrastruct. Eng 2014. [Google Scholar] [CrossRef]


© 2014 by the authors; licensee MDPI, Basel, Switzerland This article is an open access article distributed under the terms and conditions of the Creative Commons Attribution license (http://creativecommons.org/licenses/by/3.0/).
Share and Cite
Villarino, A.; Riveiro, B.; Martínez-Sánchez, J.; Gonzalez-Aguilera, D. Successful Applications of Geotechnologies for the Evaluation of Road Infrastructures. Remote Sens. 2014, 6, 7800-7818. https://doi.org/10.3390/rs6087800
Villarino A, Riveiro B, Martínez-Sánchez J, Gonzalez-Aguilera D. Successful Applications of Geotechnologies for the Evaluation of Road Infrastructures. Remote Sensing. 2014; 6(8):7800-7818. https://doi.org/10.3390/rs6087800
Chicago/Turabian StyleVillarino, Alberto, Belén Riveiro, Joaquín Martínez-Sánchez, and Diego Gonzalez-Aguilera. 2014. "Successful Applications of Geotechnologies for the Evaluation of Road Infrastructures" Remote Sensing 6, no. 8: 7800-7818. https://doi.org/10.3390/rs6087800