Mineral Classification of Land Surface Using Multispectral LWIR and Hyperspectral SWIR Remote-Sensing Data. A Case Study over the Sokolov Lignite Open-Pit Mines, the Czech Republic


Abstract
: Remote-sensing techniques offer an efficient alternative for mapping mining environments and assessing the impacts of mining activities. Airborne multispectral data in the thermal region and hyperspectral data in the optical region, acquired with the Airborne Hyperspectral Scanner (AHS) sensor over the Sokolov lignite open-pit mines in the Czech Republic, were analyzed. The emissivity spectrum was calculated for each vegetation-free land pixel in the longwave infrared (LWIR)-region image using the surface-emitted radiation, and the reflectance spectrum was derived from the visible, near-infrared and shortwave-infrared (VNIR–SWIR)-region image using the solar radiation reflected from the surface, after applying atmospheric correction. The combination of calculated emissivity, with the ability to detect quartz, and SWIR reflectance spectra, detecting phyllosilicates and kaolinite in particular, enabled estimating the content of the dominant minerals in the exposed surface. The difference between the emissivity values at λ = 9.68 µm and 8.77 µm was found to be a useful index for estimating the relative amount of quartz in each land pixel in the LWIR image. The absorption depth at around 2.2 µm in the reflectance spectra was used to estimate the relative amount of kaolinite in each land pixel in the SWIR image. The resulting maps of the spatial distribution of quartz and kaolinite were found to be in accordance with the geological nature and origin of the exposed surfaces and demonstrated the benefit of using data from both thermal and optical spectral regions to map the abundance of the major minerals around the mines.1. Introduction
Mining has a wide range of impacts from processes such as the generation of acid tailings, metal contaminants, and air pollution caused by smelting activities, leading to soil erosion, water pollution, vegetation disturbance, and habitat degradation. The monitoring and assessment of mining impacts, using only conventional field and laboratory measurements, is time-consuming and expensive. Remote-sensing techniques, using spaceborne, airborne and ground-based sensors, offer an efficient alternative for mapping mining environments and assessing the impacts of mining activities. With respect to mineralogy mapping, iron oxides, iron sulfates, hydroxyl-bearing minerals, and carbonates can be detected in the visible, near-infrared and shortwave-infrared (VNIR–SWIR) spectral region [1–6], enabling effective mapping of their spatial distribution. For example, ground-based and VNIR–SWIR imaging spectroscopy have been used to map the acidity level in mine environments, based on the distribution of jarosite and goethite, the indicative minerals for acid mine drainage (AMD) pollution [7–9]. On the other hand, the most abundant minerals in the Earth’s continental crust—feldspars and quartz—are featureless in the VNIR–SWIR spectral region and thus cannot be mapped based on spectral information across this region. The silicon–oxygen bond (Si–O) stretching vibrations in feldspars and quartz, as well as in other silicates, exhibit spectral features in the thermal infrared (TIR)-region, mainly in the longwave infrared (LWIR) 8.0–13 µm range [10–16].
Due to technological developments in Earth-observation remote-sensing tools, TIR remote sensing, combined with VNIR–SWIR hyperspectral remote sensing, is becoming a promising method for environmental studies; in particular, LWIR remote sensing is useful for mineral mapping studies [17–24]. Although the benefit of using both VNIR–SWIR and TIR remote-sensing data in environmental studies is well known, the number of studies devoted to this topic is still limited. The current study makes use of airborne multispectral LWIR data, along with airborne hyperspectral SWIR data, to assess the mineral content in exposed vegetation-free rocks and soils (henceforth land) in a lignite mining site in the Sokolov Basin, Czech Republic, as a case study. The mining, dumping and backfilling activities, as well as rehabilitation procedures, have changed the exposed surface. The mineralogy of the dumps and backfill material is the most important parameter determining its physical and chemical properties. The proportion of clay and quartz contents affects the material’s texture and volume. In addition, depending on water saturation, high clay content may cause the material to swell, shrink, and present heavy plastic characteristics. Therefore, mapping the distribution of the dominant minerals in the area—quartz and kaolinite—is relevant for the management or monitoring of mining sites, as well as for assessing the quality of the material used for reclamation projects. Whereas the hydroxyl-bearing mineral kaolinite, as well as other phyllosilicates, can be detected in the SWIR spectral region using the absorption feature at around 2.2 µm [25,26], quartz can only be mapped using the LWIR spectral region.
2. Tools and Methods
2.1. The Study Area
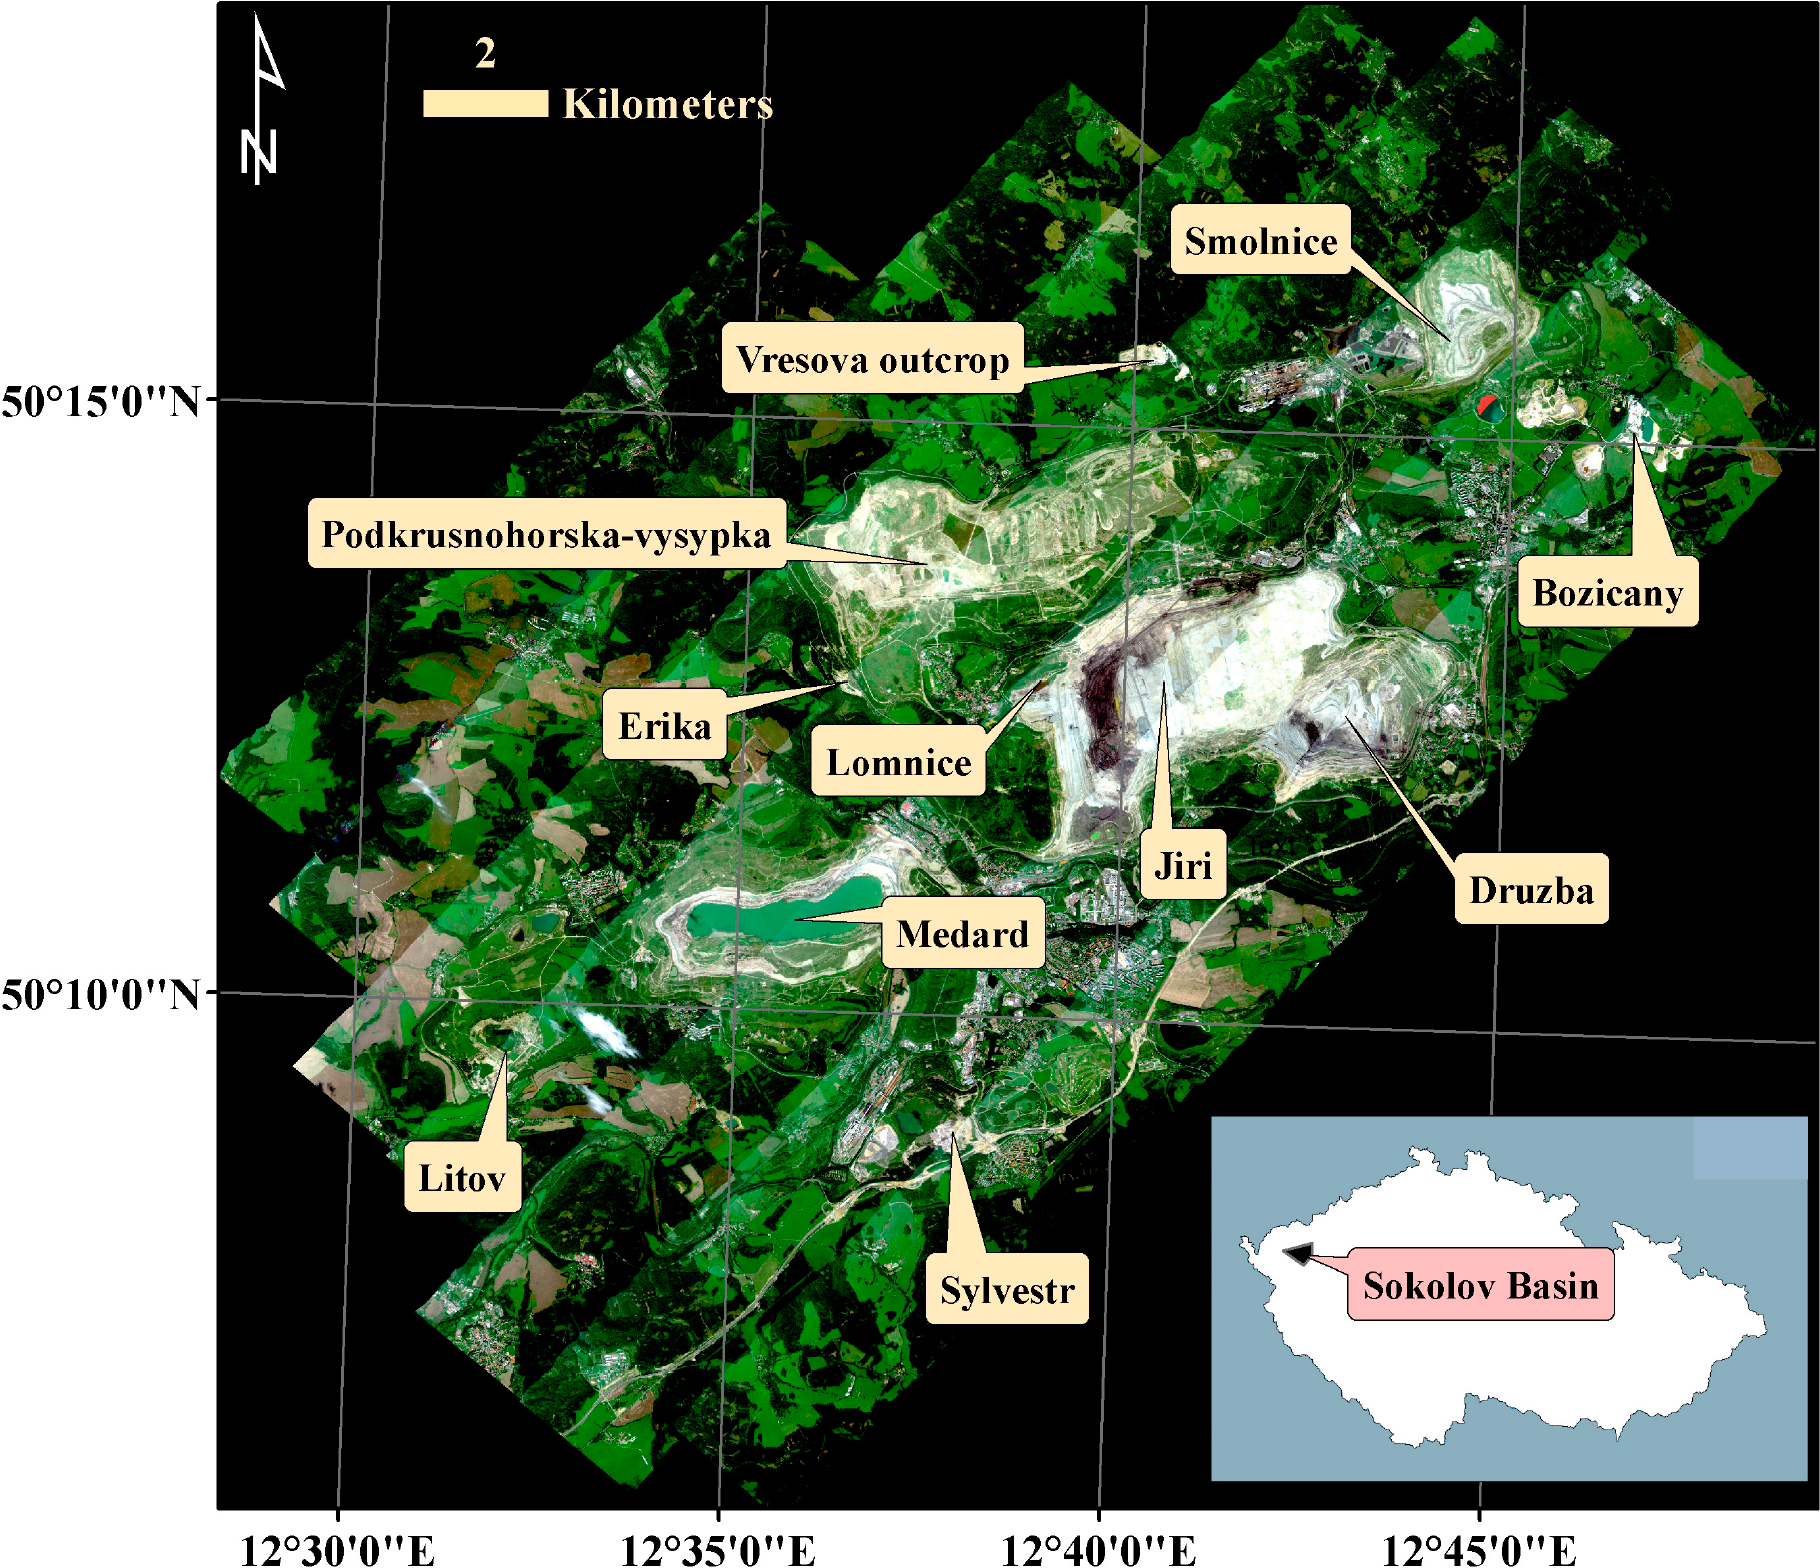
The study was performed in the Sokolov Basin in the western part of the Czech Republic (Figure 1), in a region affected by long-term extensive lignite mining. The Sokolov Basin, containing rocks of the Upper Eocene, Oligocene to Miocene age, is 8–9 km wide and up to 36 km long, with a total area of about 200 km2. Large-scale underground and surface mining operations began in the late 19th century. The mining activity and natural outcrops expose varied lithostratigraphic units, defined in four formations [27]. The basal Stare-Sedlo formation consists of well-sorted fluvial sandstones, gravel and conglomerates, and it is exposed in the Erika sand pit. Overlying the Nove Sedlo formation is predominantly volcanic rocks with coal-bearing sediments, appearing in the Druzba, Jiri, and Medard opencast pits. The Sokolov formation also appears in these pits, characterized mainly by coal seams with volcanic ejecta originating from fissures and volcanic cones and sediments. The upper Cypris formation is characterized by laminated claystones with admixtures of Ca-Mg-Fe carbonates, sulfates, sulfides, analcite, Mg-micas, and bitumen, appearing in the Jiri, Druzba, and Lomnice opencast pits [27]. The Lomnice, Medard and Sylvester pits were exploited for decades and are now abandoned. In 2009, the uppermost part of the Sokolov formation was mined in two opencast pits, Druzba and Jiri, but only the Jiri mine is still active. Long-term mining required the removal of an up to 180-m thick overburden of Cypris clay, which was stockpiled and replaced after the lignite was extracted. Part of the removed overburden material was deposited in the outer dumps—Podkrusnohorska-vysypka, Smolnice, Litov, and Medard.
Today, a great deal of effort is being devoted to rehabilitation activities, including overburden backfilling of the open pits, revegetation of dumps, and the construction of recreational areas, such as an artificial lake in the former Medard open pit.
2.2. Airborne Measurements
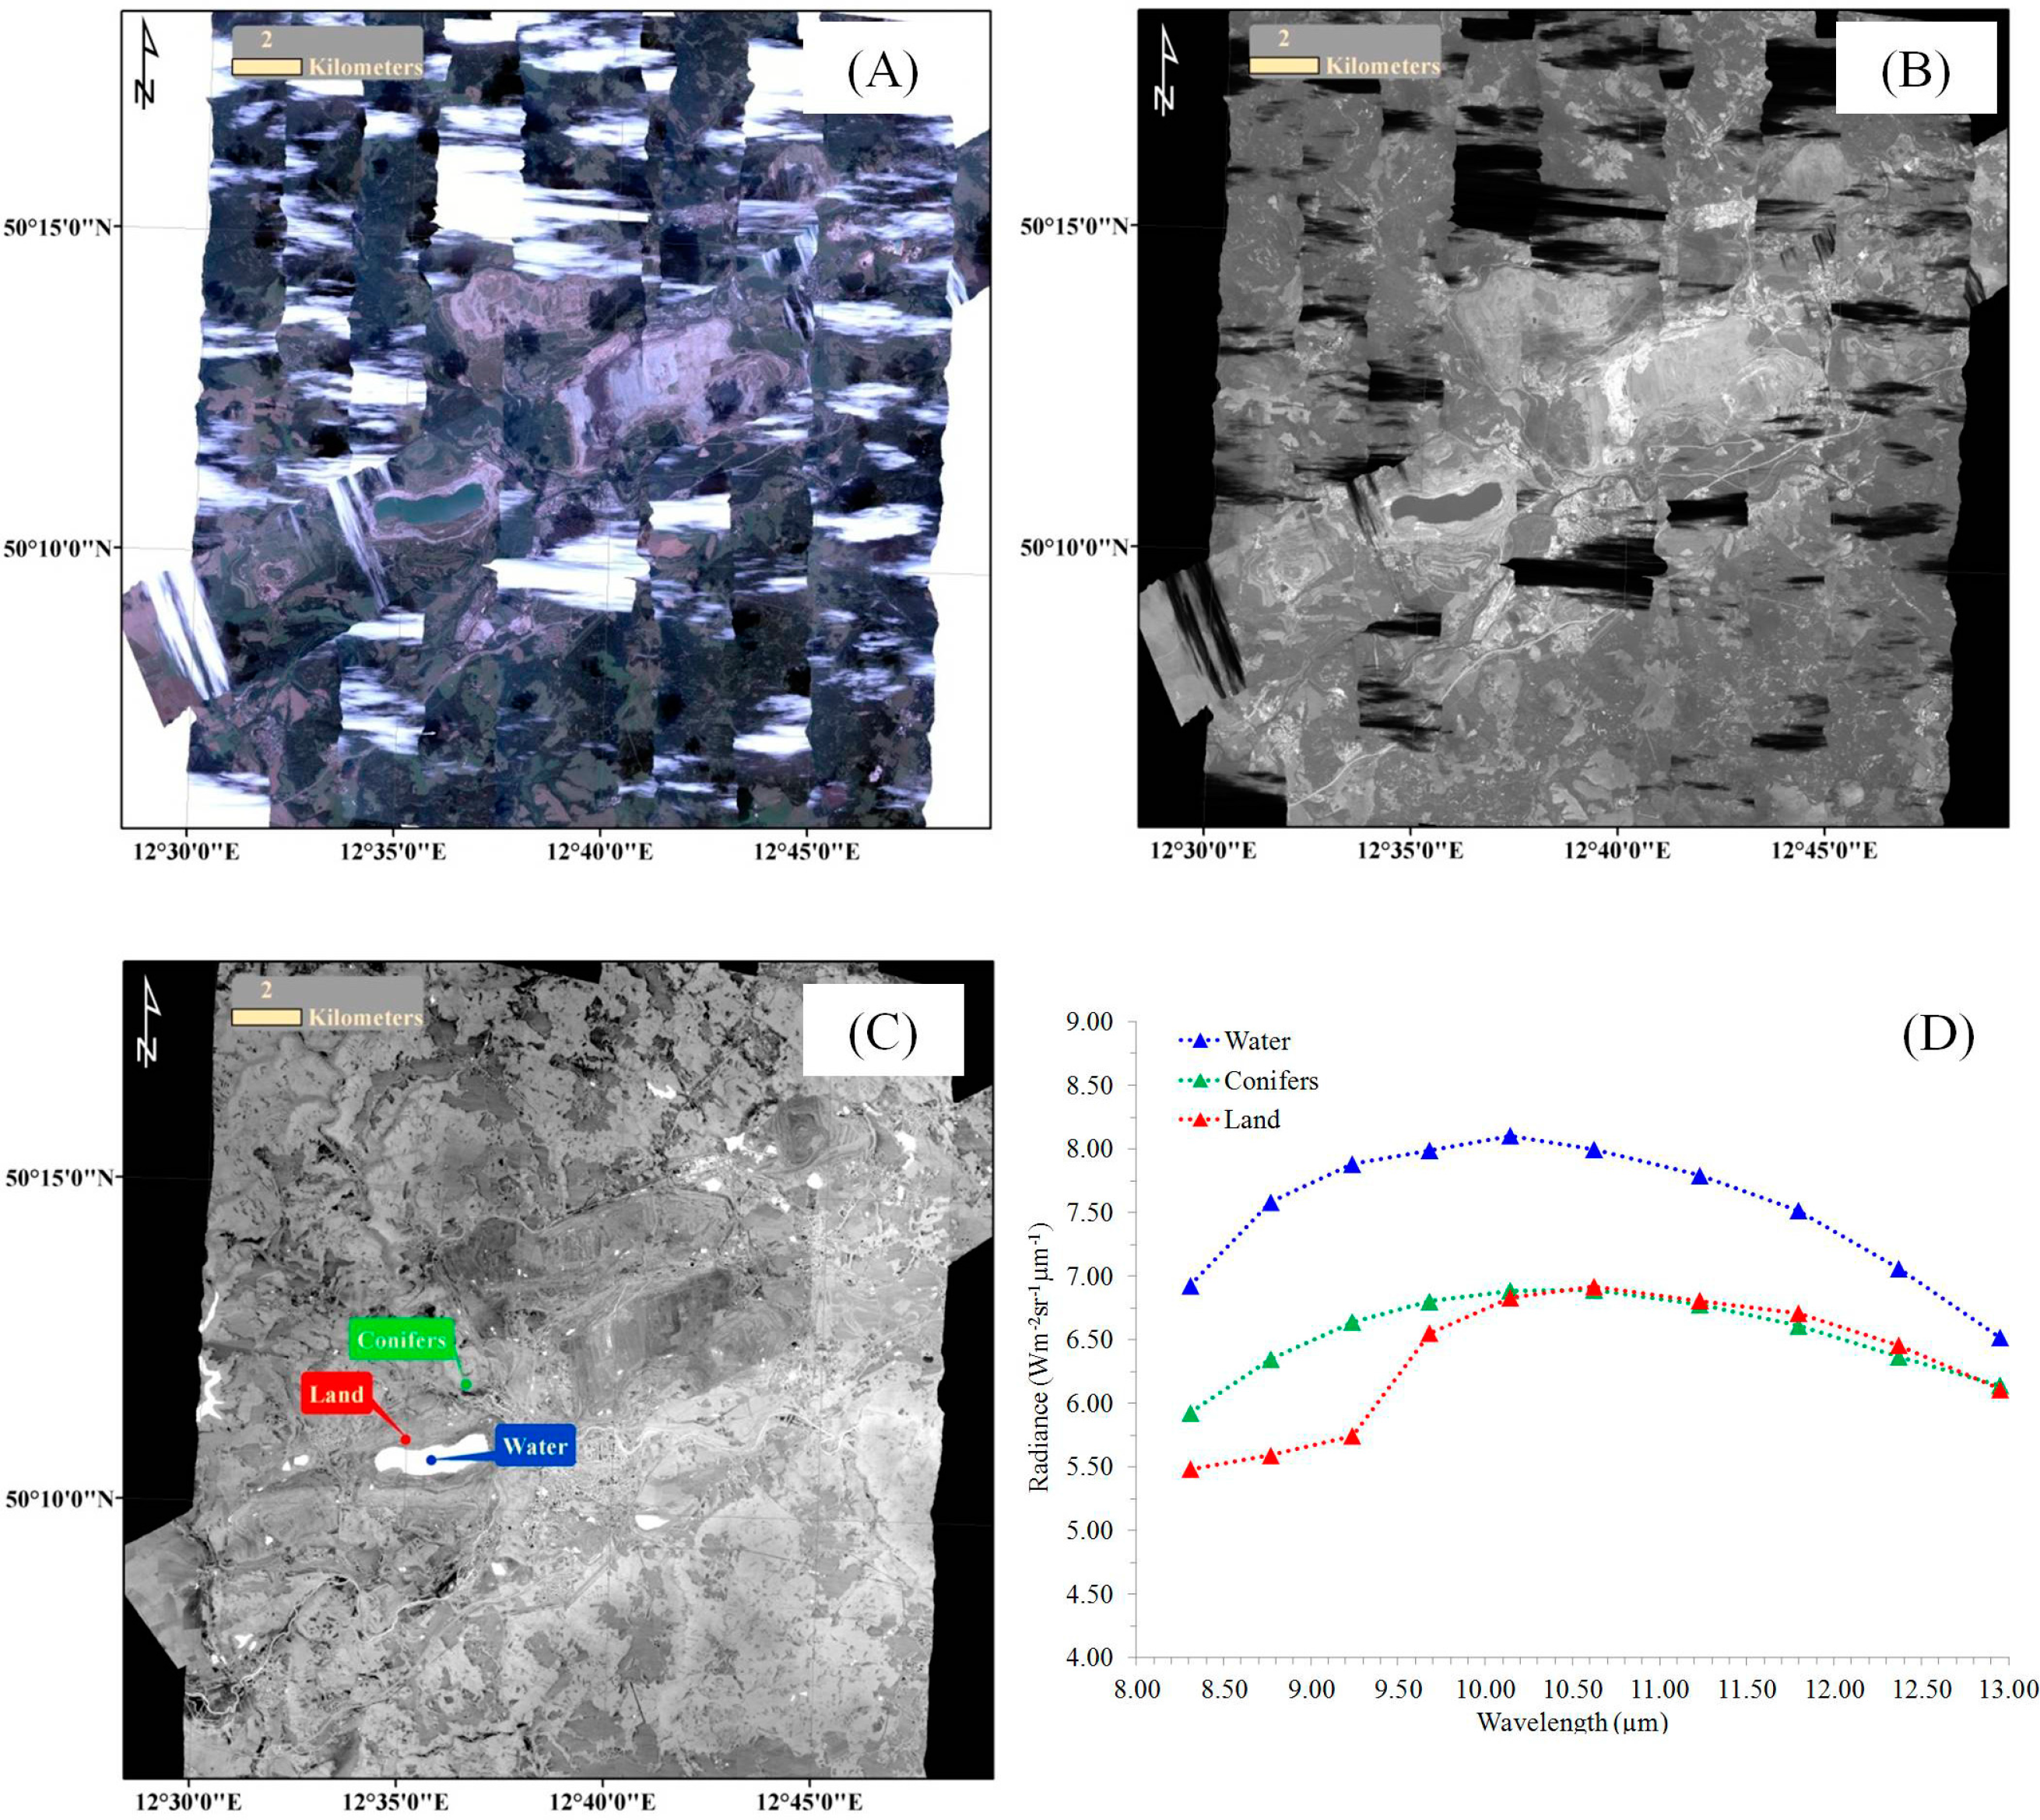
The airborne data were acquired by the Airborne Hyperspectral Scanner (AHS), an imaging 80-band line-scanner radiometer with 63 bands in the VNIR–SWIR-region, 7 bands in the midwave infrared (MWIR)-region and 10 bands in the LWIR-region [28]. The AHS has been used in several campaigns to derive surface temperature and surface emissivity over agricultural areas, forests and sand dunes [29,30]. Two flight campaigns were conducted, in collaboration with the Spanish Aerospace Institute (INTA): a daytime campaign on 19 July 2011, and a nighttime campaign on 22 July 2011. The days prior to the daytime data acquisition were characterized by dry conditions without any precipitation and temperatures higher than 25 °C. The nighttime data were also collected after a dry day, on a clear night with no precipitation, after postponement due to heavy rain. Each flight campaign included 10 flight lines (Figure 2) acquired at an altitude of 2 km above ground level, resulting in a 5-m pixel size.
2.2.1. LWIR-Region Data
Due to cloud coverage in the daytime image, herein we refer to the cloud-free nighttime LWIR data. The at-sensor radiance at wavelength λ (Lsλ) consists of three components:
Calculation of the emissivity spectrum of the surface, which represents its chemical and physical properties, from the measured at-sensor radiance spectrum using Equation (1), will assist in identifying the mineralogical nature of that surface. As a rule of thumb, the emissivity (ε) of land ranges from 0.7–1 in the entire LWIR region, and the down-welling radiance (Ld) is about one-third of the surface-emission radiance [31]. Therefore, the reflected down-welling radiance at wavelength λ, (1 − ελ)Ldλτλ, is very small and its contribution to the at-sensor radiance is negligible, reducing Equation (1) to:
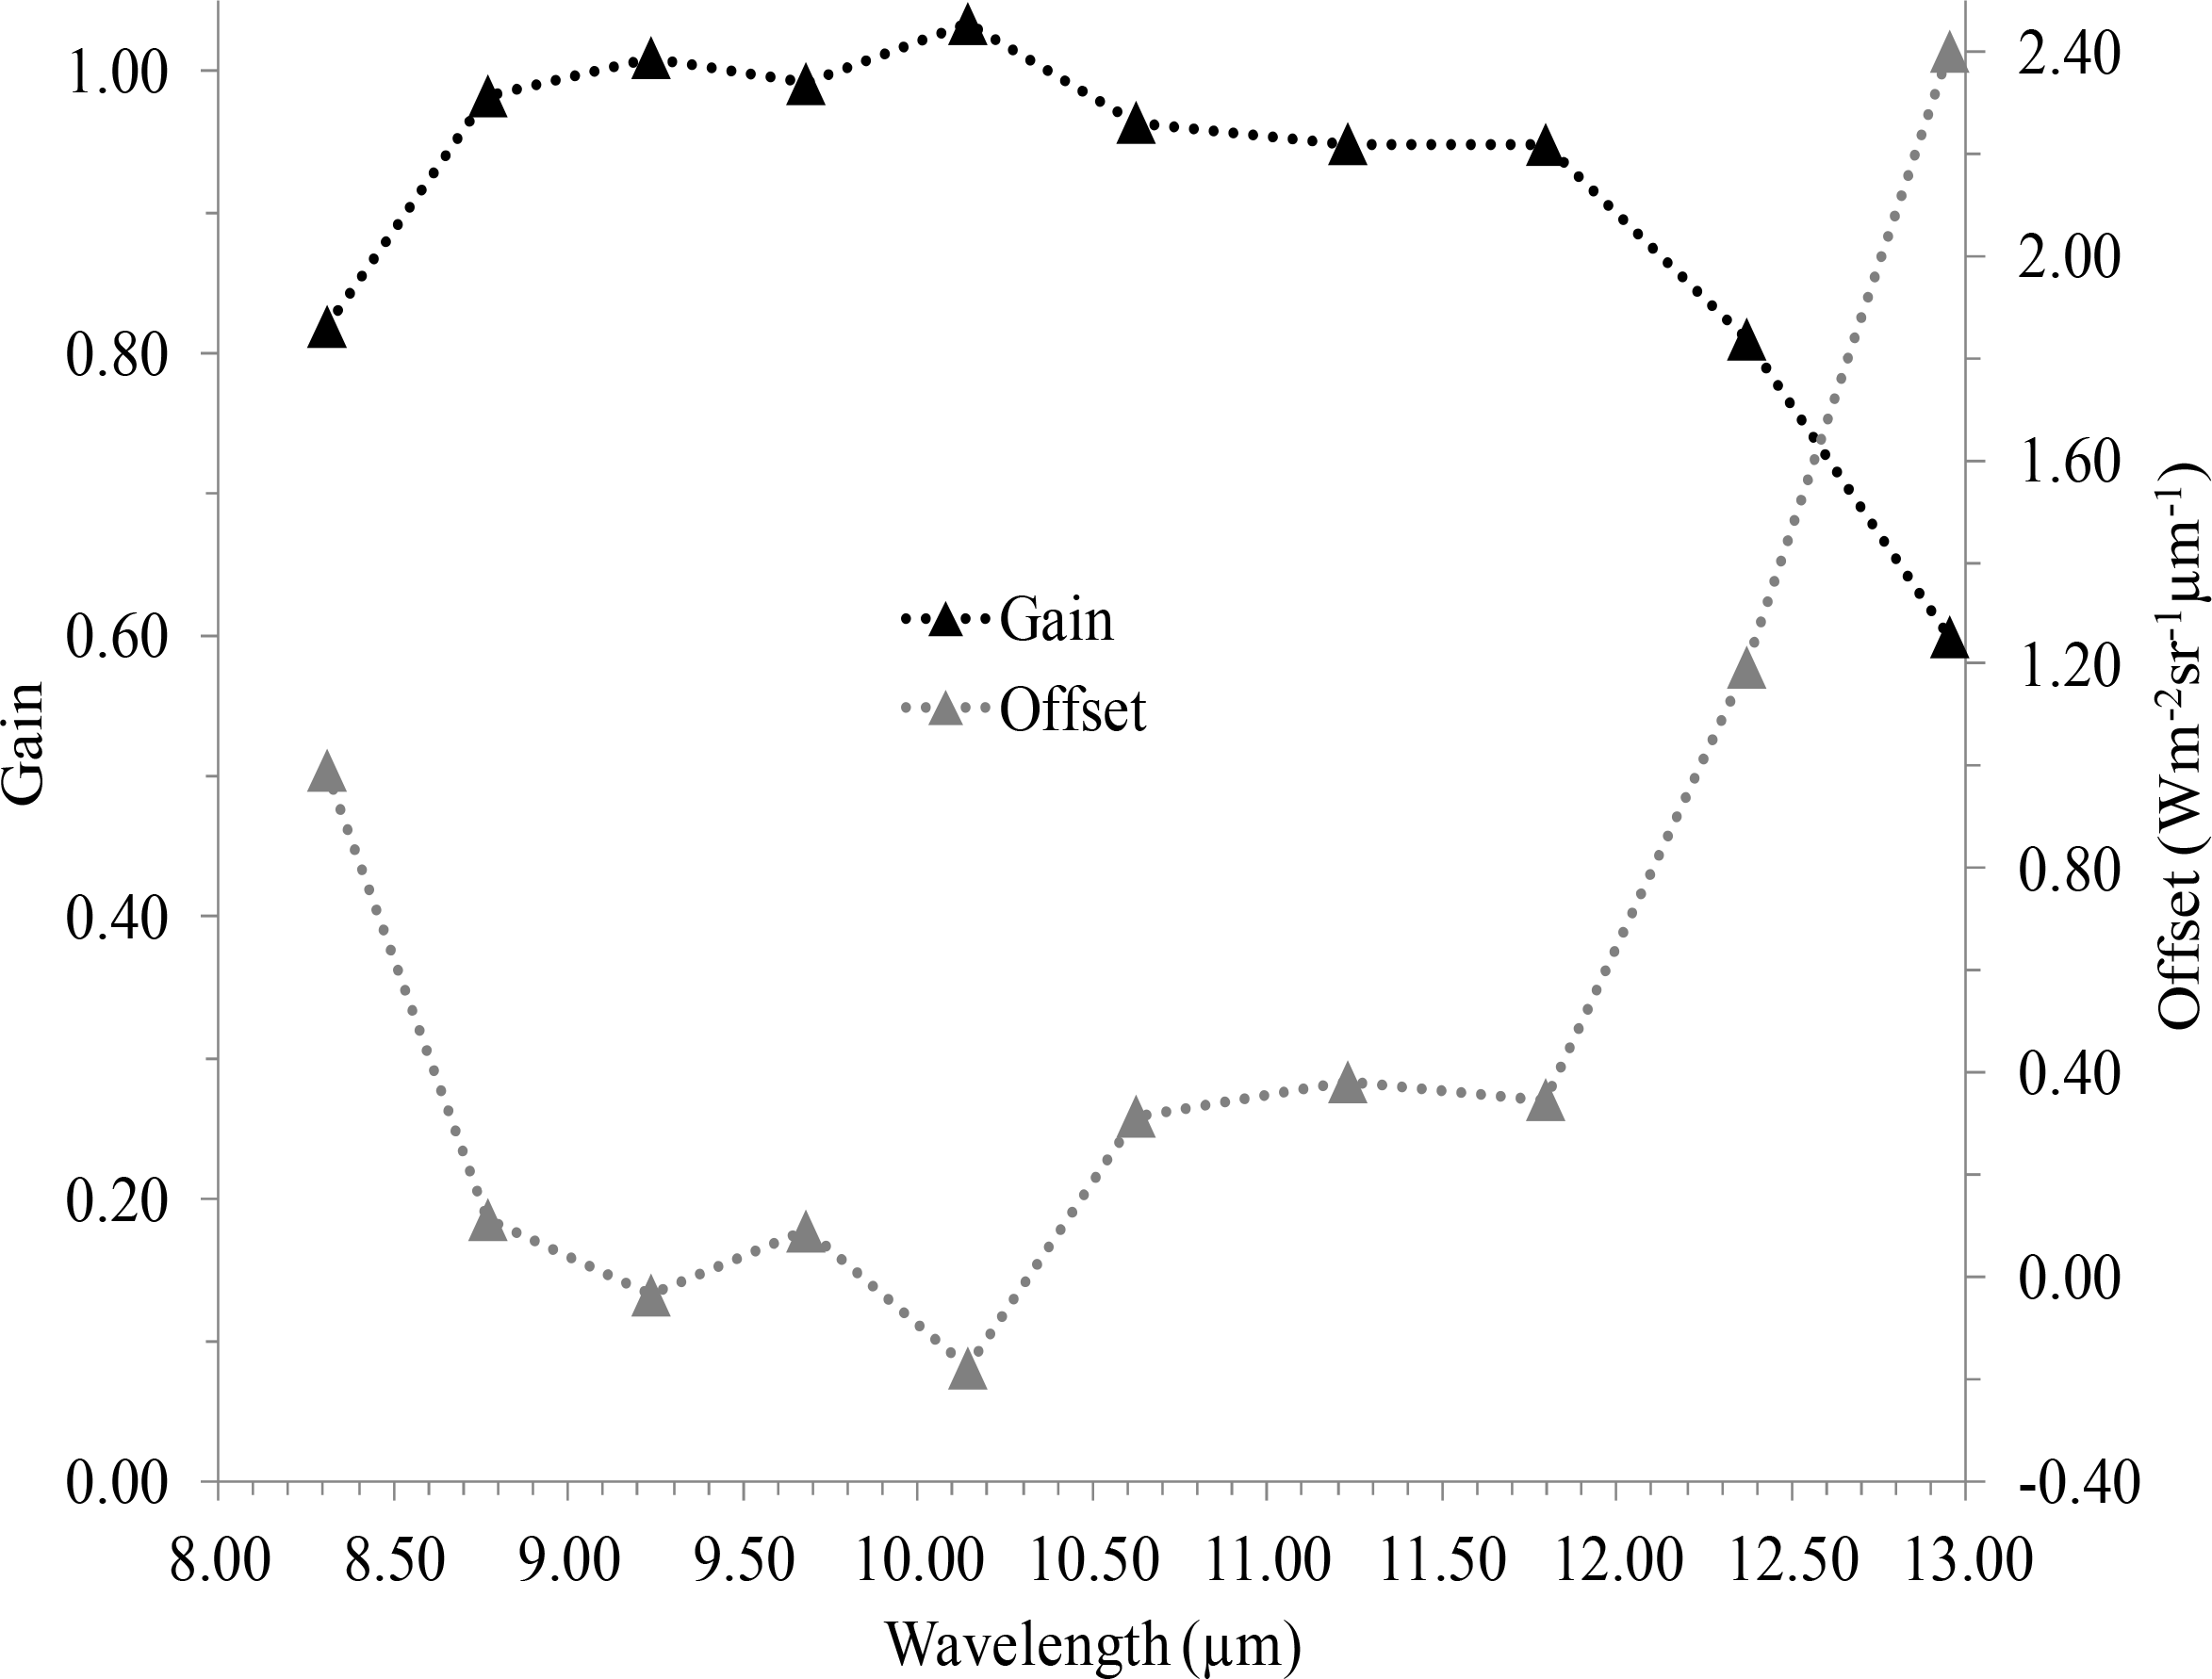
The gain and offset values, assuming they are equal at all pixels across the image, were applied to each land pixel, the at-sensor radiance was fitted with a tangent blackbody radiation curve, which was calculated using the IDL algorithm, and the emissivity at wavelength λ was calculated according to:
The emissivity spectrum of each land pixel in the resultant emissivity image was then analyzed.
2.2.2. VNIR–SWIR-Region Data
The AHS image was atmospherically corrected by applying the ACORN software [33], resulting in a reflectance image. The reflectance spectrum in the SWIR region (2.0–2.4 µm) of each land pixel, in cloud-free areas in the image, was then analyzed.
2.3. Ground Measurements
2.3.1. LWIR-Region Ground Measurements
Samples of material from land surface (0–2 cm depth) were collected at selected points in the study area. These samples were measured with an SR-5000N ground spectroradiometer, with 82 bands in the 8–13 µm region, at CI-Systems, Israel [34]. The samples were placed in Petri dishes, exposed to the sun (with an outdoor air temperature of 35 °C) for about an hour, and then one sample at a time was placed on a 45°-inclined stand at a distance of about 3 m from the spectroradiometer, and its at-sensor radiance was measured. The emissivity spectrum of each sample was then calculated according to Equation (1), with Lbb(T) as the fitted tangent blackbody radiation curve and down-welling radiance (Ld) as measured with a mirror (Figure 5), and with τλ = 1 and Lpλ = 0.
2.3.2. Laboratory Measurements
Various land samples were measured for the ground truth data-set with a Philips X’Pert X-Ray Diffractometer (XRD) at the Czech Geological Survey for mineralogical analysis. The X-ray powder diffraction patterns were obtained using CuKα radiation and a graphite secondary monochromator. The whole-sample random patterns were collected in the angular range from 2° to 70° 2ϴ with steps of 0.05° 2ϴ. Oriented clay-fraction specimens (fraction <2 µm) were prepared by a conventional sedimentation method [35]. The oriented clay specimens were analyzed after air-drying and after saturation for 10 h with ethylene-glycol vapor at 60°C. Their diffraction data were acquired in the angular range of 2–50° 2ϴ with steps of 0.05° 2ϴ. Mixed-layered minerals were identified by comparing the analyzed XRD patterns of the ethylene-glycolated oriented clay fraction with the modeled XRD patterns obtained by NEWMOD code [36].
In addition, a technical quantitative silicate analysis (ČSN 720100) was conducted. The analysis quantified the abundance of the different elements in each sample, presented as their oxides SiO2, Al2O3, TiO2, FeO, Na2O, K2O, and MgO.
3. Results and Discussion
3.1. LWIR-Region Results
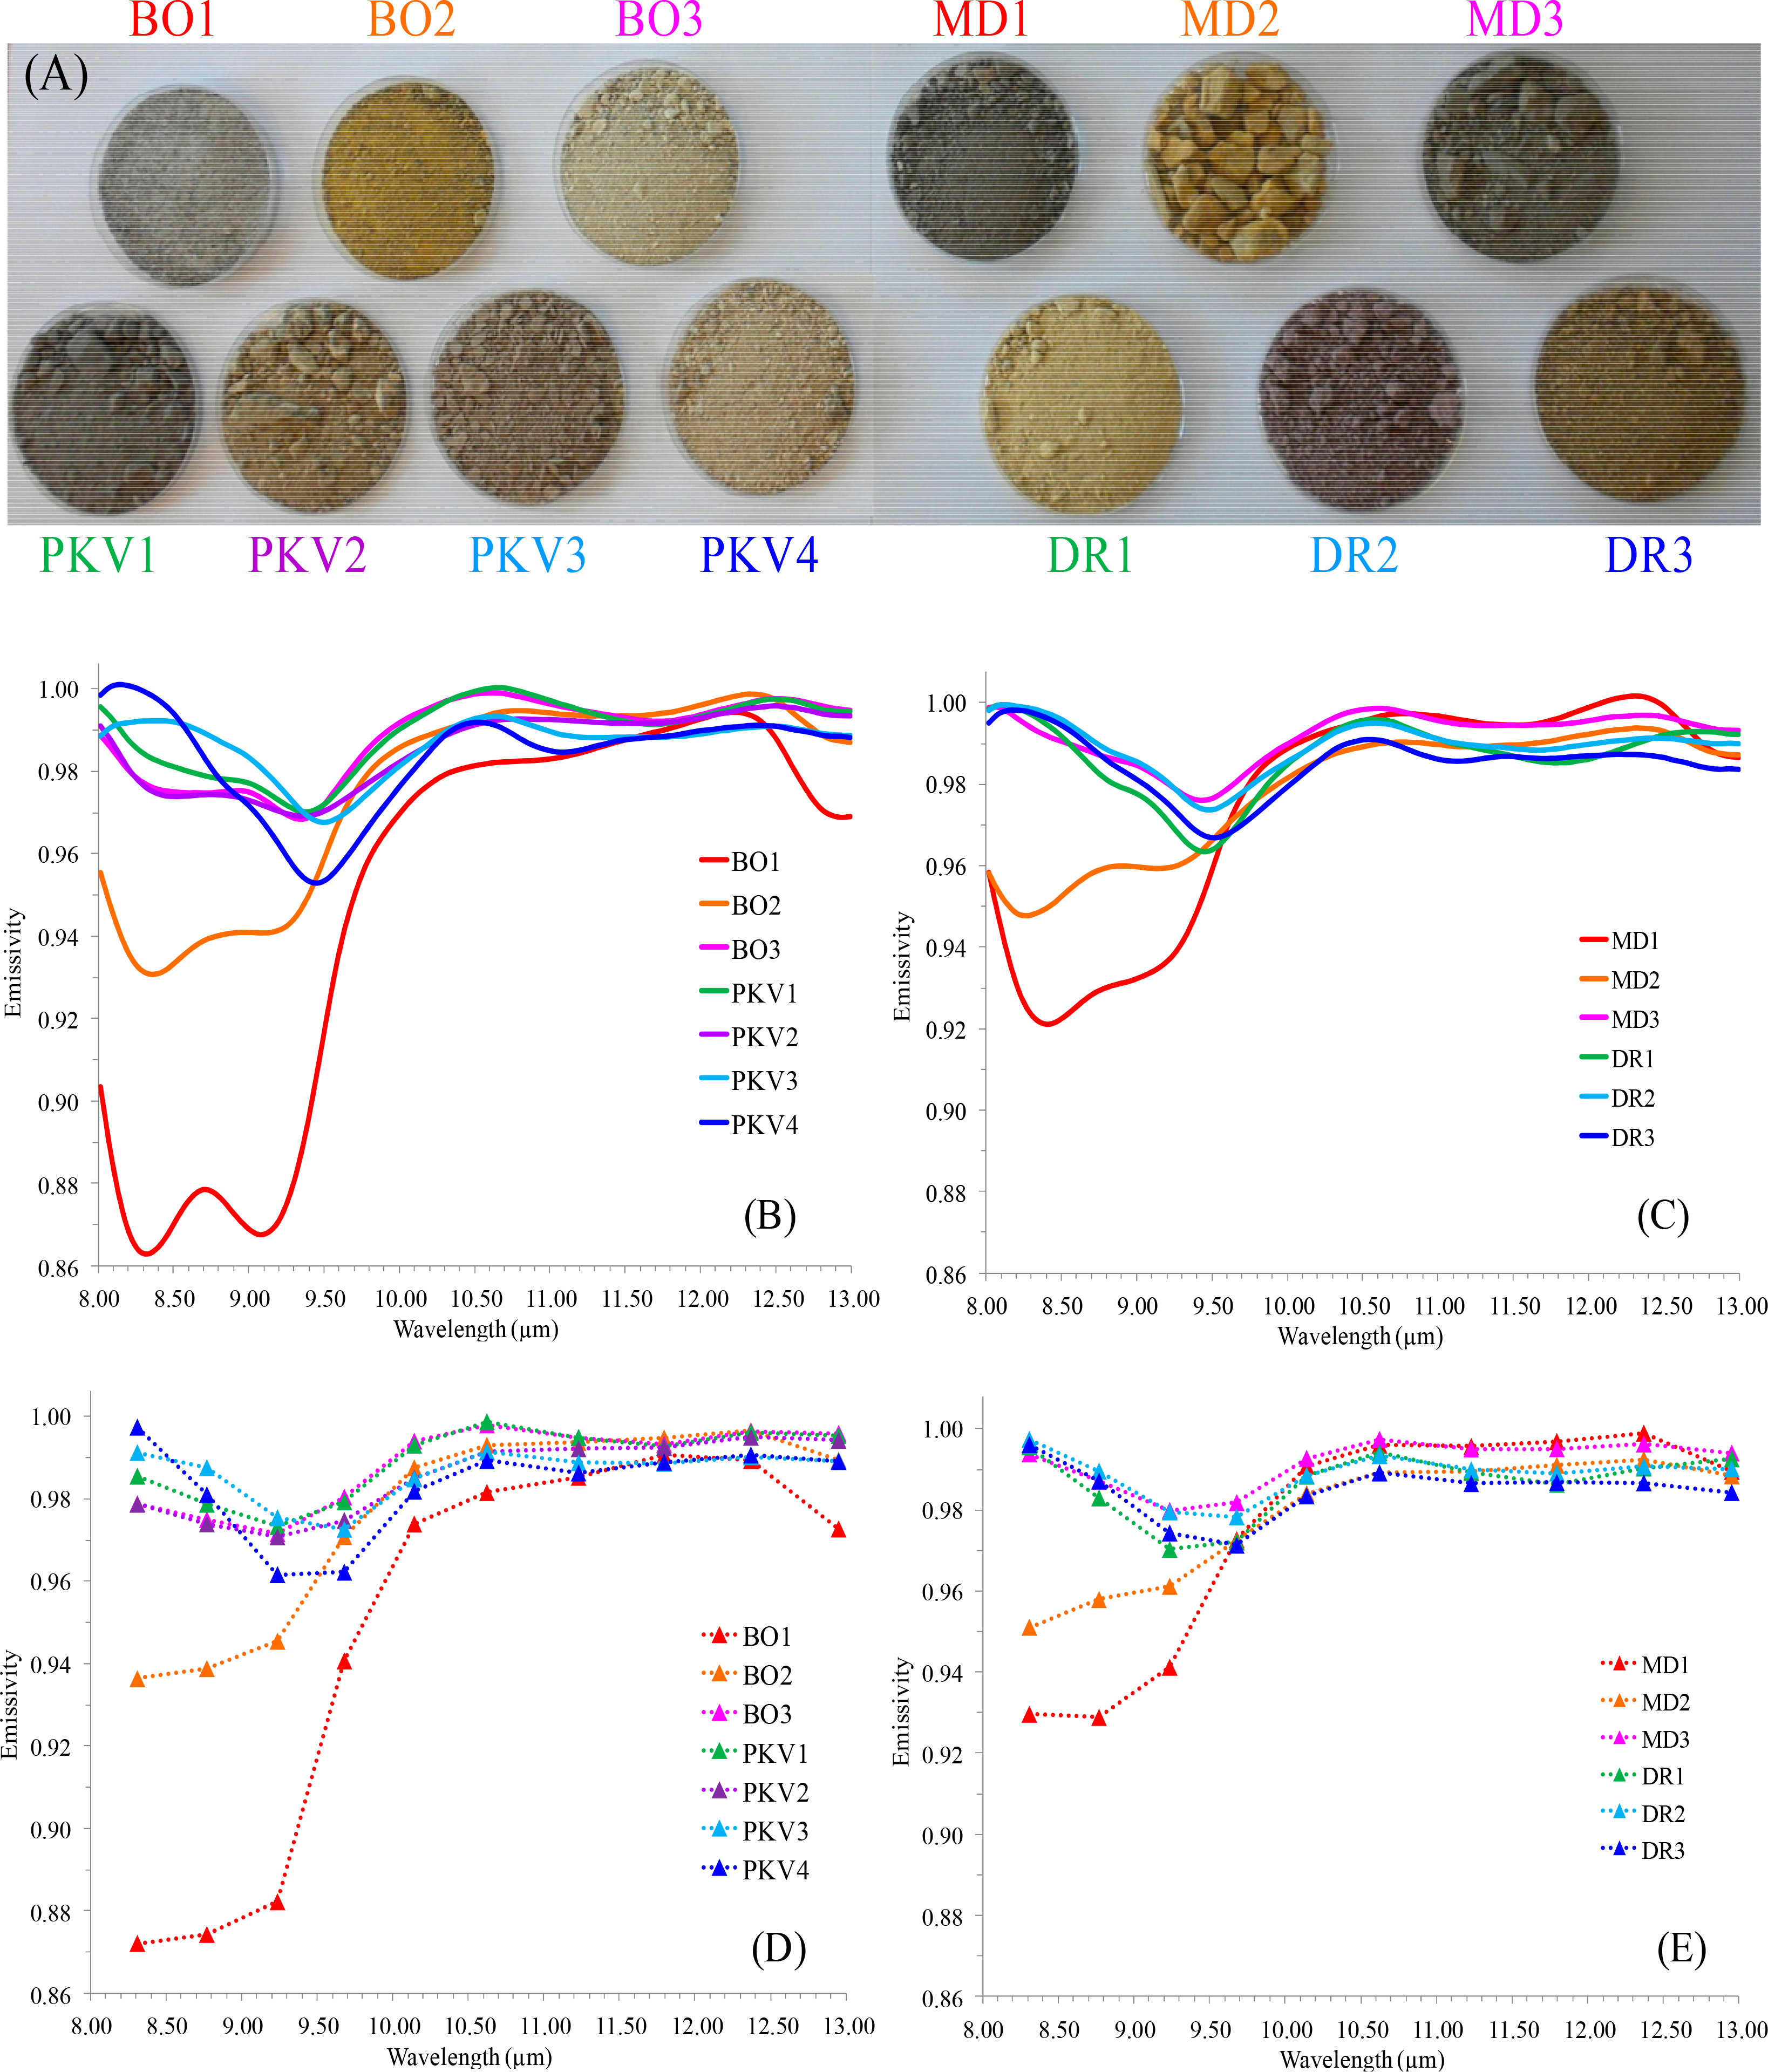
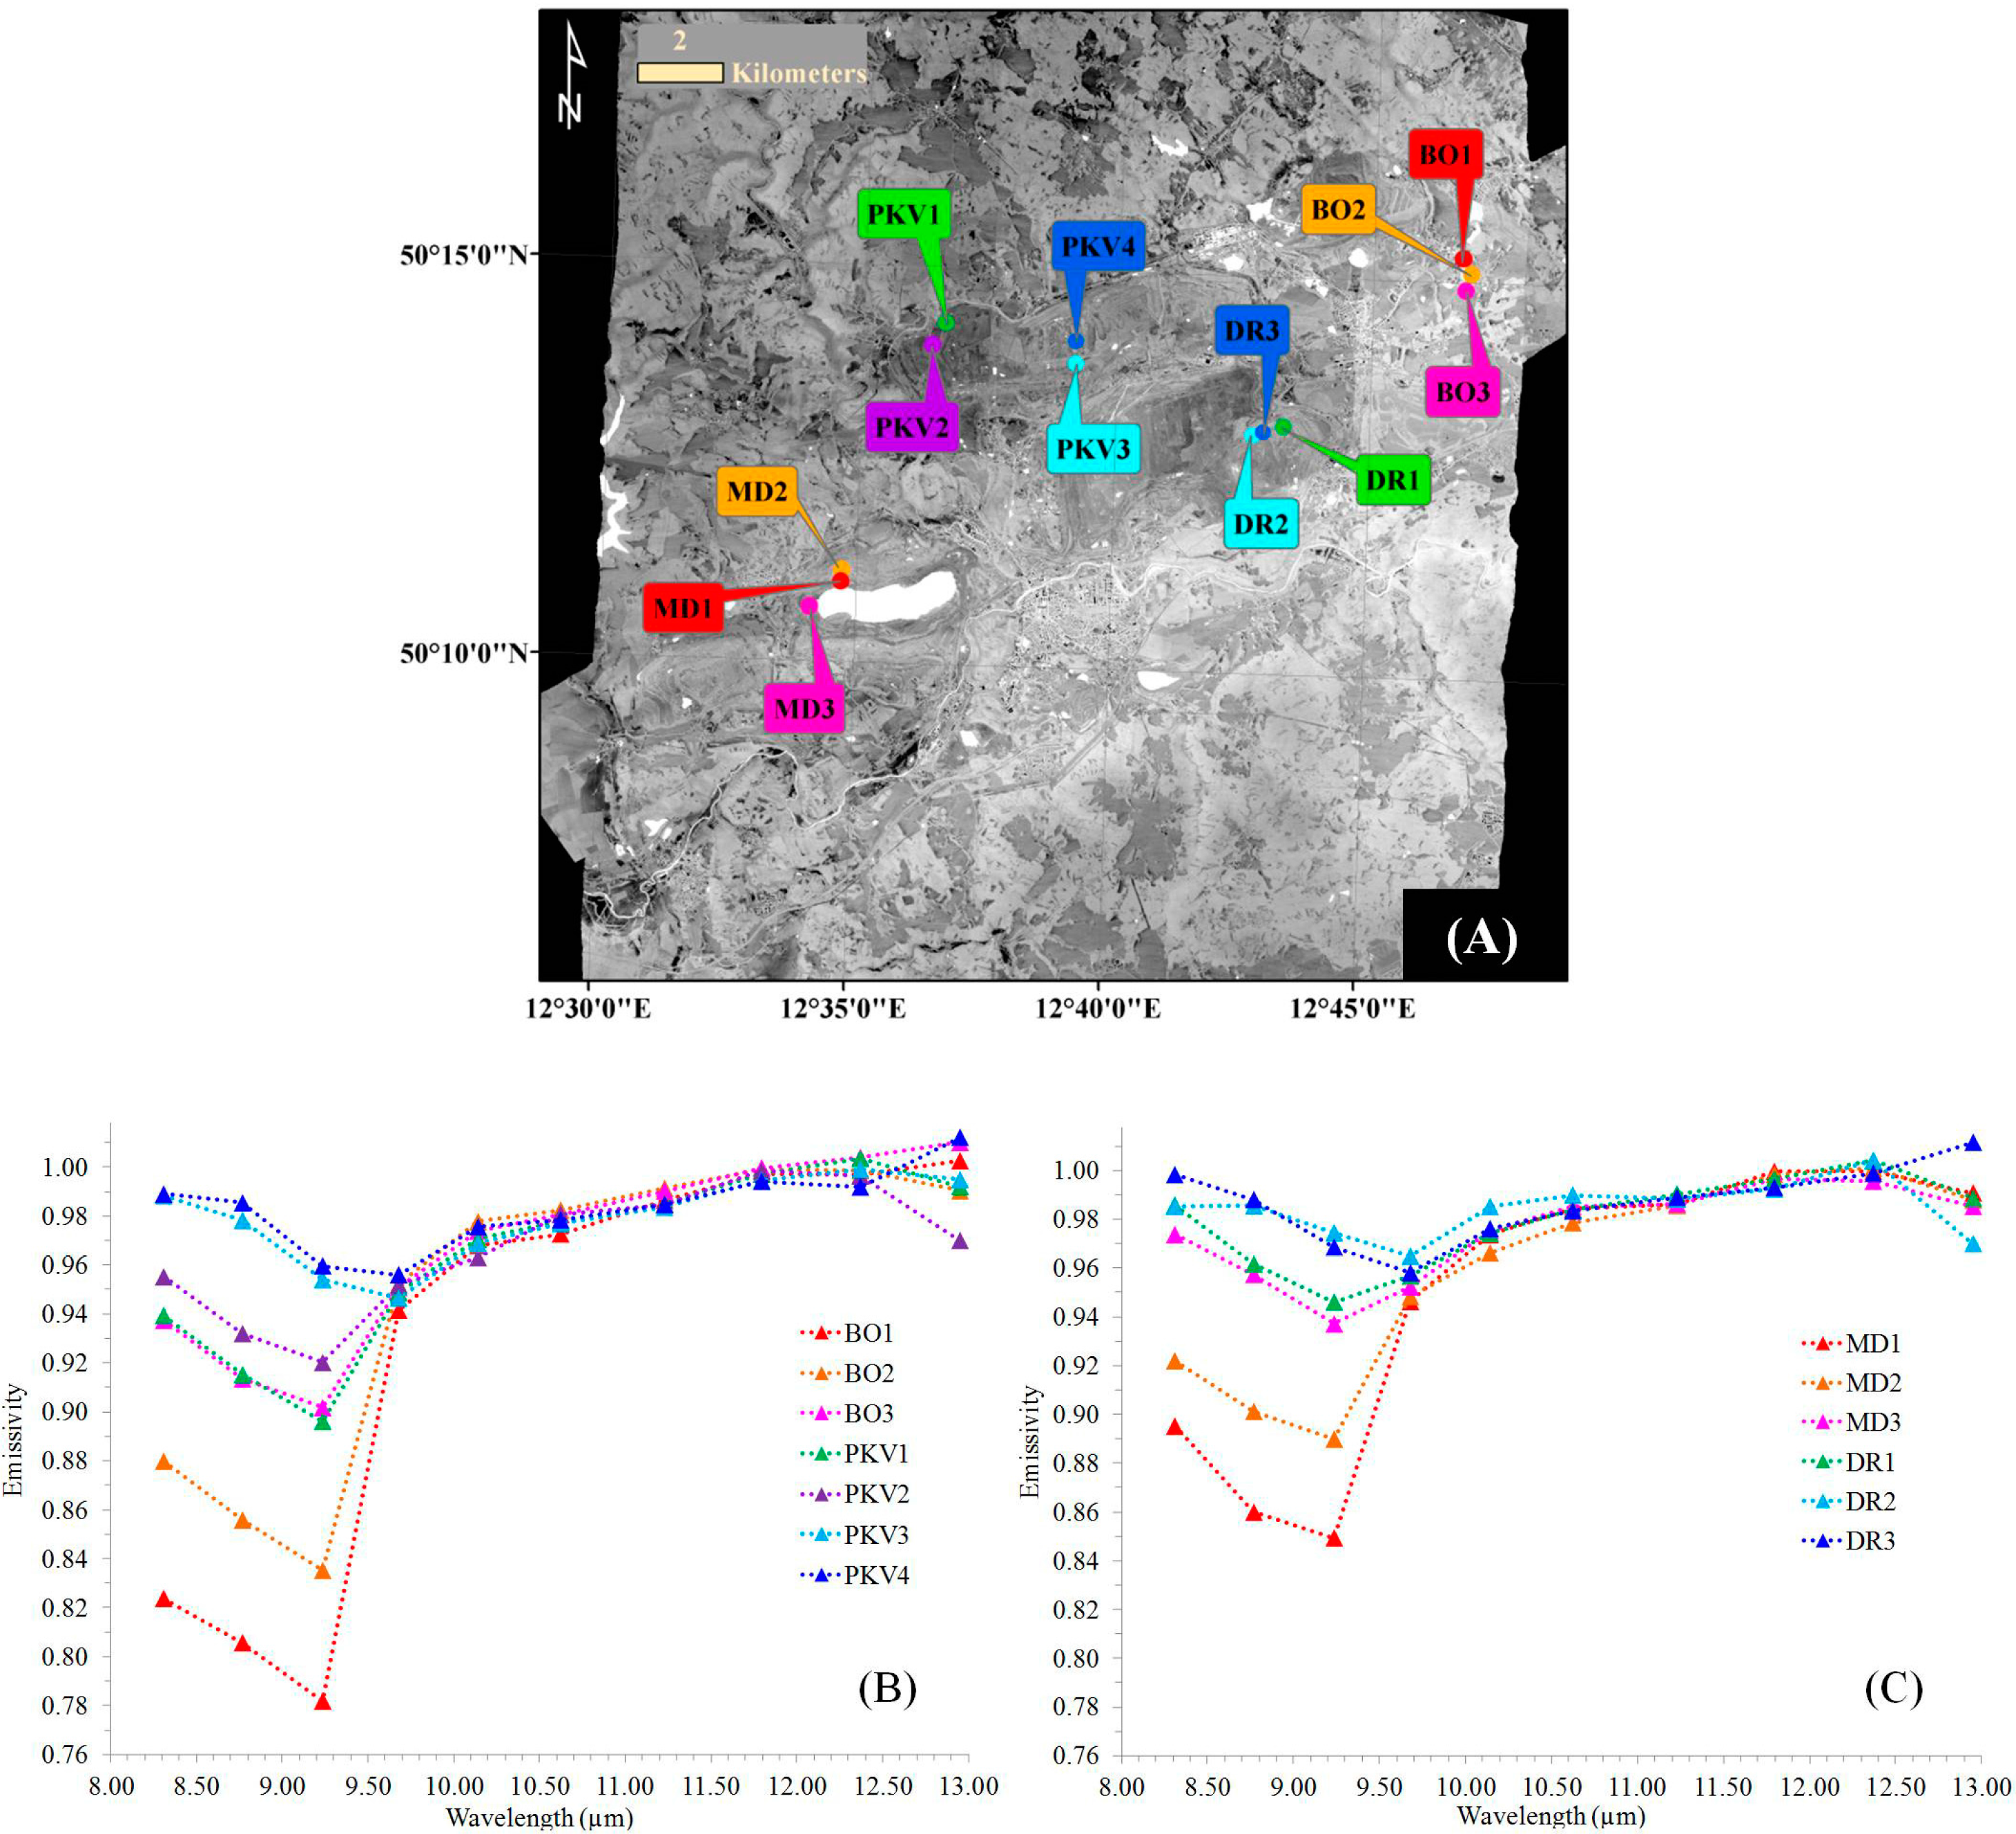
The calculated emissivity spectra of some land ROIs, as calculated from the nighttime AHS data (henceforth airborne emissivity), are shown in Figure 6.
An emissivity feature was observed in the spectrum of each land ROI between λ = 8.31 µm and λ = 10.14 µm. This feature was relatively pronounced for some ROIs, e.g., BO1 and MD1, and less pronounced for others, and its minimum was shifted to longer wavelengths for ROIs such as PKV4 and DR3. Similar behavior was observed in the emissivity spectra of the same land samples calculated from the ground measurements (henceforth ground emissivity), as shown in Figure 7.
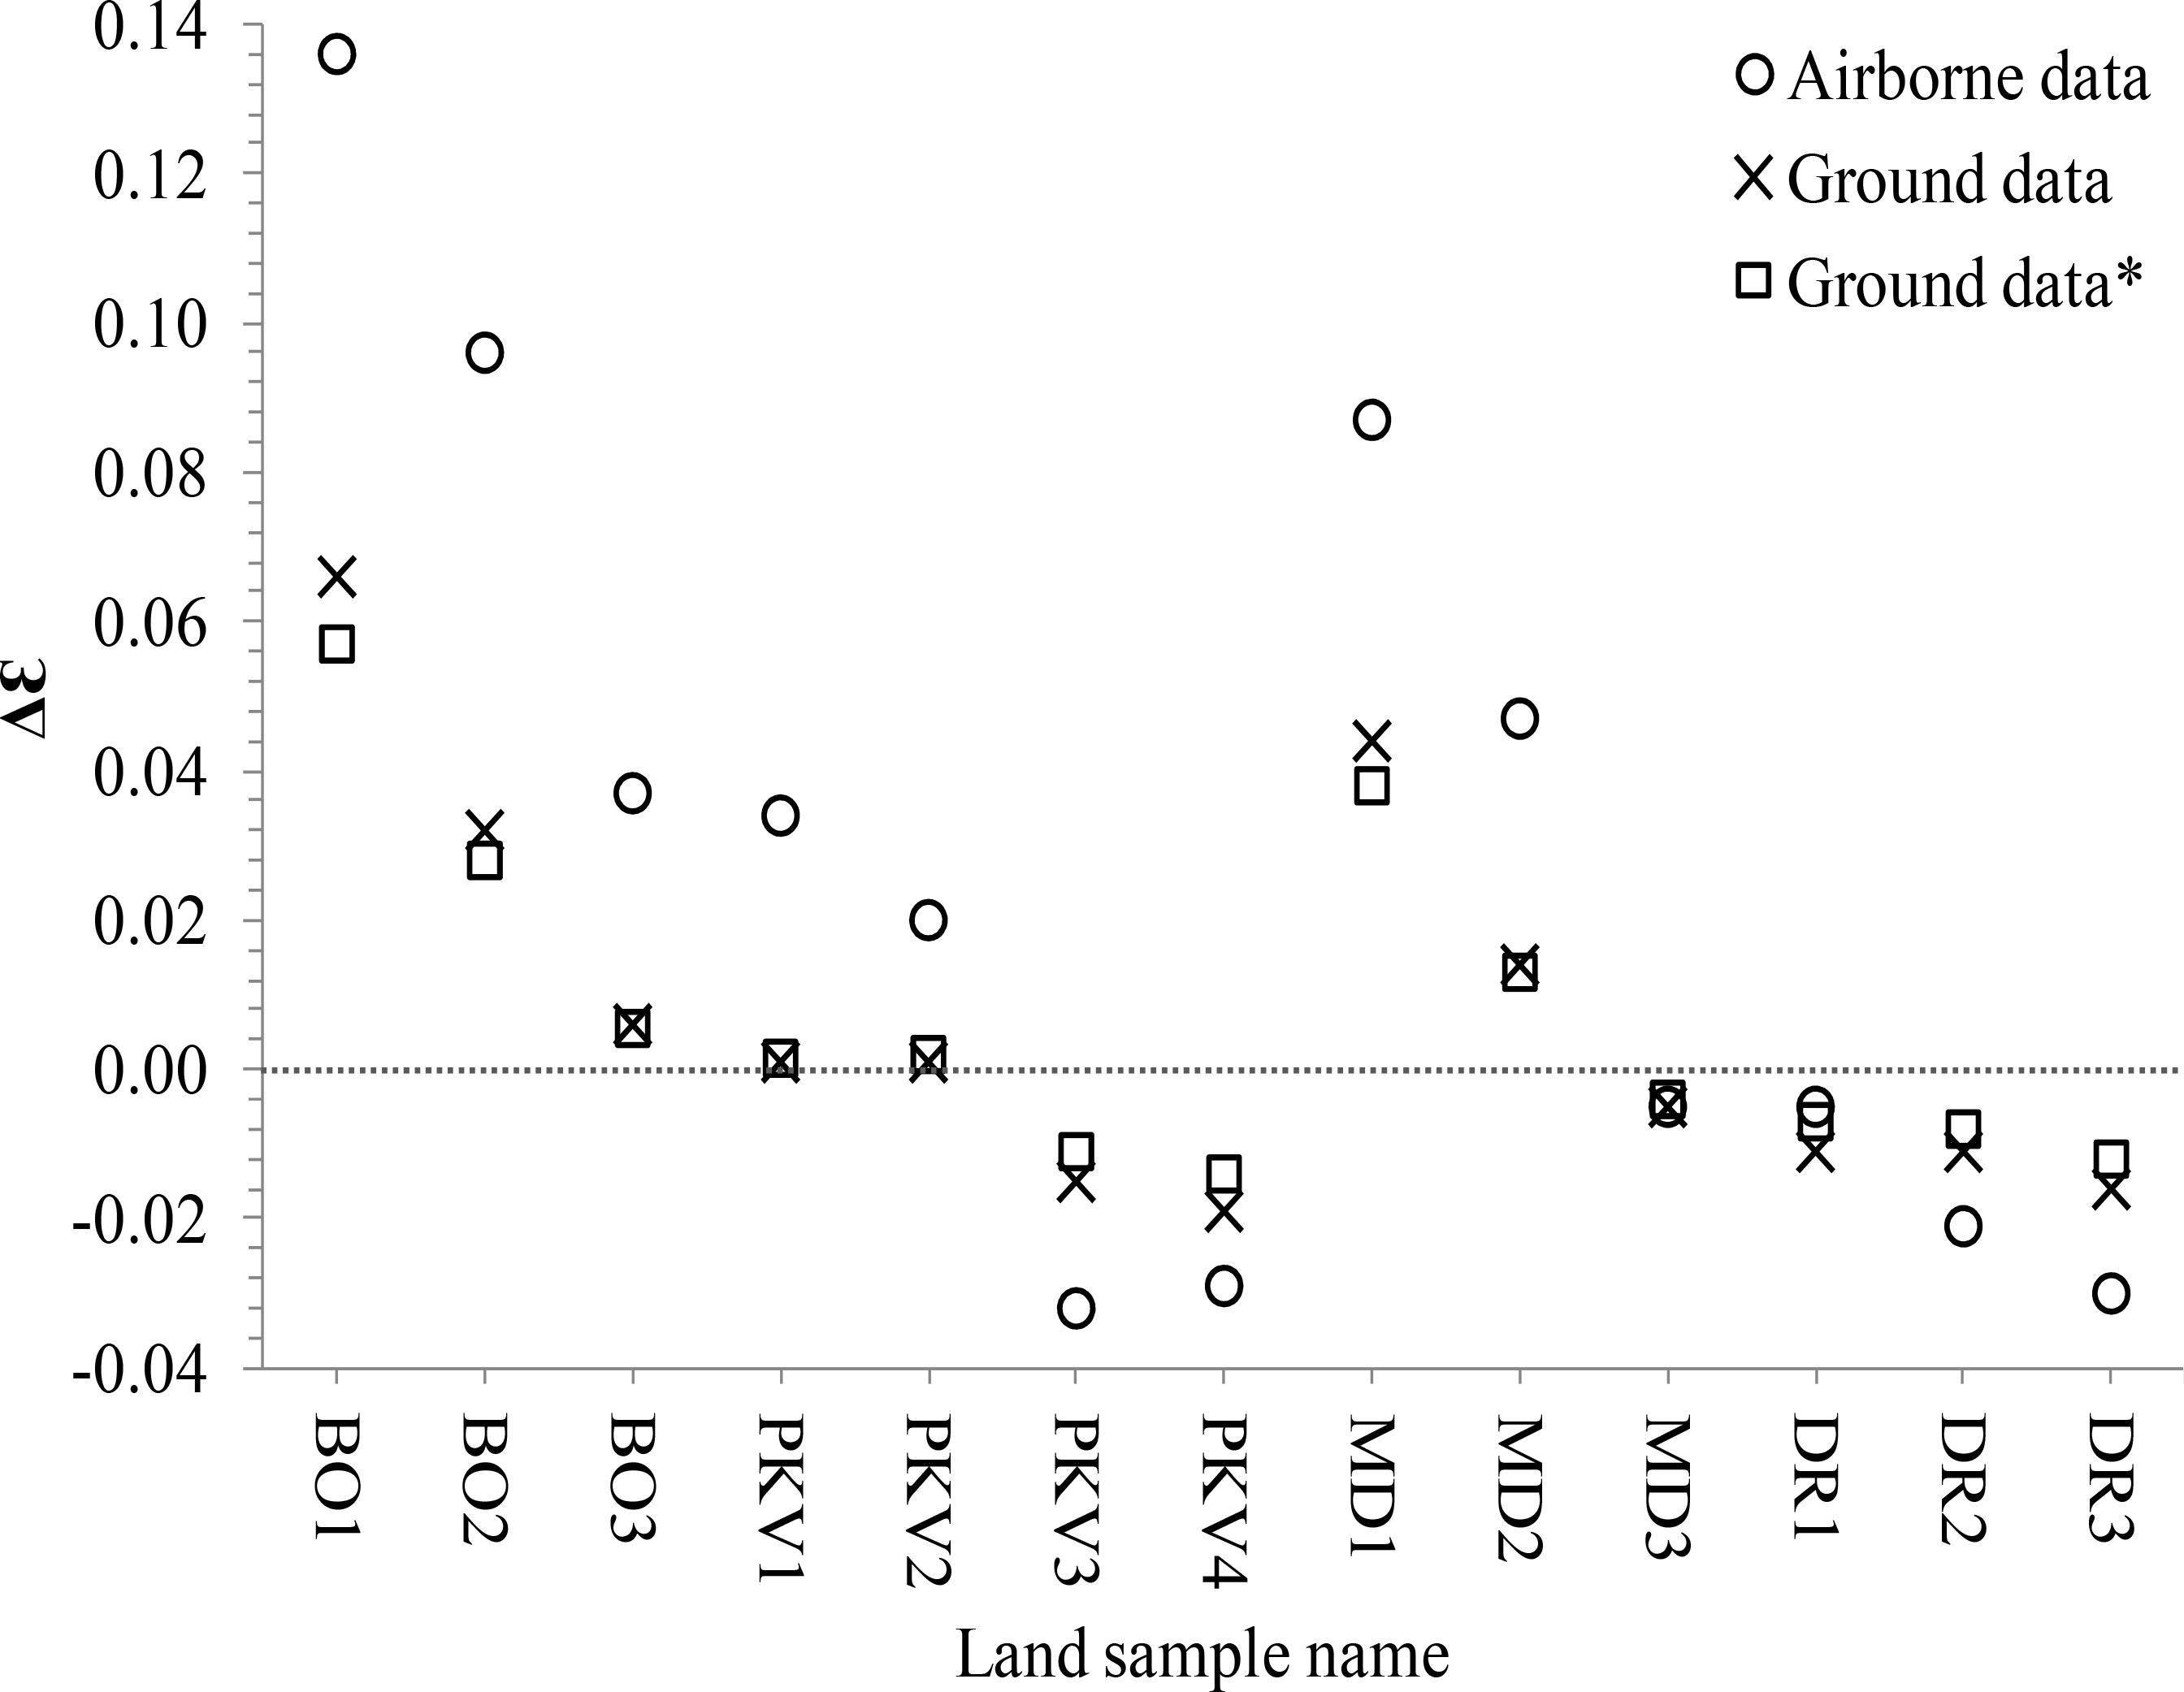
Comparison of the airborne emissivity spectra (Figure 6) with their analogous ground emissivity spectra (Figure 7) showed that although they are not exactly the same, they exhibit the same patterns among samples, i.e., a larger emissivity feature for some land samples and a smaller and/or shifted feature for other samples. This pattern can be expressed as:
The ΔԐ values of some samples were correlated to the mineral composition of the samples obtained from the XRD analysis (Table 1).
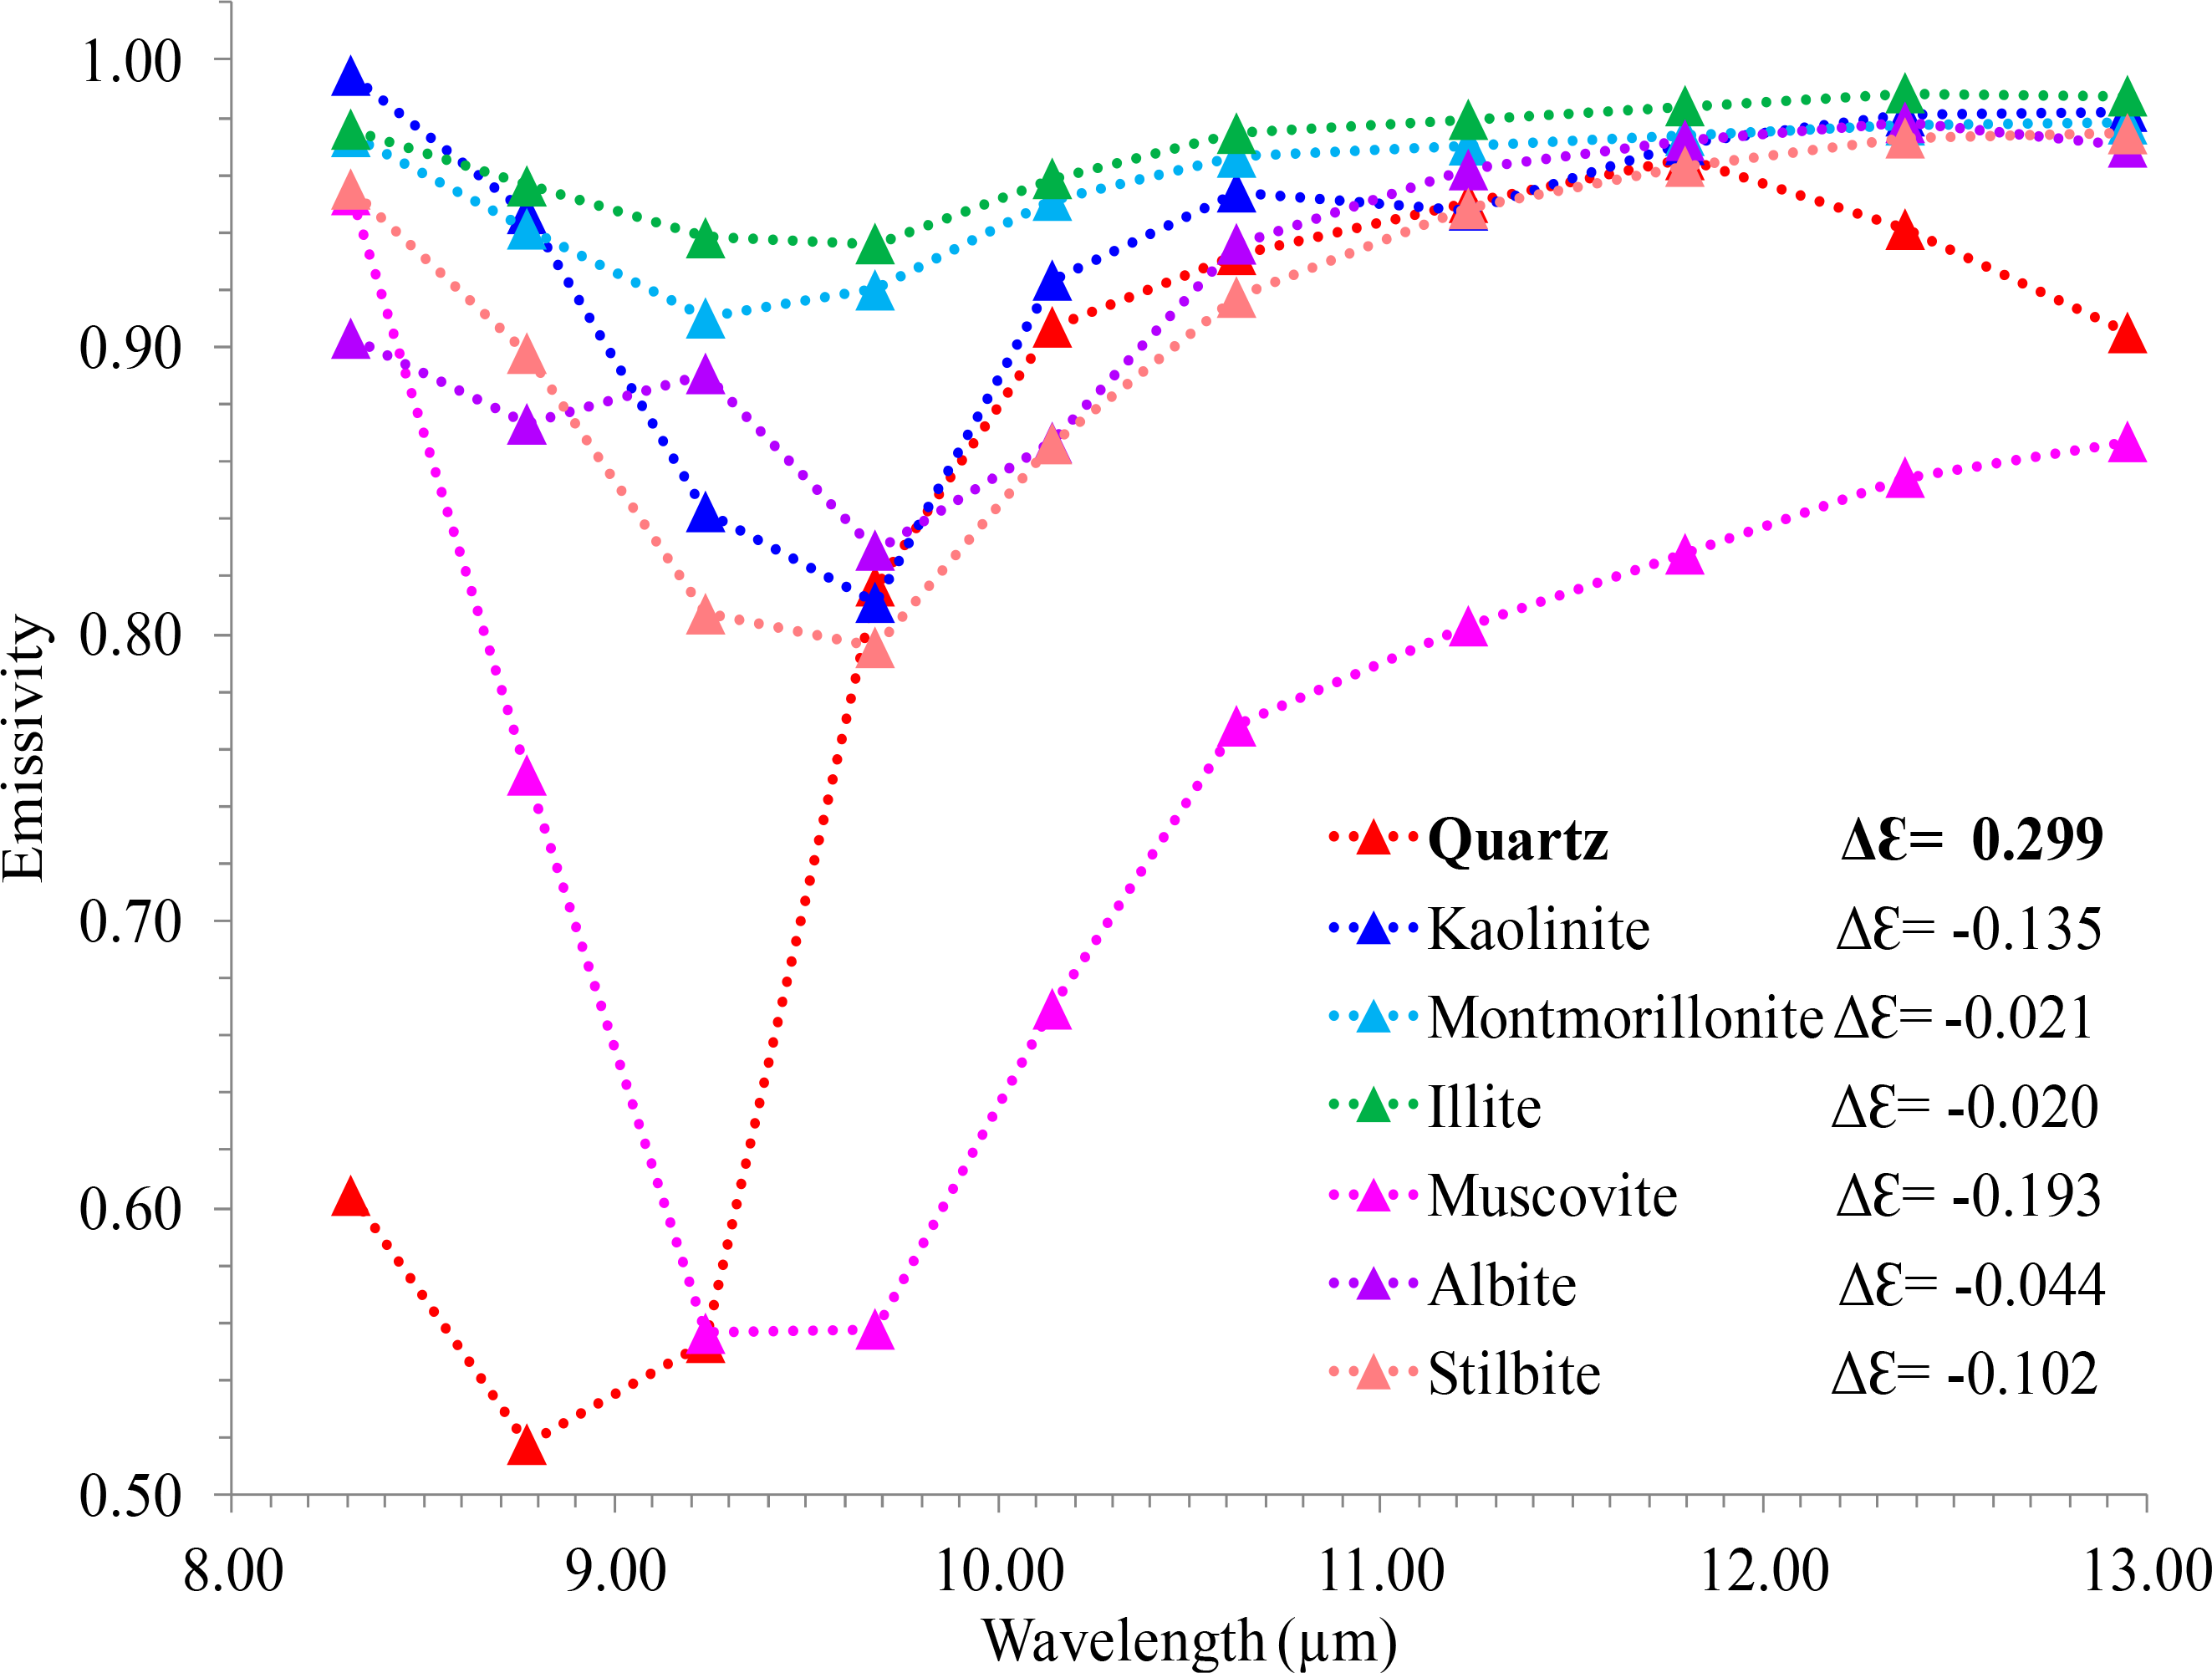
As shown in Table 1, the ΔԐ value was correlated with the relative amount of quartz in the sample. A large amount of quartz was expressed by a more positive ΔԐ value, e.g., sample BO1. A decrease in the amount of quartz with an increase in kaolinite, other phyllosilicates (e.g., muscovite) or other silicates (e.g., albite) decreased the value of ΔԐ down to negative values, e.g., sample PKV4. This decrease in ΔԐ value can be explained by the emissivity spectra of the different silicates (Figure 9). Whereas the ΔԐ value of quartz is positive, the ΔԐ values of the other silicates are negative.
It is important to note that land moisture or vegetation mixed in with the land pixel can affect the ΔԐ value. However, in this dataset, the land was assumed to be dry due to the weather conditions before and during data acquisition. Moreover, all analyzed land pixels were vegetation-free based on an emissivity threshold of Ԑ < 0.98 at λ = 9.24 or 9.68 µm. In addition, differences in surface texture can potentially affect the ΔԐ value. However, we assumed that this effect is insignificant relative to the differences in land mineral content.
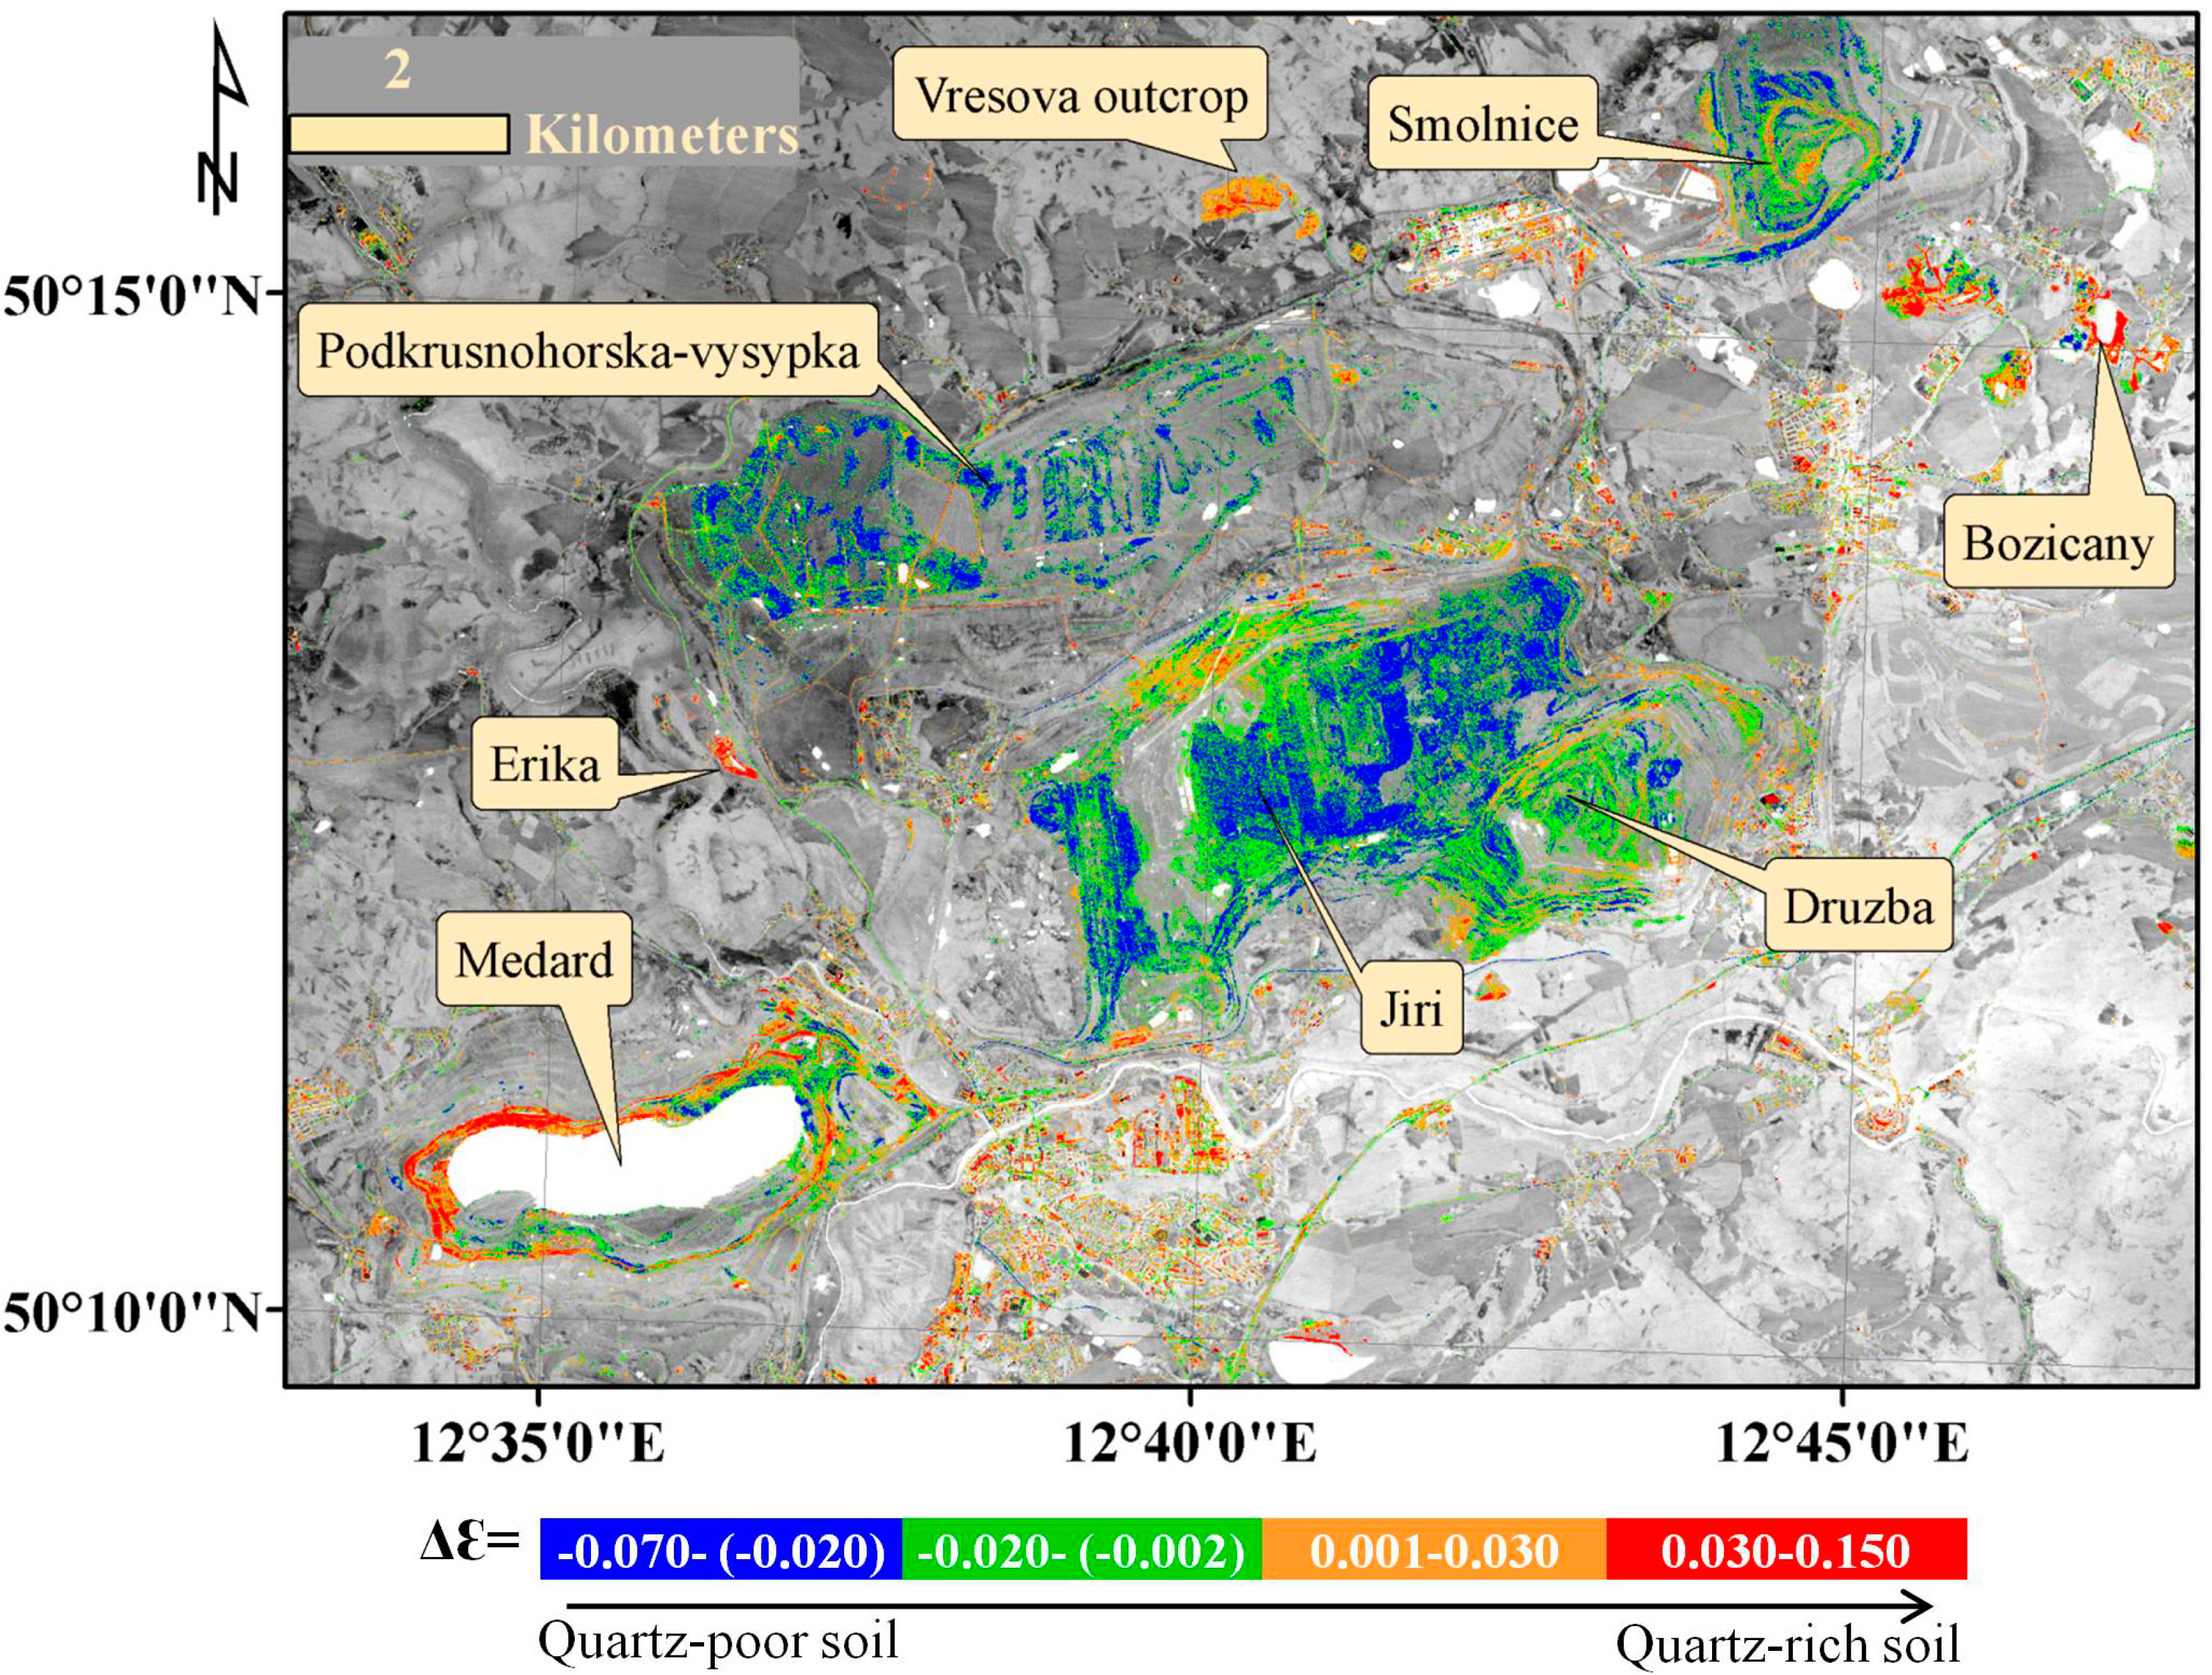
To estimate the relative amount of quartz in the exposed surface in the Sokolov lignite mining area, the ΔԐ value was calculated for each land pixel in the emissivity image and the results are shown in Figure 10.
The results of the quartz-content mapping can be associated with the lithology of the surface and the source of the exposed land. The quartz-rich land in the western and northern parts of the Medard abandoned pit (Figure 10) belongs to the quartz-rich outcrop of alluvial sediments of the Sokolov fomation. This is a large, up to 30-m thick alluvial cone of the river flowing from the west into the Sokolov Basin in the Miocene. The eastern part of Medard is affected by material transported from the Druzba pit, as described in Section 3.2. The quartz-poor land in the Jiri and Druzba pits corresponds to the outcrops of clays and claystones of the Cypris formation and to artificial redepositions of material removed during the mining processes. The same material is observed in the outer dump sites of Podkrusnohorska-vysypka and Smolnice. A concentration of quartz-rich land in the northern part of the Jiri pit belongs to kaolinized granites and gneisses containing a large amount of quartz, variable amounts of kaolinite and a little admixture of muscovite. The abandoned Erika sand pit contains sand, sandstone, gravel and conglomerates rich in quartz, accompanied with pebbles of quartz-rich geological units (mica schists) and with kaolinite-coated quartz grains. The blue and red spots at the Bozicany kaolinite pit (Figure 10) are associated with quartz-poor and quartz-rich piles, respectively. During the mining operations, kaolinite was washed from the kaolinized granite, redeposited and resorted, while the quartz sand was left behind. The large spot close to Vresova is a small quarry of weathered granites.
3.2. SWIR-Region Results
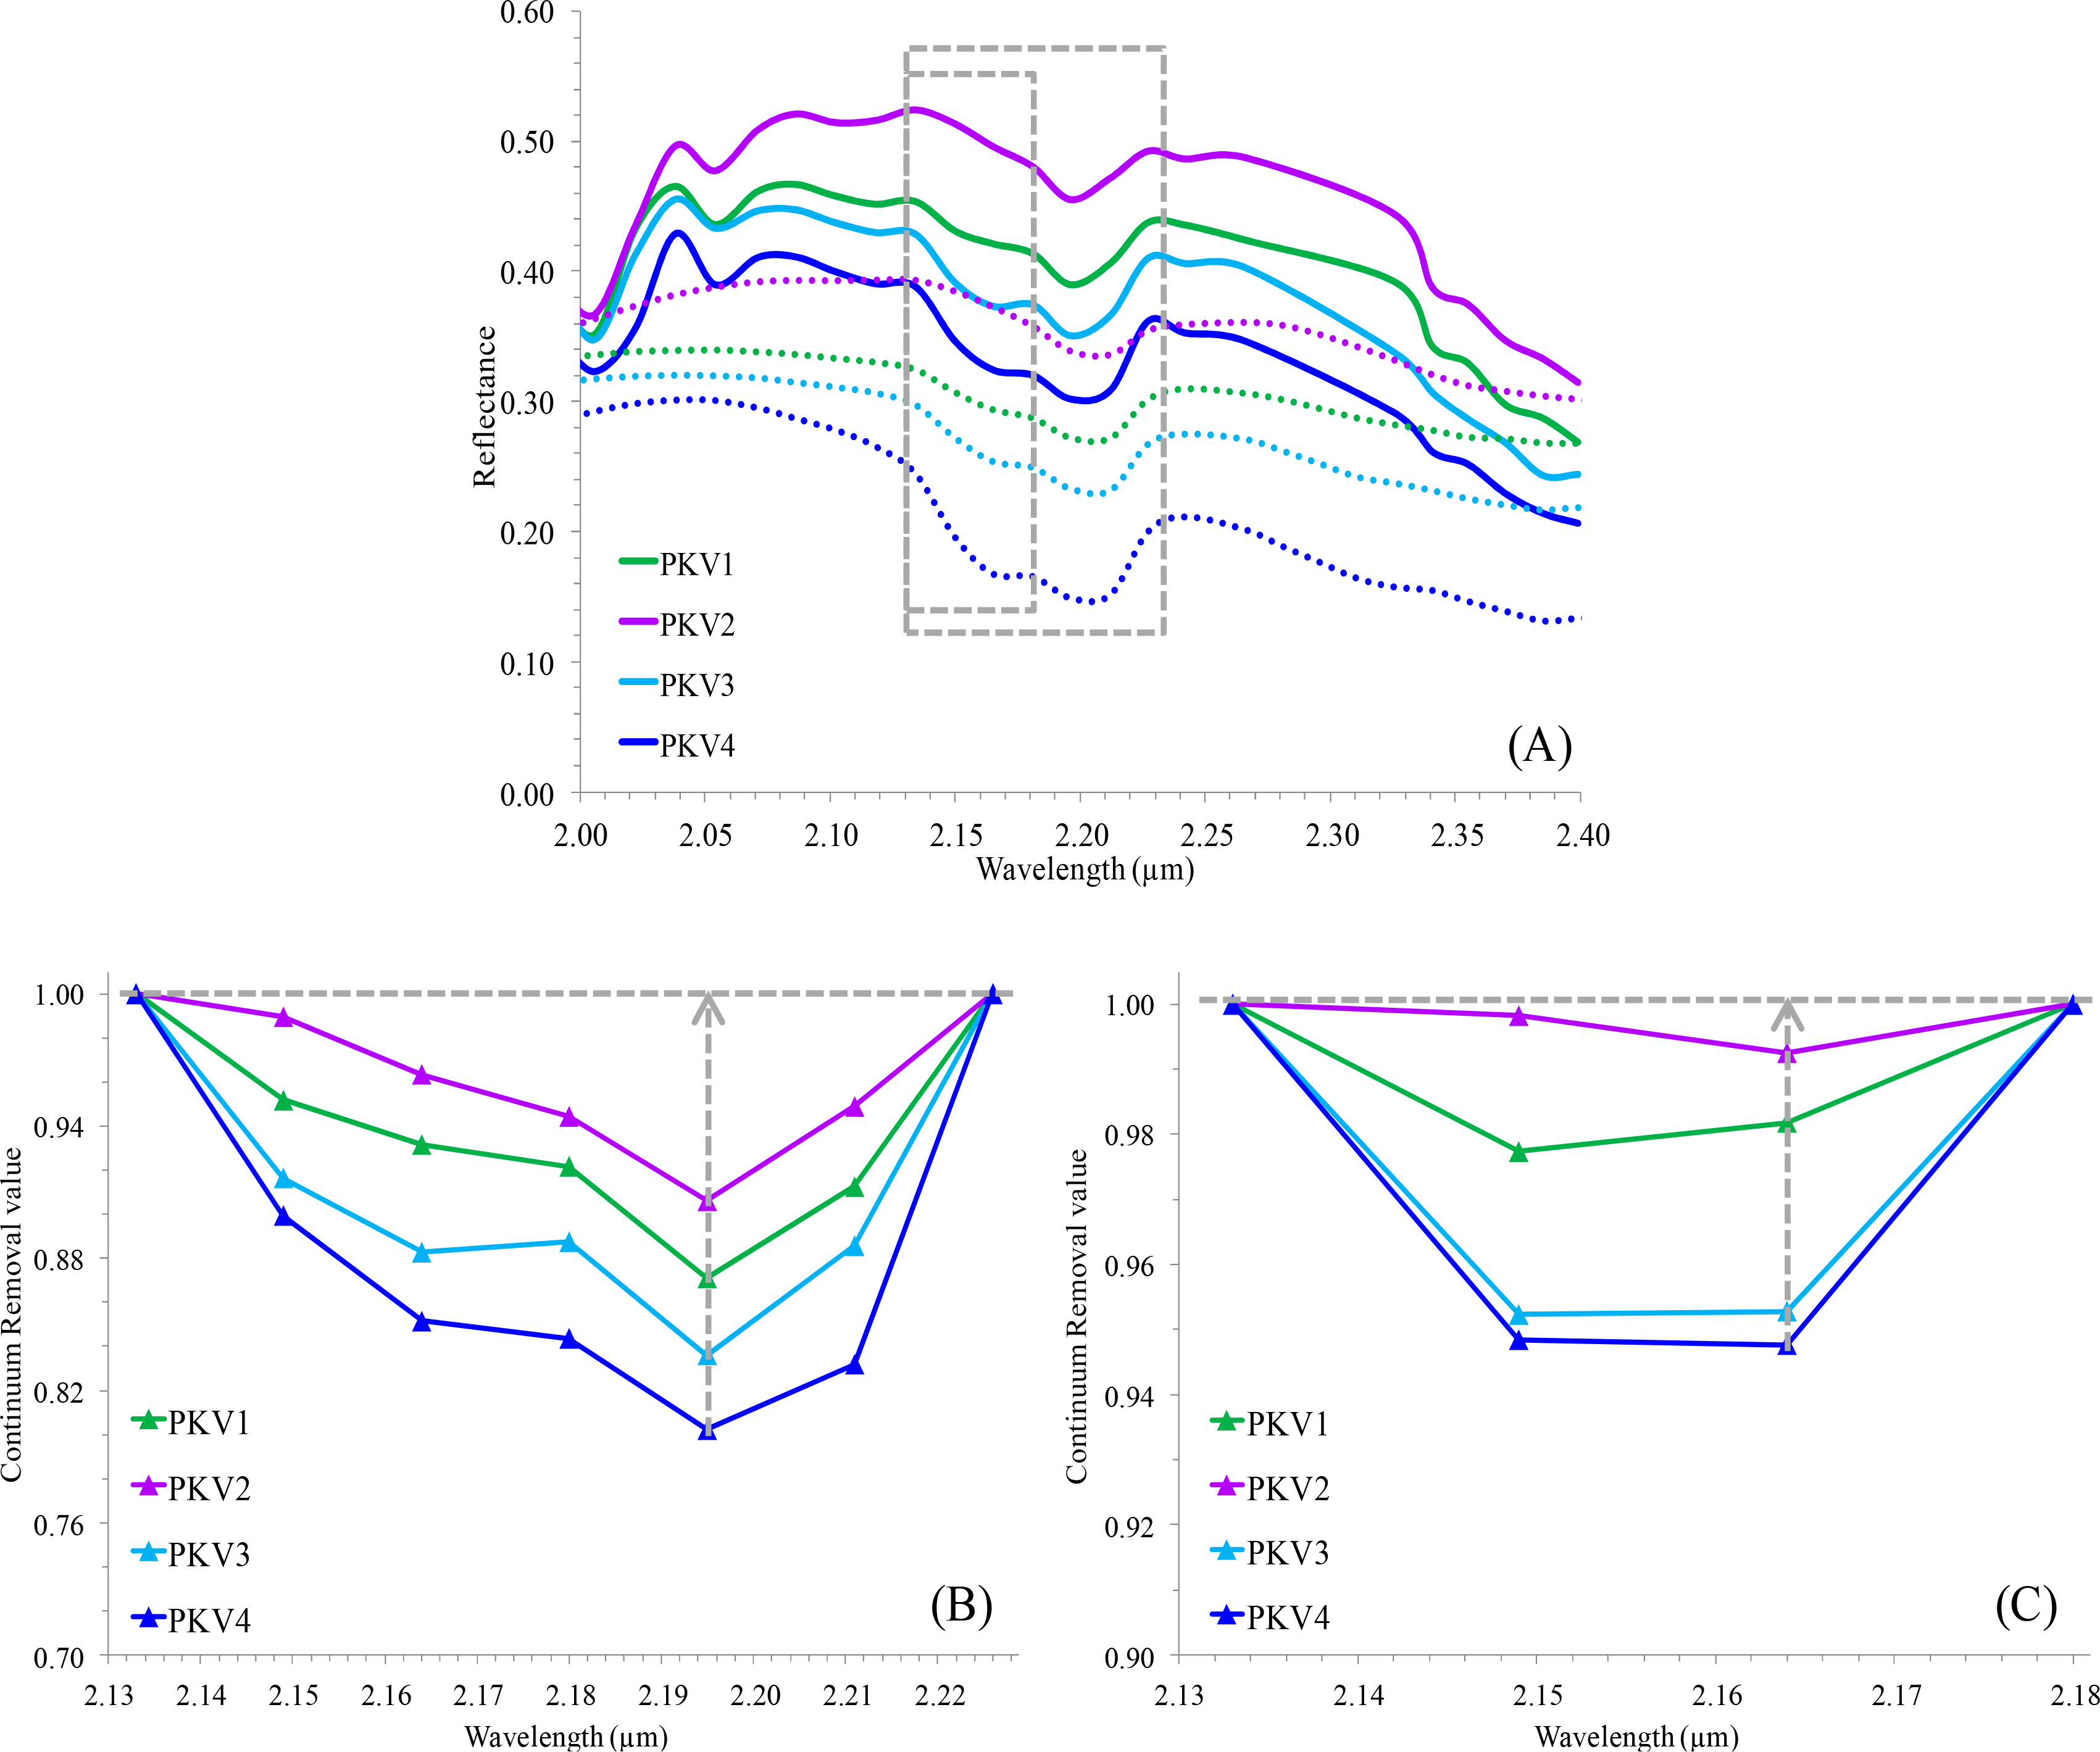
To extend the mineral classification and to map the major non-quartz mineral content of the land, i.e., kaolinite, other phyllosilicates or other silicates, the reflectance image in the SWIR region was analyzed. The SWIR spectra of some land ROIs are shown in Figure 11.
The SWIR reflectance spectra of the land ROIs display a typical absorption feature of 2:1 and 1:1 phyllosilicates with a minimum at 2.196 µm, accompanied by a smaller minimum at 2.165 µm typical to 1:1 kaolinite phyllosilicate. The depth of the absorption at 2.196 µm, as derived from the continuum removal (CR) spectrum between 2.134 and 2.227 µm (henceforth CR2.196µm), indicates the amount of 2:1 or 1:1 phyllosilicate in the land. The depth of the absorption at 2.165 µm, as derived from the CR spectrum between 2.134 and 2.181 µm (henceforth CR2.165µm), indicates the amount of kaolinite in the land. The values of CR2.196µm and CR2.165µm were calculated for each land pixel in the reflectance image, and some examples are shown in Table 2. A bigger CR2.196µm value indicated a larger amount of phyllosilicate and together with a bigger CR2.165µm value, indicated a larger amount of kaolinite, from either the reflectance image or the laboratory measurements.
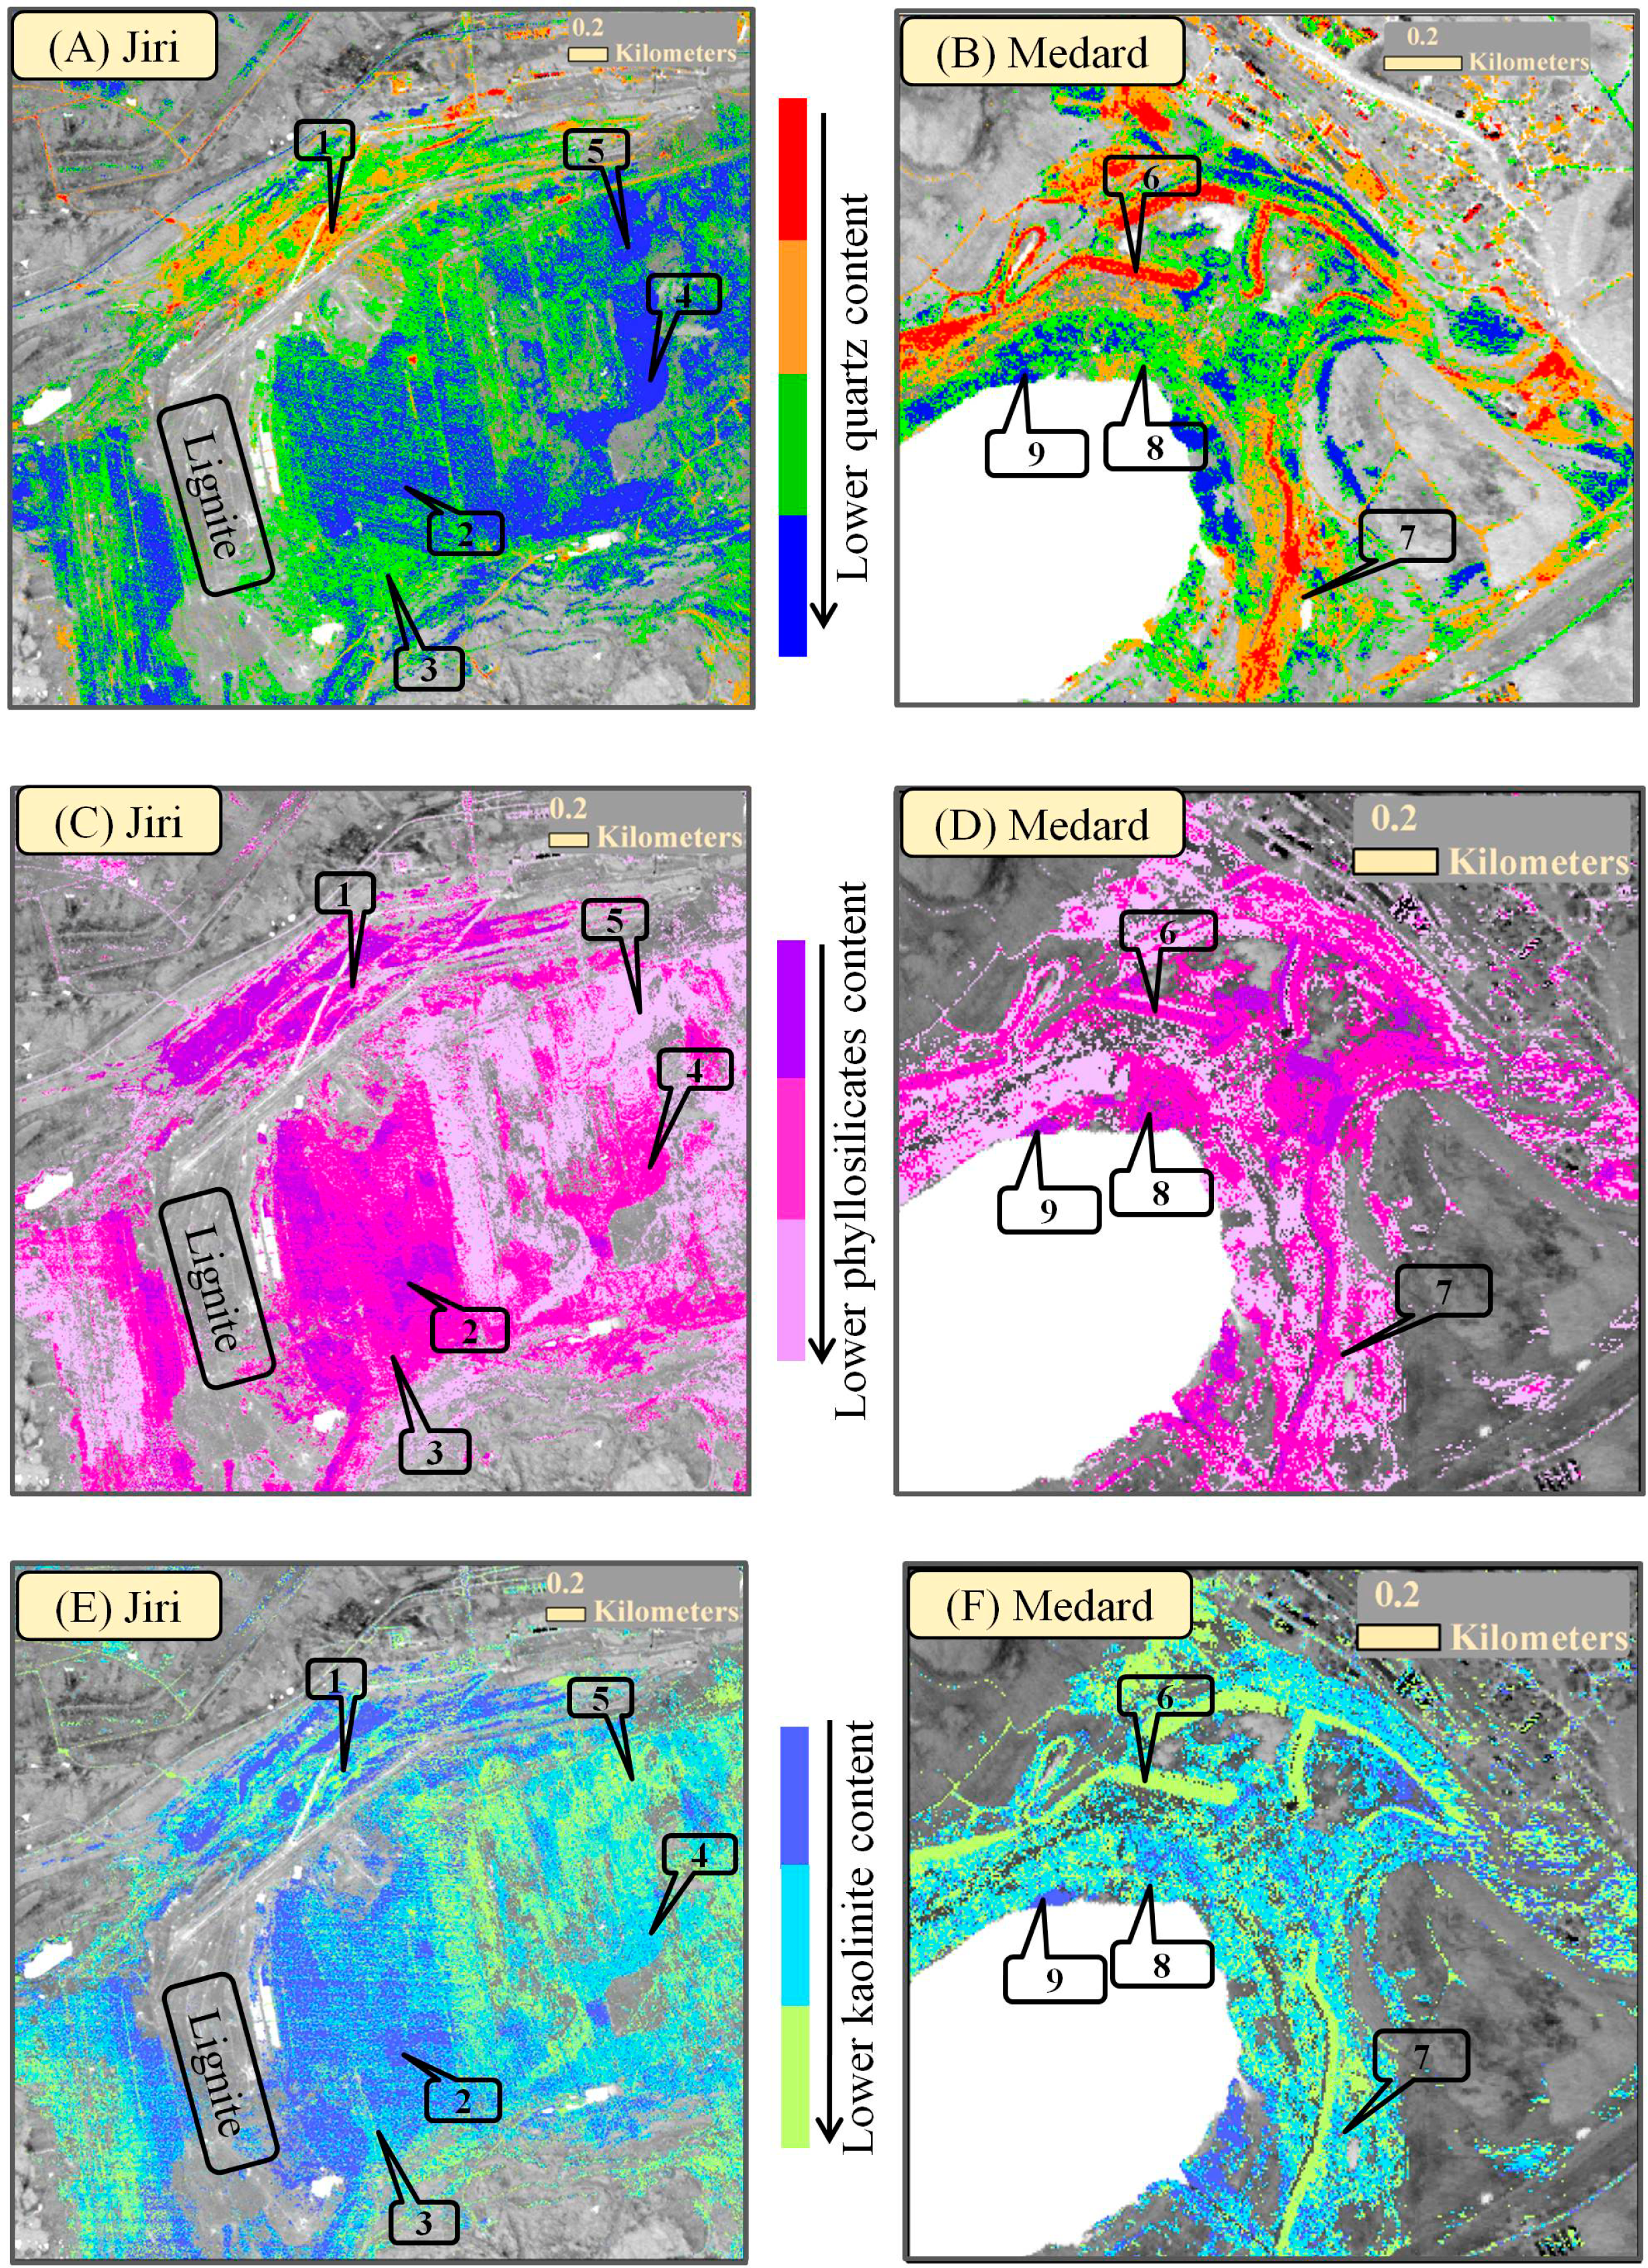
The content of phyllosilicates and kaolinite according to the CR2.196 µm and CR2.165 µm values, as well as the content of quartz according to the ΔԐ values, in the Jiri active pit and in the Medard abandoned pit are shown in Figure 12.
ROI 1 in Figure 12 represents the quartz-rich land at the northern rim of the Jiri pit, belonging to the kaolinized granite with large amount of quartz (Figure 12A), a variable amount of kaolinite and a little admixture of muscovite (Figure 12C,E). Kaolinite, the dominant mineral in the Cypris formation, prevails in Jiri’s quartz-poor land, especially at the bottom layers of this formation close to the lignite seam, as represented by ROIs 2 and 3. Toward the younger upper layers, away from the lignite layer, kaolinite is less abundant and is accompanied by other phyllosilicates, including muscovite, represented by ROI 4, other silicates (analcite, zeolites, feldspars) and therefore less phyllosilicates, as represented by ROI 5, carbonates (calcite, dolomite, ankerite and siderite), anatase, a small amount of quartz and many other minerals, mostly of volcanic origin. The eastern border of Medard Lake (the abandoned Medard pit) contains material of the Cypris formation transported from the Druzba pit. The elongated strips of quartz-rich land, represented by ROIs 6 and 7 in Figure 12, are depositions of weathered granite from the upper parts of the Cypris formation, which are being used for the construction of roads, dams and piers for the recreational boats in the planned Medard Lake. Quartz-poor transported land—ROIs 8, 9—is from the lower parts of the Cypris formation and therefore rich in kaolinite.
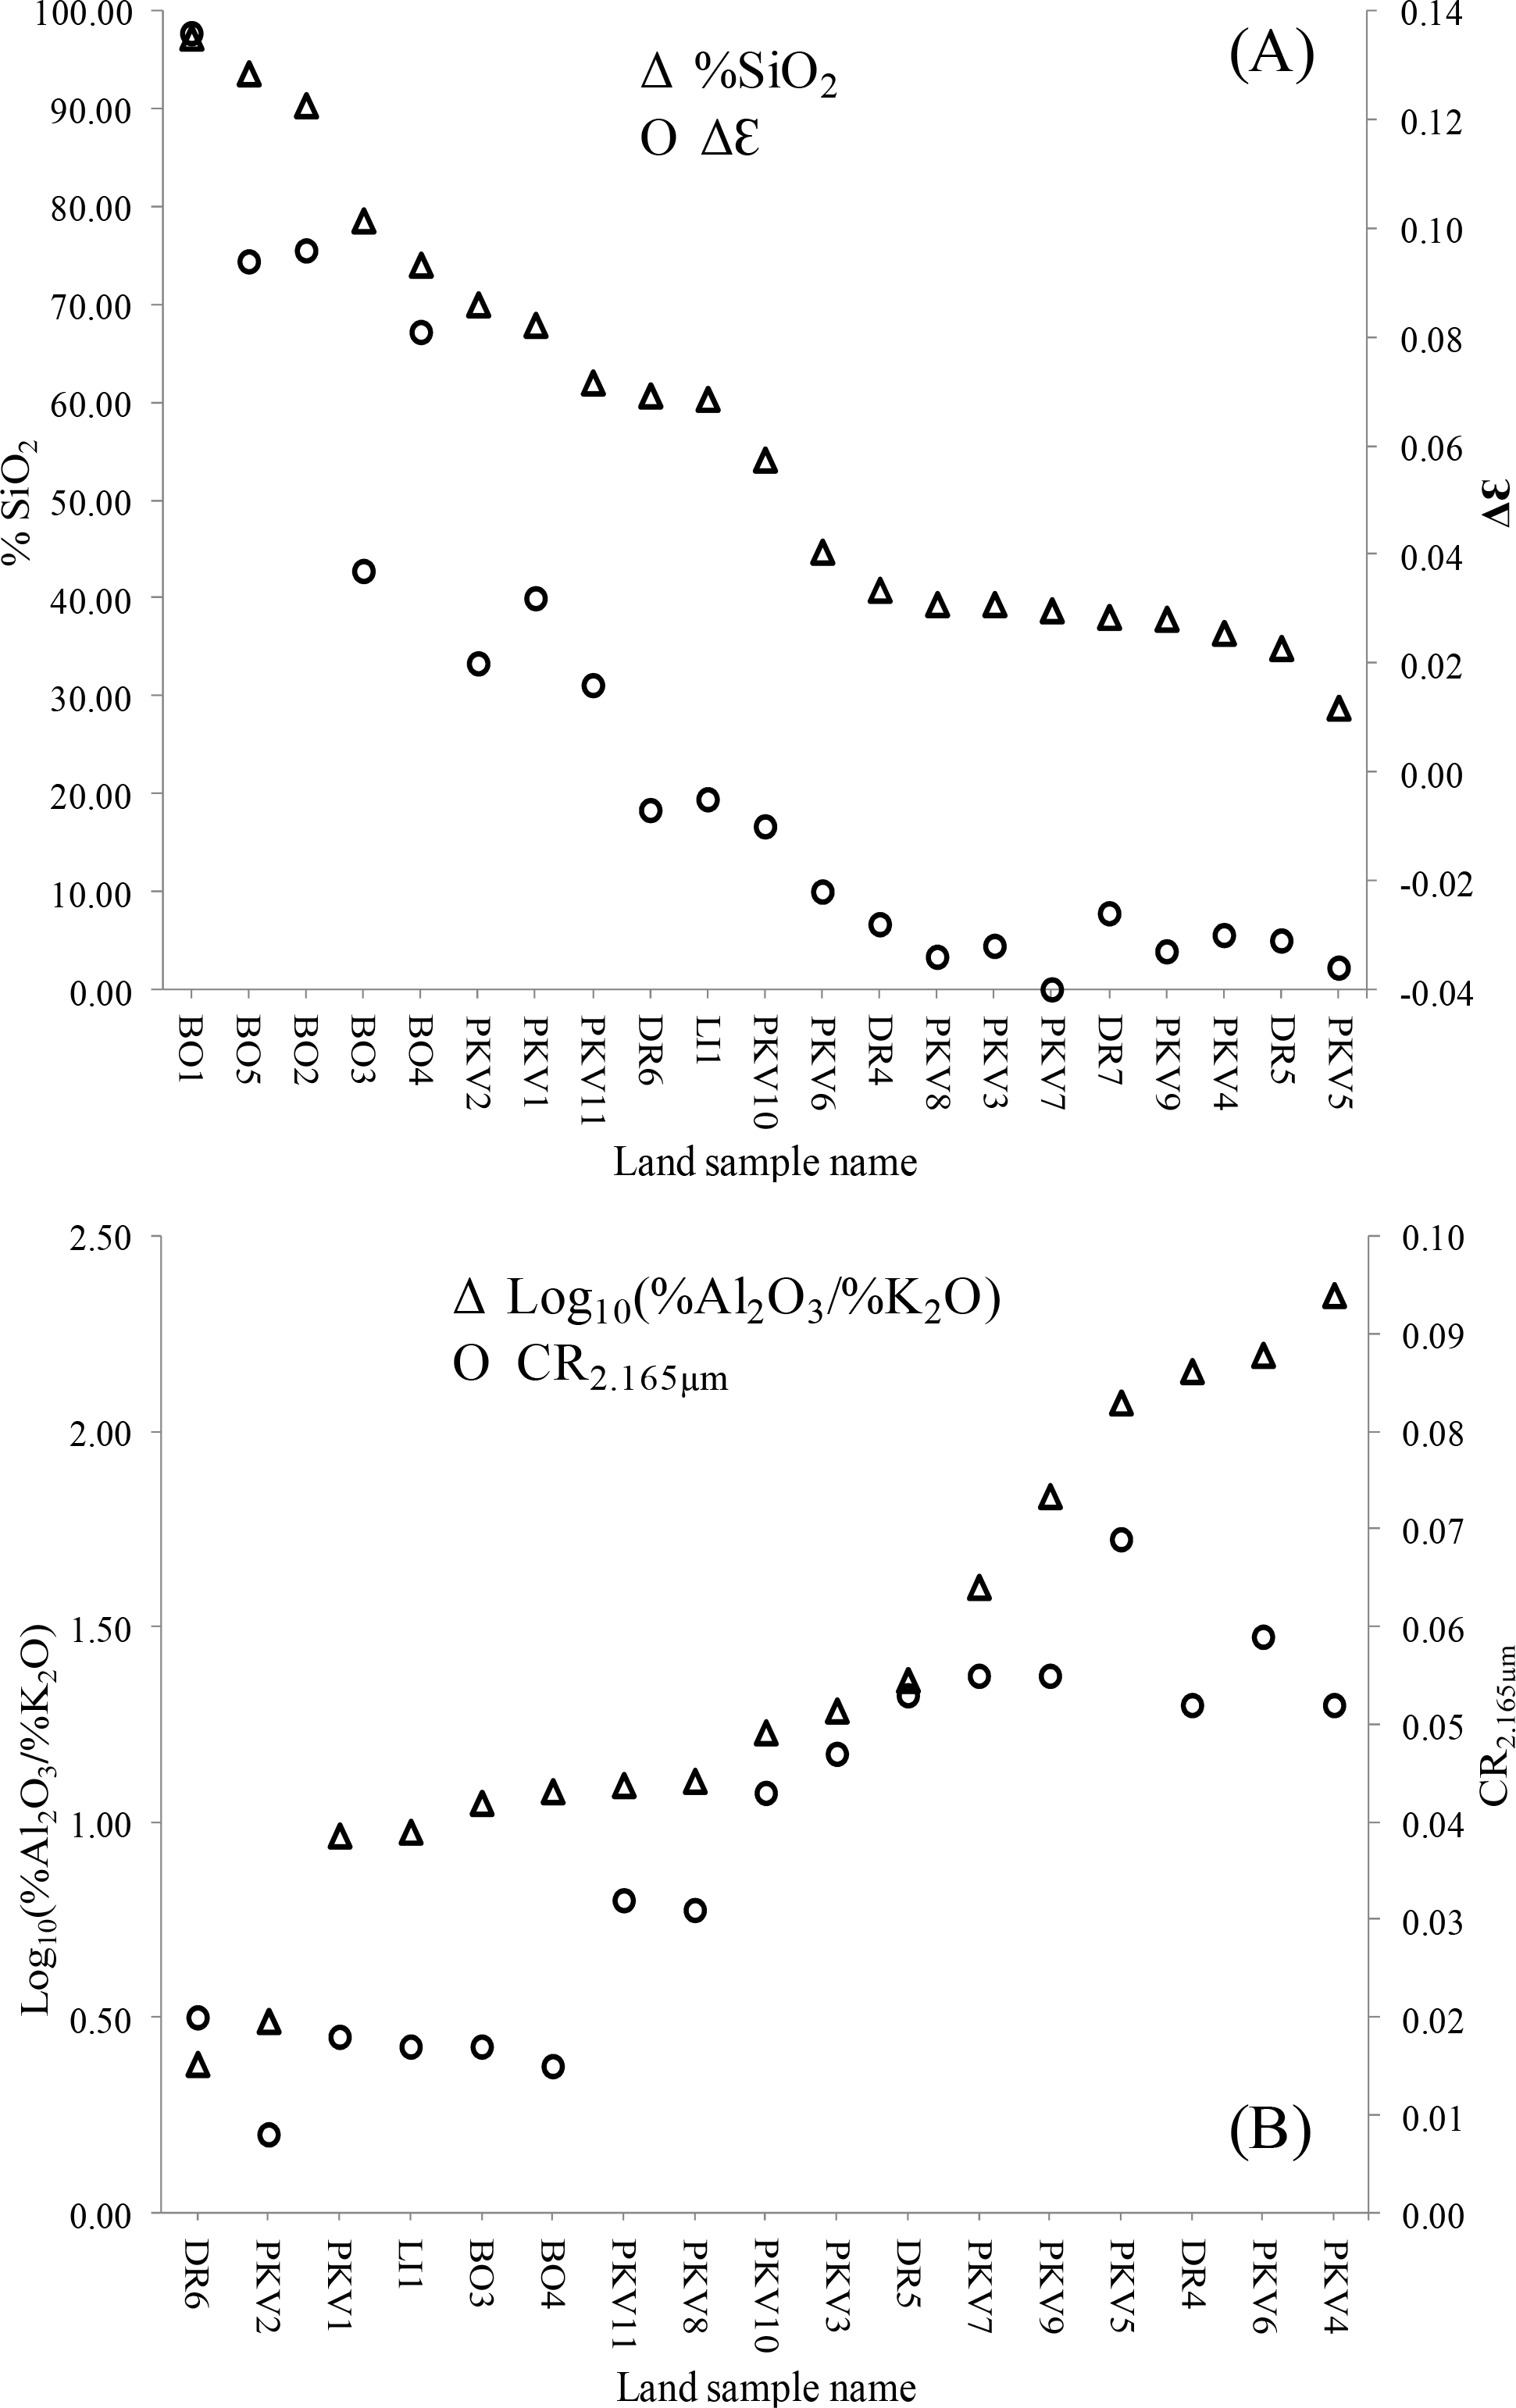
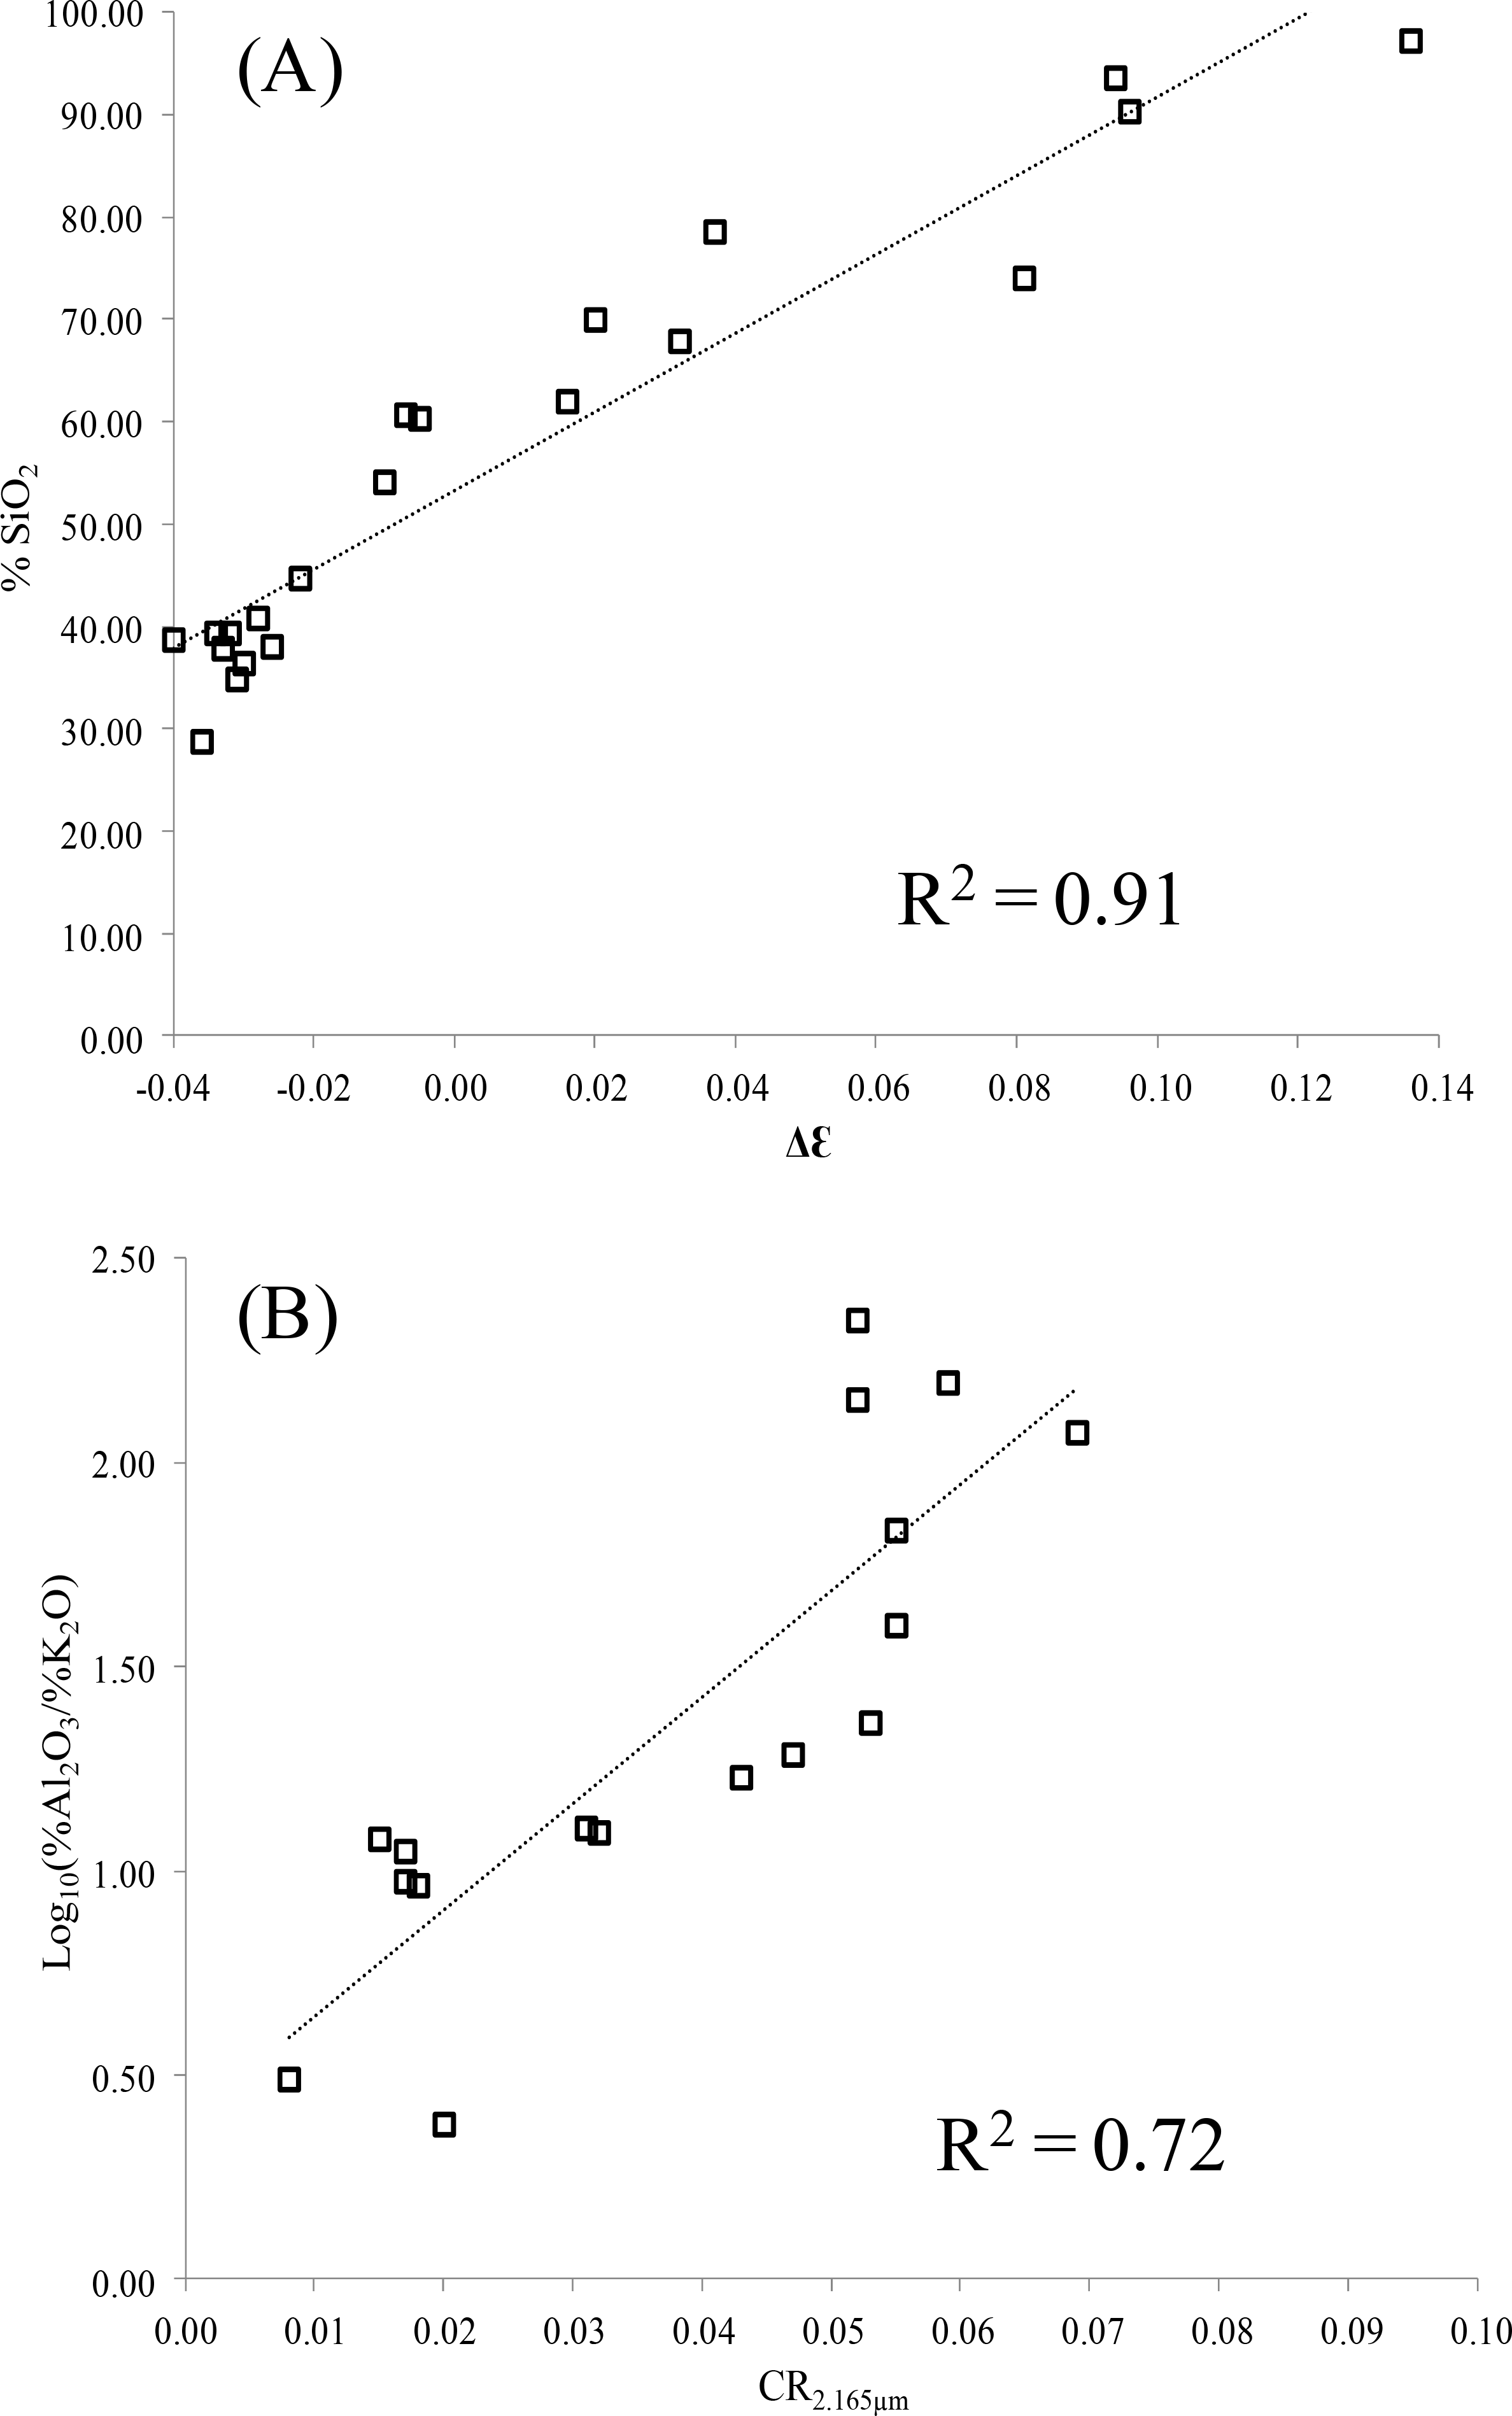
In addition, ground truth validation was conducted to confirm the quartz and kaolinite contents estimated from the calculated ΔԐ and CR2.165µm values, respectively. The ΔԐ and CR2.165µm values of selected ROIs were compared with the chemical analysis results of land samples collected from these ROIs, as shown in Figure 13. A higher concentration of silicon (Si) in the sample (large %SiO2 value, Figure 13A) indicated a higher concentration of quartz, which also exhibited a larger ΔԐ value. It should be mentioned that the %SiO2 value is affected by the presence of all silicates and not only by quartz. However, in a quartz-rich sample, the relative amount of Si is larger, resulting in a larger %SiO2 value. The CR2.165µm value of a land sample was compared with the ratio of aluminium to potassium (Al/K) (%Al2O3/%K2O, Figure 13B); in a kaolinite (Al2Si2O5(OH)4)-rich sample, the Al/K ratio is larger than in a sample that is rich in other common minerals, i.e., quartz, muscovite (KAl2(AlSi3O10)(F,OH)2) or K-feldspar. As a general trend, samples with larger %Al2O3/%K2O values exhibited larger CR2.165µm values (Figure 13B). Both the %Al2O3/%K2O and CR2.165µm values indicated a relatively large amount of kaolinite. The correlation between the measured %SiO2 values and the calculated ΔԐ values was good with an R2 value of 0.91 (Figure 14A), and that between the Log10(%Al2O3/%K2O) and CR2.165µm values was relatively good with R2 = 0.72 (Figure 14B). This validation confirmed the estimation of the relative amounts of quartz and kaolinite in exposed land based on the calculated ΔԐ and CR2.165µm values.
4. Summary and Conclusions
The current study demonstrates the ability to map the relative amounts of quartz and kaolinite in exposed land of the lignite mining area in the Sokolov Basin. Mining, dumping and backfilling activities, as well as rehabilitation processes, change the nature of the exposed surface. Use of the AHS airborne multispectral data in the LWIR spectral region, with the ability to detect quartz, along with the hyperspectral data in the SWIR spectral region, with the ability to detect phyllosilicates and in particular, kaolinite, with support from ground/laboratory measurements, enabled mapping the spatial distribution of the dominant minerals. The emissivity spectrum of each land pixel in the LWIR image was calculated and the reflectance spectrum of each land pixel was derived from the VNIR–SWIR image after applying atmospheric correction. The difference between the calculated emissivity values at λ = 9.68 µm and λ = 8.77 µm (ΔԐ) was used to estimate the relative amount of quartz in each land pixel. The depth of the absorption at about 2.2 µm in the SWIR reflectance spectrum (CR2.165µm) was used to estimate the relative amount of kaolinite in each land pixel. The resultant mineral classification was in good agreement with the mineralogy of the exposed surfaces based on their geological nature and origin. For example, the quartz-rich land classified in the surroundings of the abandoned Medard pit represents the local outcrops of alluvial sediments that are rich in quartz, whereas kaolinite-rich material on its eastern border represents the kaolinite-rich material transported from the Druzba pit. Another example is the quartz-poor and kaolinite-rich land in the bottom layers of the Jiri pit close to the lignite seam, which changes to quartz-poor and kaolinite-poor land further away from the lignite representing younger upper land layers. A validation procedure showed a quite good correlation between the measured concentration of Si in land samples and the calculated ΔԐ with R2 = 0.91, and between the measured Al/K ratio and the calculated CR2.165µm with R2 = 0.72. This indicates that the ΔԐ and CR2.165µm values can be used to estimate the relative amounts of quartz and kaolinite in exposed land.
Overall, this study shows that merging remote-sensing data from LWIR and SWIR spectral regions may be efficient for mapping the spatial distribution of major minerals in exposed surfaces, and can be used to track mining activities and rehabilitation processes in mining environments.
Acknowledgments
This study was supported by the Seventh Framework Programme (FP7) project “Earth observation for monitoring and observing environmental and societal impacts of mineral resources exploration and exploitation” (EO-Miners) grant agreement No. 2442242, the Israeli Ministry of Science, Technology and Space fund 00040047000 grant No. 3-8163 and the Czech Ministry of Education, Youth and Sports grant No. LH13266. The AHS data were acquired under the EUFAR program (DeMinTIR project). The authors wish to thank INTA’s crew members who flew the AHS sensor onboard the CASA platform for their professionalism, mission planning and data acquisition while maintaining the highest standards.
Author Contributions
Gila Notesco processed the airborne and ground data, analyzed the results, and is the main author of the article. Veronika Kopačková provided the laboratory measurements and their interpretation, and information on the geological nature of the surface in the study area, as well as validation of the mineral classification. Petr Rojík provided detailed information on the mineralogy nature and source of the land surface. Guy Schwartz developed the IDL algorithm. Ido Livne was responsible for the digital maps, production and design. Eyal Ben Dor was the project supervisor and participated in all stages of work. All authors contributed to the writing of the article, each in his or her area of expertise.
Conflicts of Interest
The authors declare no conflict of interest.
References
- Hunt, G.R. Spectral signatures of particulate minerals in the visible and near infrared. Geophysics 1977, 42, 501–513. [Google Scholar]
- Kruse, F.A.; Thiry, M.; Hauff, P.L. Spectral identification (1.2–2.5 µm) and characterization of Paris basin kaolinite/smectite clays using a field spectrometer. Proceedings of the 5th International Colloquium—Physical Measurements and Signatures in Remote Sensing, Courcheve, France, 14–18 January 1991; pp. 181–184.
- Crowley, J.K. Mapping playa evaporite minerals AVIRIS data: A first report from Death Valley, California. Remote Sens. Environ 1993, 44, 337–356. [Google Scholar]
- Ben-Dor, E.; Irons, J.R.; Epema, G.F. Soil reflectance. In Remote Sensing for the Earth Science, Manual of Remote Sensing, 3rd ed; Wiley: New York, NY, USA, 1999; pp. 111–188. [Google Scholar]
- Kruse, F.A.; Boardman, J.W.; Huntington, J.F. Comparison of airborne hyperspectral data and EO-1 Hyperion for mineral mapping. IEEE Trans. Geosci. Remote Sens 2003, 41, 1388–1400. [Google Scholar]
- Rowan, L.C.; Mars, J.C. Lithologic mapping in the Mountain Pass, California area using Advanced Spaceborne Thermal Emission and Reflection Radiometer (ASTER) data. Remote Sens. Environ 2003, 84, 350–366. [Google Scholar]
- Kopackova, V.; Chevrel, S.; Bourguignon, A.; Rojik, P. Application of high altitude and ground-based spectroradiometry to mapping hazardous low-pH material derived from the Sokolov open-pit mine. J. Maps 2012, 8, 220–230. [Google Scholar]
- Kopackova, V. Using multiple spectral feature analysis for quantitative pH mapping in a mining environment. Int. J. Appl. Earth Obs. Geoinf 2014, 28, 28–42. [Google Scholar]
- Kopackova, V.; Misurec, J.; Lhotakova, Z.; Oulehle, F.; Albrechtova, J. Using multi-date high spectral resolution data to assess the physiological status of macroscopically undamaged foliage on a regional scale. Int. J. Appl. Earth Obs. Geoinf 2014, 27, 169–186. [Google Scholar]
- Almeida, R.M.; Gutton, T.A.; Pantano, C.G. Characterization of silica gels by infrared reflection spectroscopy. J. Non-Crystalline Solids 1990, 121, 193–197. [Google Scholar]
- Salisbury, J.W.; D’Aria, D.M. Emissivity of terrestrial materials in the 8–14 µm atmospheric window. Remote Sens. Environ 1992, 42, 83–106. [Google Scholar]
- Karakassides, M.A.; Petridis, D.; Gournis, D. Infrared reflectance study of thermally treated Li- and Cs-Montmorillonites. Clays Clay Miner 1997, 45, 649–658. [Google Scholar]
- Christensen, P.R.; Bandfield, J.L.; Hamilton, V.E.; Howard, D.A.; Lane, M.D.; Piatek, J.L.; Ruff, S.W.; Stefanov, W.L. A thermal emission spectral library of rock-forming minerals. J. Geophys. Res 2000, 105, 9735–9739. [Google Scholar]
- Maturilli, A.; Helbert, J.; Moroz, L. The Berlin Emissivity Database (BED). Planet. Space Sci 2008, 56, 420–425. [Google Scholar]
- Baldridge, A.M.; Hook, S.J.; Grove, C.I.; Rivera, G. The ASTER spectral library version 2.0. Remote Sens. Environ 2009, 113, 711–715. [Google Scholar]
- Yitagesu, F.A.; van der Meer, F.; van der Werff, H.; Hecker, C. Spectral characteristics of clay minerals in the 2.5–14μm wavelength region. Appl. Clay Sci. 2011, 53, 581–591. [Google Scholar]
- Hook, S.J.; Kahle, A.B. The micro fourier transform interferometer (µFTIR)—A new field spectrometer for acquisition of infrared data of natural surfaces. Remote Sens. Environ 1996, 56, 172–181. [Google Scholar]
- Hook, S.J.; Dmochowski, J.E.; Howard, K.A.; Rowan, L.C.; Karlstrom, K.E.; Stock, J.M. Mapping variations in weight percent silica measured from multispectral thermal infrared imagery—Examples from the Hiller Mountains, Nevada, USA and Tres Virgenes-La Reforma, Baja California Sur, Mexico. Remote Sens. Environ 2005, 95, 273–289. [Google Scholar]
- Ninomiya, Y.; Fu, B.; Cudahy; Thomas, J. Detecting lithology with Advanced Spaceborne Thermal Emission and Reflection Radiometer (ASTER) multispectral thermal infrared “radiance-at-sensor” data. Remote Sens. Environ 2005, 99, 127–139. [Google Scholar]
- Vaughan, R.G.; Hook, S.J.; Calvin, W.M.; Taranik, J.V. Surface mineral mapping at Steamboat Springs, Nevada, USA, with multi-wavelength thermal infrared images. Remote Sens. Environ 2005, 99, 140–158. [Google Scholar]
- Vicente, L.E.; de Souza Filho, C.R. Identification of mineral components in tropical soils using reflectance spectroscopy and Advanced Spaceborne Thermal Emission and Reflection Radiometer (ASTER) data. Remote Sens. Environ 2011, 115, 1824–1836. [Google Scholar]
- Casey, K.A.; Kaab, A.; Benn, D.I. Geochemical Characterization of supraglacial debris via in situ and optical remote sensing methods: A case study in Khumbu Himalaya, Nepal. Cryosphere 2012, 6, 85–100. [Google Scholar]
- Eisele, A.; Lau, I.; Hewson, R.; Carter, D.; Wheaton, B.; Ong, C.; Cudahy, T.J.; Chabrillat, S.; Kaufmann, H. Applicability of the thermal infrared spectral region for the prediction of soil properties across semi-arid agricultural landscapes. Remote Sens 2012, 4, 3265–3286. [Google Scholar]
- Stivaletta, N.; Dellisanti, F.; D’Elia, M.; Fonti, S.; Mancarella, F. Multiple techniques for mineral identification of terrestrial evaporites relevant to Mars exploration. Icarus 2013, 224, 86–96. [Google Scholar]
- Clark, R.N.; King, T.V.V.; Klejwa, M.; Swayze, G.A.; Vergo, N. High spectral resolution reflectance spectroscopy of minerals. J. Geophys. Res 1990, 95, 12653–12680. [Google Scholar]
- Ben-Dor, E.; Chabrillat, S.; Dematte, J.A.M.; Taylor, G.R.; Hill, J.; Whiting, M.L.; Sommer, S. Using imaging spectroscopy to study soil properties. Remote Sens. Environ 2009, 113, S38–S55. [Google Scholar]
- Rojik, P. New stratigraphic subdivision of the Tertiary in the Sokolov Basin in Northwestern Bohemia. J. Czech. Geol. Soc. 2004, 49, 173–185. [Google Scholar]
- The INTA AHS System. Available online: http://bo.eufar.net/document/publi/124901161346543eefc58cf:SPIE_RS05_INTA_5978-56.pdf (accessed on 20 May 2014).
- Sobrino, J.A.; Jimenez-Munoz, J.C.; Zarco-Tejada, P.J.; Sepulcre-Canto, G.; de Miguel, E.; Soria, G.; Romaguera, M.; Julien, Y.; Cuenca, J.; Hidalgo, V.; et al. Thermal remote sensing from Airborne Hyperspectral Scanner data in the framework of the SPARC and SEN2FLEX projects: An overview. Hydrol. Earth Syst. Sci 2009, 13, 2031–2037. [Google Scholar]
- Jimenez-Munoz, J.C.; Sobrino, J.A.; Gillespie, A.R. Surface emissivity retrieval from airborne hyperspectral scanner data: Insights on atmospheric correction and noise removal. IEEE Geosci. Remote Sens. Lett 2012, 9, 180–184. [Google Scholar]
- Gillespie, A.; Rokugawa, S.; Matsunaga, T.; Cothern, J.S.; Hook, S.; Kahle, A.B. A temperature and emissivity separation algorithm for Advanced Spaceborne Thermal Emission and Reflection Radiometer (ASTER) images. IEEE Trans. Geosci. Remote Sens 1998, 36, 1113–1126. [Google Scholar]
- The Johns Hopkins University Spectral Library. Available online: The ASTER spectral library http://speclib.jpl.nasa.gov/documents/jhu_desc (accessed on 20 May 2014).
- ImSpec LLC, Advanced Imaging and Spectroscopy. Available online: http://www.imspec.com (accessed on 20 May 2014).
- CI Systems Remote Sensing. Available online: http://www.ci-systems.com/SR-5000N-Spectroradiometer (accessed on 20 May 2014).
- Tanner, C.B.; Jackson, M.L. Nomographs of sedimentation times for soil particles under gravity or centrifugal acceleration. Soil Sci. Soc. Am. Proc 1948, 12, 60–65. [Google Scholar]
- NEWMOD a Computer Program for the Calculation of One-Dimensional Diffraction Patterns of Mixed-Layer Clays. Available online: http://www.angelfire.com/md/newmod/origindex.html (accessed on 20 May 2014).
- The spectral Library Hosted by the Mars Space Flight Facility at Arizona State University. Available online: http://speclib.asu.edu (accessed on 20 May 2014).


| Sample | Mineral Composition from Major to Minor (Trace Minerals Are not Included) | ΔԐ | |
|---|---|---|---|
| BO1 | Quartz |  | 0.136 |
| BO2 | Quartz, Muscovite, Kaolinite | 0.096 | |
| BO3 | Quartz, Kaolinite, Muscovite | 0.037 | |
| PKV1 | Quartz, Muscovite, Kaolinite | 0.034 | |
| PKV2 | Quartz, Albite, Orthoclase, Muscovite, Clinochlore, Kaolinite | 0.020 | |
| PKV3 | Kaolinite, Quartz, Muscovite, Anatase | −0.032 | |
| PKV4 | Kaolinite, Anatase, Quartz, Goethite | −0.030 |
| Sample | Mineral Composition from Major to Minor (Trace Minerals are not Included) | CR2.196 µm | CR2.165 µm | |
|---|---|---|---|---|
| PKV4 | Kaolinite, Anatase, Quartz, Goethite |  | 0.198 (0.340) | 0.052 (0.130) |
| PKV3 | Kaolinite, Quartz, Muscovite, Anatase | 0.164 (0.181) | 0.047 (0.044) | |
| PKV1 | Quartz, Muscovite, Kaolinite | 0.129 (0.139) | 0.018 (0.021) | |
| PKV2 | Quartz, Albite, Orthoclase, Muscovite, Clinochlore, Kaolinite | 0.094 (0.094) | 0.008 (0) | |
© 2014 by the authors; licensee MDPI, Basel, Switzerland This article is an open access article distributed under the terms and conditions of the Creative Commons Attribution license (http://creativecommons.org/licenses/by/3.0/).
Share and Cite
Notesco, G.; Kopačková, V.; Rojík, P.; Schwartz, G.; Livne, I.; Dor, E.B. Mineral Classification of Land Surface Using Multispectral LWIR and Hyperspectral SWIR Remote-Sensing Data. A Case Study over the Sokolov Lignite Open-Pit Mines, the Czech Republic. Remote Sens. 2014, 6, 7005-7025. https://doi.org/10.3390/rs6087005
Notesco G, Kopačková V, Rojík P, Schwartz G, Livne I, Dor EB. Mineral Classification of Land Surface Using Multispectral LWIR and Hyperspectral SWIR Remote-Sensing Data. A Case Study over the Sokolov Lignite Open-Pit Mines, the Czech Republic. Remote Sensing. 2014; 6(8):7005-7025. https://doi.org/10.3390/rs6087005
Chicago/Turabian StyleNotesco, Gila, Veronika Kopačková, Petr Rojík, Guy Schwartz, Ido Livne, and Eyal Ben Dor. 2014. "Mineral Classification of Land Surface Using Multispectral LWIR and Hyperspectral SWIR Remote-Sensing Data. A Case Study over the Sokolov Lignite Open-Pit Mines, the Czech Republic" Remote Sensing 6, no. 8: 7005-7025. https://doi.org/10.3390/rs6087005