Evaluation of MODIS LST Products Using Longwave Radiation Ground Measurements in the Northern Arid Region of China


Abstract
:1. Introduction
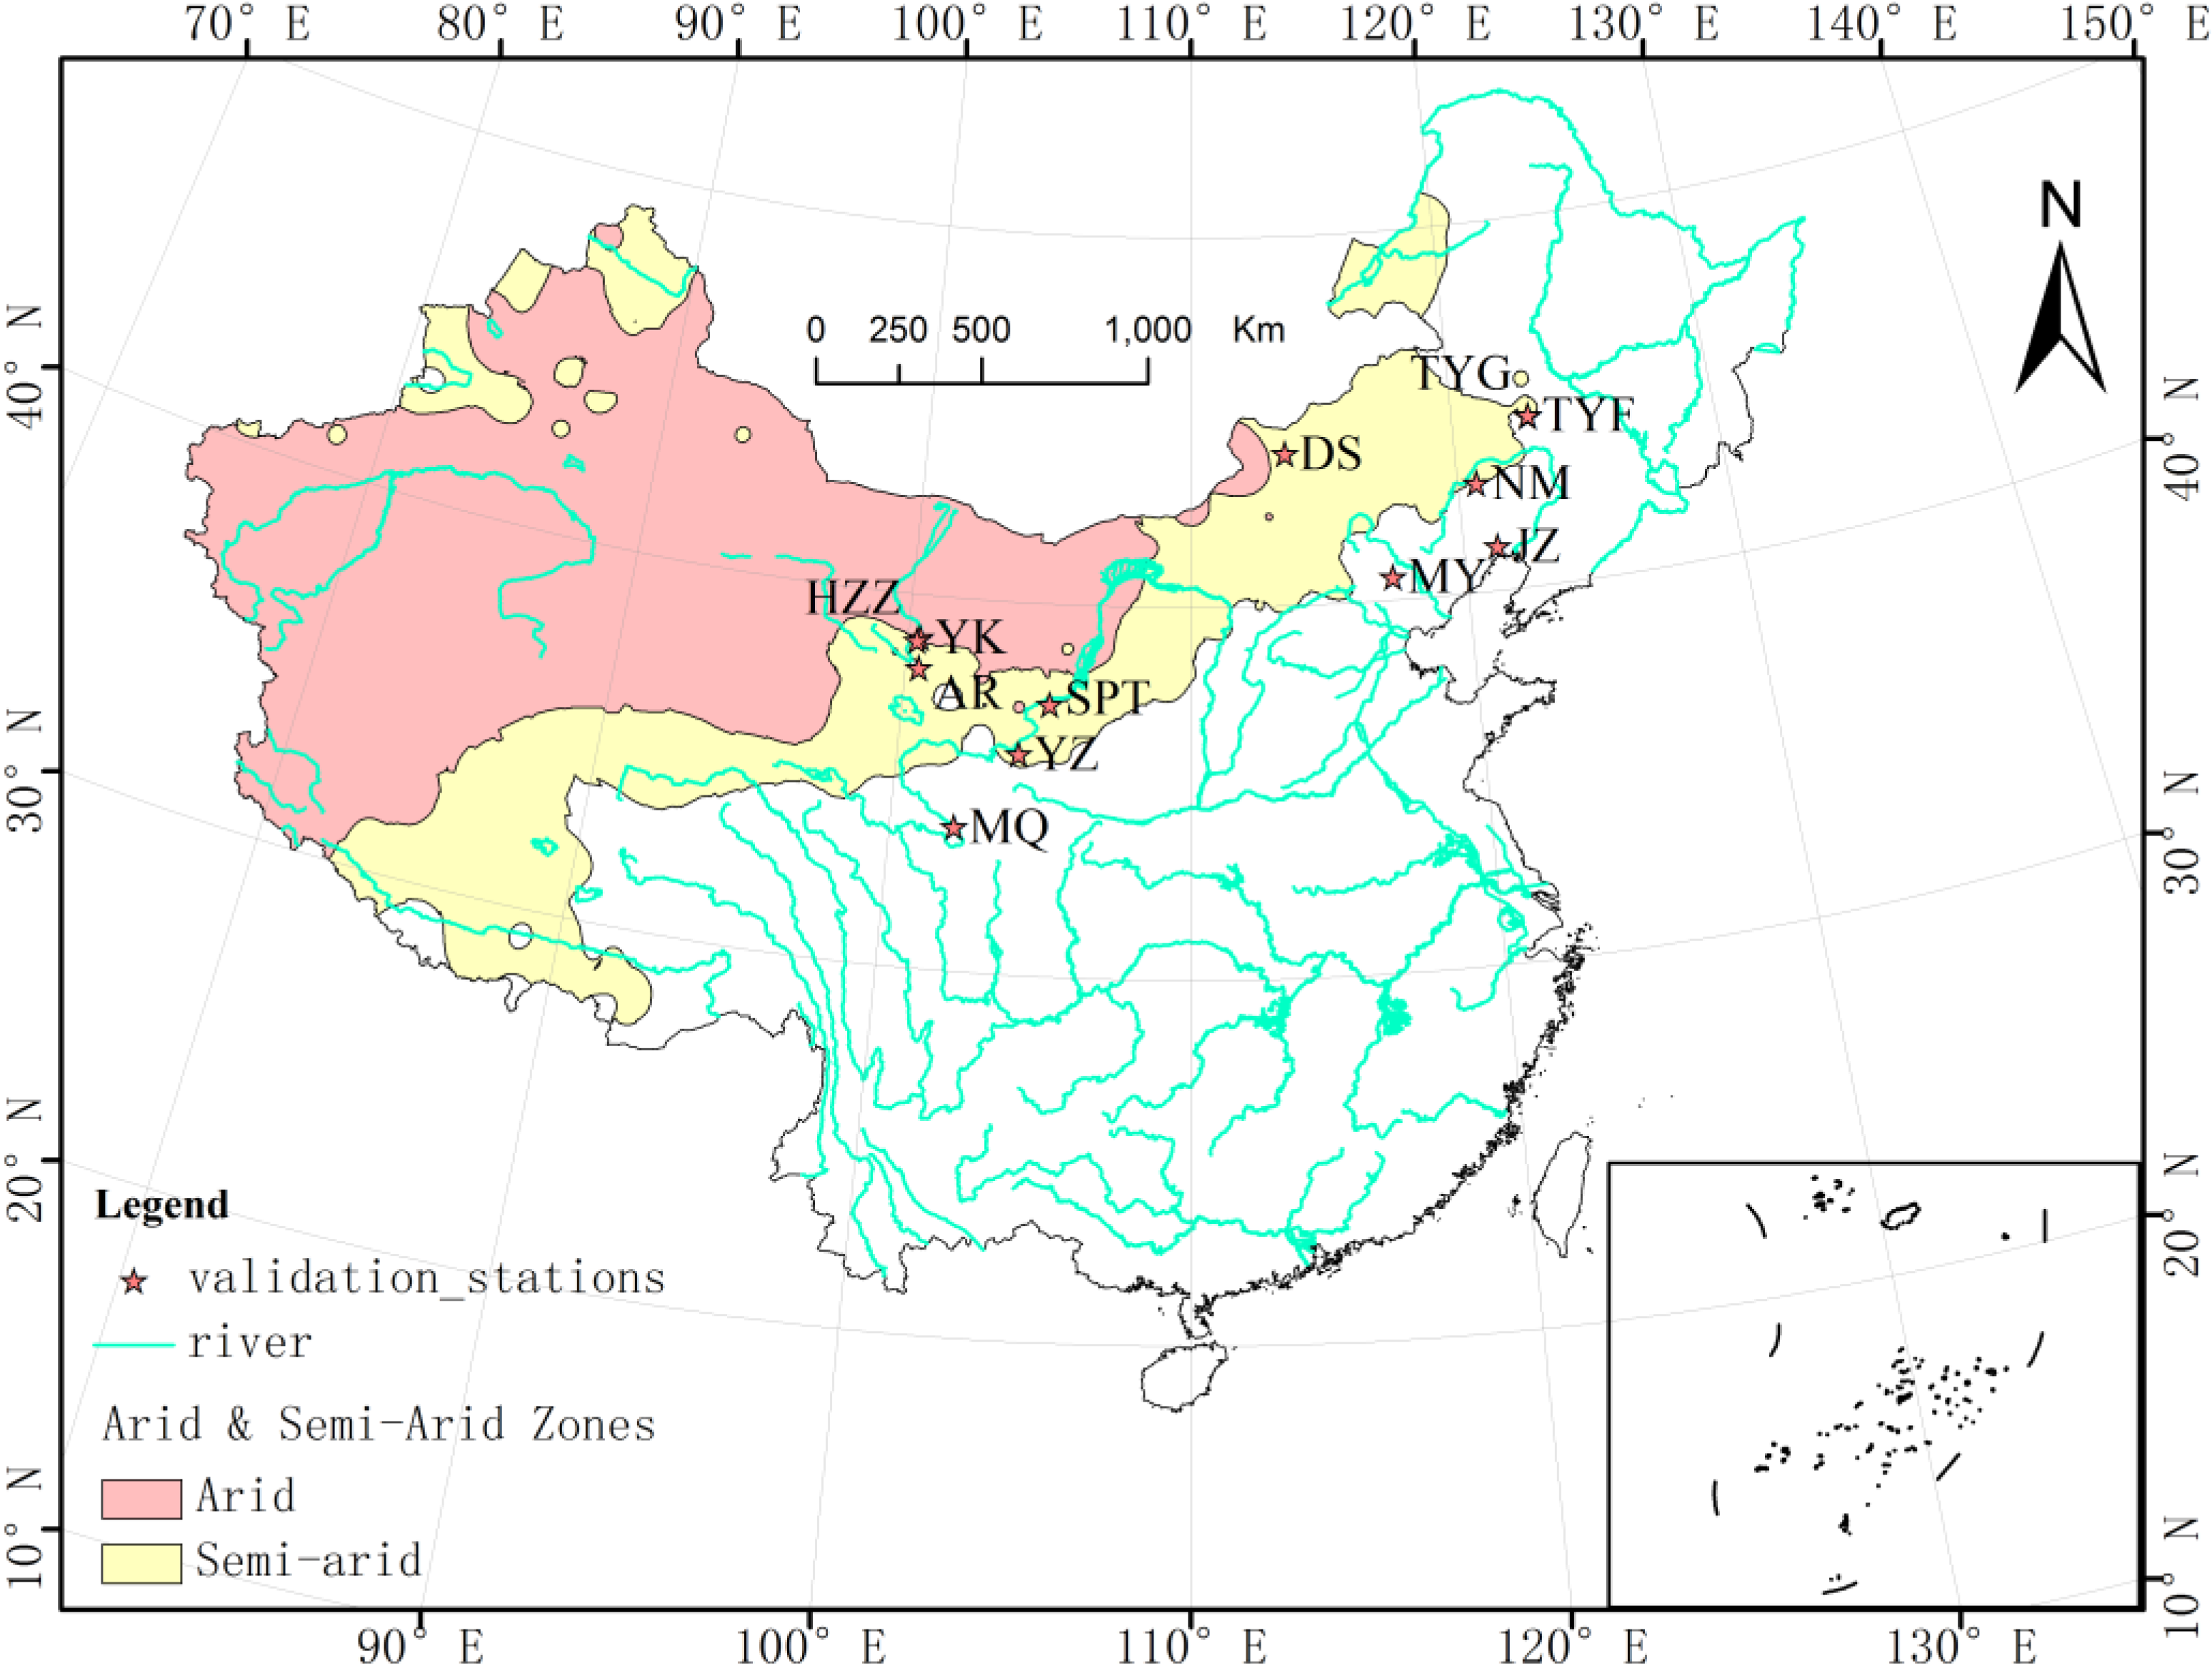
2. Study Area

| Name | Abridged Notation | Latitude Longitude | Elevation (m) | Land Cover | Available Data a |
|---|---|---|---|---|---|
| A’rou freeze/thaw observation | AR | 38.0444N | 3033 | Alpine meadow | 2008, 2009 |
| 100.46E | |||||
| Naiman desertification research station | NM | 42.9288N | 361 | Degradation grassland desert | 2008 |
| 120.6978E | |||||
| Yingke oasis station | YK | 38.8571N | 1519 | Cropland (maize) | 2008, 2009 |
| 100.4103E | |||||
| Yuzhong semi-arid climate and environmental station | YZ | 35.9500N | 1965 | Low grass | 2008, 2009 |
| 104.1330E | |||||
| Shapotou observation | SPT | 37.3200N | 1227 | Desert | 2009 |
| 105.1100E | |||||
| Maqu comprehensive climate and environmental station in the Yellow River source region | MQ | 33.8872N | 3423 | Wetland | 2008 |
| 102.1416E | |||||
| Miyun station in Beijing | MY | 40.6308N | 350 | Interplant (apple tree and corn) | 2008, 2009 |
| 117.3235E | |||||
| Jinzhou cropland ecosystem observation station | JZ | 41.1841N | 22 | Cropland (maize) | 2008, 2009 |
| 121.2107E | |||||
| Dongsu wilderness grasslands ecosystem station in Inner Mongolia | DS | 44.0889N | 970 | Desert steppe | 2008, 2009 |
| 113.5742E | |||||
| Tongyu grass station of CEOP-based observations | TYG | 44.5673N | 184 | Grassland | 2008, 2009 |
| 122.9170E | |||||
| Tongyu farmland station of CEOP-based observations | TYF | 44.5913N | 184 | Cropland | 2008, 2009 |
| 122.9280E | |||||
| Huazhaizi desert station | HZZ | 38.7652N | 1726 | Desert steppe | 2008, 2009 |
| 100.3186E |

3. Method
3.1. LST Retrieval from the Ground Measurements
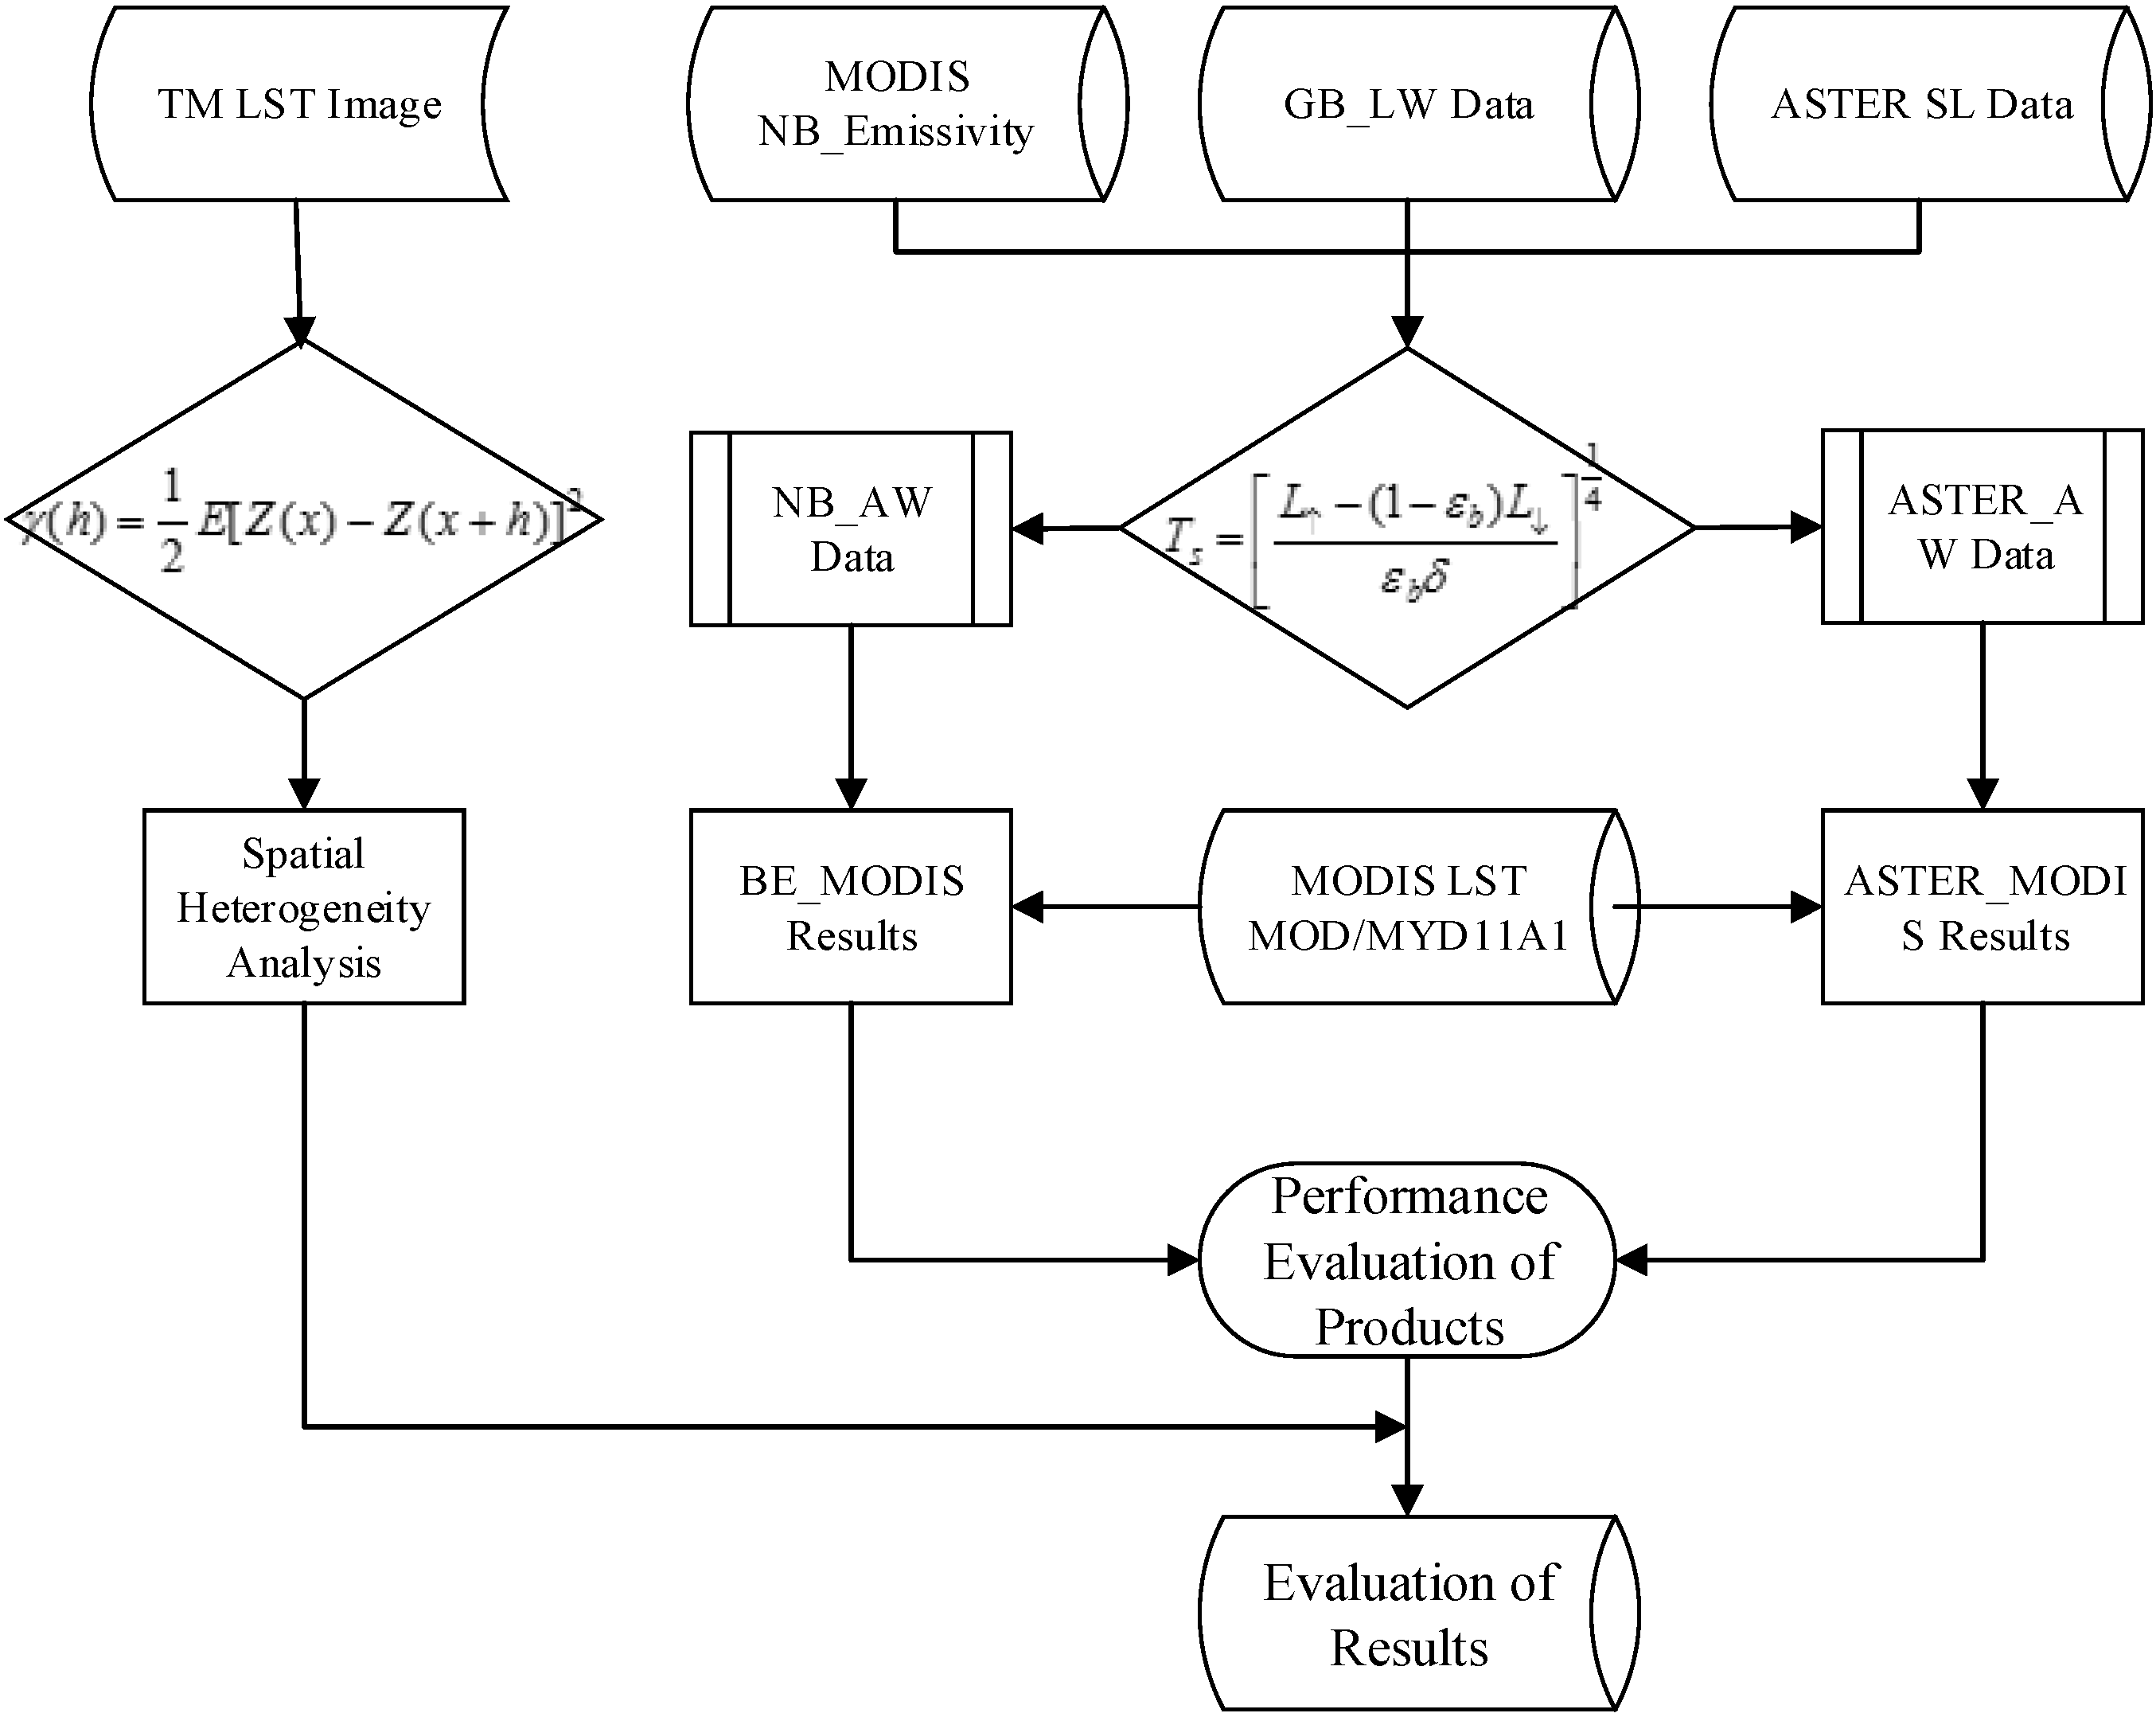
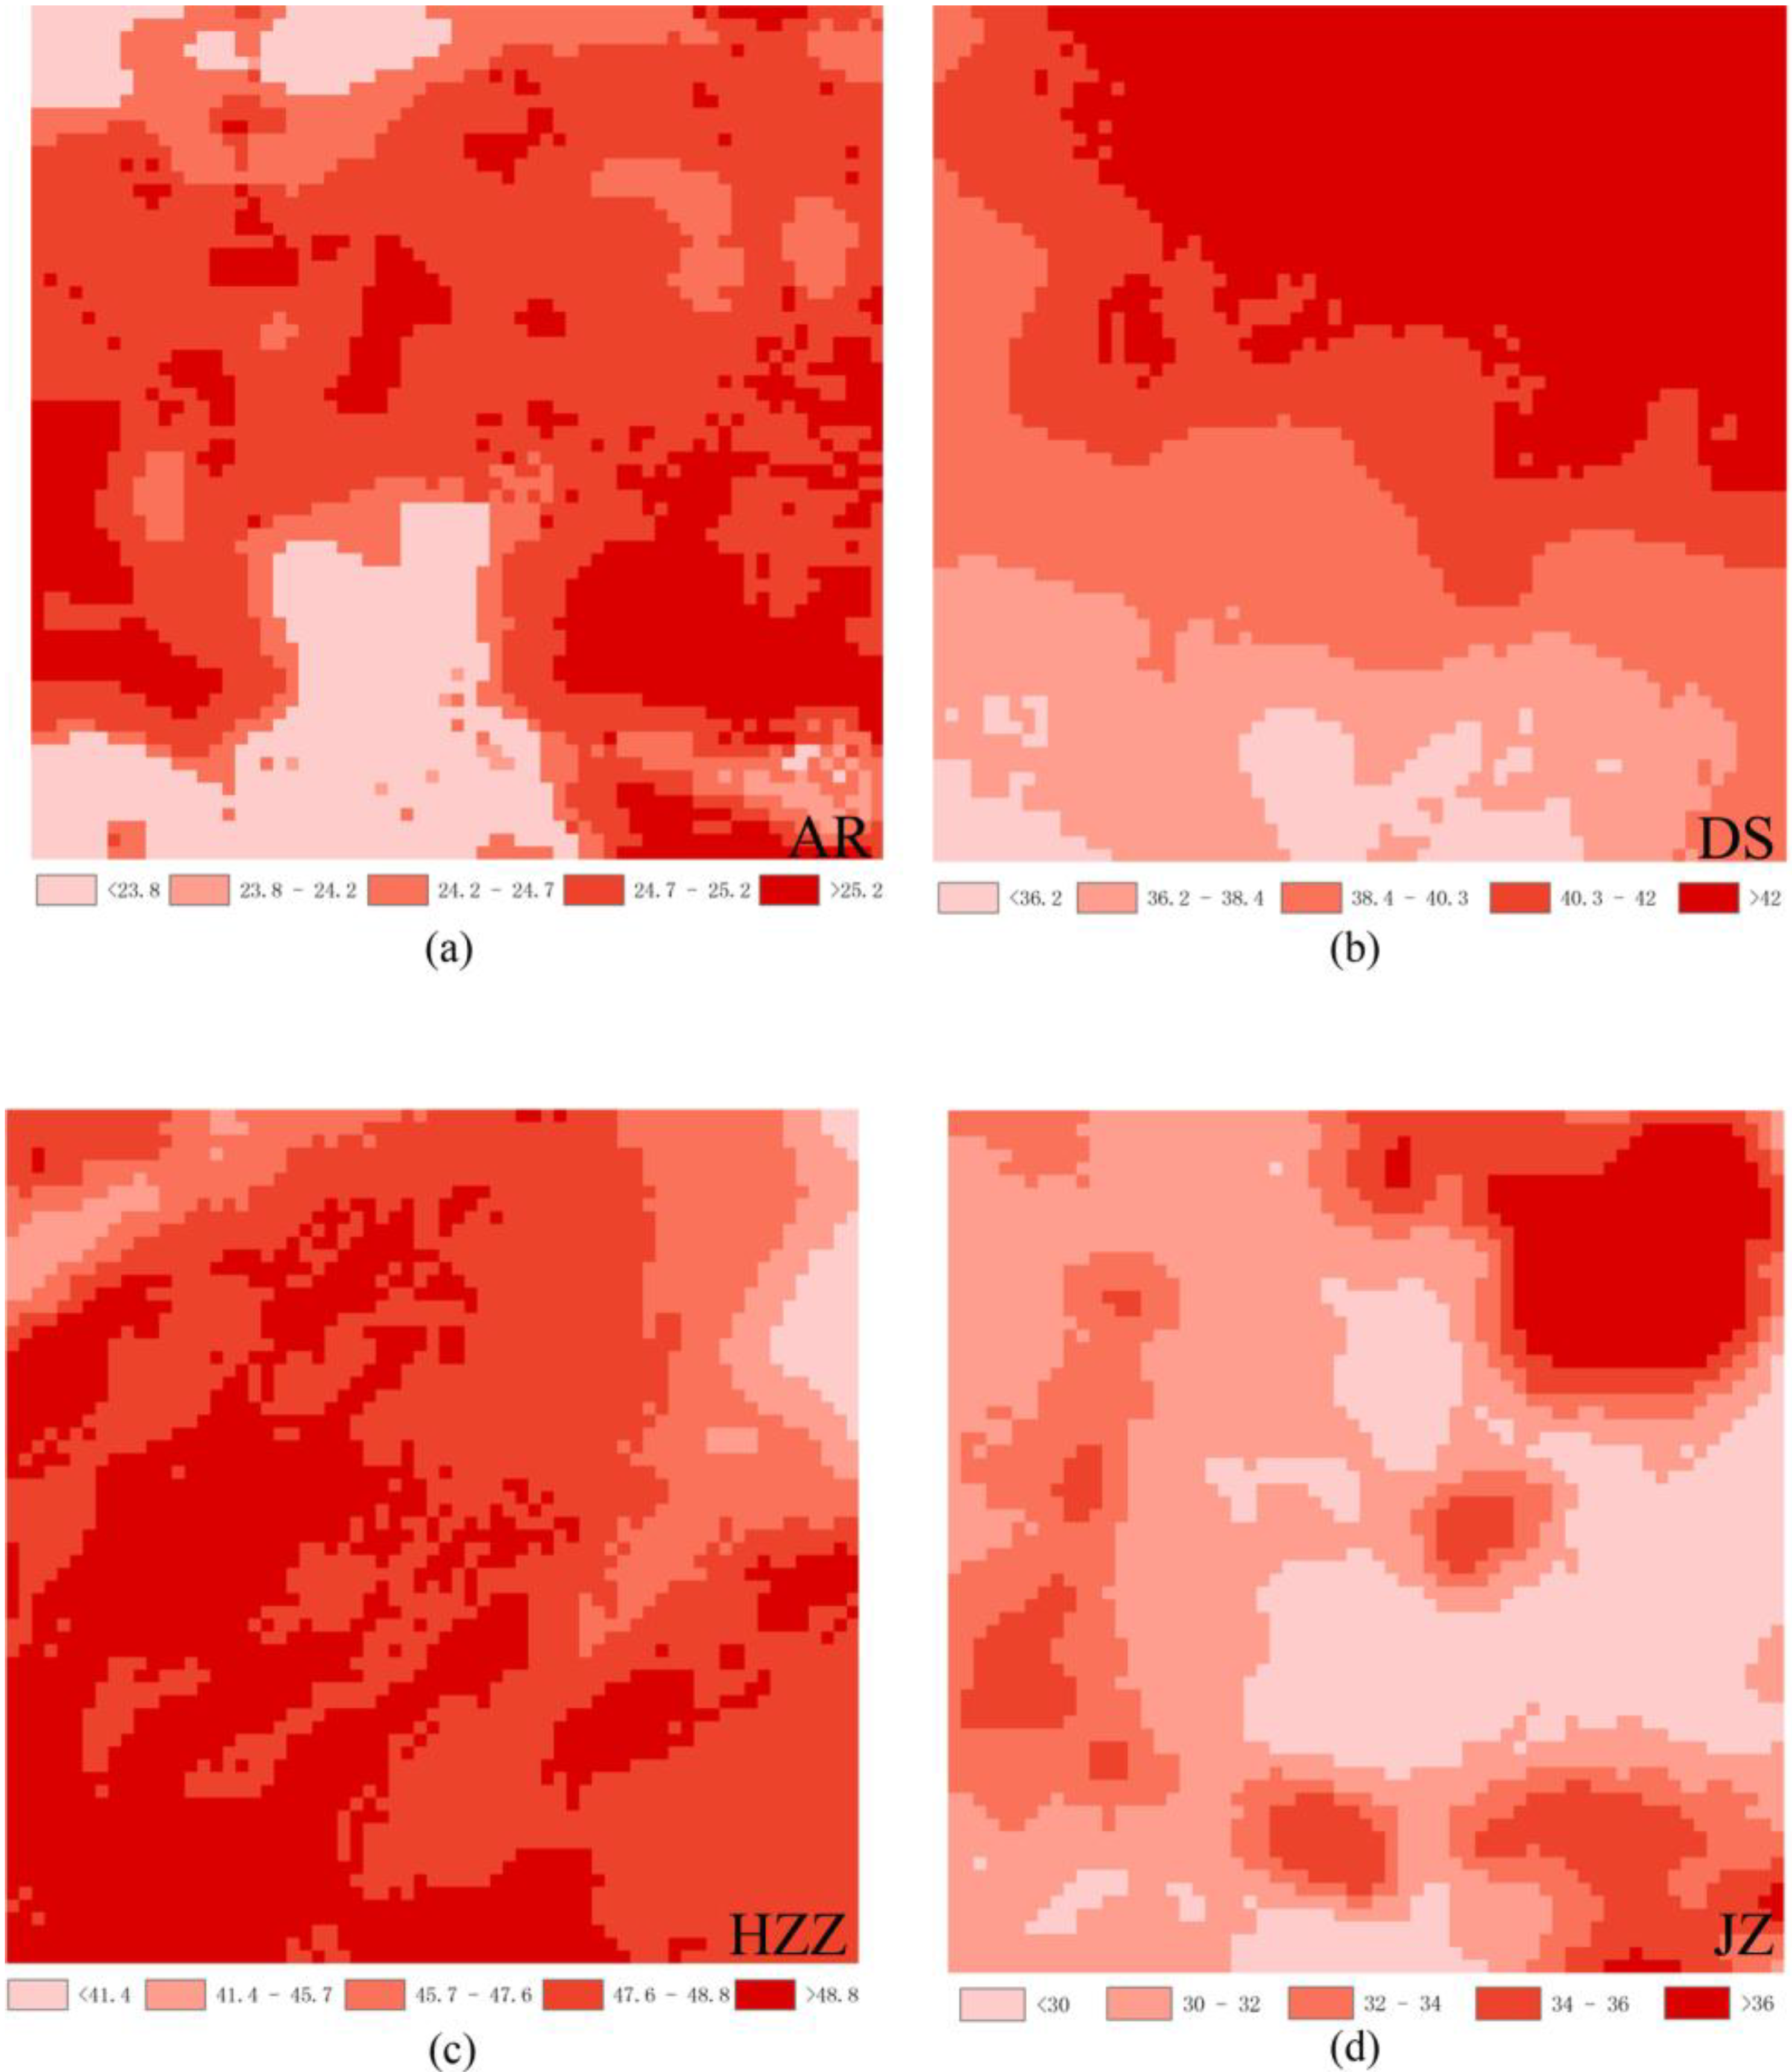
3.2. Spatial Heterogeneity Analysis
4. Data and Reprocessing
4.1. MODIS Data
4.2. TM Data
| TM Image Files a | Latitude | Longitude | Passover Time (GMT) | τ | Lu | Ld |
|---|---|---|---|---|---|---|
| L5120029_02920090715 | 44.61 | 122.79 | 02:22:37 | 0.6 | 2.67 | 4.24 |
| L5120031_03120090715 | 41.76 | 121.81 | 02:23:25 | 0.62 | 3.02 | 4.7 |
| L5121030_03020090810 | 43.18 | 120.72 | 02:30:42 | 0.84 | 1.22 | 2.05 |
| L5123032_03220090922 | 40.32 | 116.7 | 02:43:22 | 0.89 | 0.82 | 1.38 |
| L5126029_02920090725 | 44.6 | 113.52 | 02:59:51 | 0.76 | 1.73 | 2.85 |
| L5130034_03420090806 | 37.47 | 105.02 | 03:26:45 | 0.76 | 01.8 | 3.02 |
| L5130035_03520090806 | 36.04 | 104.59 | 03:27:09 | 0.81 | 1.37 | 2.29 |
| L5131036_03620090728 | 34.61 | 102.64 | 03:33:35 | 0.89 | 0.68 | 1.18 |
| L5133033_03320090811 | 38.89 | 100.81 | 03:44:58 | 0.94 | 0.44 | 1.78 |
| L5133034_03420090811 | 37.47 | 100.38 | 03:45:21 | 0.93 | 0.46 | 0.81 |
4.3. Ground Measurements
5. Results and Discussion
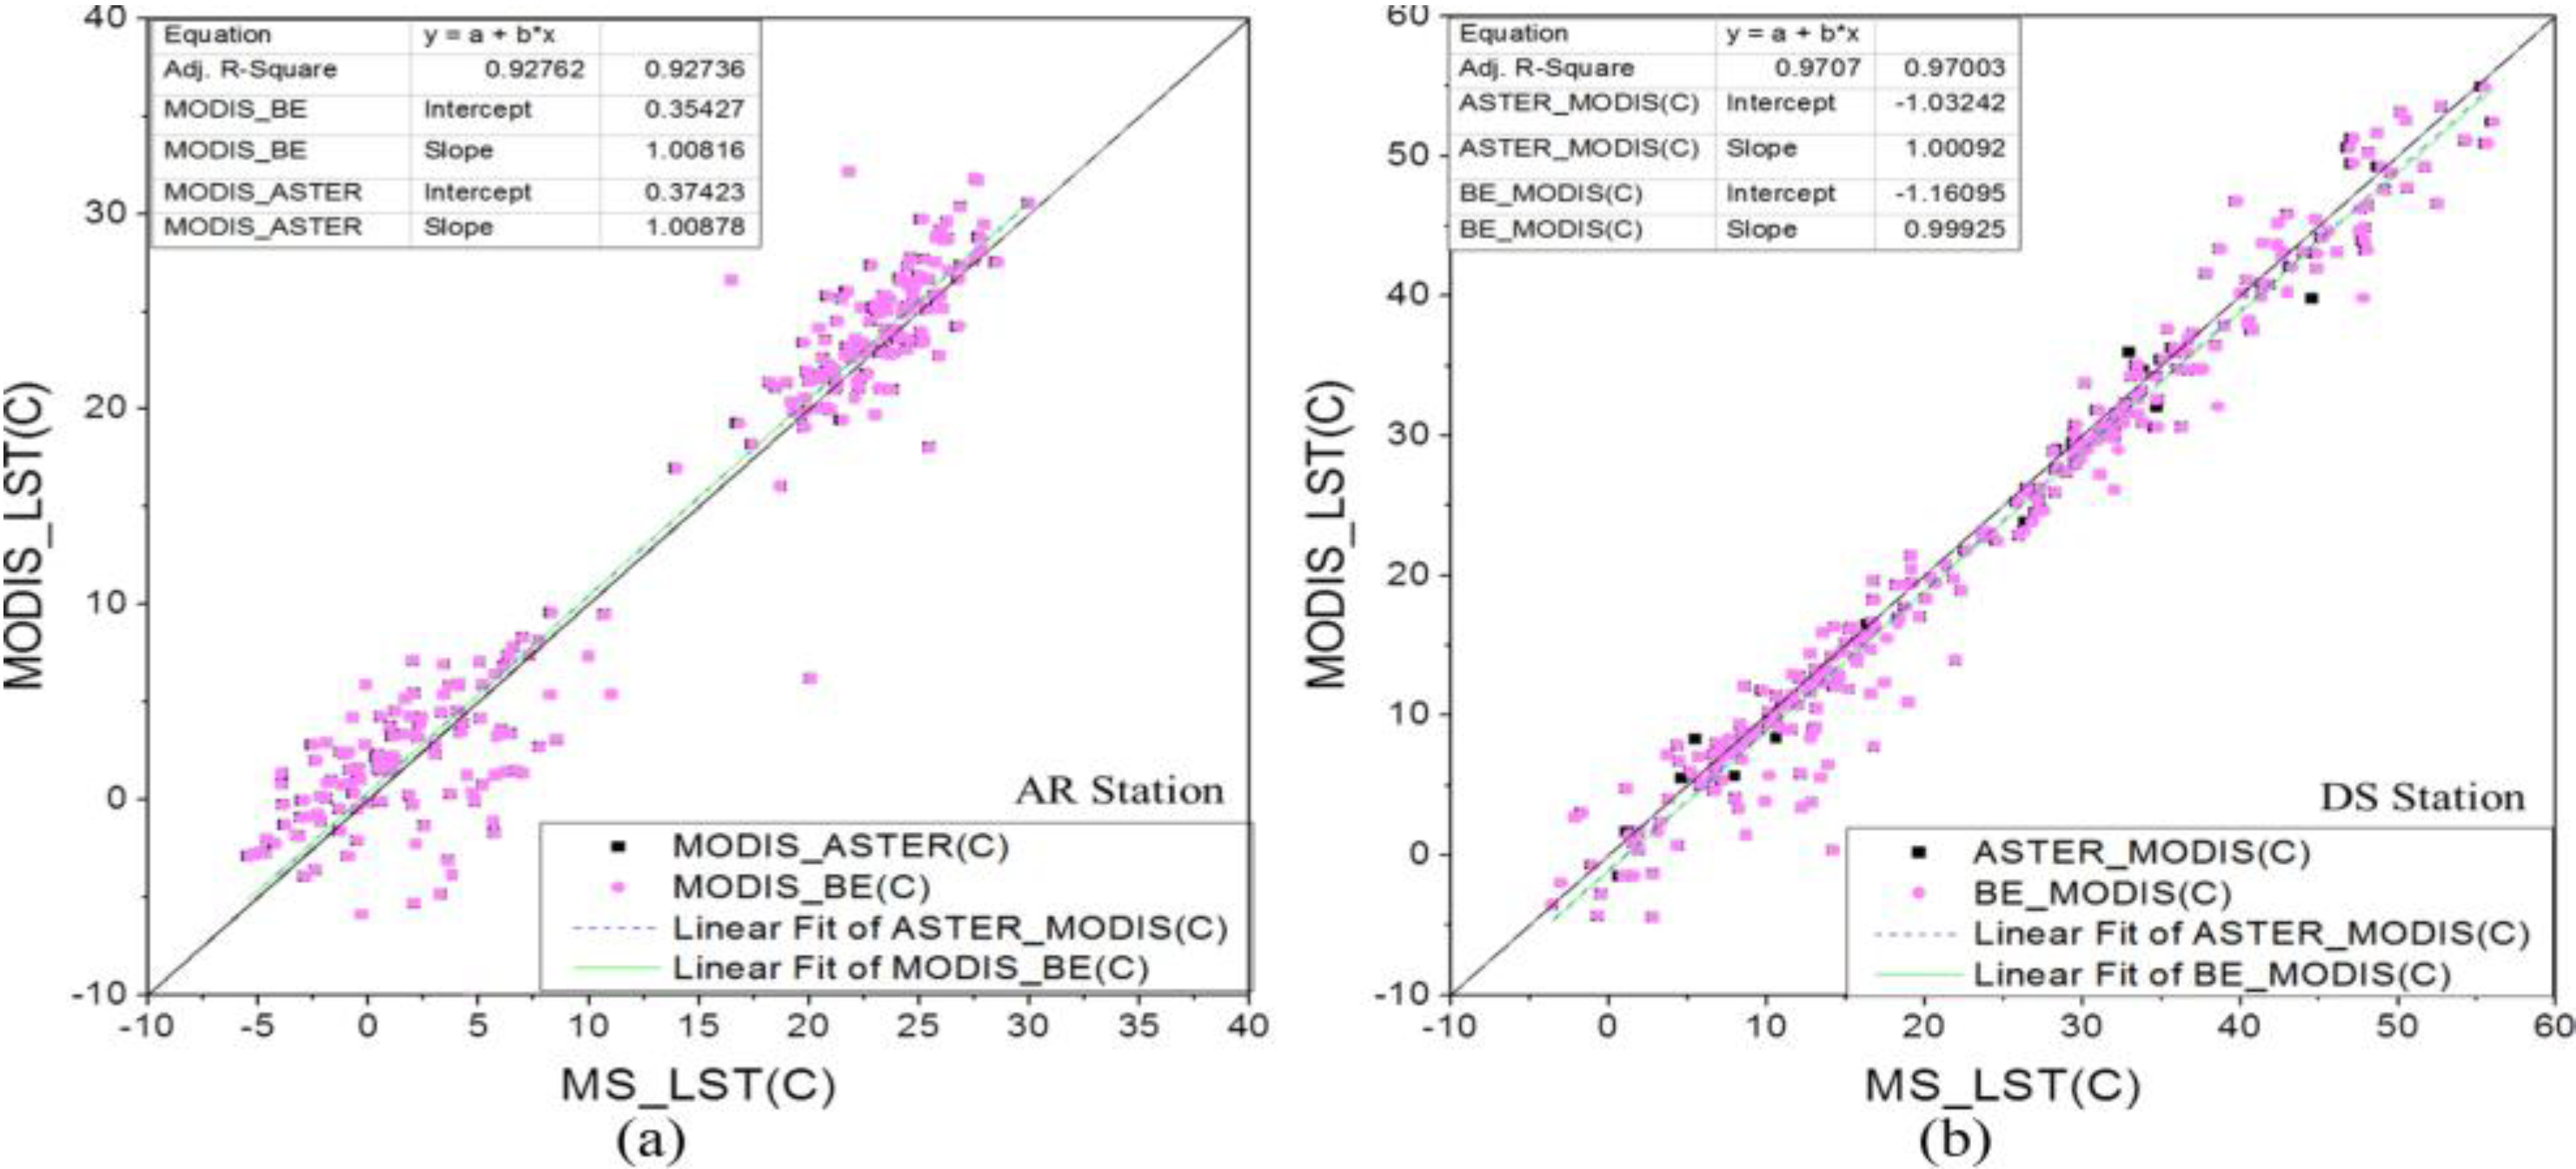
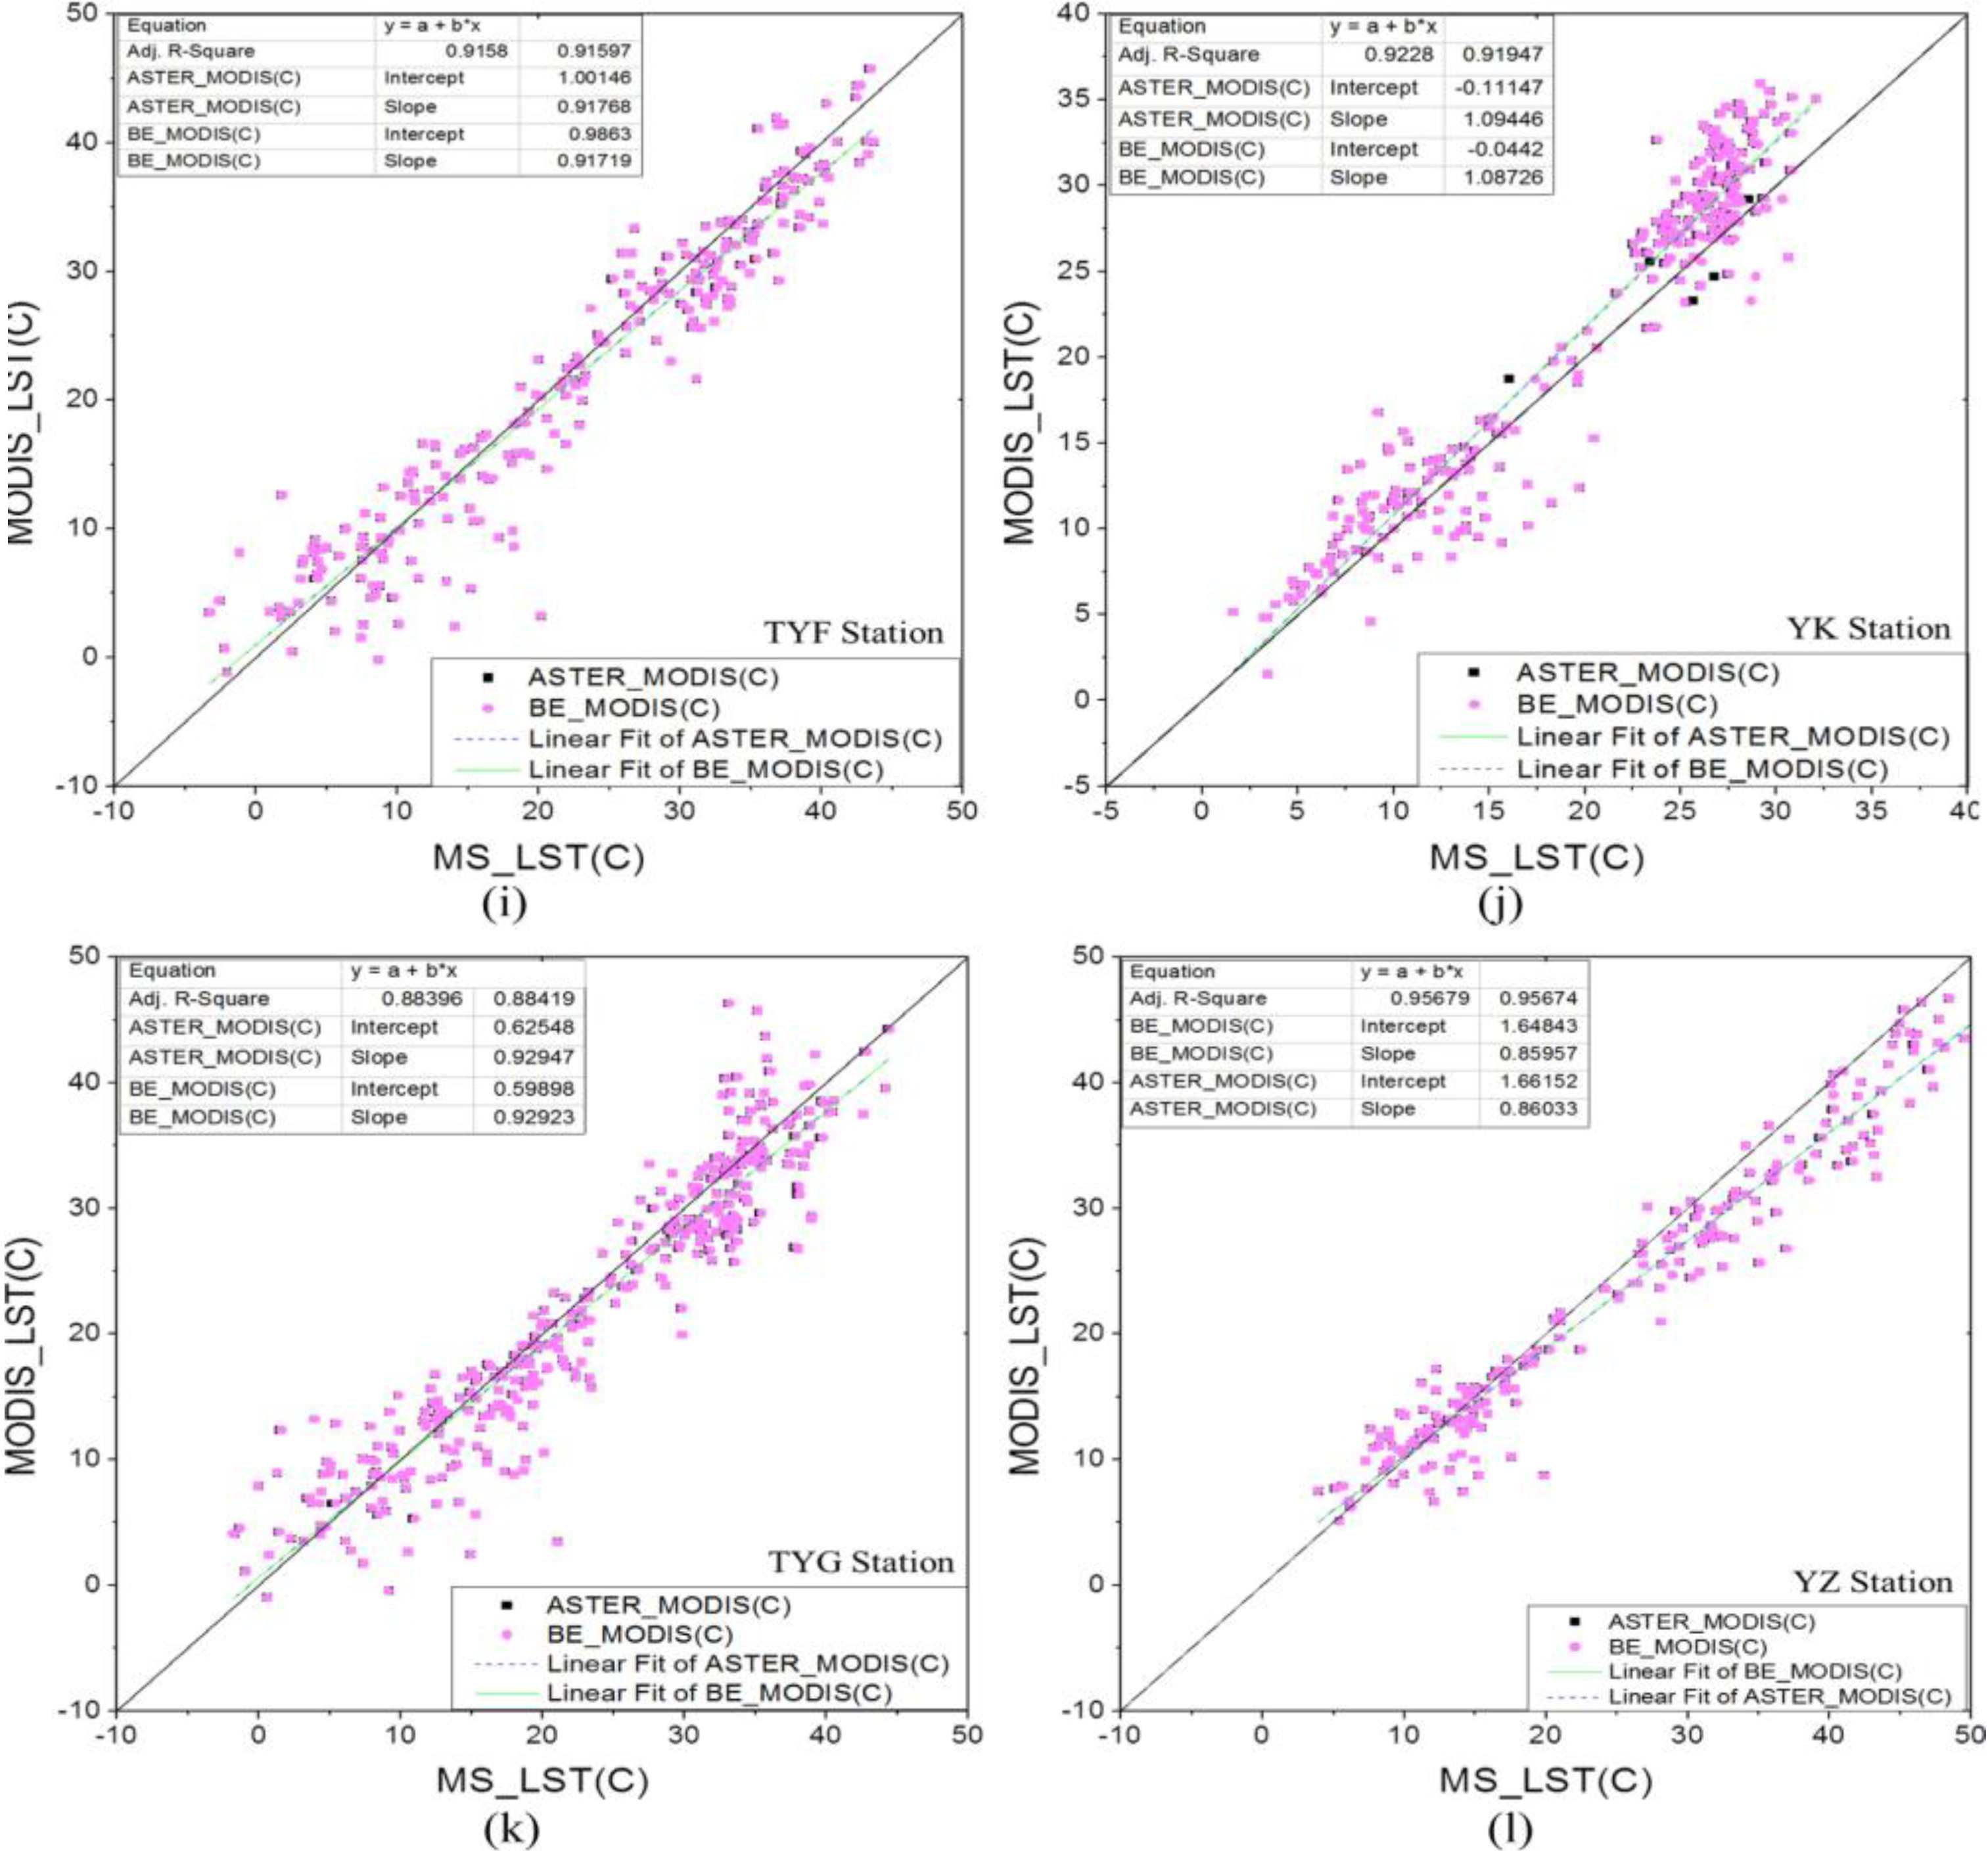
5.1. Presentation of Validation Results

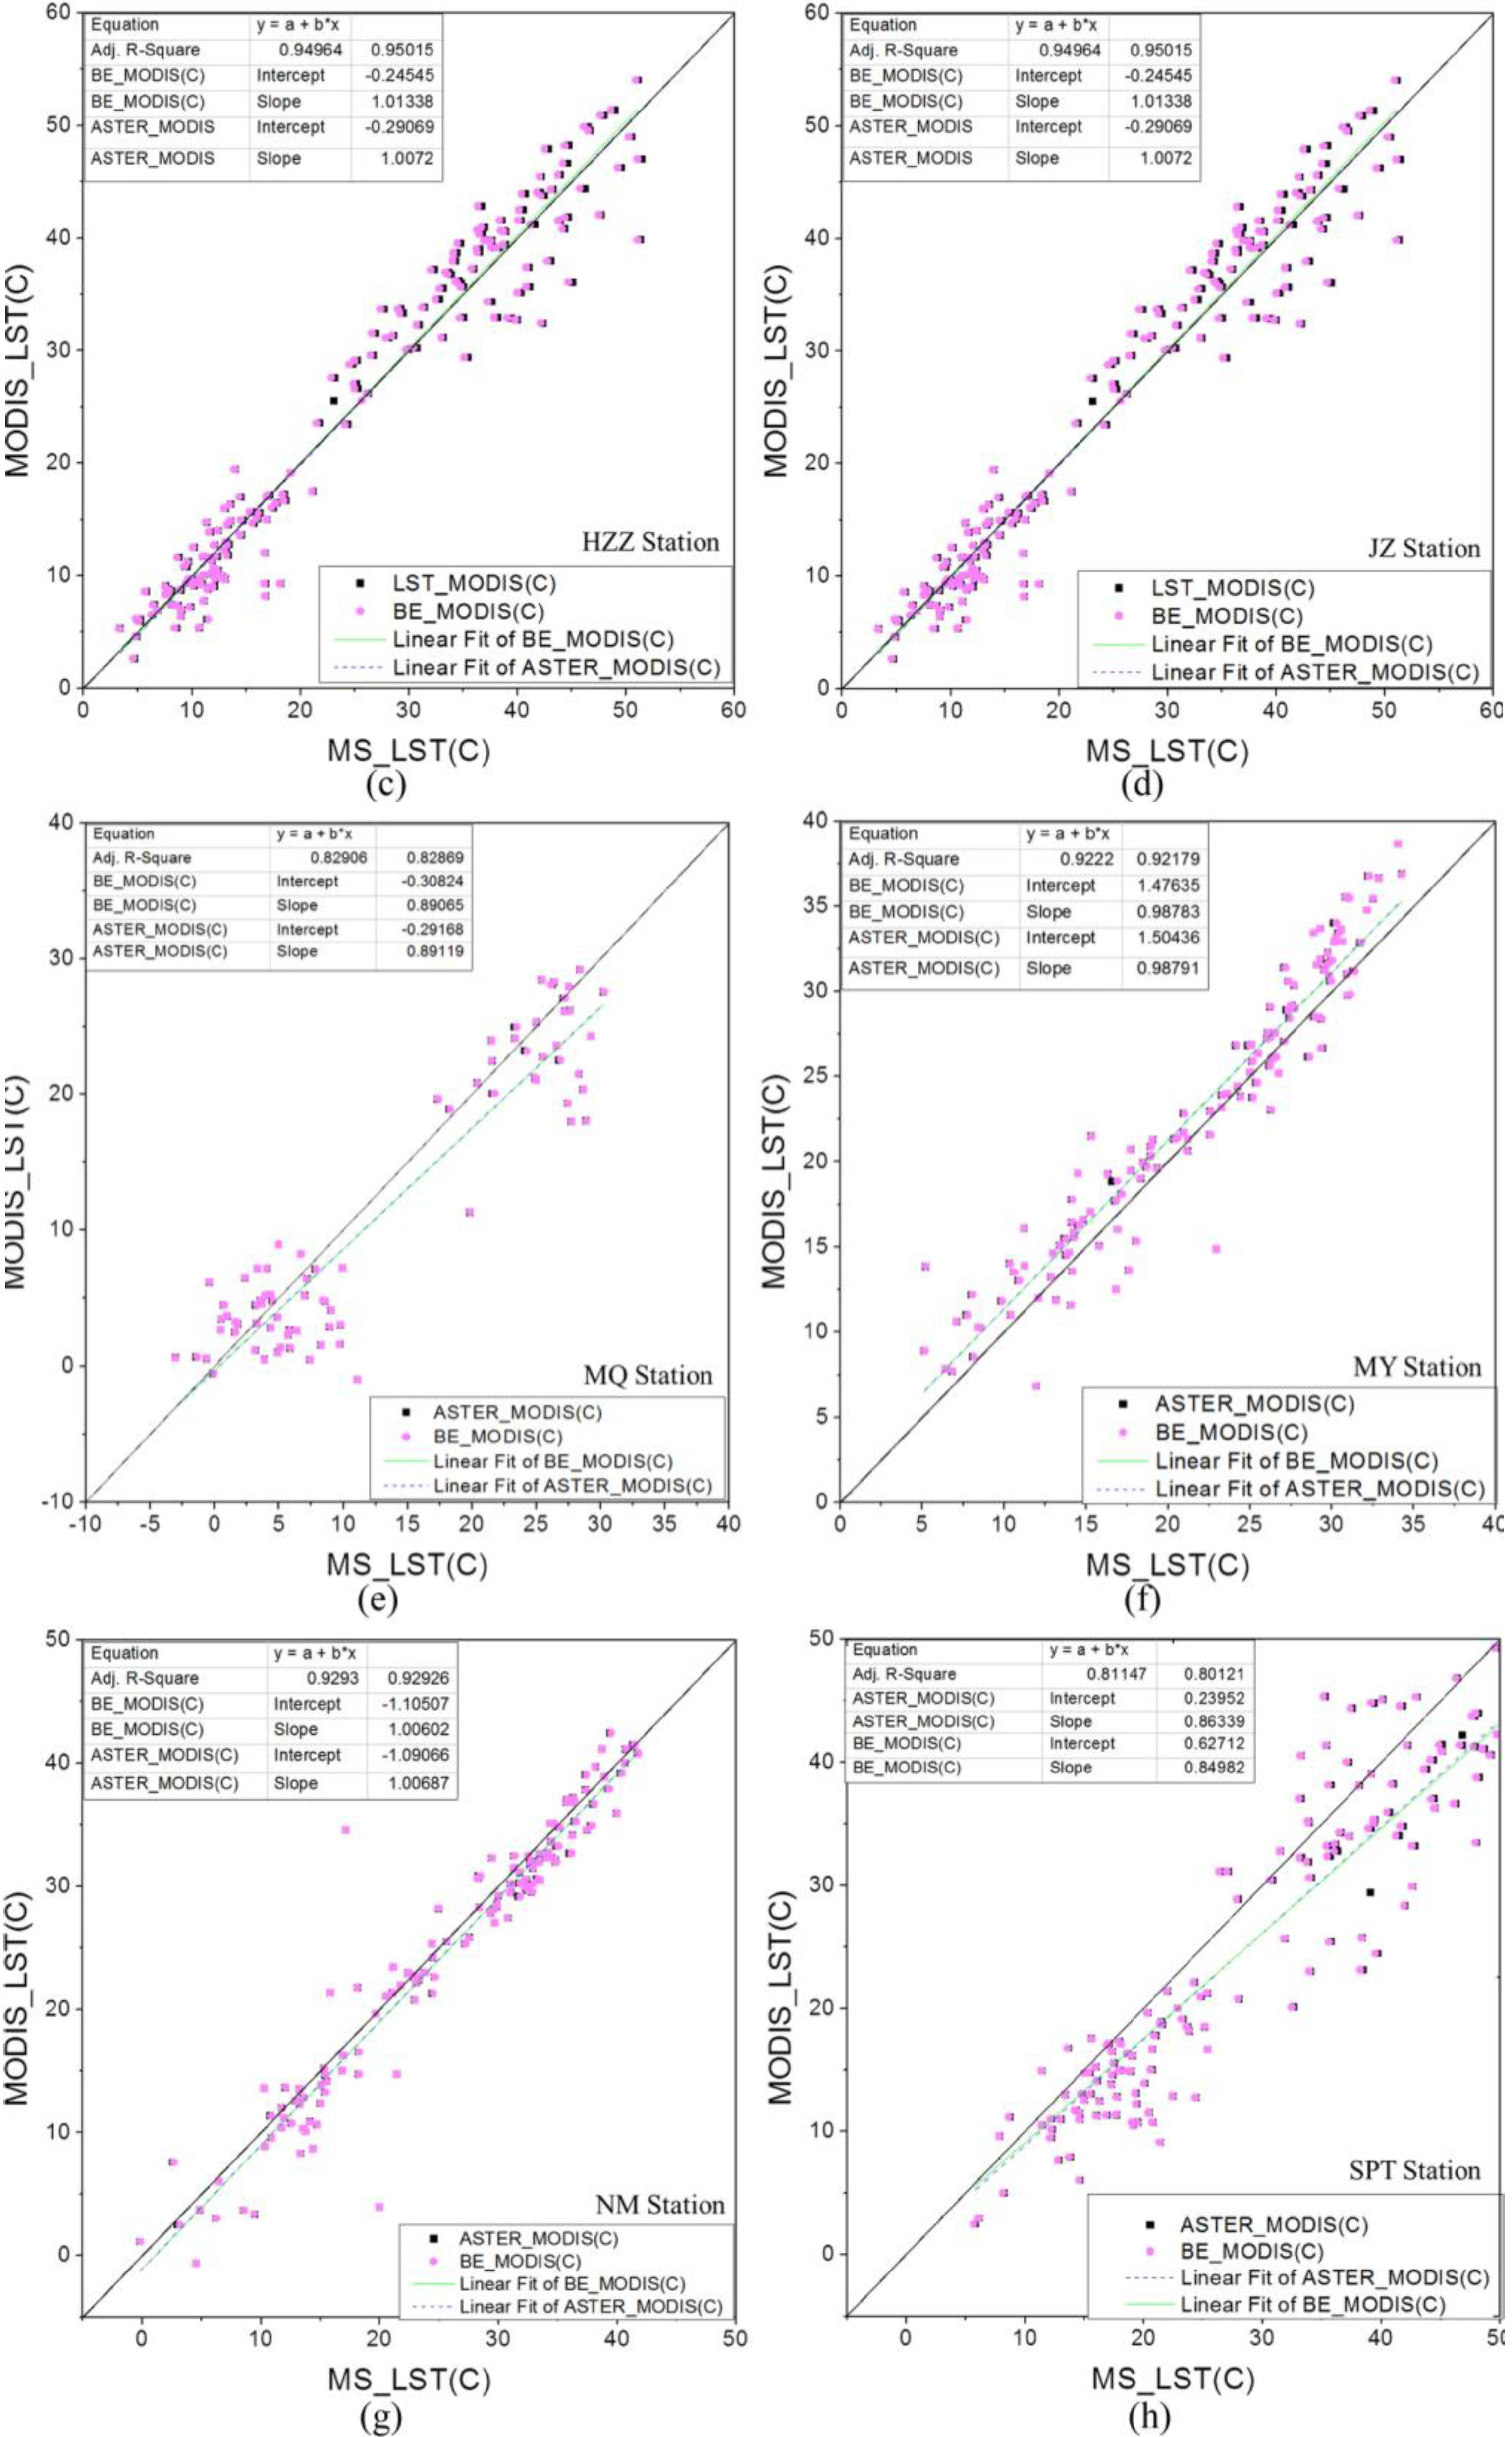

| Station | Bias (GMS-MODIS) a | MAE (|GMS-MODIS|) a | RMSE a | |||
|---|---|---|---|---|---|---|
| TASTER-TMODIS | TBE-TMODIS | TASTER-TMODIS | TBE-TMODIS | TASTER-TMODIS | TBE-TMODIS | |
| AR | −0.49 | −0.46 | 2.32 | 2.31 | 3.19 | 3.19 |
| DS | 1.01 | 1.18 | 1.99 | 2.07 | 2.79 | 2.88 |
| HZZ | 0.11 | −0.08 | 2.51 | 2.54 | 3.24 | 3.25 |
| JZ | −0.05 | 0.07 | 1.85 | 1.88 | 2.68 | 2.72 |
| MQ | 1.67 | 1.69 | 3.40 | 3.41 | 4.72 | 4.73 |
| MY | −1.24 | −1.21 | 2.03 | 2.01 | 2.56 | 2.54 |
| NM | 0.92 | 0.95 | 1.99 | 2.01 | 3.04 | 3.05 |
| SPT | 3.80 | 3.81 | 5.46 | 5.52 | 6.97 | 7.15 |
| TYF | 0.87 | 0.89 | 2.83 | 2.84 | 3.72 | 3.73 |
| YK | −1.74 | −1.68 | 2.66 | 2.65 | 3.27 | 3.27 |
| TYG | 0.78 | 0.82 | 2.52 | 2.52 | 3.37 | 3.37 |
| YZ | 1.95 | 1.99 | 2.75 | 2.77 | 3.67 | 3.70 |
5.2. Temporal Mismatch
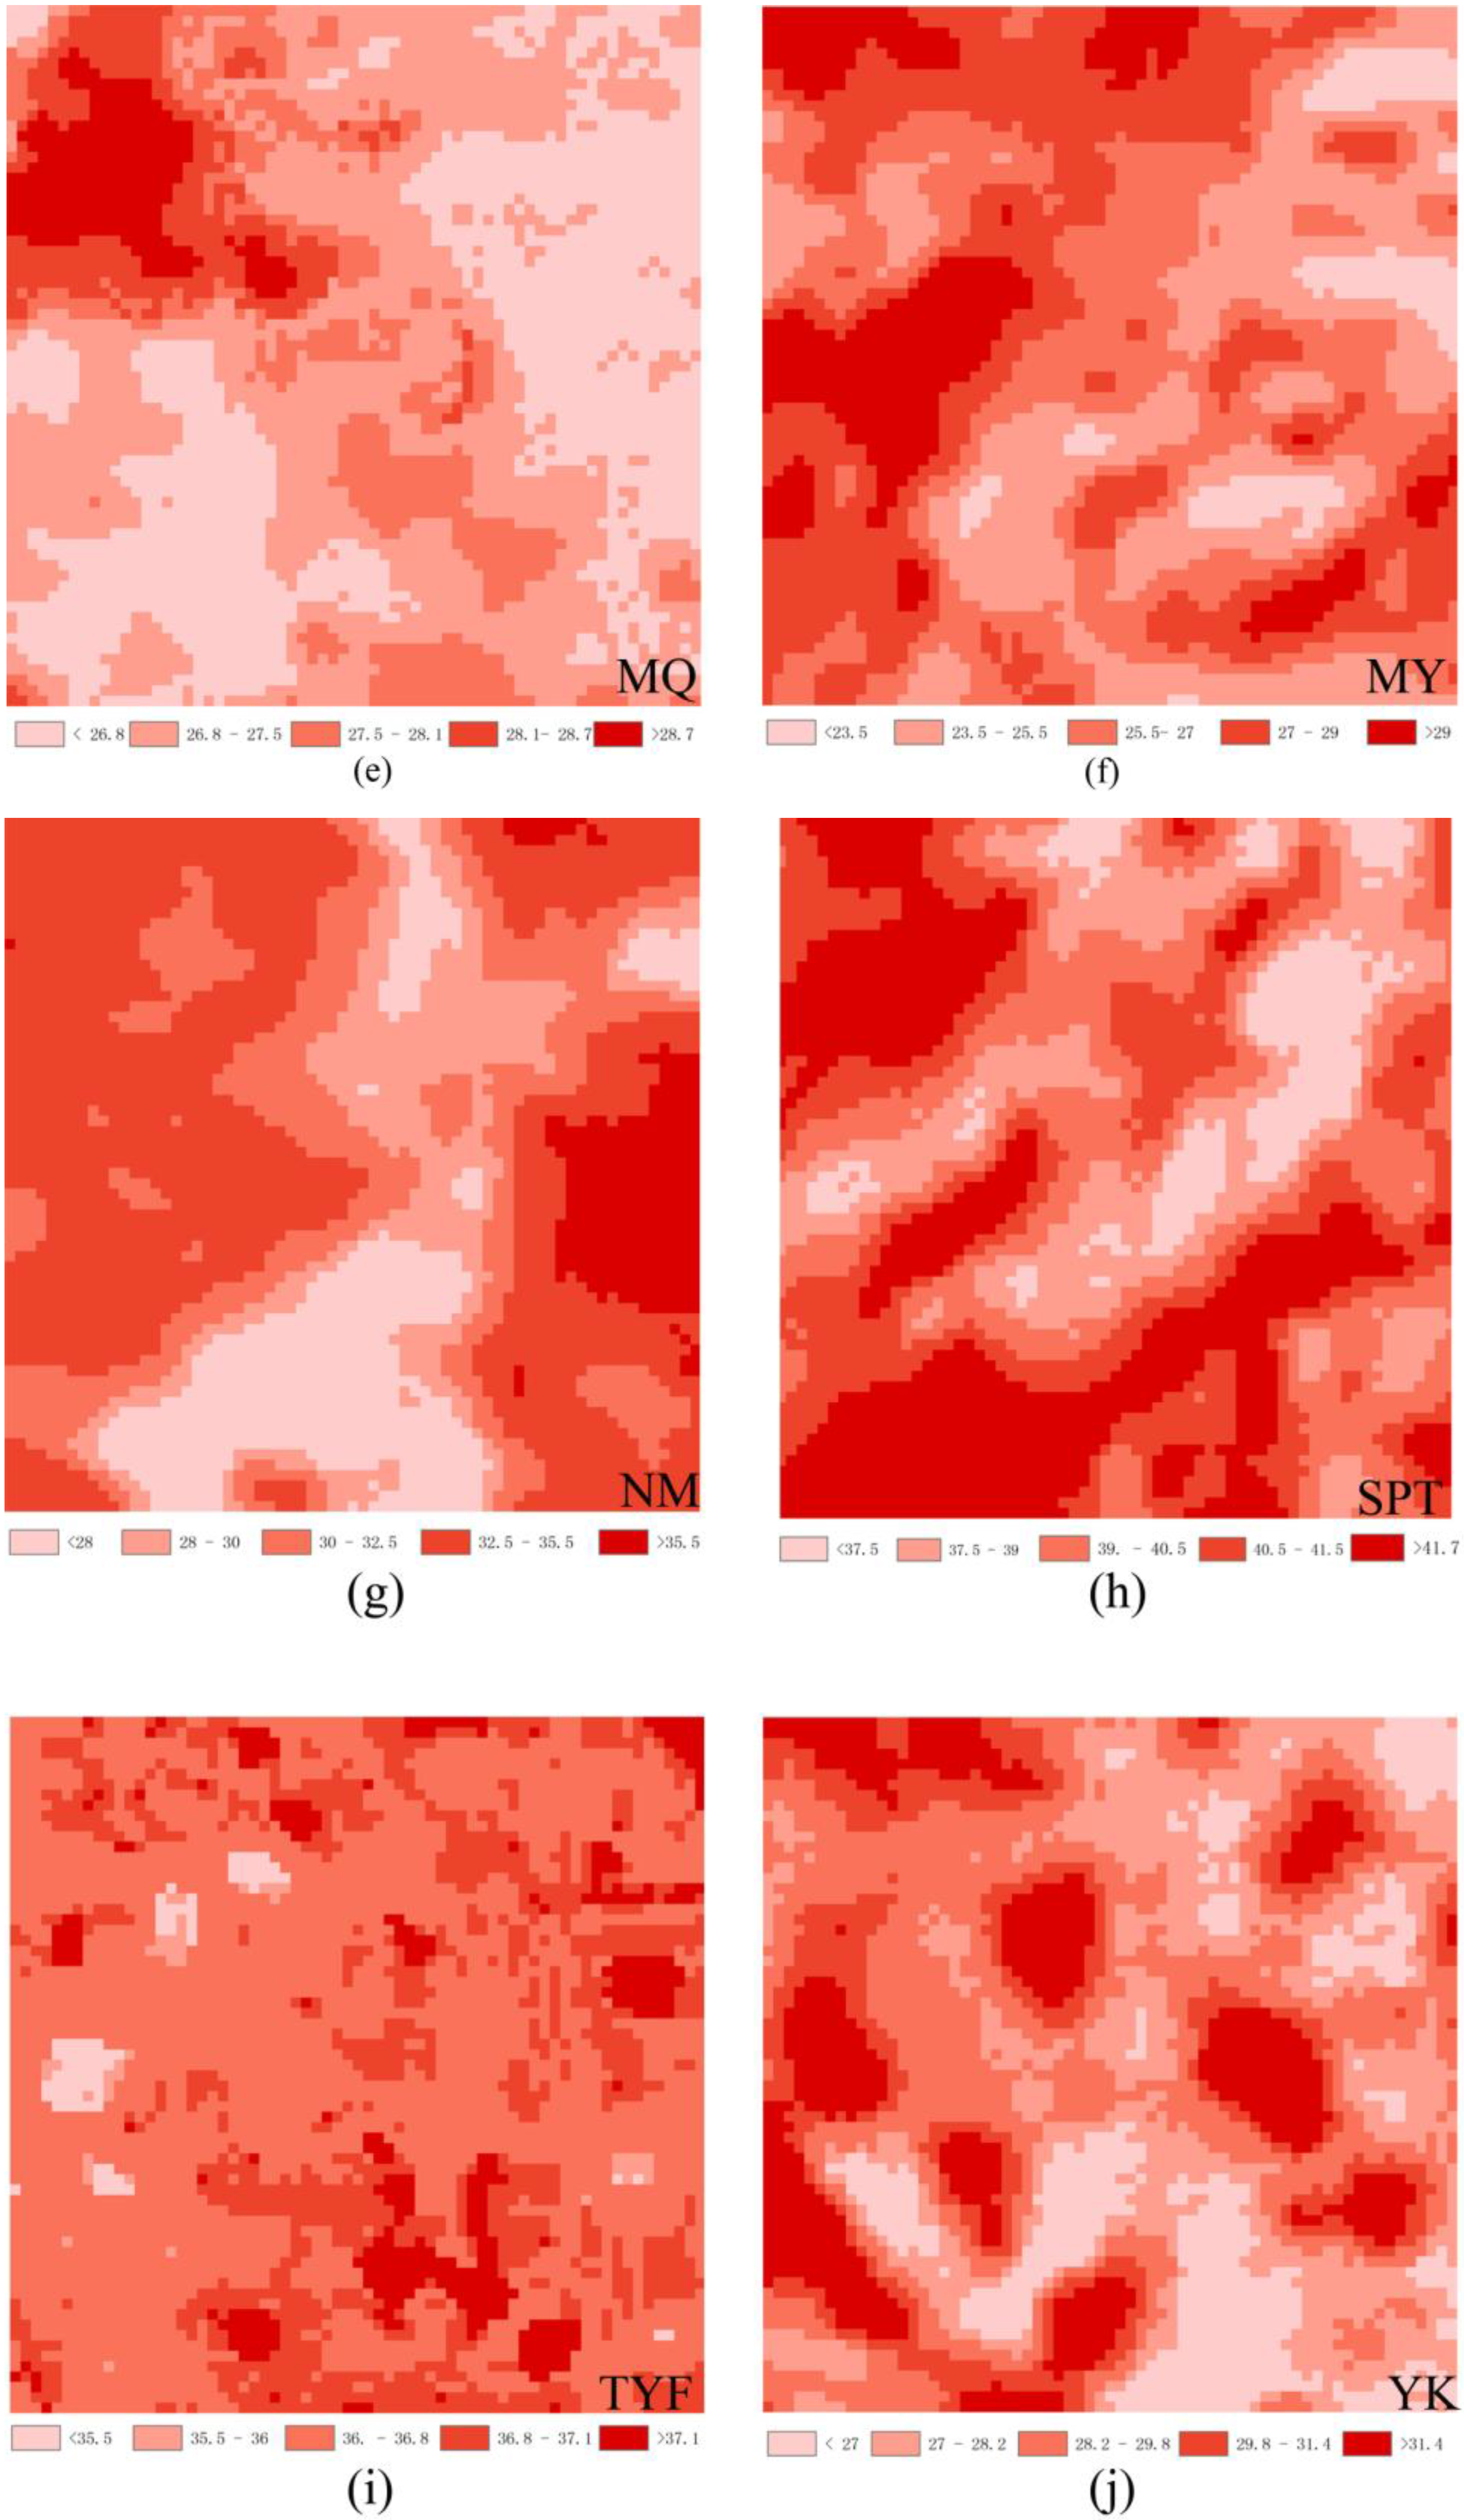
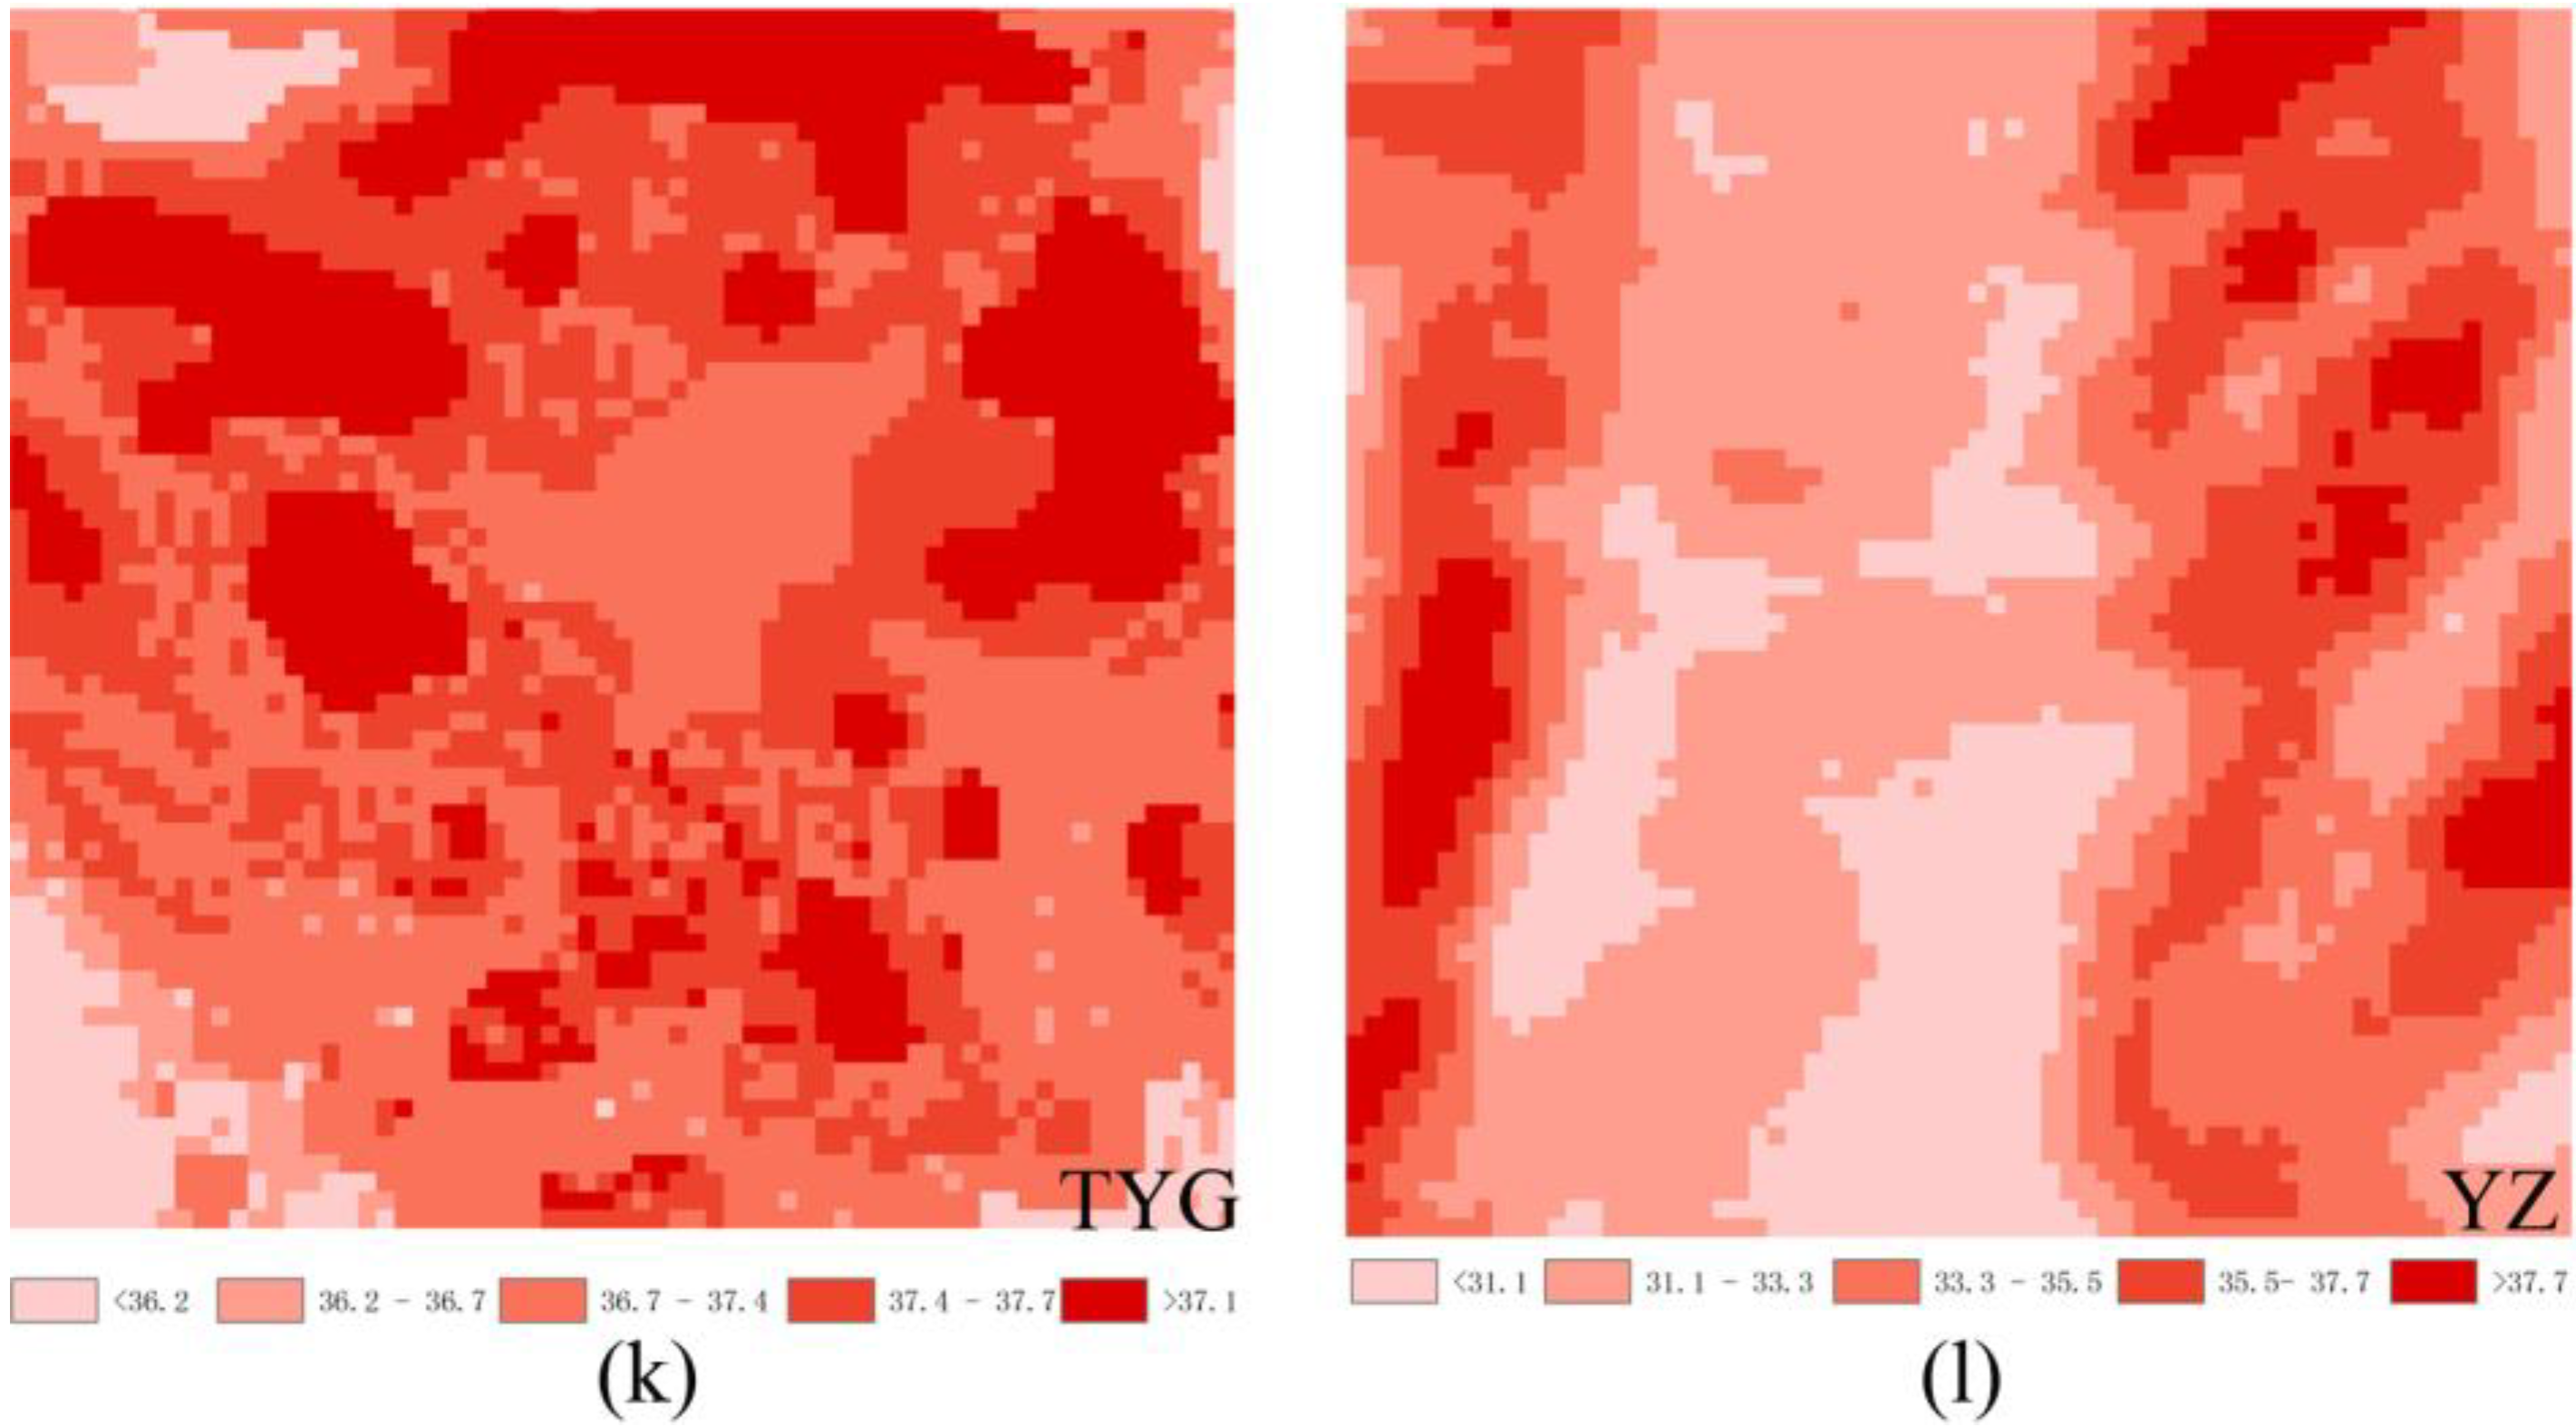
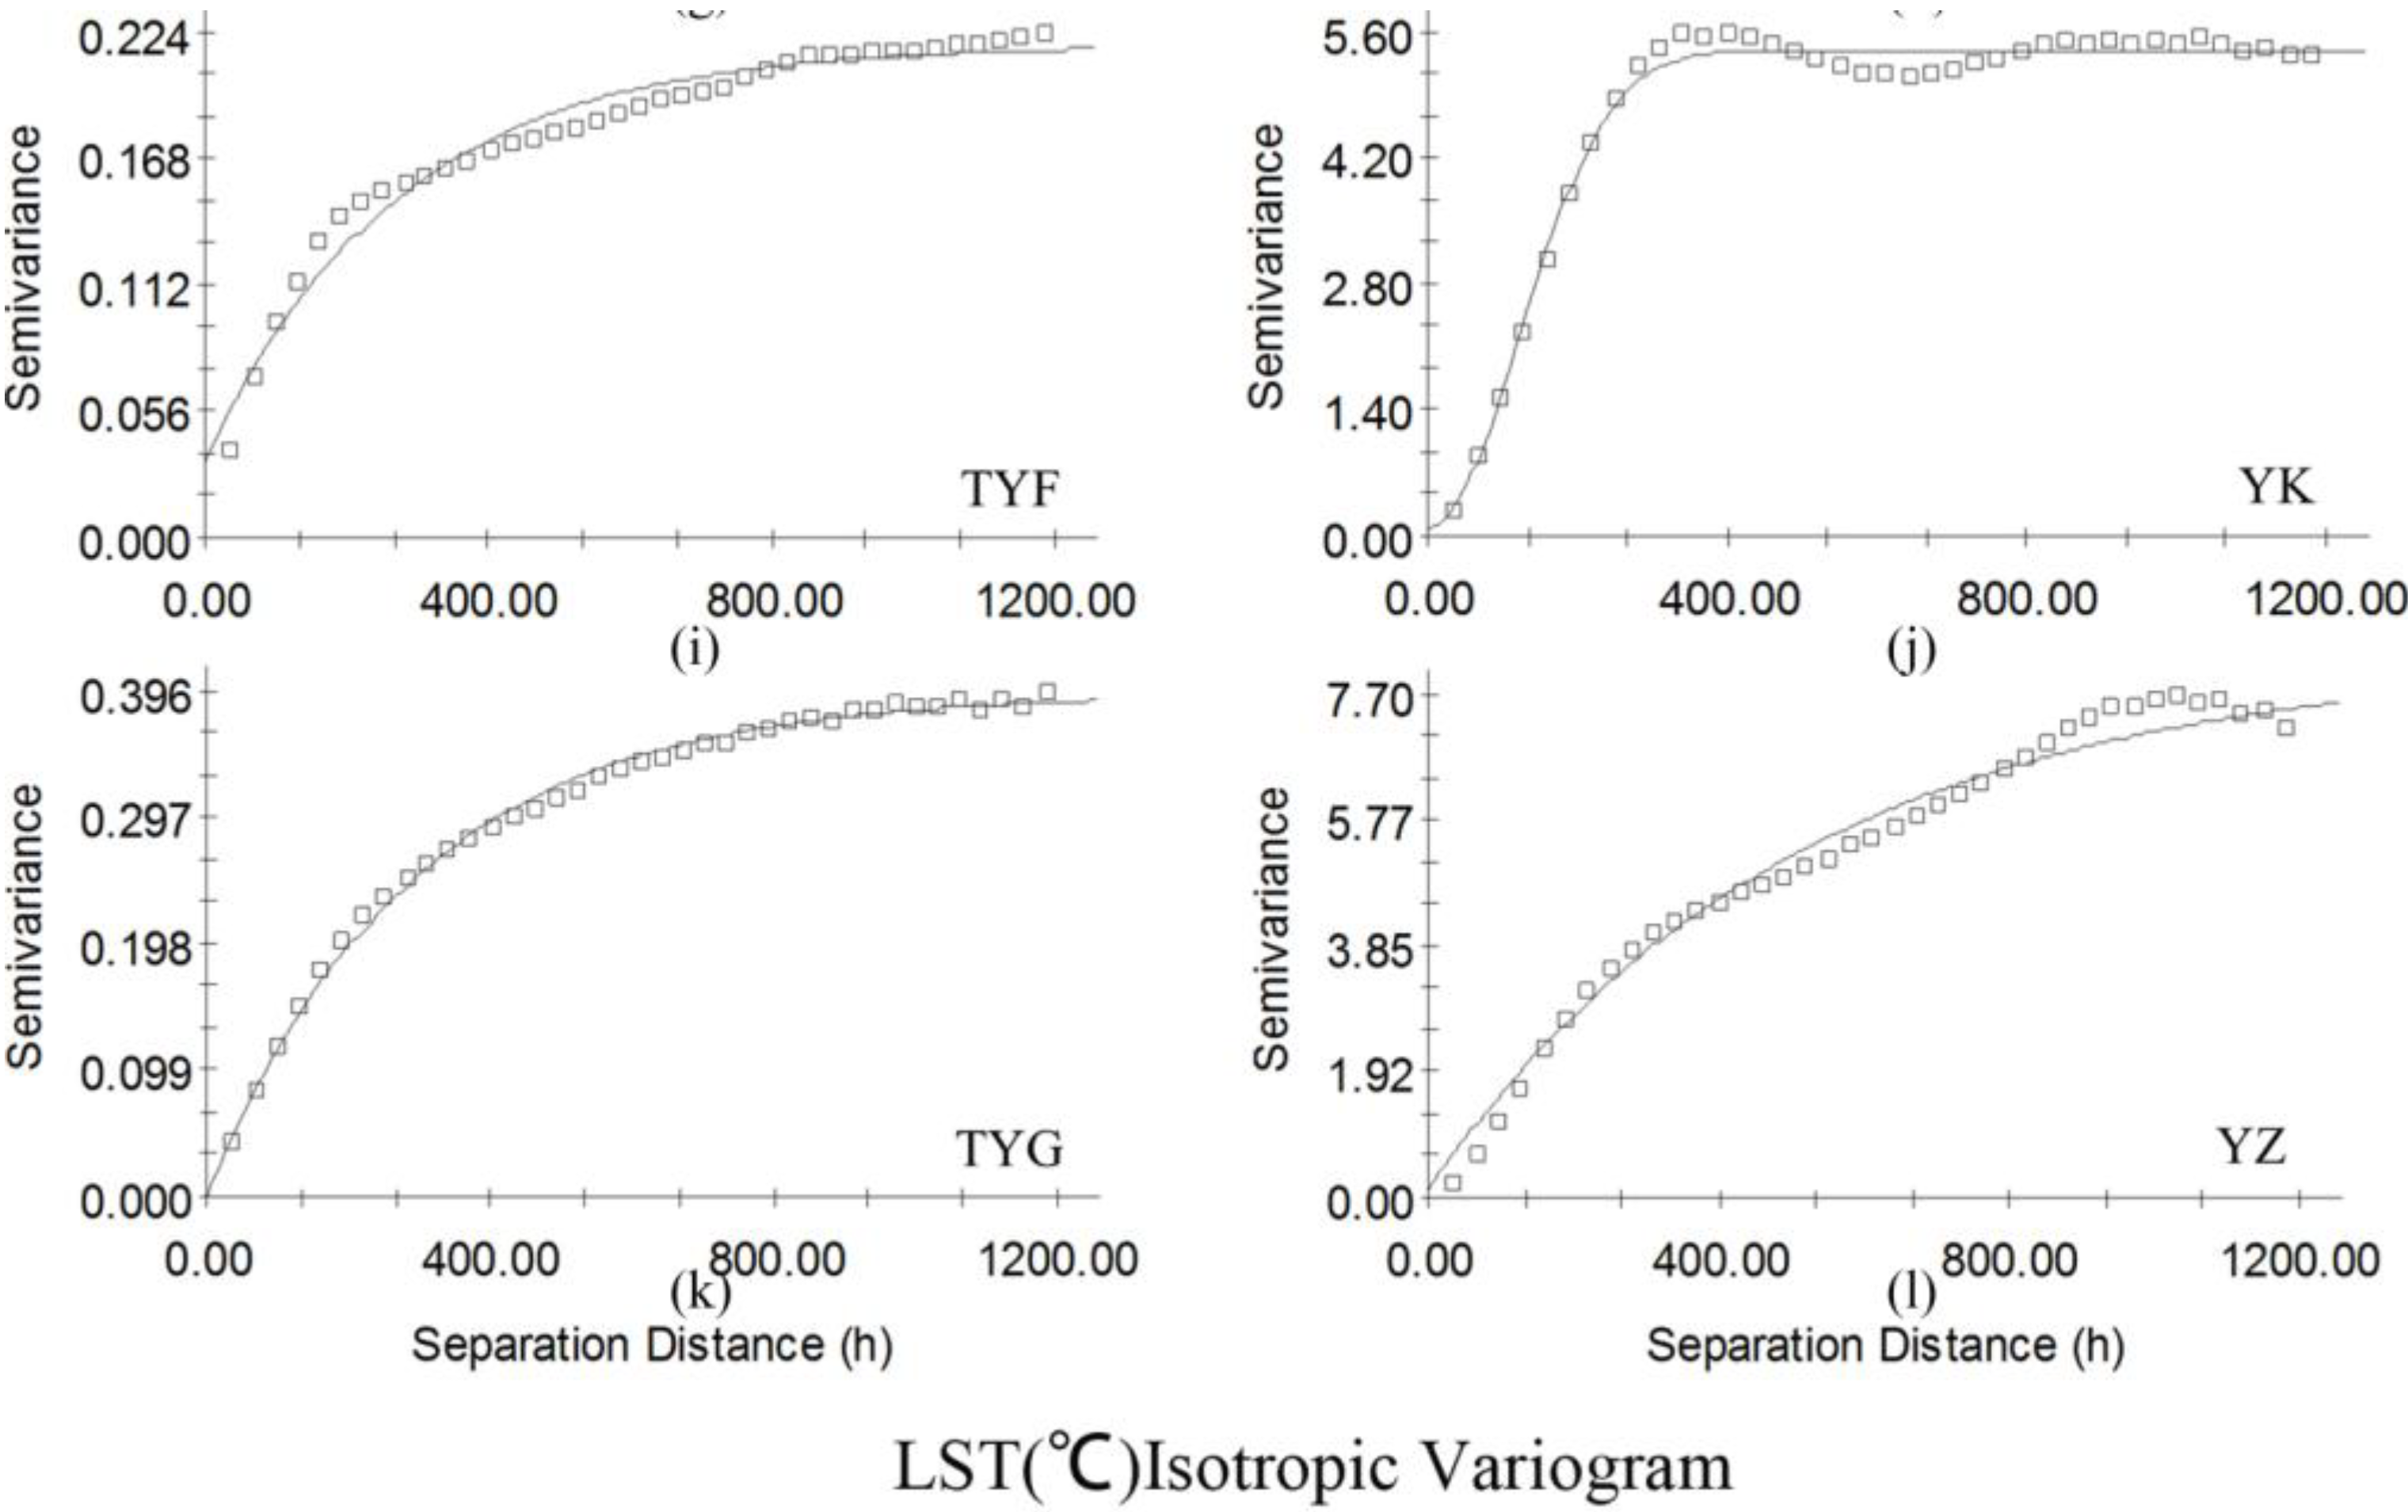
5.3. Spatial Mismatch


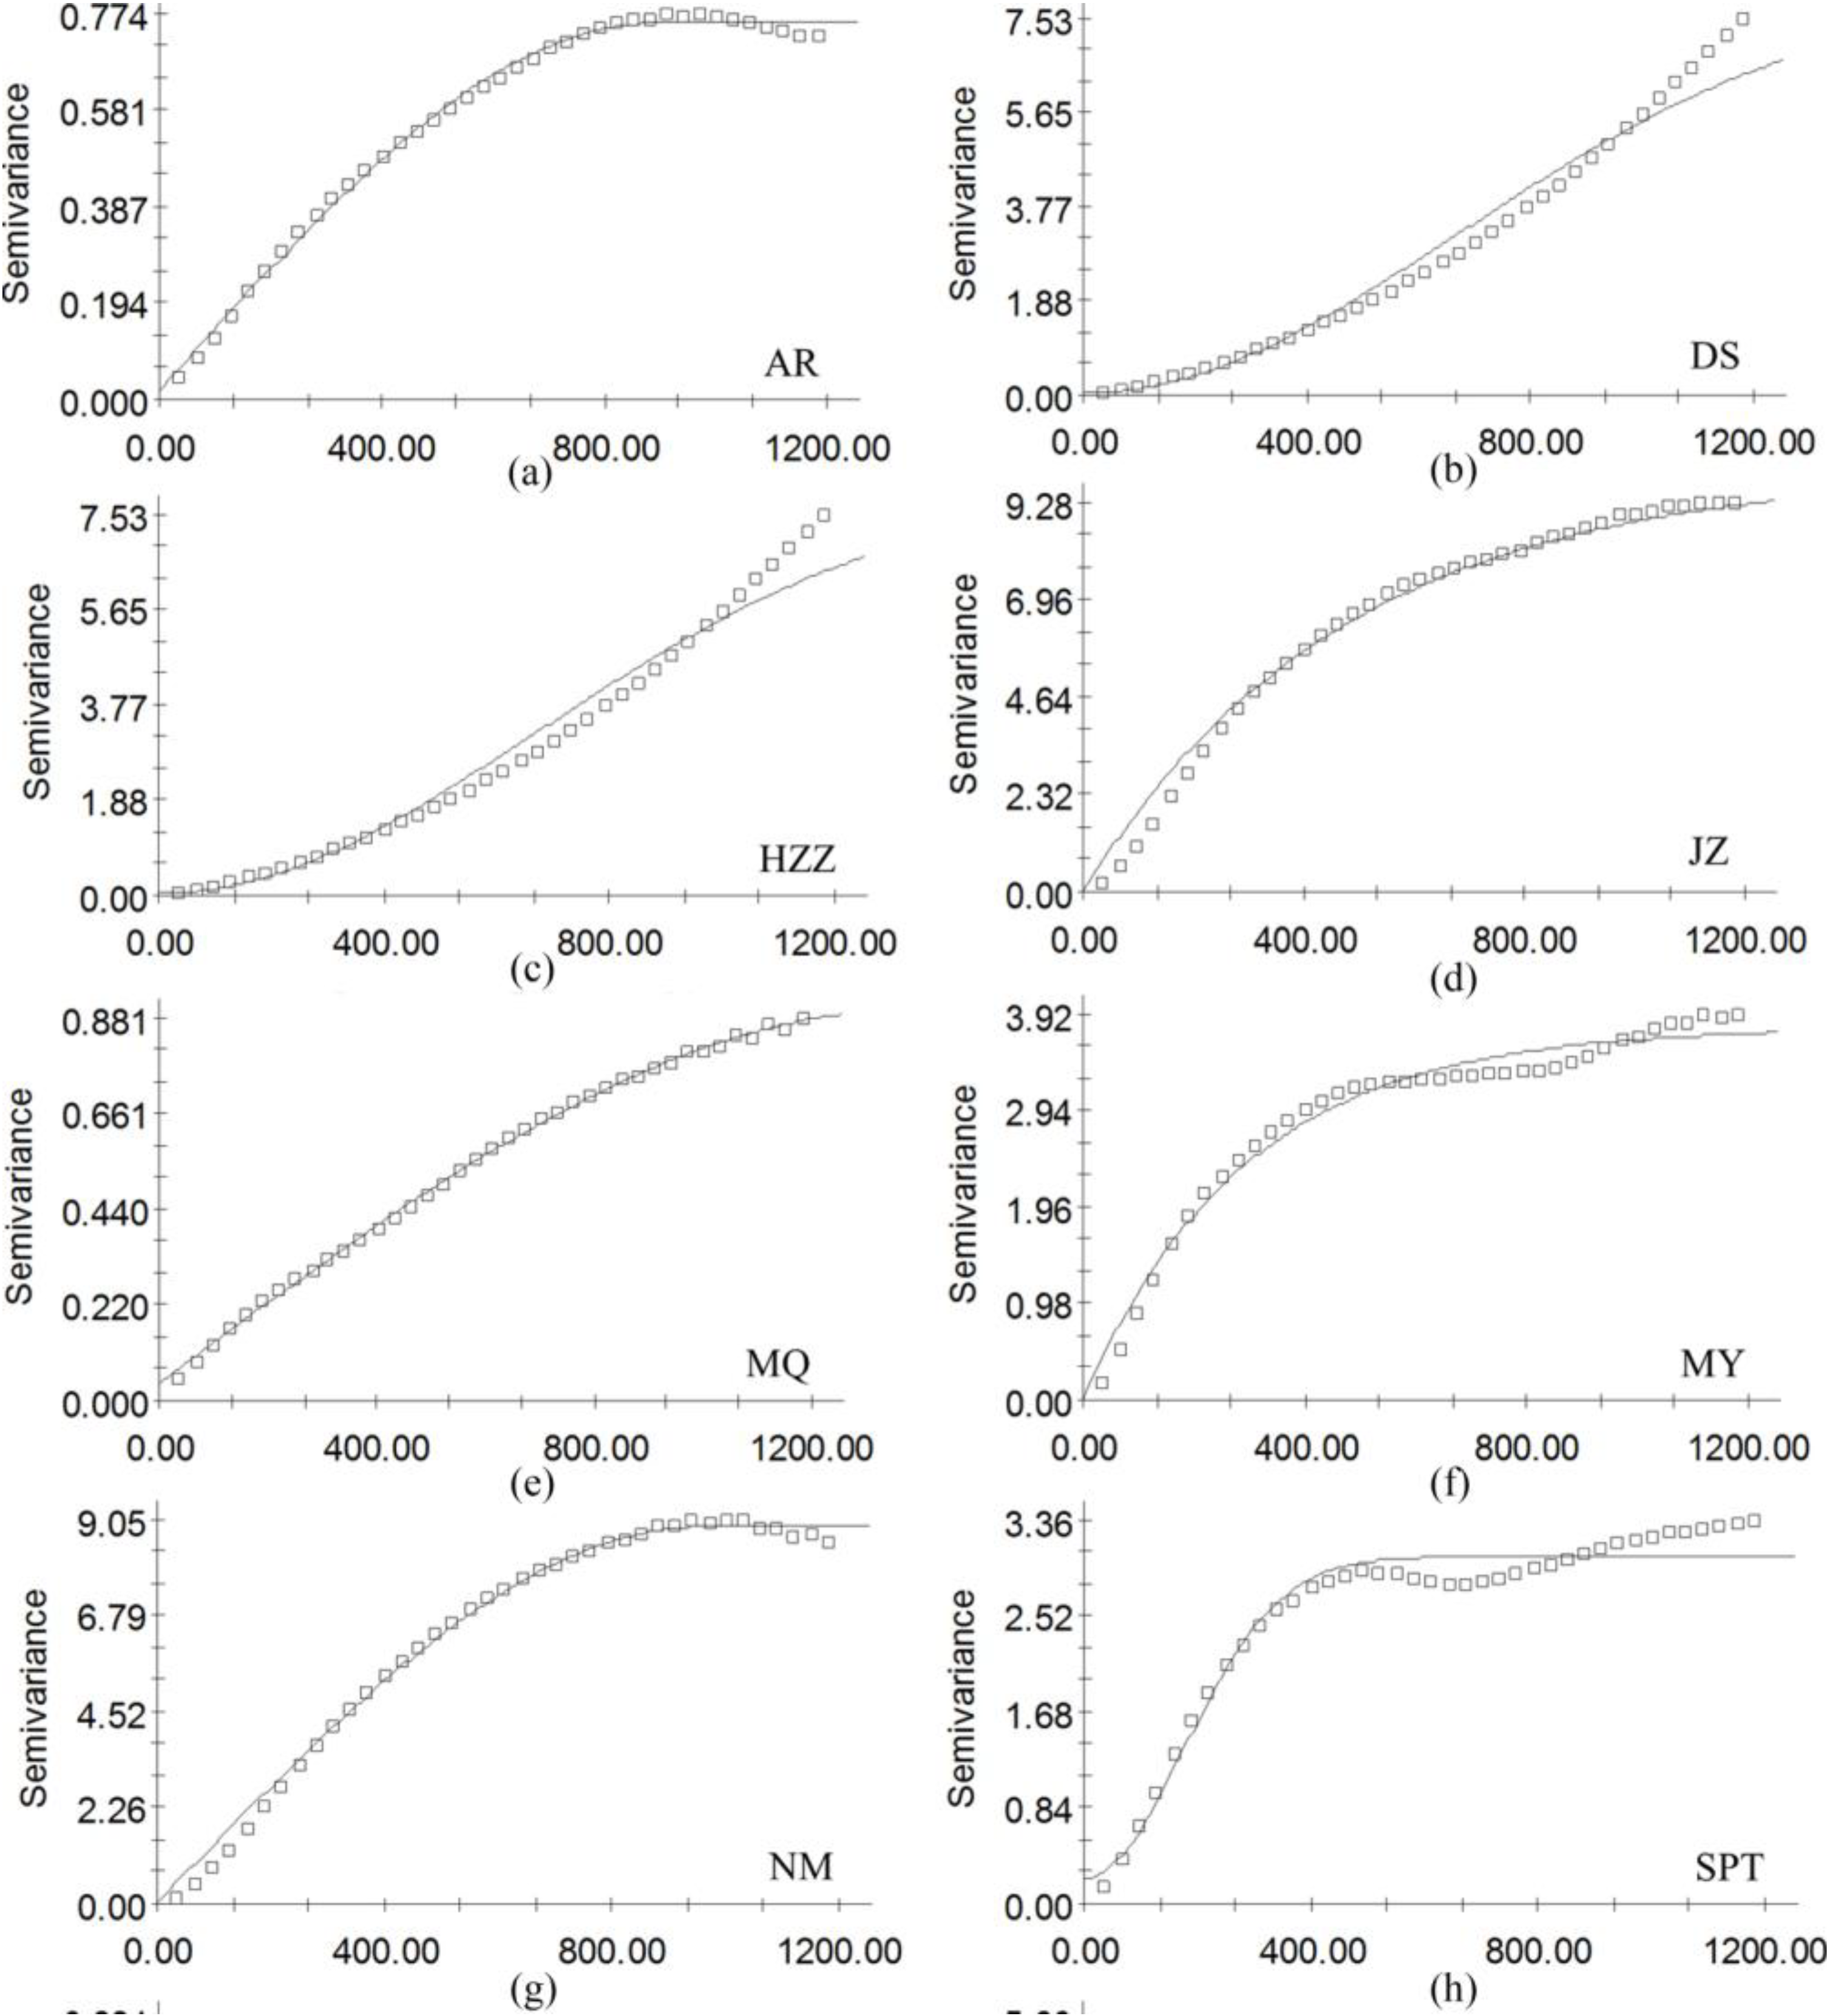

| Sites | Nugget C0 | Sill C0 + C | Nugget/Sill C0/(C0 + C) | Range A0 | Coefficient of Determination r2 | RSS (Residual Sum of Squares) |
|---|---|---|---|---|---|---|
| AR | 0.01800 | 0.75500 | 0.023841 | 889.00 | 0.997 | 0.00573 |
| DS | 0.04000 | 8.08900 | 0.004945 | 945.00 | 0.978 | 4.900 |
| HZZ | 0.01000 | 4.02900 | 0.002482 | 885.00 | 0.990 | 0.258 |
| JZ | 0.01000 | 10.0290 | 0.000997 | 473.00 | 0.997 | 3.450 |
| MQ | 0.03900 | 0.90100 | 0.043285 | 1382.0 | 0.999 | 0.00245 |
| MY | 0.01000 | 3.78700 | 0.002641 | 294.00 | 0.979 | 0.790 |
| NM | 0.01000 | 8.88200 | 0.001126 | 959.00 | 0.997 | 1.760 |
| SPT | 0.21800 | 3.04100 | 0.071687 | 244.00 | 0.985 | 0.940 |
| TYF | 0.03400 | 0.21900 | 0.155251 | 272.00 | 0.900 | 0.00214 |
| YK | 0.09000 | 5.41200 | 0.01663 | 171.00 | 0.989 | 0.766 |
| TYG | 0.00100 | 0.39400 | 0.002538 | 292.00 | 0.996 | 0.00139 |
| YZ | 0.13000 | 8.26900 | 0.015721 | 507.00 | 0.985 | 3.190 |
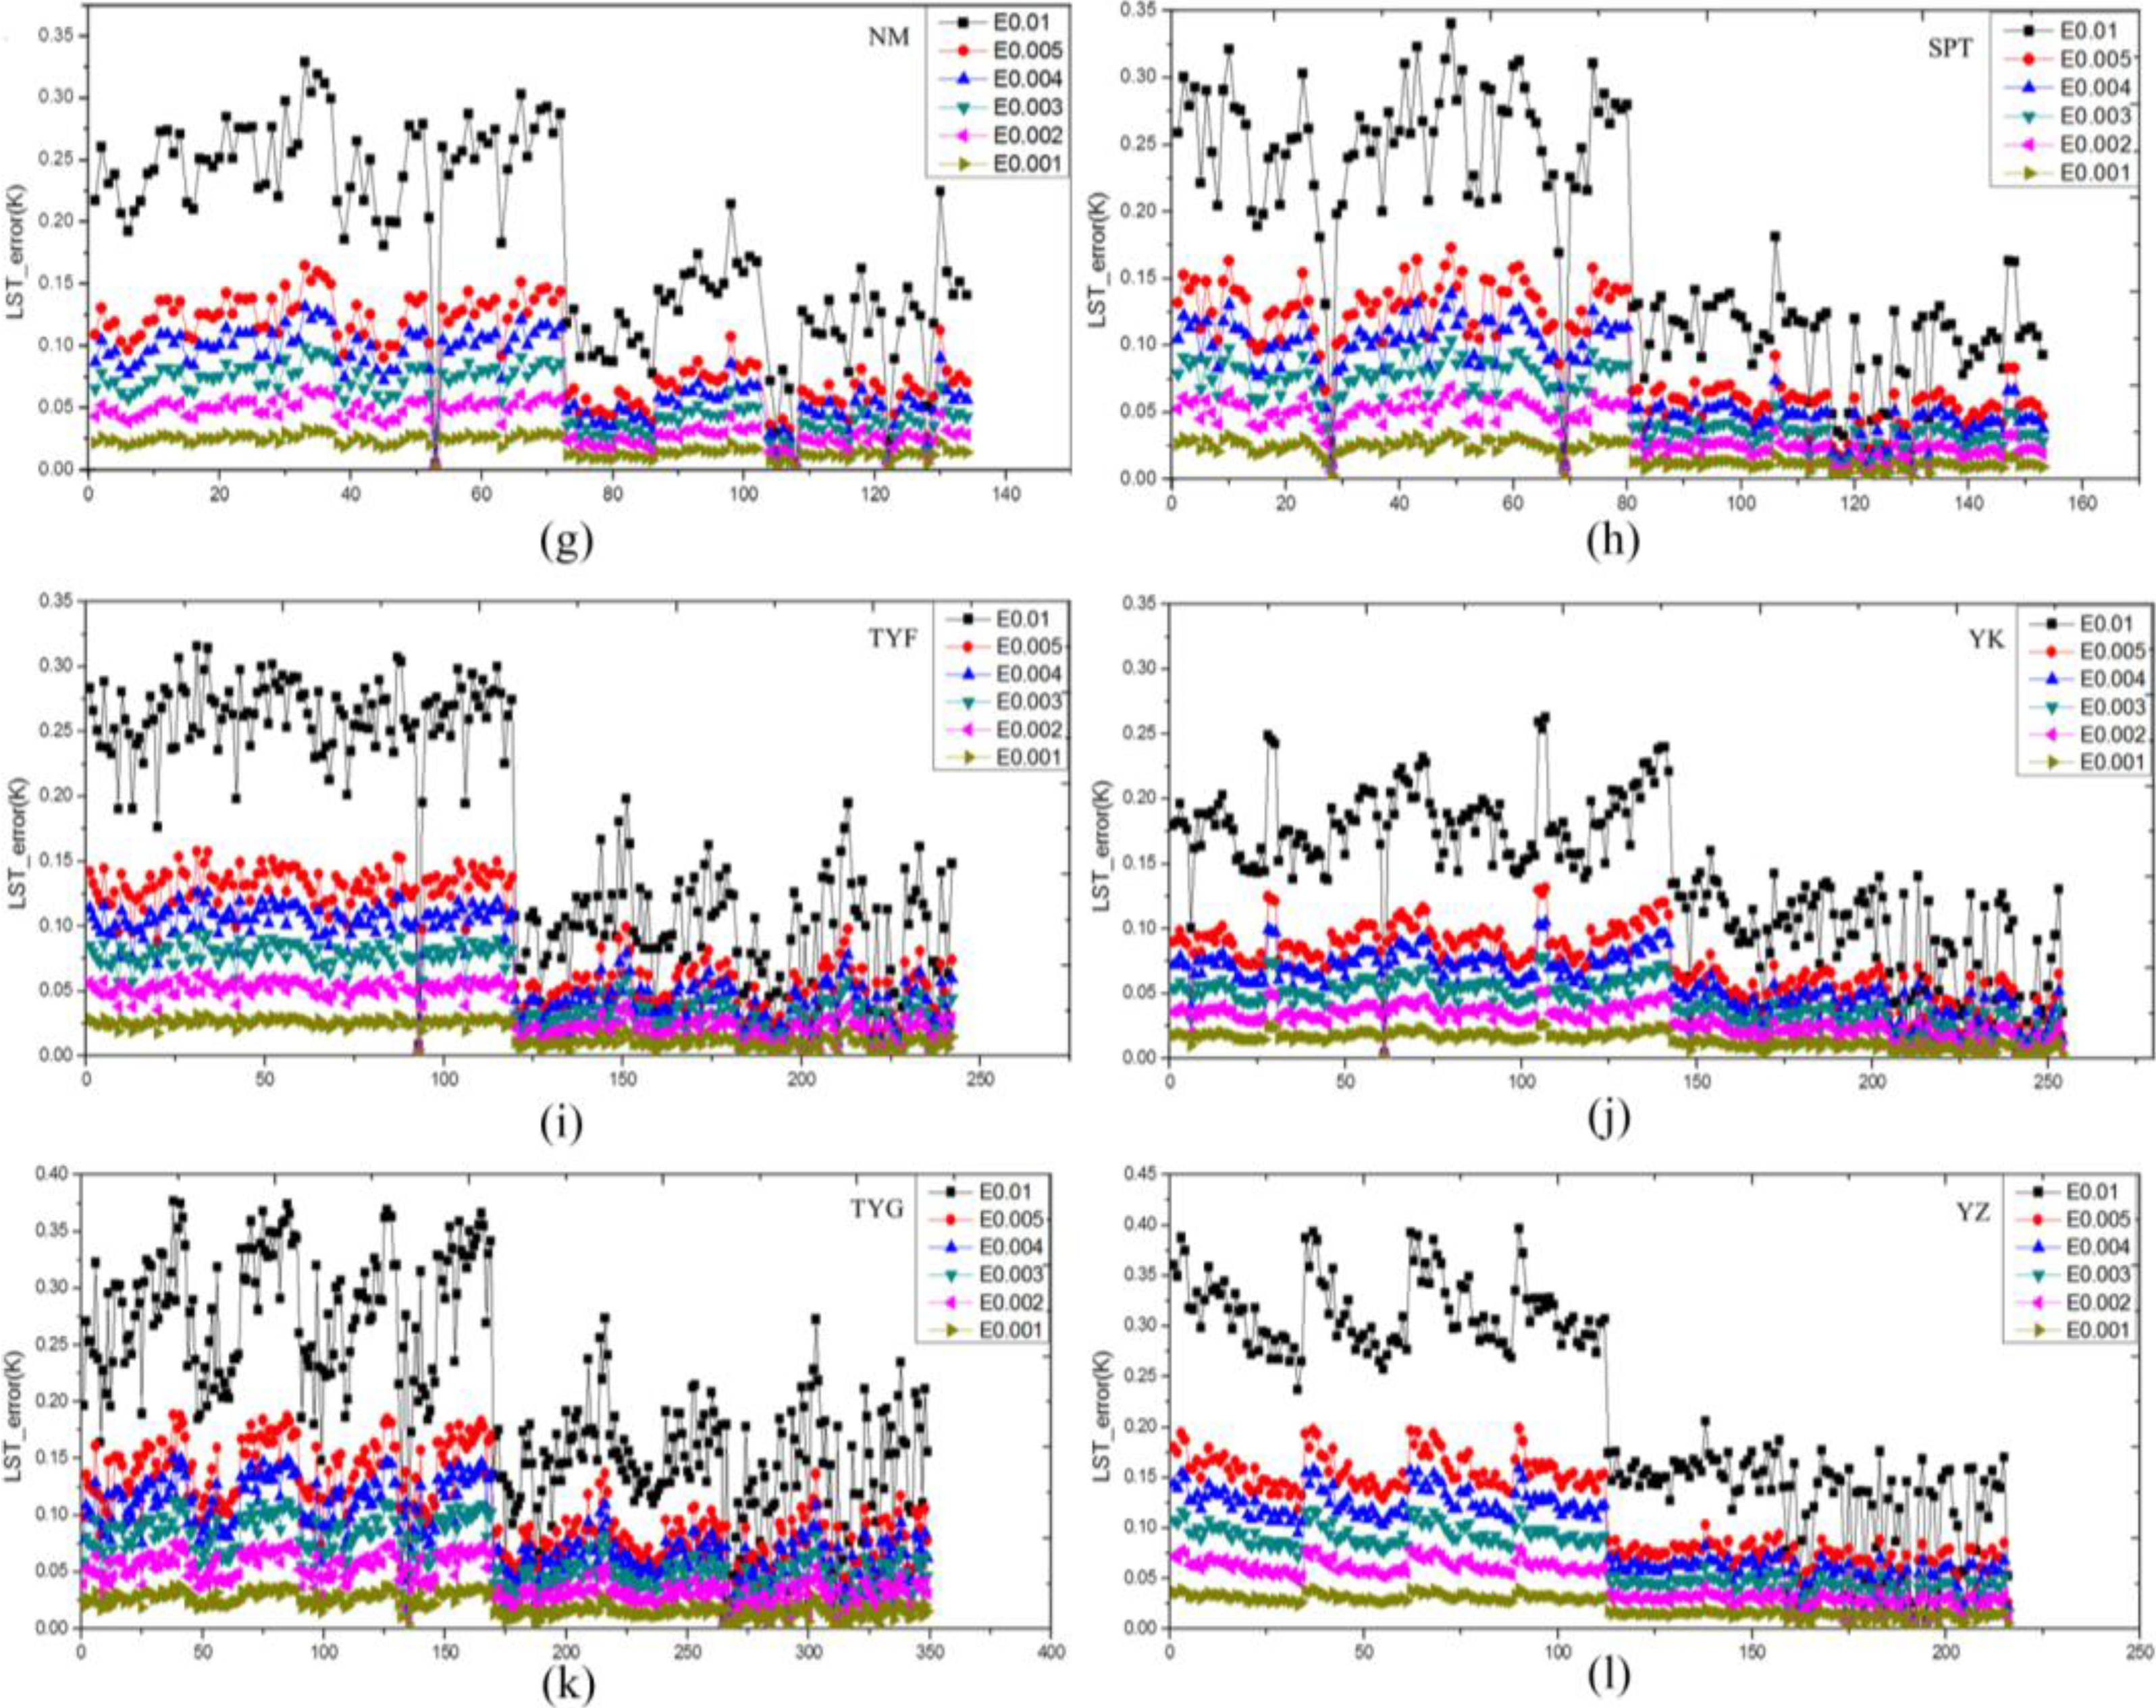
5.4. Sensitivity Analysis of Emissivity
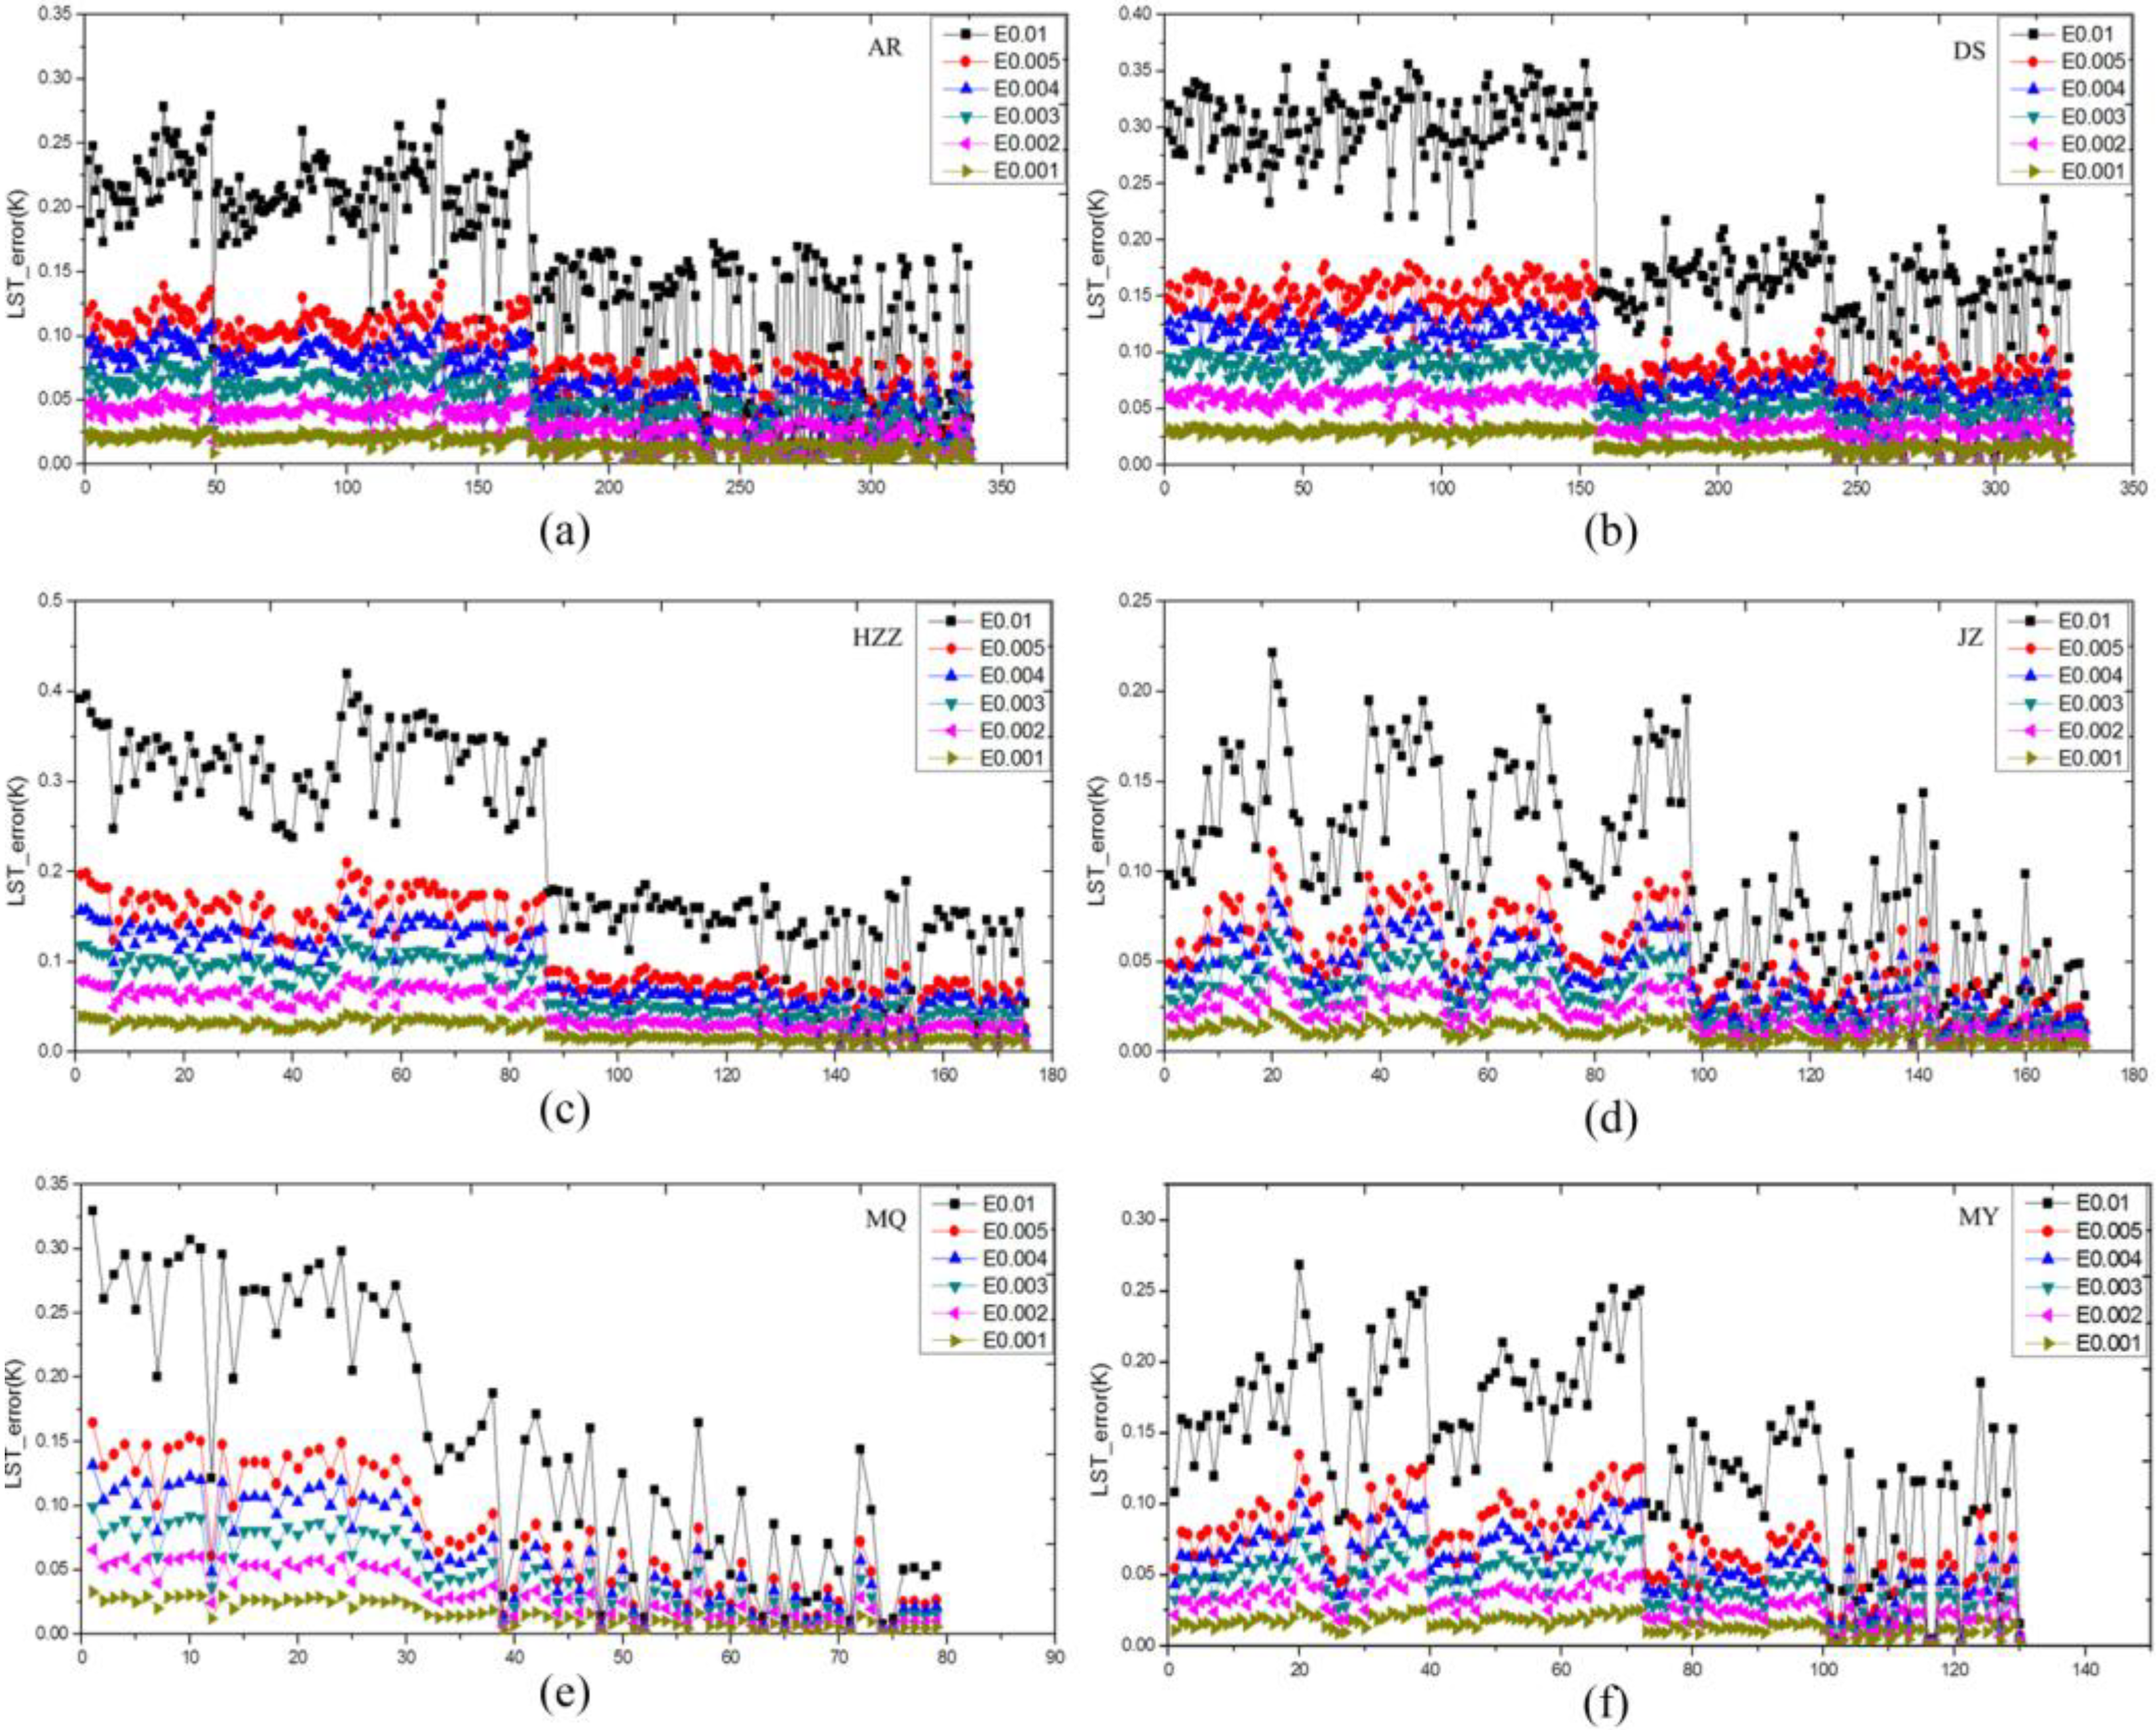

| Station | E0.01 (K) | E0.005 (K) | E0.004 (K) | E0.003 (K) | E0.002 (K) | E0.001 (K) |
|---|---|---|---|---|---|---|
| AR | 0.1573 | 0.0786 | 0.0629 | 0.0472 | 0.0315 | 0.0157 |
| HZZ | 0.2271 | 0.1136 | 0.0909 | 0.0682 | 0.0454 | 0.0227 |
| YK | 0.1414 | 0.0707 | 0.0566 | 0.0424 | 0.0283 | 0.0141 |
| DS | 0.2625 | 0.1313 | 0.1050 | 0.0788 | 0.0525 | 0.0263 |
| JZ | 0.1030 | 0.0514 | 0.0412 | 0.0309 | 0.0206 | 0.0103 |
| MQ | 0.1536 | 0.0768 | 0.0614 | 0.0461 | 0.0307 | 0.0154 |
| MY | 0.1447 | 0.0724 | 0.0579 | 0.0434 | 0.0289 | 0.0145 |
| NM | 0.1899 | 0.0949 | 0.0759 | 0.0570 | 0.0380 | 0.0190 |
| SPT | 0.1794 | 0.0912 | 0.0729 | 0.0547 | 0.0365 | 0.0182 |
| TYF | 0.1872 | 0.0936 | 0.0749 | 0.0561 | 0.0374 | 0.0187 |
| TYG | 0.2515 | 0.1257 | 0.1004 | 0.0754 | 0.0503 | 0.0251 |
| YZ | 0.2262 | 0.1131 | 0.0905 | 0.0678 | 0.0452 | 0.0226 |
6. Summary
Acknowledgments
Author Contributions
Conflicts of Interest
References
- Liang, S.L. An optimization algorithm for separating land surface temperature and emissivity from multispectral thermal infrared imagery. IEEE Trans. Geosci. Remote Sens. 2001, 39, 264–274. [Google Scholar] [CrossRef]
- Peres, L.F.; DaCamara, C.C. Land surface temperature and emissivity estimation based on the two-temperature method: Sensitivity analysis using simulated MSG/SEVIRI data. Remote Sens. Environ. 2004, 91, 377–389. [Google Scholar] [CrossRef]
- Kerr, Y.H.; Lagouarde, J.P.; Nerry, F.; Ottlé, C. Land surface temperature retrieval techniques and applications. In Thermal Remote Sensing in Land Surface Processes; CRC Press: Boston, MA, USA, 2004; pp. 33–109. [Google Scholar]
- Wang, K.; Wang, P.; Li, Z.; Cribb, M.; Sparrow, M. A simple method to estimate actual evapotranspiration from a combination of net radiation, vegetation index, and temperature. J. Geophys. Res.: Atmos. (1984–2012) 2007, 112. [Google Scholar] [CrossRef]
- Wan, Z.; Li, Z.L. Radiance-based validation of the V5 MODIS land-surface temperature product. Int. J. Remote Sens. 2008, 29, 5373–5395. [Google Scholar] [CrossRef]
- Wan, Z.; Zhang, Y.; Zhang, Q.; Li, Z.-L. Validation of the land-surface temperature products retrieved from Terra Moderate Resolution Imaging Spectroradiometer data. Remote Sens. Environ. 2002, 83, 163–180. [Google Scholar] [CrossRef]
- Coll, C.; Caselles, V.; Galve, J.M.; Valor, E.; Niclos, R.; Sanchez, J.M.; Rivas, R. Ground measurements for the validation of land surface temperatures derived from AATSR and MODIS data. Remote Sens. Environ. 2005, 97, 288–300. [Google Scholar] [CrossRef]
- Wan, Z.; Zhang, Y.; Zhang, Q.; Li, Z.L. Quality assessment and validation of the MODIS global land surface temperature. Int. J. Remote Sens. 2004, 25, 261–274. [Google Scholar] [CrossRef]
- Wan, Z. New refinements and validation of the collection-6 MODIS land-surface temperature/emissivity product. Remote Sens. Environ. 2014, 140, 36–45. [Google Scholar] [CrossRef]
- Liang, S.L. Quantitative Remote Sensing of Land Surface; John Wiley & Sons, INC.: Hoboken, NJ, USA, 2004. [Google Scholar]
- Wang, K.; Wan, Z.; Wang, P.; Sparrow, M.; Liu, J.; Zhou, X.; Haginoya, S. Estimation of surface long wave radiation and broadband emissivity using Moderate Resolution Imaging Spectroradiometer (MODIS) land surface temperature/emissivity products. J. Geophys. Res.: Atmos. 2005, 110. [Google Scholar] [CrossRef]
- Baldocchi, D.; Falge, E.; Gu, L.; Olson, R.; Hollinger, D.; Running, S.; Anthoni, P.; Bernhofer, C.; Davis, K.; Evans, R.; et al. FLUXNET: A new tool to study the temporal and spatial variability of ecosystem-scale carbon dioxide, water vapor, and energy flux densities. Bull. Amer. Meteor. Soc. 2001, 82, 2415–2434. [Google Scholar] [CrossRef]
- FLUXNET. Available online: fluxnet.ornl.gov/ (accessed on 12 November 2014).
- SURFRAD Network. Available online: www.esrl.noaa.gov/gmd/grad/surfrad/ (accessed on 12 November 2014).
- Augustine, J.A.; DeLuisi, J.J.; Long, C.N. SURFRAD—A national surface radiation budget network for atmospheric research. Bull. Amer. Meteor. Soc. 2000, 81, 2341–2357. [Google Scholar] [CrossRef]
- Ohmura, A.; Gilgen, H.; Hegner, H.; Müller, G.; Wild, M.; Dutton, E.G.; Forgan, B.; Fröhlich, C.; Philipona, R.; Heimo, A. Baseline Surface Radiation Network (BSRN/WCRP): New precision radiometry for climate research. Bull. Amer. Meteor. Soc. 1998, 79, 2115–2136. [Google Scholar] [CrossRef]
- WRMC-BSRN. Available online: bsrn.awi.de/ (accessed on 12 November 2014).
- Stokes, G.M.; Schwartz, S.E. The Atmospheric Radiation Measurement (ARM) Program: Programmatic background and design of the cloud and radiation test bed. Bull. Amer. Meteor. Soc. 1994, 75, 1201–1221. [Google Scholar] [CrossRef]
- ARM. Available online: www.arm.gov/ (accessed on 12 November 2014).
- Gautier, C.; Landsfeld, M. Surface solar radiation flux and cloud radiative forcing for the Atmospheric Radiation Measurement (ARM) Southern Great Plains (SGP): A satellite, surface observations, and radiative transfer model study. J. Atmos. Sci. 1997, 54, 1289–1307. [Google Scholar] [CrossRef]
- Wang, W.; Liang, S.; Meyers, T. Validating MODIS land surface temperature products using long-term nighttime ground measurements. Remote Sens. Environ. 2008, 112, 623–635. [Google Scholar] [CrossRef]
- Wan, Z. New refinements and validation of the MODIS Land-Surface Temperature/Emissivity products. Remote Sens. Environ. 2008, 112, 59–74. [Google Scholar] [CrossRef]
- Song, Y.; Ma, M.G. Variation of AVHRR NDVI and its relationship with climate in Chinese arid and cold regions. J. Remote Sens. 2008, 12, 499–505. [Google Scholar]
- Wang, K.; Liang, S. Evaluation of ASTER and MODIS land surface temperature and emissivity products using long-term surface longwave radiation observations at SURFRAD sites. Remote Sens. Environ. 2009, 113, 1556–1565. [Google Scholar] [CrossRef]
- ASTER Spectral Library. Available online: speclib.jpl.nasa.gov/ (accessed on 12 November 2014).
- Baldridge, A.M.; Hook, S.J.; Grove, C.I.; Rivera, G. The ASTER spectral library version 2.0. Remote Sens. Environ. 2009, 113, 711–715. [Google Scholar] [CrossRef]
- Ogawa, K.; Schmugge, T.; Jacob, F.; French, A. Estimation of land surface window (8–12 μm) emissivity from multi‐spectral thermal infrared remote sensing—A case study in a part of Sahara Desert. Geophys. Res. Lett. 2003, 30. [Google Scholar] [CrossRef]
- Matheron, G. Principles of geostatistics. Econom. Geol. 1963, 58, 1246–1266. [Google Scholar] [CrossRef]
- Salomonson, V.V.; Barnes, W.; Maymon, P.W.; Montgomery, H.E.; Ostrow, H. MODIS: Advanced facility instrument for studies of the Earth as a system. IEEE Trans. Geosci. Remote Sens. 1989, 27, 145–153. [Google Scholar] [CrossRef]
- Xiong, X.; Chiang, K.-F.; Wu, A.; Barnes, W.L.; Guenther, B.; Salomonson, V.V. Multiyear on-orbit calibration and performance of Terra MODIS thermal emissive bands. IEEE Trans. Geosci. Remote Sens. 2008, 46, 1790–1803. [Google Scholar] [CrossRef]
- Wan, Z.M.; Dozier, J. A generalized split-window algorithm for retrieving land-surface temperature from space. IEEE Trans. Geosci Remote Sens. 1996, 34, 892–905. [Google Scholar] [CrossRef]
- Wan, Z.M.; Li, Z.L. A physics-based algorithm for retrieving land-surface emissivity and temperature from EOS/MODIS data. IEEE Trans. Geosci. Remote Sens. 1997, 35, 980–996. [Google Scholar] [CrossRef]
- Kaneko, D.; Hino, M. Proposal and investigation of a method for estimating surface energy balance in regional forests using TM derived vegetation index and observatory routine data. Int. J. Remote Sens. 1996, 17, 1129–1148. [Google Scholar] [CrossRef]
- Lo, C.P. Application of Landsat TM data for quality of life assessment in an urban environment. Comput. Environ. Urban Syst. 1997, 21, 259–276. [Google Scholar] [CrossRef]
- Berk, A.; Bernstein, L.S.; Robertson, D.C. MODTRAN: A Moderate Resolution Model for LOWTRAN; Spectral Sciences, Inc.: Burlington, MA, USA, 1987. [Google Scholar]
- NASA. An atmospheric correction parameter calculator. Available online: atmcorr.gsfc.nasa.gov/ (accessed on 12 November 2014).
- Srivastava, P.K.; Han, D.; Rico-Ramirez, M.A.; Bray, M.; Islam, T.; Gupta, M.; Dai, Q. Estimation of land surface temperature from atmospherically corrected LANDSAT TM image using 6S and NCEP global reanalysis product. Environ. Earth Sci. 2014. [Google Scholar] [CrossRef]
- Barsi, J.A.; Barker, J.L.; Schott, J.R. An atmospheric correction parameter calculator for a single thermal band earth-sensing instrument. In Proceedings of 2003 IEEE International Geoscience and Remote Sensing Symposium, IGARSS’03, Toulouse, France, 21–25 July 2003; pp. 3014–3016.
- Barsi, J.A.; Schott, J.R.; Palluconi, F.D.; Hook, S.J. Validation of a web-based atmospheric correction tool for single thermal band instruments. Proc. SPIE 2005, 5882. [Google Scholar] [CrossRef]
- Becker, F.; Li, Z.-L. Towards a local split window method over land surfaces. Int. J. Remote Sens. 1990, 11, 369–393. [Google Scholar] [CrossRef]
- Sobrino, J.A.; Raissouni, N.; Li, Z.-L. A comparative study of land surface emissivity retrieval from NOAA data. Remote Sens. Environ. 2001, 75, 256–266. [Google Scholar] [CrossRef]
- Hulley, G.C.; Hook, S.J. Intercomparison of versions 4, 4.1 and 5 of the MODIS land surface temperature and emissivity products and validation with laboratory measurements of sand samples from the Namib desert, Namibia. Remote Sens. Environ. 2009, 113, 1313–1318. [Google Scholar] [CrossRef]
- Li, X.; Li, X.; Li, Z.; Ma, M.; Wang, J.; Xiao, Q.; Liu, Q.; Che, T.; Chen, E.; Yan, G.; et al. Watershed allied telemetry experimental research. J. Geophys. Res. 2009, 114. [Google Scholar] [CrossRef]
- Yu, W.P.; Ma, M.G.; Wang, X.F.; Song, Y.; Tan, J.L. Validation of MODIS land surface temperature products using ground meaurements in the Heihe River Basin. Proc. SPIE 2011, 8714. [Google Scholar] [CrossRef]
- Li, Z.L.; Tang, B.H.; Wu, H.; Ren, H.Z.; Yan, G.J.; Wan, Z.M.; Trigo, I.F.; Sobrino, J.A. Satellite-derived land surface temperature: Current status and perspectives. Remote Sens. Environ. 2013, 131, 14–37. [Google Scholar] [CrossRef]
© 2014 by the authors; licensee MDPI, Basel, Switzerland. This article is an open access article distributed under the terms and conditions of the Creative Commons Attribution license (http://creativecommons.org/licenses/by/4.0/).
Share and Cite
Yu, W.; Ma, M.; Wang, X.; Geng, L.; Tan, J.; Shi, J. Evaluation of MODIS LST Products Using Longwave Radiation Ground Measurements in the Northern Arid Region of China. Remote Sens. 2014, 6, 11494-11517. https://doi.org/10.3390/rs61111494
Yu W, Ma M, Wang X, Geng L, Tan J, Shi J. Evaluation of MODIS LST Products Using Longwave Radiation Ground Measurements in the Northern Arid Region of China. Remote Sensing. 2014; 6(11):11494-11517. https://doi.org/10.3390/rs61111494
Chicago/Turabian StyleYu, Wenping, Mingguo Ma, Xufeng Wang, Liying Geng, Junlei Tan, and Jinan Shi. 2014. "Evaluation of MODIS LST Products Using Longwave Radiation Ground Measurements in the Northern Arid Region of China" Remote Sensing 6, no. 11: 11494-11517. https://doi.org/10.3390/rs61111494
APA StyleYu, W., Ma, M., Wang, X., Geng, L., Tan, J., & Shi, J. (2014). Evaluation of MODIS LST Products Using Longwave Radiation Ground Measurements in the Northern Arid Region of China. Remote Sensing, 6(11), 11494-11517. https://doi.org/10.3390/rs61111494