Article

Automated Extraction of the Archaeological Tops of Qanat Shafts from VHR Imagery in Google Earth

1
Key Laboratory of Digital Earth Science, Institute of Remote Sensing and Digital Earth, Chinese Academy of Sciences, Beijing 100094, China
2
University of the Chinese Academy of Sciences, Beijing 100049, China
3
International Centre on Space Technologies for Natural and Cultural Heritage under the Auspices of UNESCO, Beijing 100094, China
4
Gansu Provincial Institute of Urban Development, Lanzhou 730070, China
*
Author to whom correspondence should be addressed.
These authors contributed equally to this work.
Remote Sens. 2014, 6(12), 11956-11976; https://doi.org/10.3390/rs61211956
Submission received: 27 August 2014 / Revised: 26 October 2014 / Accepted: 12 November 2014 / Published: 1 December 2014
(This article belongs to the Special Issue New Perspectives of Remote Sensing for Archaeology)

Abstract

:
Qanats in northern Xinjiang of China provide valuable information for agriculturists and anthropologists who seek fundamental understanding of the distribution of qanat water supply systems with regard to water resource utilization, the development of oasis agriculture, and eventually climate change. Only the tops of qanat shafts (TQSs), indicating the course of the qanats, can be observed from space, and their circular archaeological traces can also be seen in very high resolution imagery in Google Earth. The small size of the TQSs, vast search regions, and degraded features make manually extracting them from remote sensing images difficult and costly. This paper proposes an automated TQS extraction method that adopts mathematical morphological processing methods before an edge detecting module is used in the circular Hough transform approach. The accuracy assessment criteria for the proposed method include: (i) extraction percentage (E) = 95.9%, branch factor (B) = 0 and quality percentage (Q) = 95.9% in Site 1; and (ii) extraction percentage (E) = 83.4%, branch factor (B) = 0.058 and quality percentage (Q) = 79.5% in Site 2. Compared with the standard circular Hough transform, the quality percentages (Q) of our proposed method were improved to 95.9% and 79.5% from 86.3% and 65.8% in test sites 1 and 2, respectively. The results demonstrate that wide-area discovery and mapping can be performed much more effectively based on our proposed method.

Graphical Abstract

1. Introduction

It has been widely known to archaeologists that the different visible archaeological traces (e.g., soil marks, crop marks, shadow marks, and damp marks) are crucial evidence indicating the existence of archaeological remains from space. These marks generally appear in contrast to surroundings due to different geographical and topographical conditions. Soil marks can appear on bare soil changing in color, shape, or texture [1,2]. In order to identify these buried archaeological features, different types of remote sensing imagery have been used including aerial photographs [1,3,4], spaceborne and airborne RADAR images [5,6,7], airborne LIDAR images [8,9], as well as imaging spectroscopy [10,11,12,13]. Recently, archaeologists interested in detecting archaeological features are increasingly employing very high resolution (VHR) commercial satellite imagery [14,15,16,17,18,19,20]. These data sources and practices will most probably continue to play a constructive role in the identification of archaeological features in the future.
However, collecting these data is time consuming and costly, thus it imposes severe limitations on the size of the area that can be investigated [21]. Meanwhile, Google Earth, a ‘virtual globe’ geographical information computer application released in 2005, is now widely used by planners, policy-makers and the public in both research and teaching in humanities and social and natural sciences [20,22,23,24,25,26,27,28]. Over the last decade, Google Earth has provided an unprecedented variety of remotely sensed VHR imagery with a spatial resolution of 1 m or finer. Although it does not provide multispectral information, it allows for the first time even small archaeological sites and features to be detected, which is a huge step forward for archaeological prospection [20,26,28,29].
Extracting archaeological traces from remote sensing imagery is an important task before any further processing. Remote sensing image analysis and processing for extracting archaeological traces have been basically manual or visual interpretation [30,31,32,33]. These manual identifications help prevent false positives, but are time consuming and strongly depend on the digitalization experience of archaeologists. Archaeological traces are very hard to observe due to multiple factors. They often appear as partial objects resulting from coarse image resolution, image degradation, the presence of obstacles (trees, man-made objects, etc.), and unfavorable preservation [34,35], which lowers the traces’ visibility. Archaeological traces have similar features in imagery such as variations in shadowing, soil color, moisture patterning, frost and snow marks, and crop marks [15,20]. In the literature, most methods focus on applying radiometric enhancement, spatial filters and spectral indexes for archaeological investigations [15,36,37,38]. In order to save time and manpower, several studies have tried to employ (semi-) automatic methods to extract archaeological traces [14,16,21,26,39,40,41,42,43,44].
The existing work almost exclusively focuses on research methods for (semi-) automatic extraction of linear, rectangular or circular archaeological traces from remote sensing images. The image-based archaeological trace extraction approaches could be divided into two general categories. One is unsupervised, which are fully autonomous approaches, and the other is supervised, which requires the input of a domain expert. The unsupervised methods rely on pattern recognition techniques to identify archaeological traces in an image as circular or elliptical features [21,39]. The original image is pre-processed to enhance the edges of the archaeological traces and the actual extraction is achieved by means of the Hough transform [39], genetic algorithms [21], or the image segmentation approach [14,36], which identifies regions with obvious boundary contrast. Also, a comparison of three methods—GIS-, pixel- and object-based techniques—found that the object-based method performed the best in wall detection [14].
The supervised methods [34,41,42,43,44] use machine learning concepts to train an algorithm to extract archaeological traces. In the learning phase, a training set of images containing archaeological traces labeled by domain experts is fed to an algorithm. In the extraction phase, the previously trained algorithm detects archaeological traces in a new unlabeled set of images. A continuously-scalable template model technique was used to achieve extraction of the ancient Arabian tombs and agricultural crop marks in [41,42], respectively. D’Orazio et al. [34] proposed a semi-automatic approach for archaeological trace extraction that used a region based active contour model; and in [43] the archaeological trace extraction approaches consisted of a combination of the active contour model, image segmentation, and object filtering analysis. In [44], unsupervised genetic algorithms and supervised support vector machines were tested together, which improved the extraction accuracy on ground-penetrating radar imagery.
Qanats, also known as karezes, have been effective for nearly 3000 years [45] and are still being used as one of the main ways of procuring water for irrigation and agricultural development not only in the Turpan Basin of China but also in other countries such as Iran and Afghanistan [46,47,48,49]. A qanat is a water supply system consisting of an underground tunnel connected to the surface by a series of shafts, using gravity to bring water from the water table to the surface. Qanats create a reliable supply of water for human settlements and irrigation in arid and semi-arid regions, and were originally invented by Iranians [46,48]. They are a form of traditional irrigation system that has made great contributions to oasis civilizations [50,51,52,53]. In China, qanat systems exist only in Xinjiang. Chinese researchers think the history of the qanat in Xinjiang can be traced back to 2000 years ago, but different opinions exist on the origin and date of the qanats due to a lack of adequate evidences [52,53]. At present, many factors threaten qanat systems in China and worldwide. Global climate change and desertification [50,53], urban sprawl [54], over-consumption of freshwater resources, and introduction of new technologies [50], as well as inadequate policies have all contributed towards the degradation of the ingenious qanat systems [55].
A large number of ancient qanats—rare and invaluable agricultural and cultural heritage on the ancient Silk Road—remain in the Turpan Basin of northern Xinjiang. In recent decades, qanats have been replaced by modern pumping wells to meet a sharply increasing demand for water in the Turpan Basin. Uncontrolled overexploitation of groundwater has impacted not only the qanats, but also local ecological environments. There is thus an urgent need for the protection and revival of the existing network of qanat systems to further sustain water resources and related agricultural biodiversity in arid regions of the world. Only the tops of qanat shafts (TQSs), indicating the course of the qanat system, can be observed from space. Generally, early studies of qanats were based on the manual extraction results of TQSs from remote sensing images [54,55], which required a great deal of manpower, specific knowledge, and skills. In this paper, we propose an automatic method for TQSs’ extraction that uses the circular Hough transform (CHT) followed by mathematical morphological processing (MMP) and the Canny edge detector (CED). The main contributions of this work include adopting MMP and CED to overcome the limited performance in our context due to speckle noises. Tests were carried out on Google Earth VHR images in different contexts to demonstrate the effectiveness of the method in broad applications.

2. Study Areas and Archaeological Circular Marks
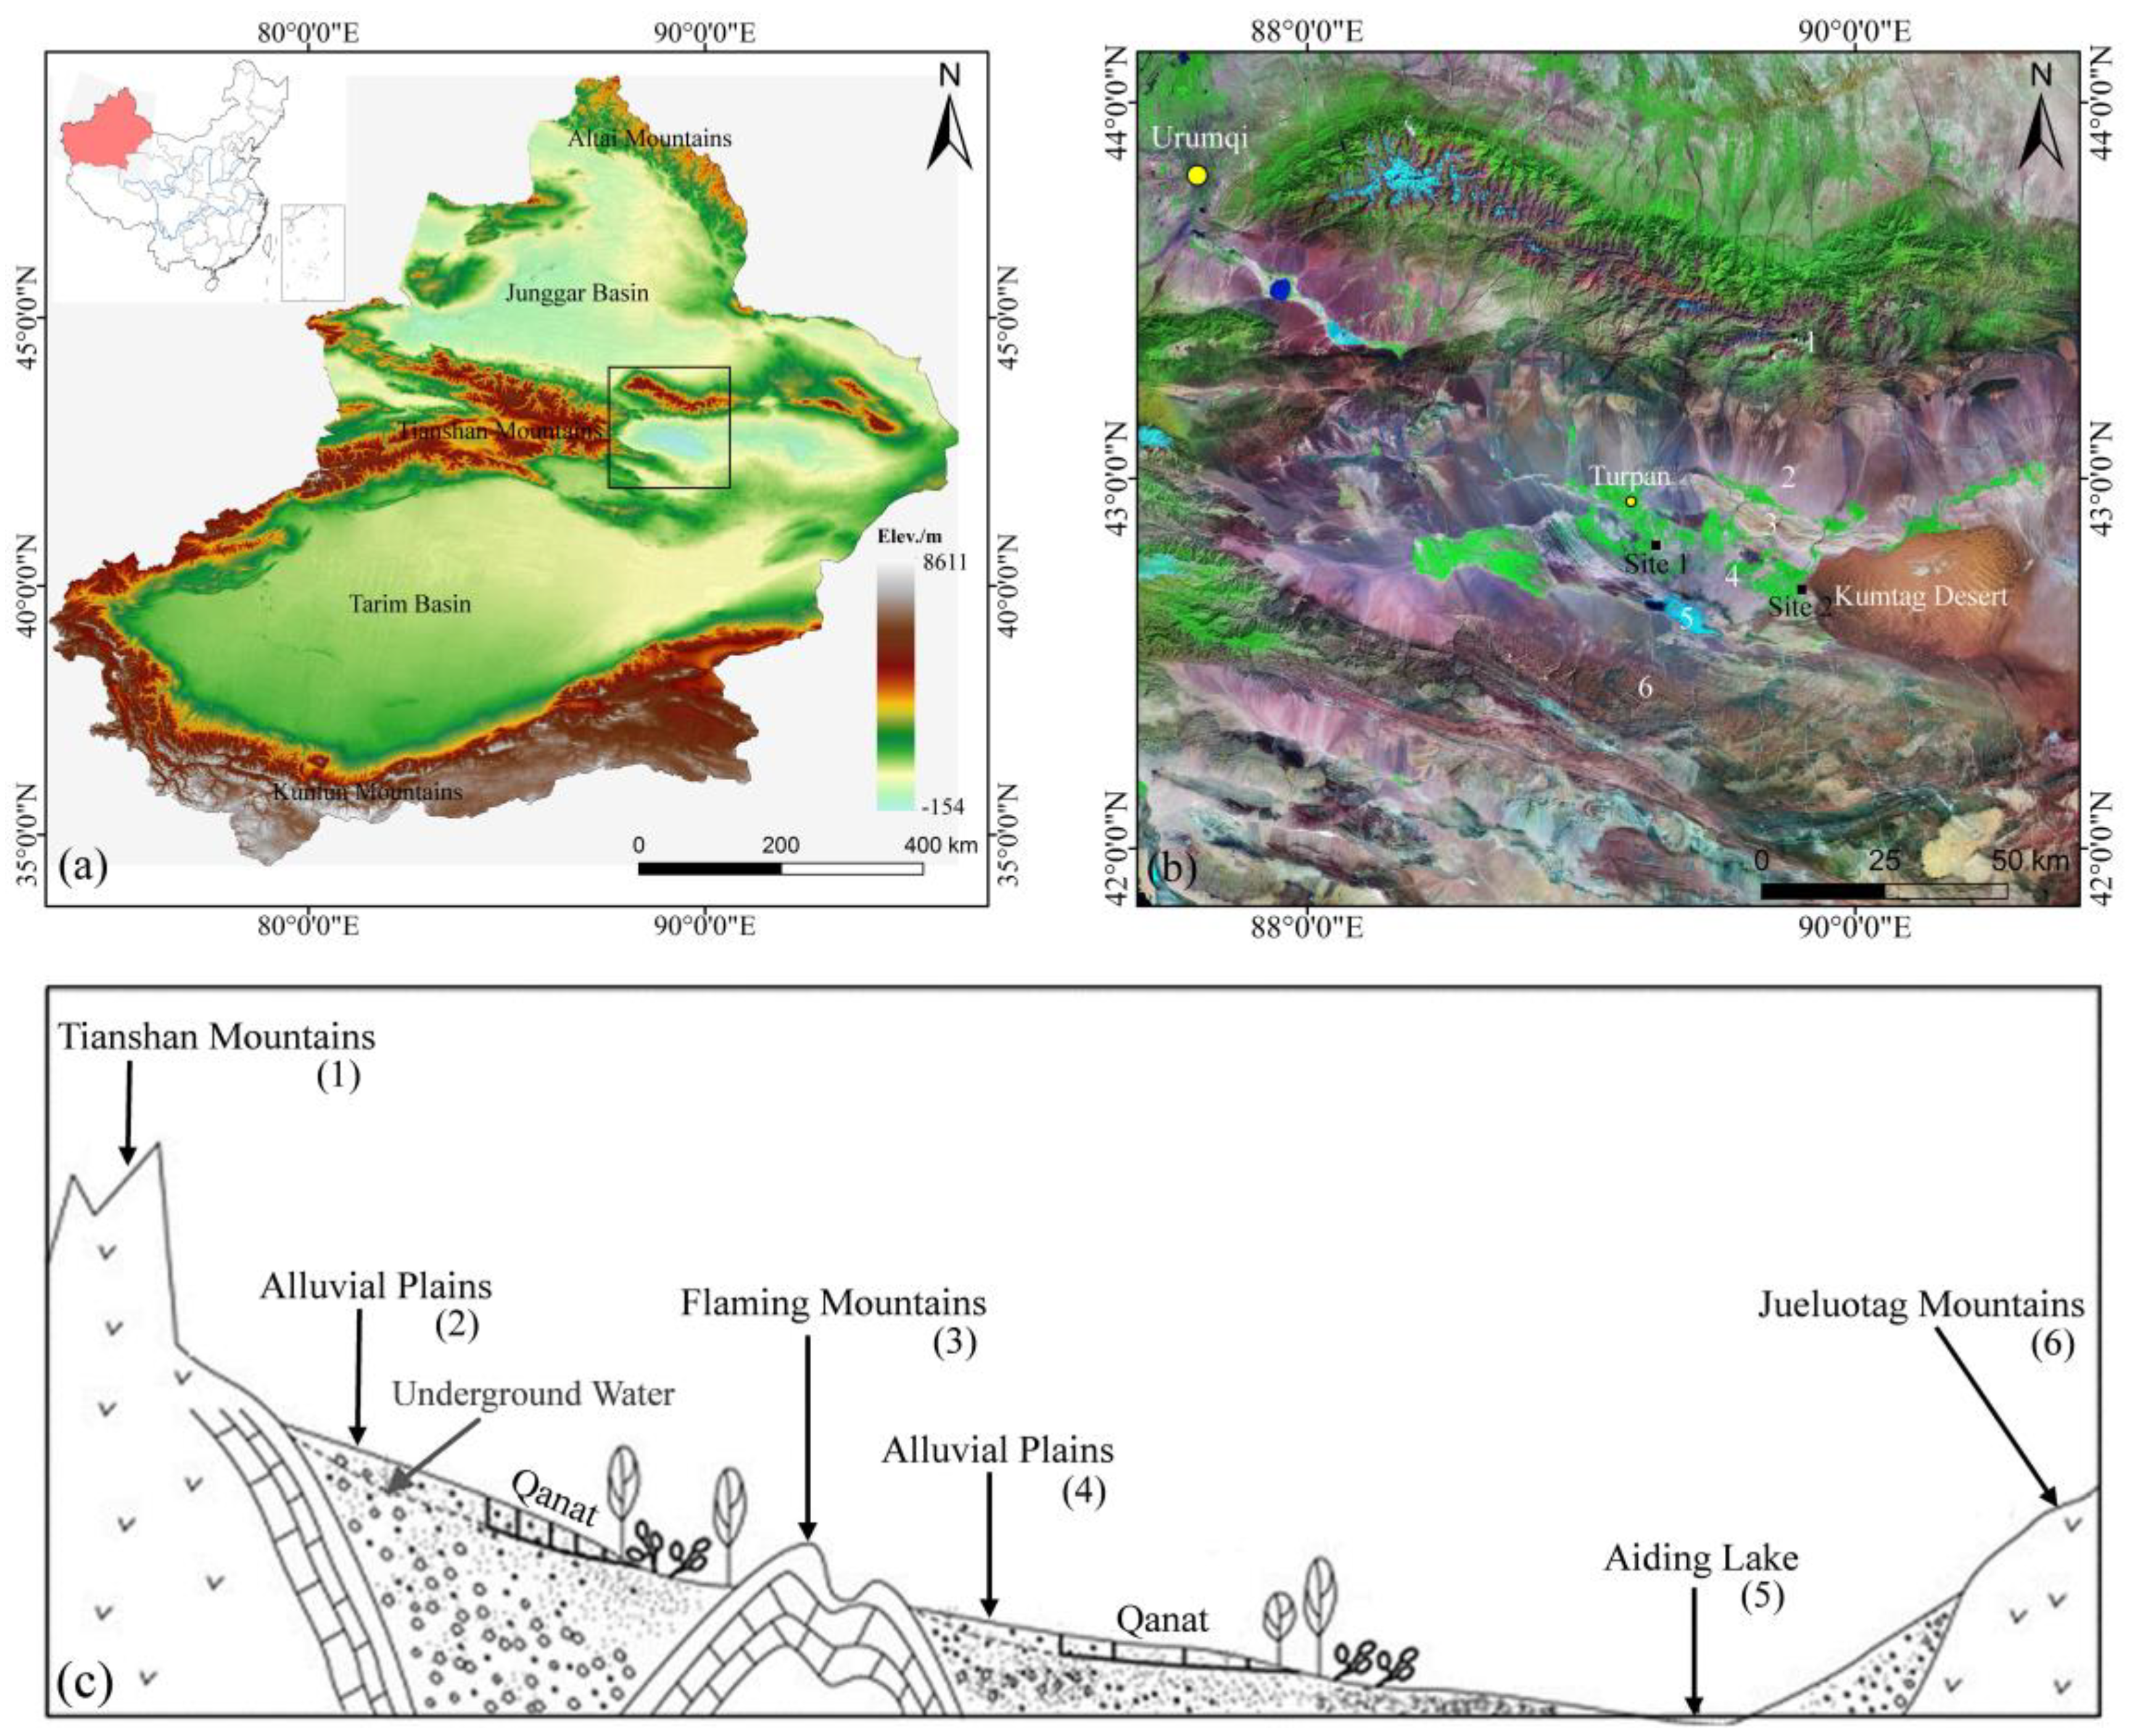
2.1. Study Area

One of the world’s largest qanat systems is located in the Turpan Basin, in northwestern China’s Xinjiang Uyghur Autonomous Region (Figure 1a). Deserts account for 43% of Xinjiang’s total area [52], while oases account for 4.3%, and most of the rest is occupied by vast mountains. The ancient Silk Road, which crossed extensive deserts in the region, was dependent on a line of strategically situated oases hugging the Taklimakan Desert in the Tarim Basin. Nowadays, more than 95% of the total population and almost all the agriculture, settlements and industries in the region are concentrated in the oases [52]. Irrigated agriculture has played a significant role in maintaining the oasis civilization in Xinjiang. Of course, qanat systems, as one form of traditional irrigation technology, have made great contributions in this regard.
The Turpan Basin used to be one of the main stops along the ancient Silk Road. This region is the second lowest inland depression in the world, with 4000 km2 of land located below sea level. Its western part, near the oasis county-level city of Turpan, is the lowest area in mainland China with an elevation of 154 m below the average sea level elevation [50]. Turpan Basin is an extremely arid area with average annual rainfall of less than 15 mm. The oases are irrigated by glacier and snow meltwater from the northern and western Tianshan Mountains. The Turpan Basin can be divided into six geomorphological units from north to south: Tianshan Mountains, Alluvial Plains, Flaming Mountains, Alluvial Plains, Aiding Lake, and the Jueluotag Mountains.
Due to its unique geographical, topographical, climatic, and hydrological conditions, the Turpan Basin could support a large qanat system with a total length of more than 5000 km [50]. The system is a rich water source for the lower basins that are mainly covered with fine sand and loess soil. With an altitude of about 800 m, the Flaming Mountains located at the northeastern edge of the basin intercept part of the groundwater recharged into the gravel layers of the Gobi belt and raise the groundwater table [51]. Consequently, many springs flow out into the northern foot of the Flaming Mountains, then run through hills and valleys, and ultimately seep into the alluvial fans. The qanat systems in the Turpan Basin generally tap groundwater from the northern and northeastern alluvial fans and transfer water into the lower basin areas towards Aiding Lake [50,51]. The Turpan qanat system was inscribed in the latest version of the UNESCO Tentative Lists of World Heritage Sites in 2012.
Figure 1b shows the location of the two test sites on Landsat satellite images with spatial resolution of 15 m. The coordinates of the two sites are 89°16′33′′E and 42°50′27′′N for Site 1 and 89°50′40′′E and 42°40′45′′N for Site 2. Site 1 is enclosed by several sub-oases and located about 15 km southeast of Turpan, and approximately 21 km southeast of Ancient Jiaohe. Site 2 is at the junction of the western margin of the Kumtag Desert and the eastern margin of the Turpan oasis, which is about 61 km southeast of Turpan and approximately 32 km southeast of Ancient Gaochang. Ancient Jiaohe and Ancient Gaochang, important sites on the ancient Silk Road, were included in the World Heritage List by UNESCO this June. With the use of GPS, a field investigation was conducted in August 2013 in the test sites.
Figure 1. Location of the Turpan Basin in China. (a) DEM color shaded-relief map of Xinjiang. (b) Landsat5 TM 742-band false-color image of Turpan Basin, the white numbers corresponding to the black numbers in (c) Diagrammatic cross-section of Turpan Basin.
Remotesensing 06 11956 g001

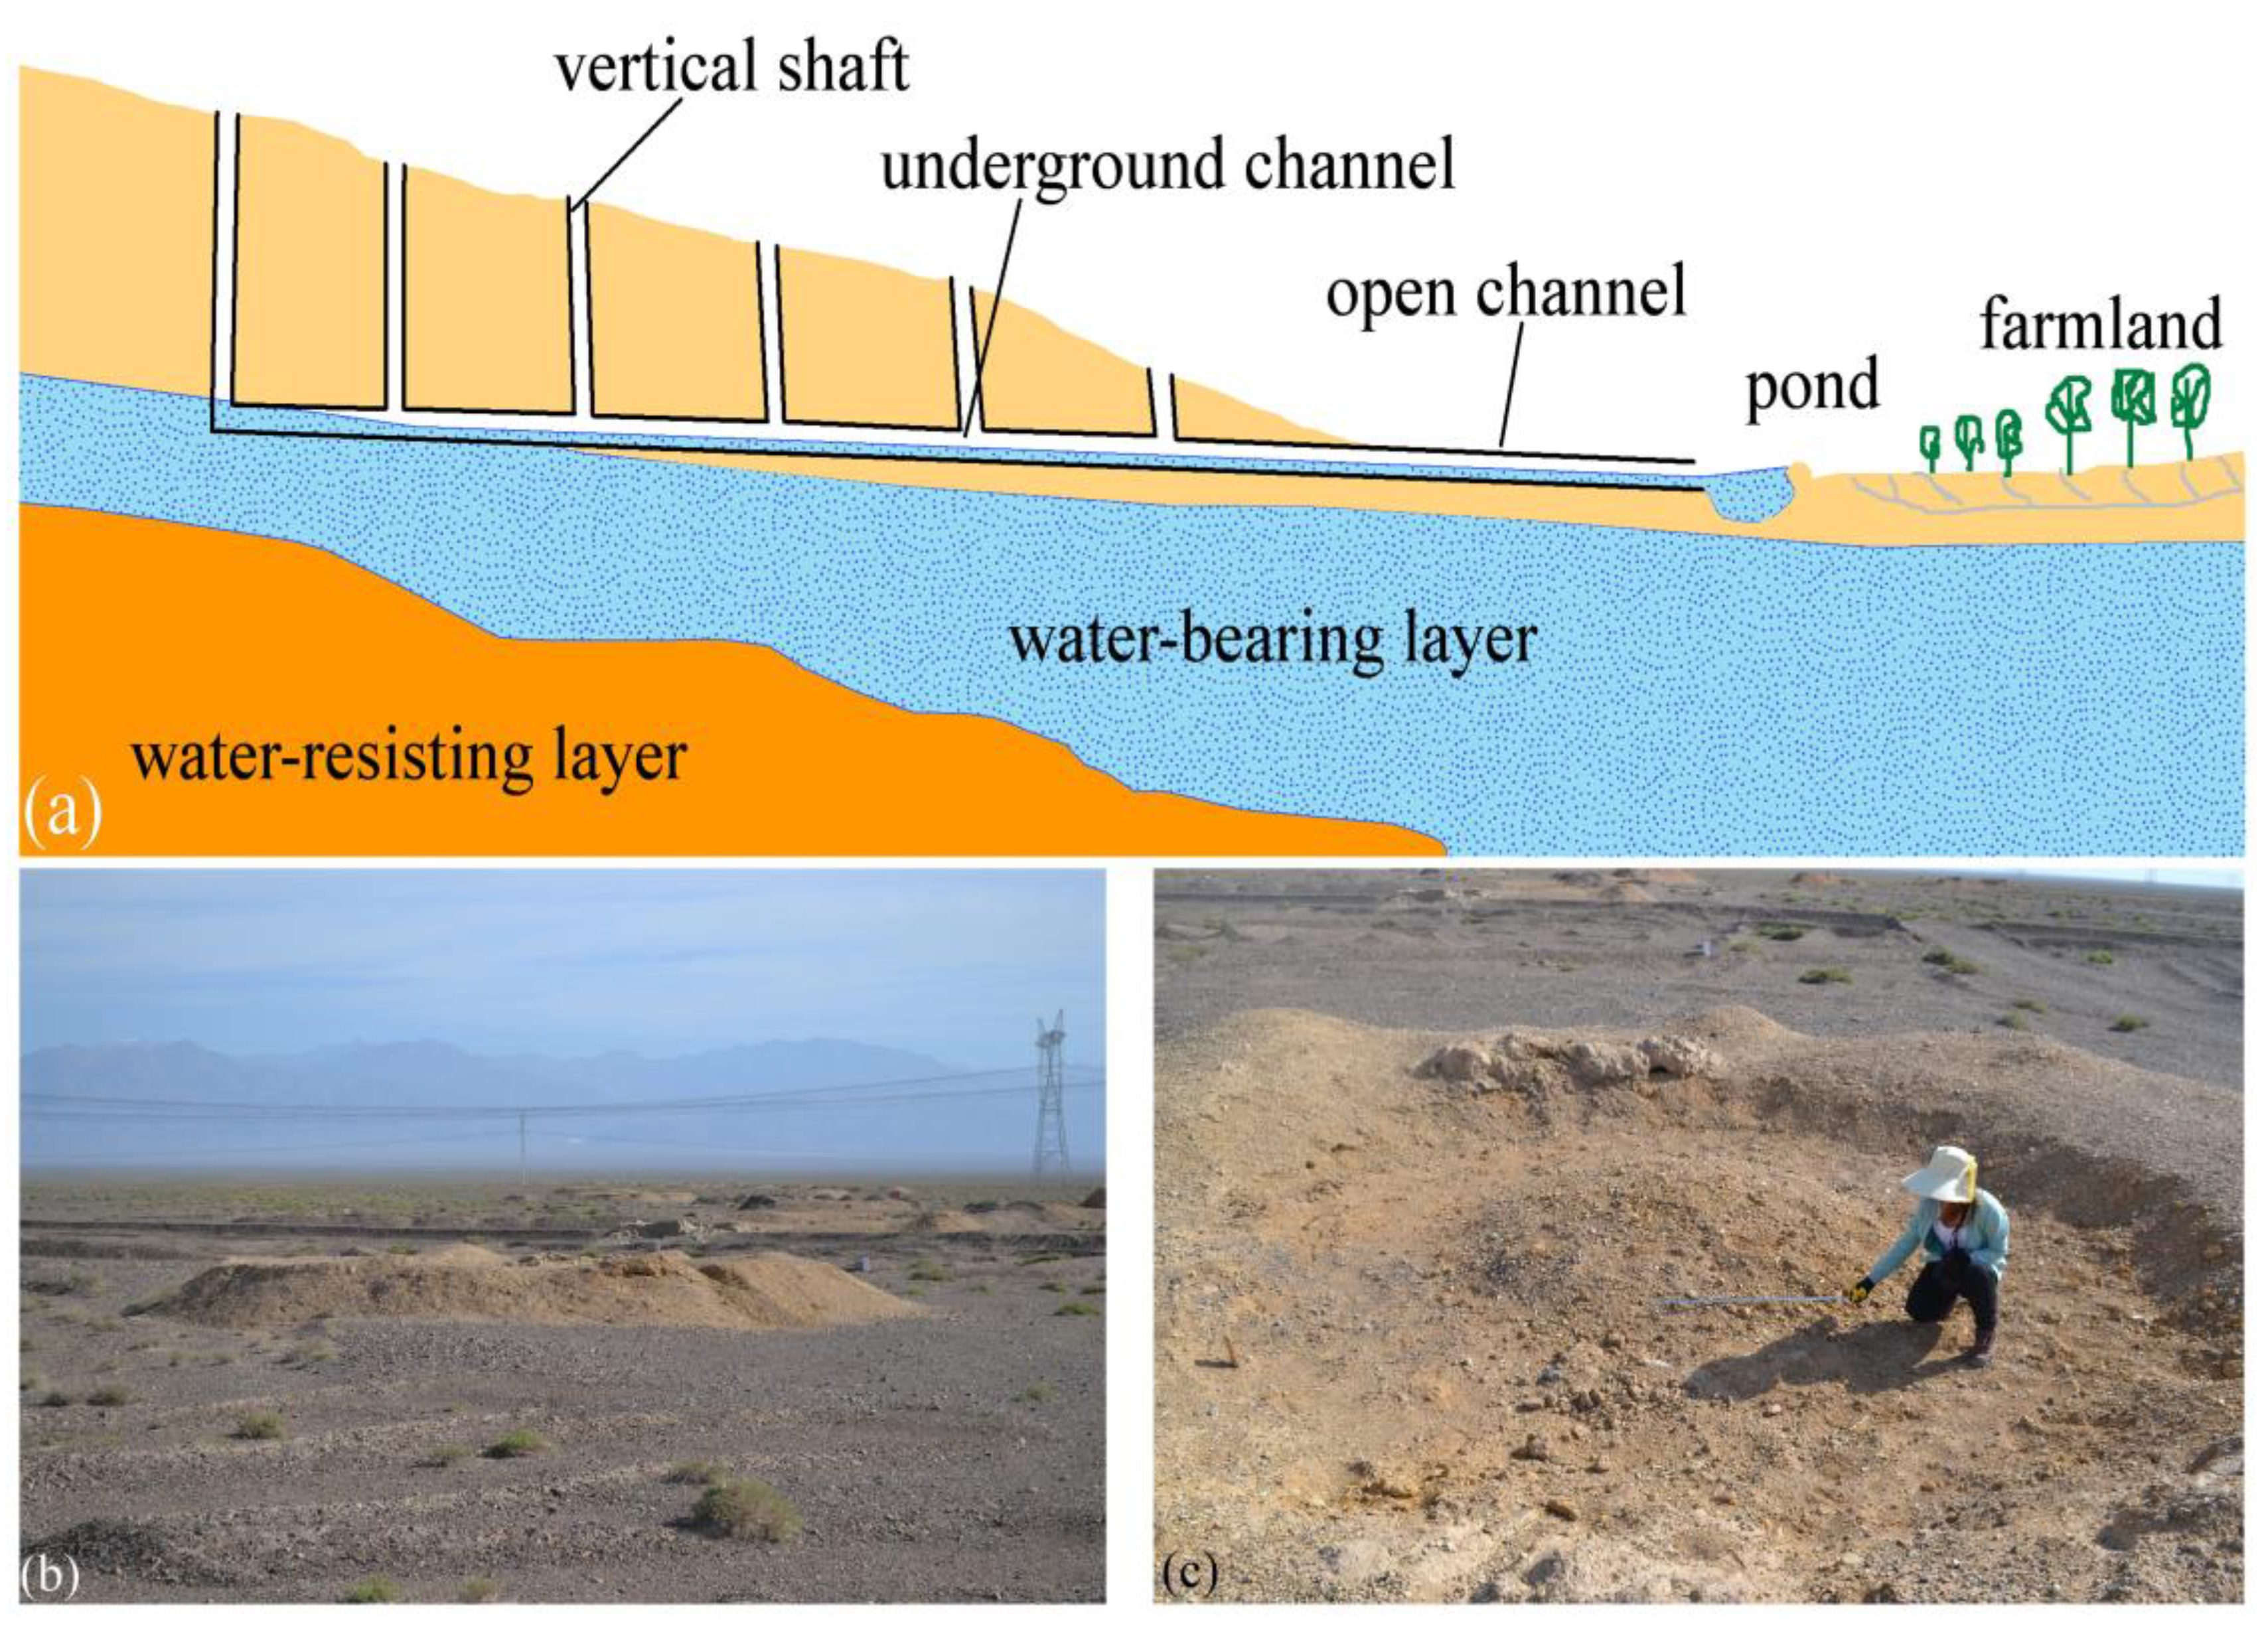
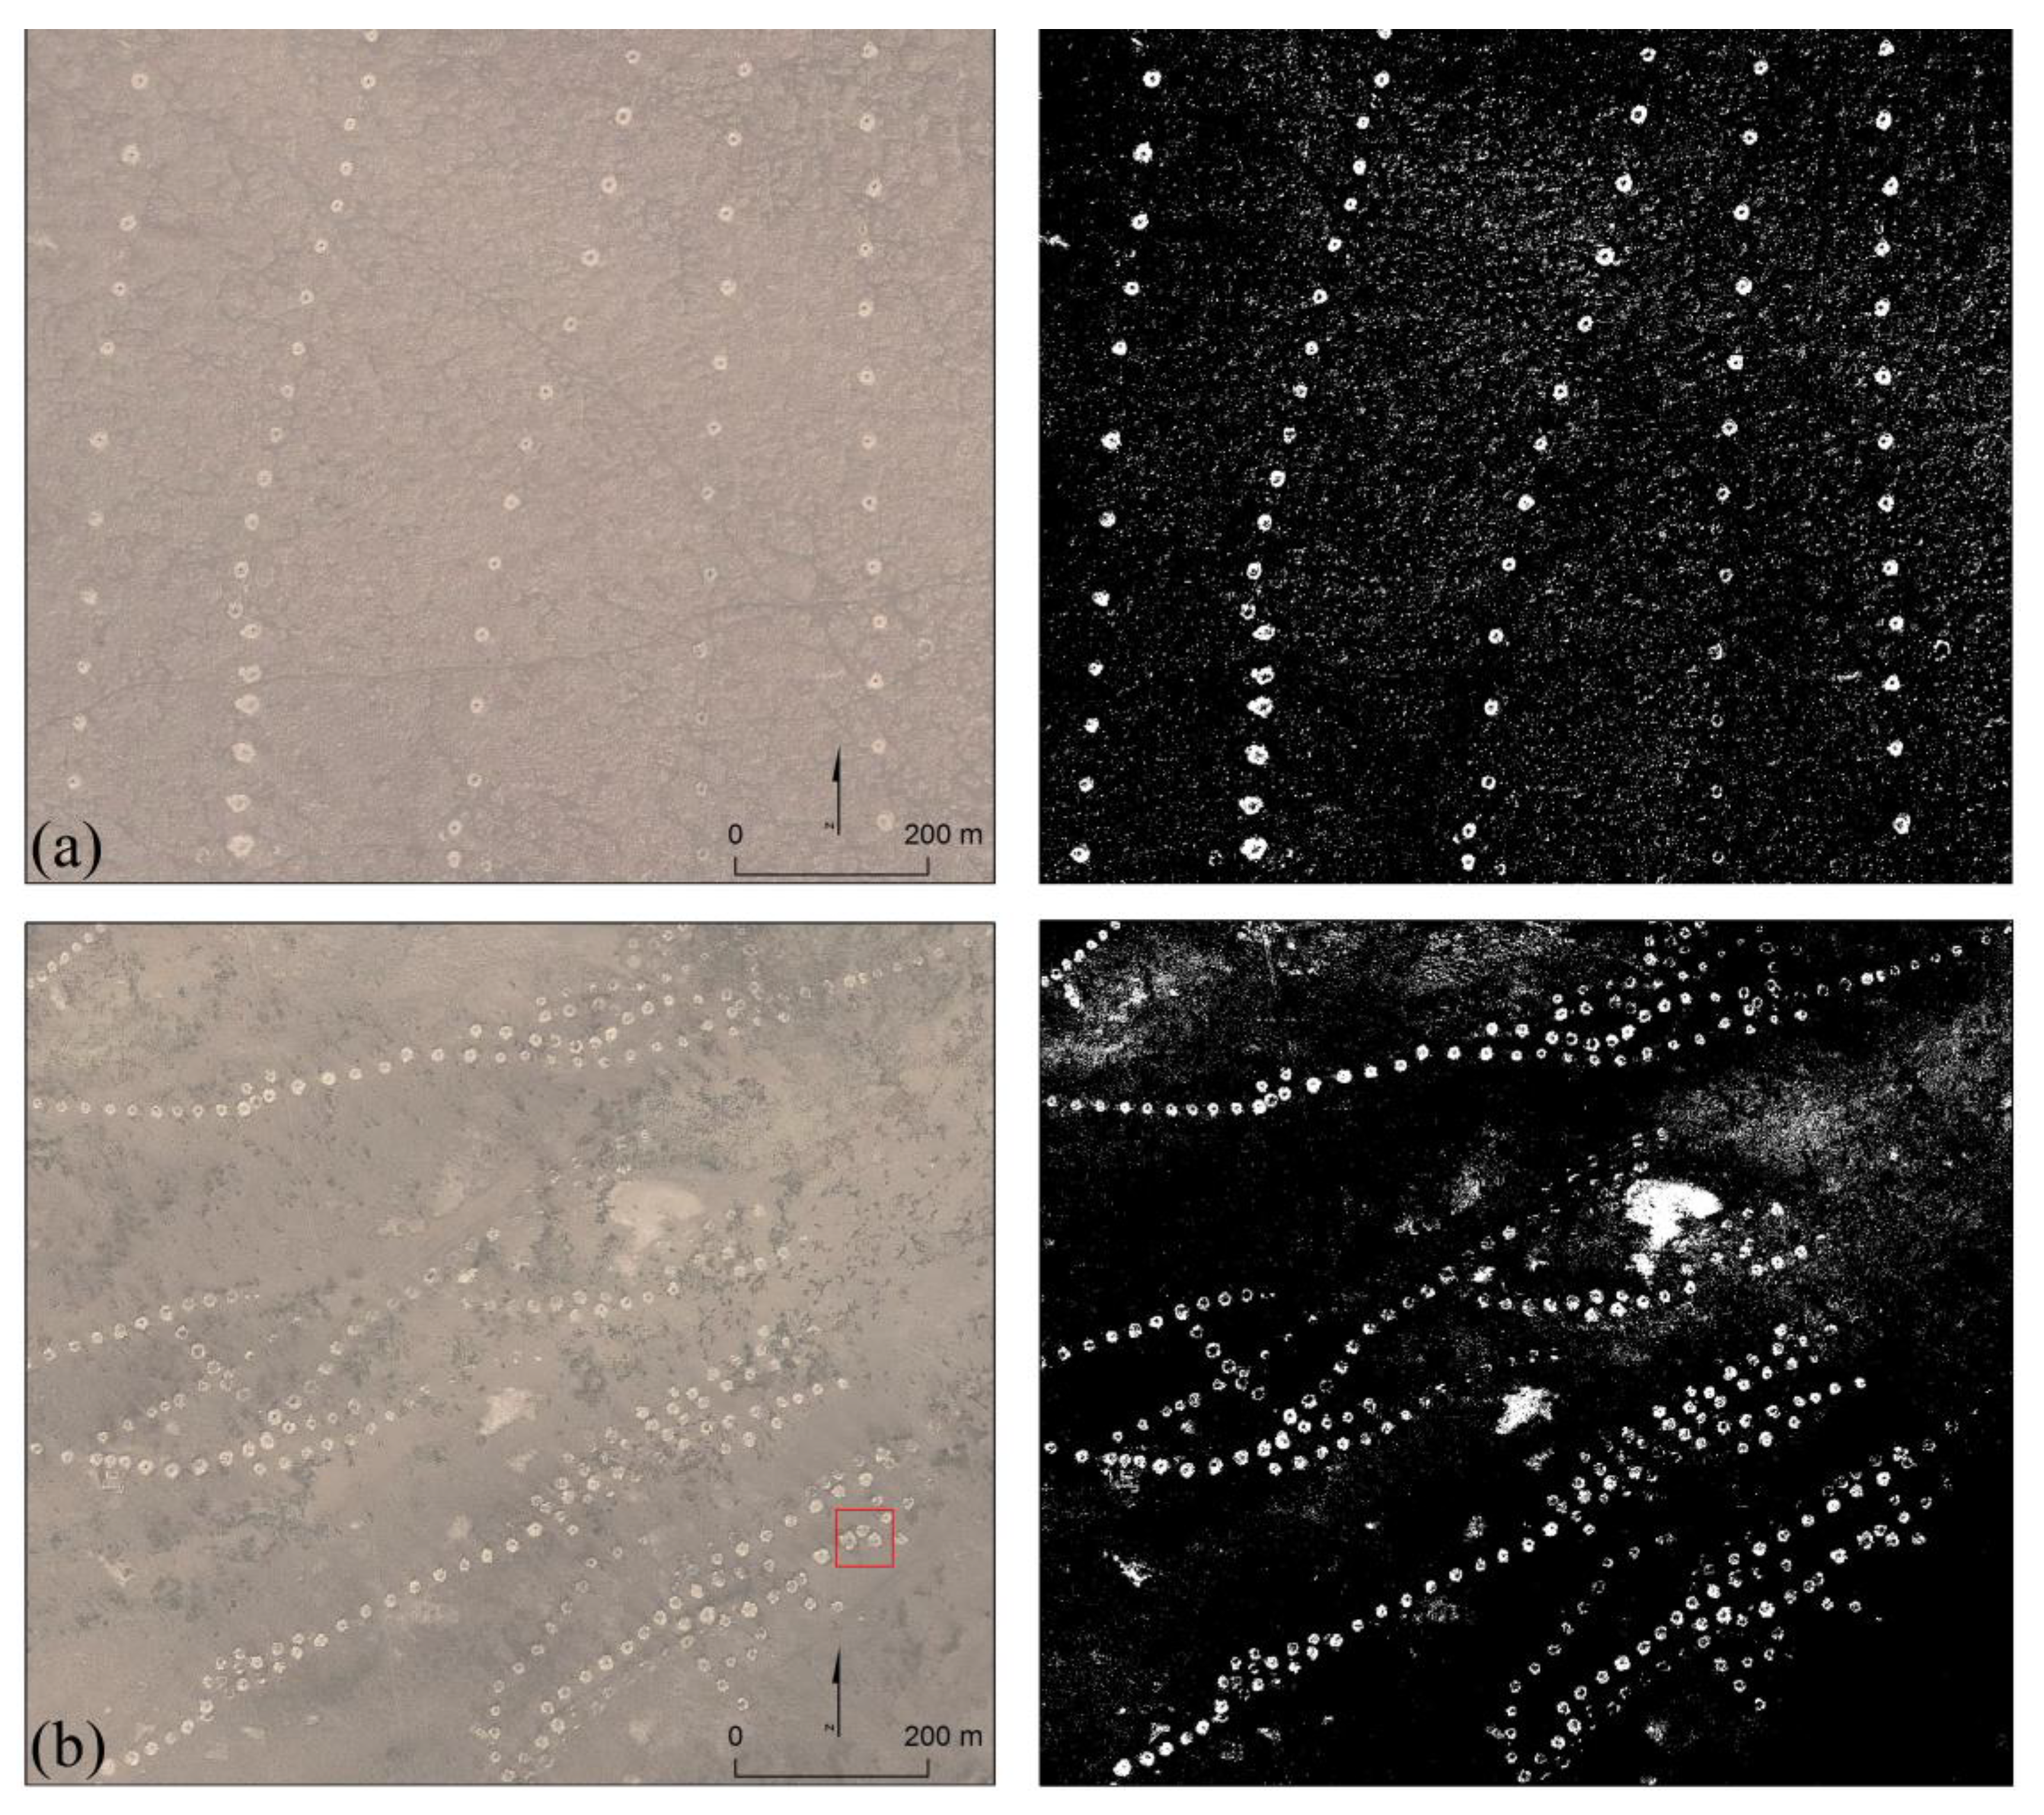
2.2. Circular Archaeological Traces: Tops of Qanat Shafts

Qanats represent a unique and integrative system illustrating the use of indigenous knowledge and wisdom in sustainable management of land, water, and agricultural biodiversity in arid regions with very low water accessibility [50]. Qanats are constructed by tunneling into the base of a mountainous area and following a water-bearing formation. A qanat system generally consists of four components: vertical shafts, tunnels, open channels, and ponds. The underground tunnels convey groundwater by means of gravity to the ground surface. Only the TQSs, indicating the course of the qanats, can be observed from space. Figure 2a shows a general schematic of a qanat system. In the Turpan Basin, the depth of the vertical shafts varies with the depth of the tunnel, in the lower reaches the shafts may be only a few meters deep, while some of the deepest shafts may be more than 100 m deep [50,53,55]. The size of the underground tunnel is between 0.5–0.8 m wide and 1.2–1.8 m high [55]. In addition to the vertical shafts and the conveyance tunnel it is common to have a storage pool not far away from the canal opening. This pool is used for storing water at night and may also be used as a means for measuring and dividing water among different users.
Figure 2. (a) Schematic view of a typical qanat system. (b) and (c) are photos of TQSs.
Remotesensing 06 11956 g002
In the Turpan Basin, the proportion of oasis area irrigated by qanats decreased sharply from more than 70% to less than 20% between the 1950s and early 21st century. By 2009, only 238 out of the existing 1079 qanat systems in Turpan were still functioning normally whereas most of them were dried up and abandoned [51]. This decline may have many causes. One may be that there has been a decline in precipitation in the mountains and/or a natural decline in water flow in the rivers affecting the recharge of groundwater. Another and perhaps an equally or more important reason for the decline in groundwater level is the spread of well irrigation [55] after the founding of new China in 1949.
To date many archaeological TQSs in various periods have been abandoned in the Turpan Basin. These visible soil marks appeared due to changes in color or texture. Most TQSs appear the same as soil marks in oasis and desert-land, and appear as circular blob marks in the Google Earth VHR satellite imagery. TQSs in the Turpan Basin are often complex structures despite their overall circular appearance. Some TQSs have already collapsed and been deformed by wind erosion and are barely distinguishable from the background. Figure 2b,c is a photo of typical archaeological marks of these ancient TQSs in the Turpan region.

3. Data and Methods

The flow chart of our method for extracting TQSs from Google Earth VHR satellite images is shown in Figure 3. Firstly, a circle average filter was applied to suppress the noise in the Google Earth VHR images. Secondly, mathematical morphological processing was conducted on the binary images. Thirdly, the edge intensities of the MMP images were detected by using the Canny edge operator. Lastly, an improved CHT approach was used to extract the TQSs.
Figure 3. Work flow of the proposed automatic TQS extraction method.
Remotesensing 06 11956 g003

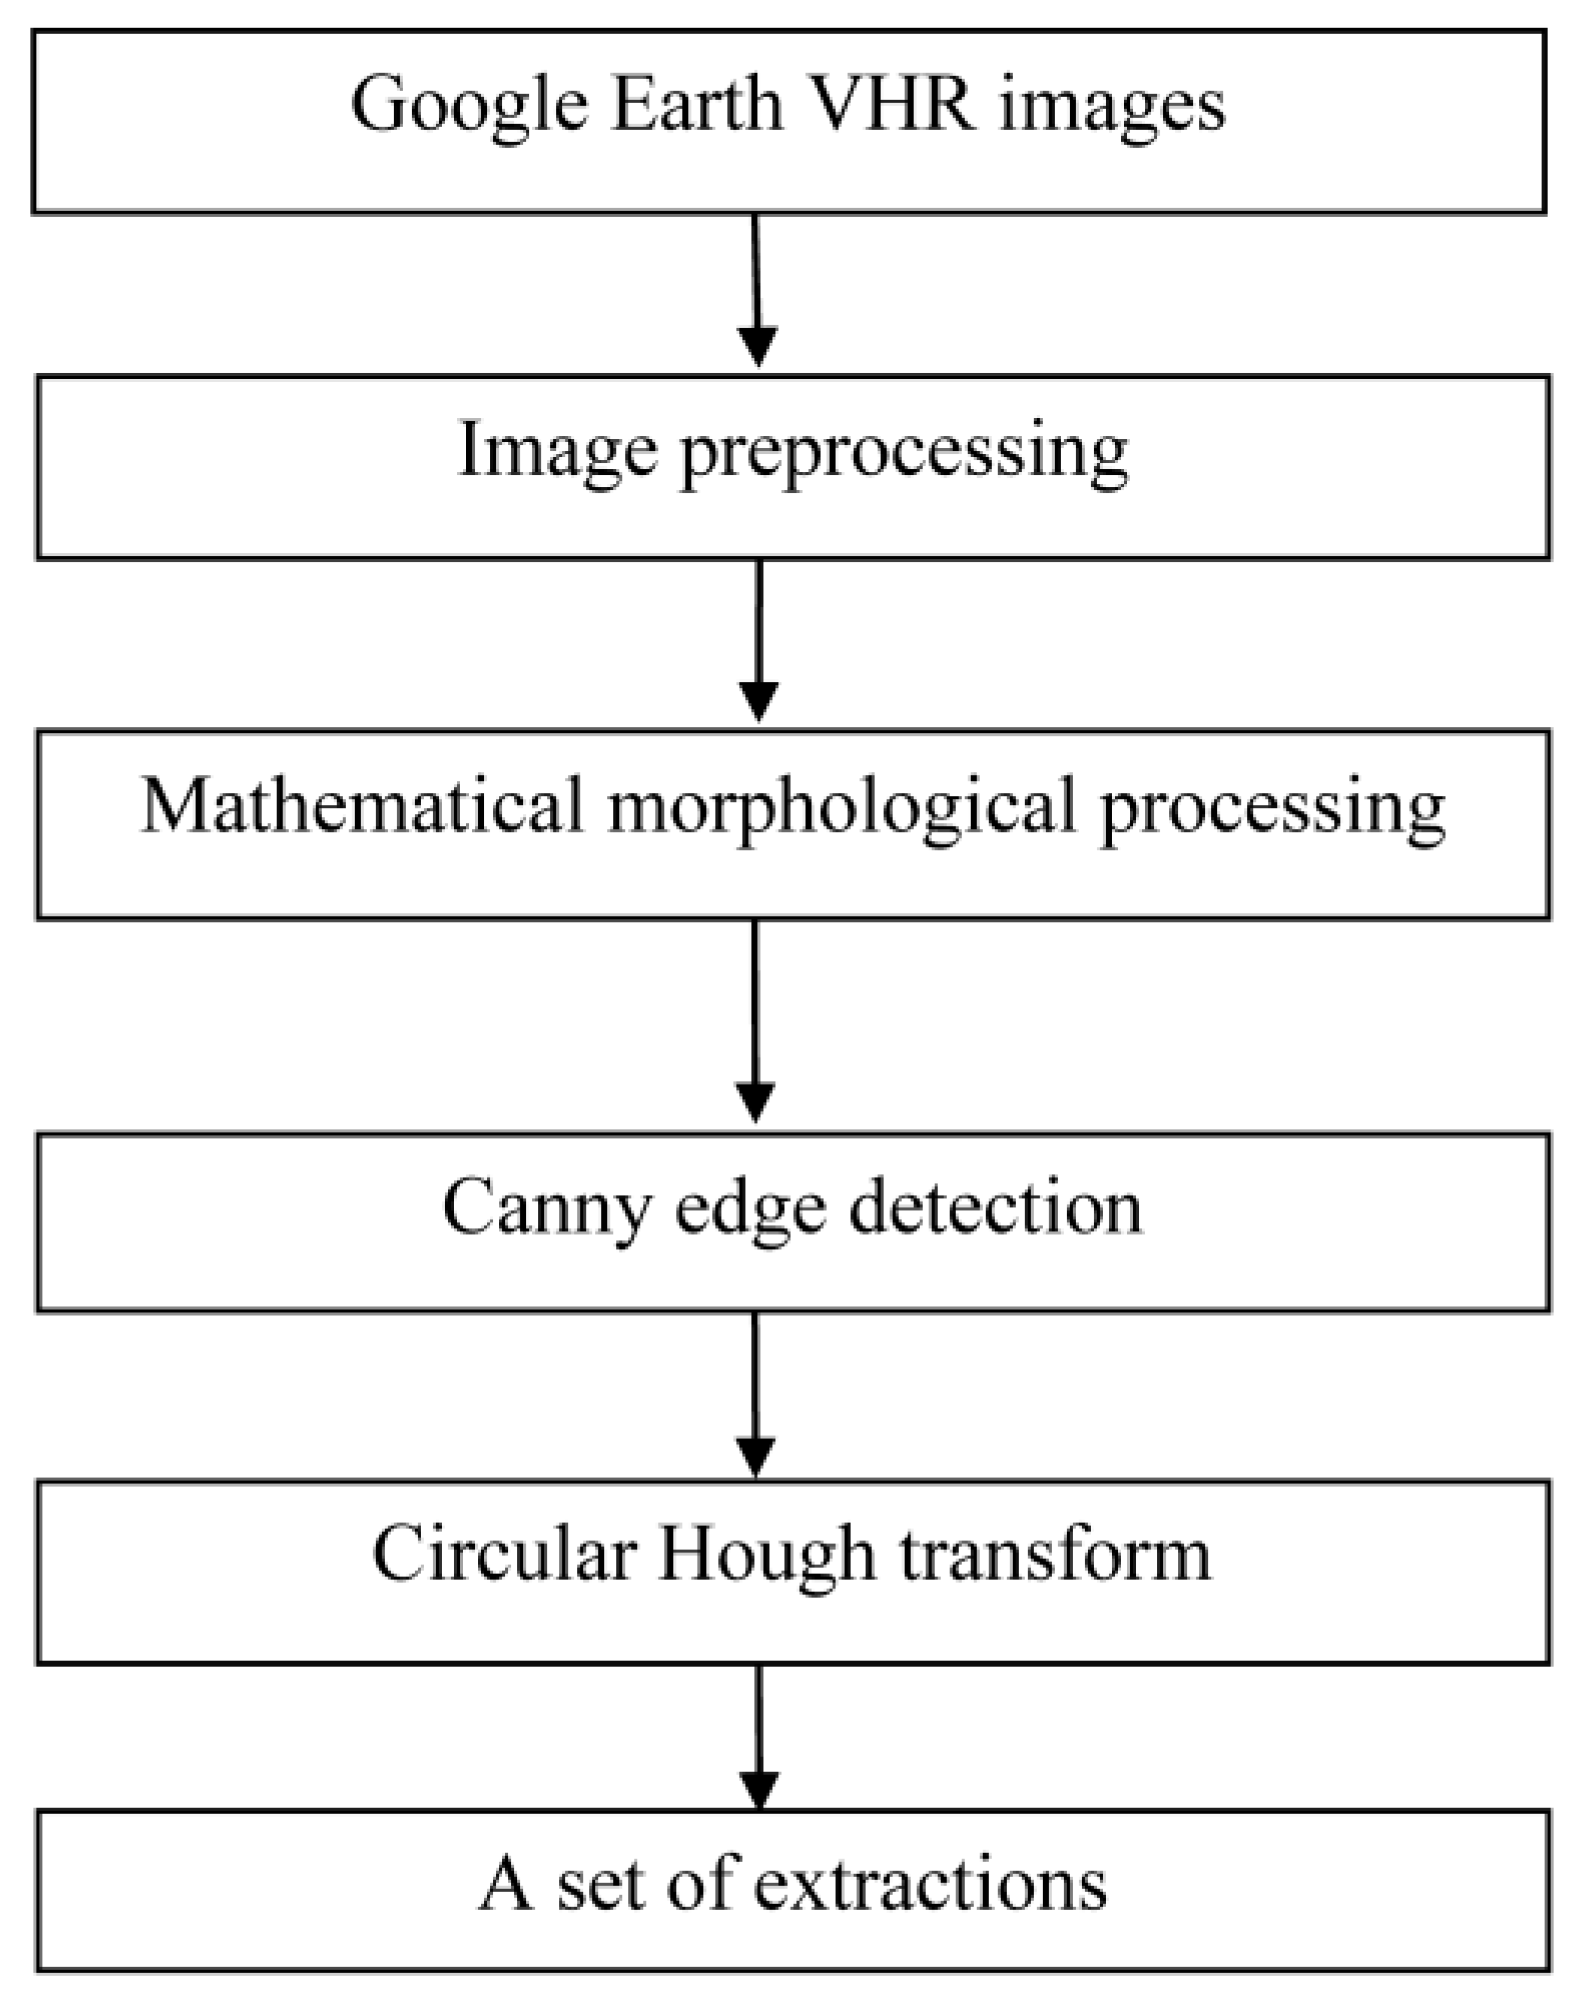
3.1. Google Earth VHR Images

Regarding test images, we used VHR satellite images downloaded from Google Earth, which serves mostly U.S. National Aeronautics and Space Administration (NASA) satellite images. Google Earth serves VHR imagery from several commercial satellites from 2000 to the present day [22,25,26,29]. Google Earth, according to the importance ranking of different regional locations, provides satellite images with different resolutions. Its finest spatial resolution is 0.4 m. Google Earth Pro license provides a cost-effect alternative. For the Turpan Basin, coverage includes 1-meter color IKONOS images from 2003 and GeoEye images from 2010 representing different seasons and time periods of imagery. The program has tools to clip two GeoEye images (acquisition date: 29/05/2013) and save them at a “premium resolution” of 4800 dpi [29].
Google Earth images are only RGB renderings, so we are not looking for true DNs of the original images. The NIR band is also not available, and the original spatial resolution is reduced. In brief, they are not usable for quantitative remote sensing applications, but are still interesting for archaeological object recognition and visual applications (e.g., pattern recognition and computer vision methods). Two GeoEye images were clipped with each image covering a ground area of 1000 m × 900 m. Using 15 m panchromatic orthorectified Landsat images as a base, two clips were geo-referenced in ArcGIS10.1 with minimal root mean square error (RMSE) [20].
The left panels in Figure 4 show the two test sites of ancient TQSs visible on Google Earth VHR satellite images with a resolution of 4800 × 3892 pixels. Both Site 1 and Site 2 are now wastelands resulting from excessive reclamation and lack of water irrigation; the lands became barren and were abandoned. Only desert-lands and saline-alkaline lands were recorded during our field work.

3.2. Image Preprocessing

Since the imagery of the two test sites had different intensities of information not conducive to feature extraction, the image quality needed to be enhanced before binarization processing. The aim of enhancement is to increase the contrast of images, selectively highlight the features in regions of interest, and suppress noise. A circle average filter was used to suppress noise for detecting circle objects. This convolved the image with a uniform circular averaging filter. Then, the Google Earth VHR images I (x, y) were transformed into binary images B (x, y) (see Figure 4) using Equation (1).
B ( x ,   y ) = { 1   ( black ) ,   I ( x ,   y ) < I t h r e s h o l d 0   ( white ) ,   I ( x ,   y ) I t h r e s h o l d
Figure 4. Google Earth VHR images of the test sites. The left and right panels show Google Earth VHR images of the test sites and derived binary images with threshold = 70, respectively. (a) Test Site 1. (b) Test Site 2.
Remotesensing 06 11956 g004

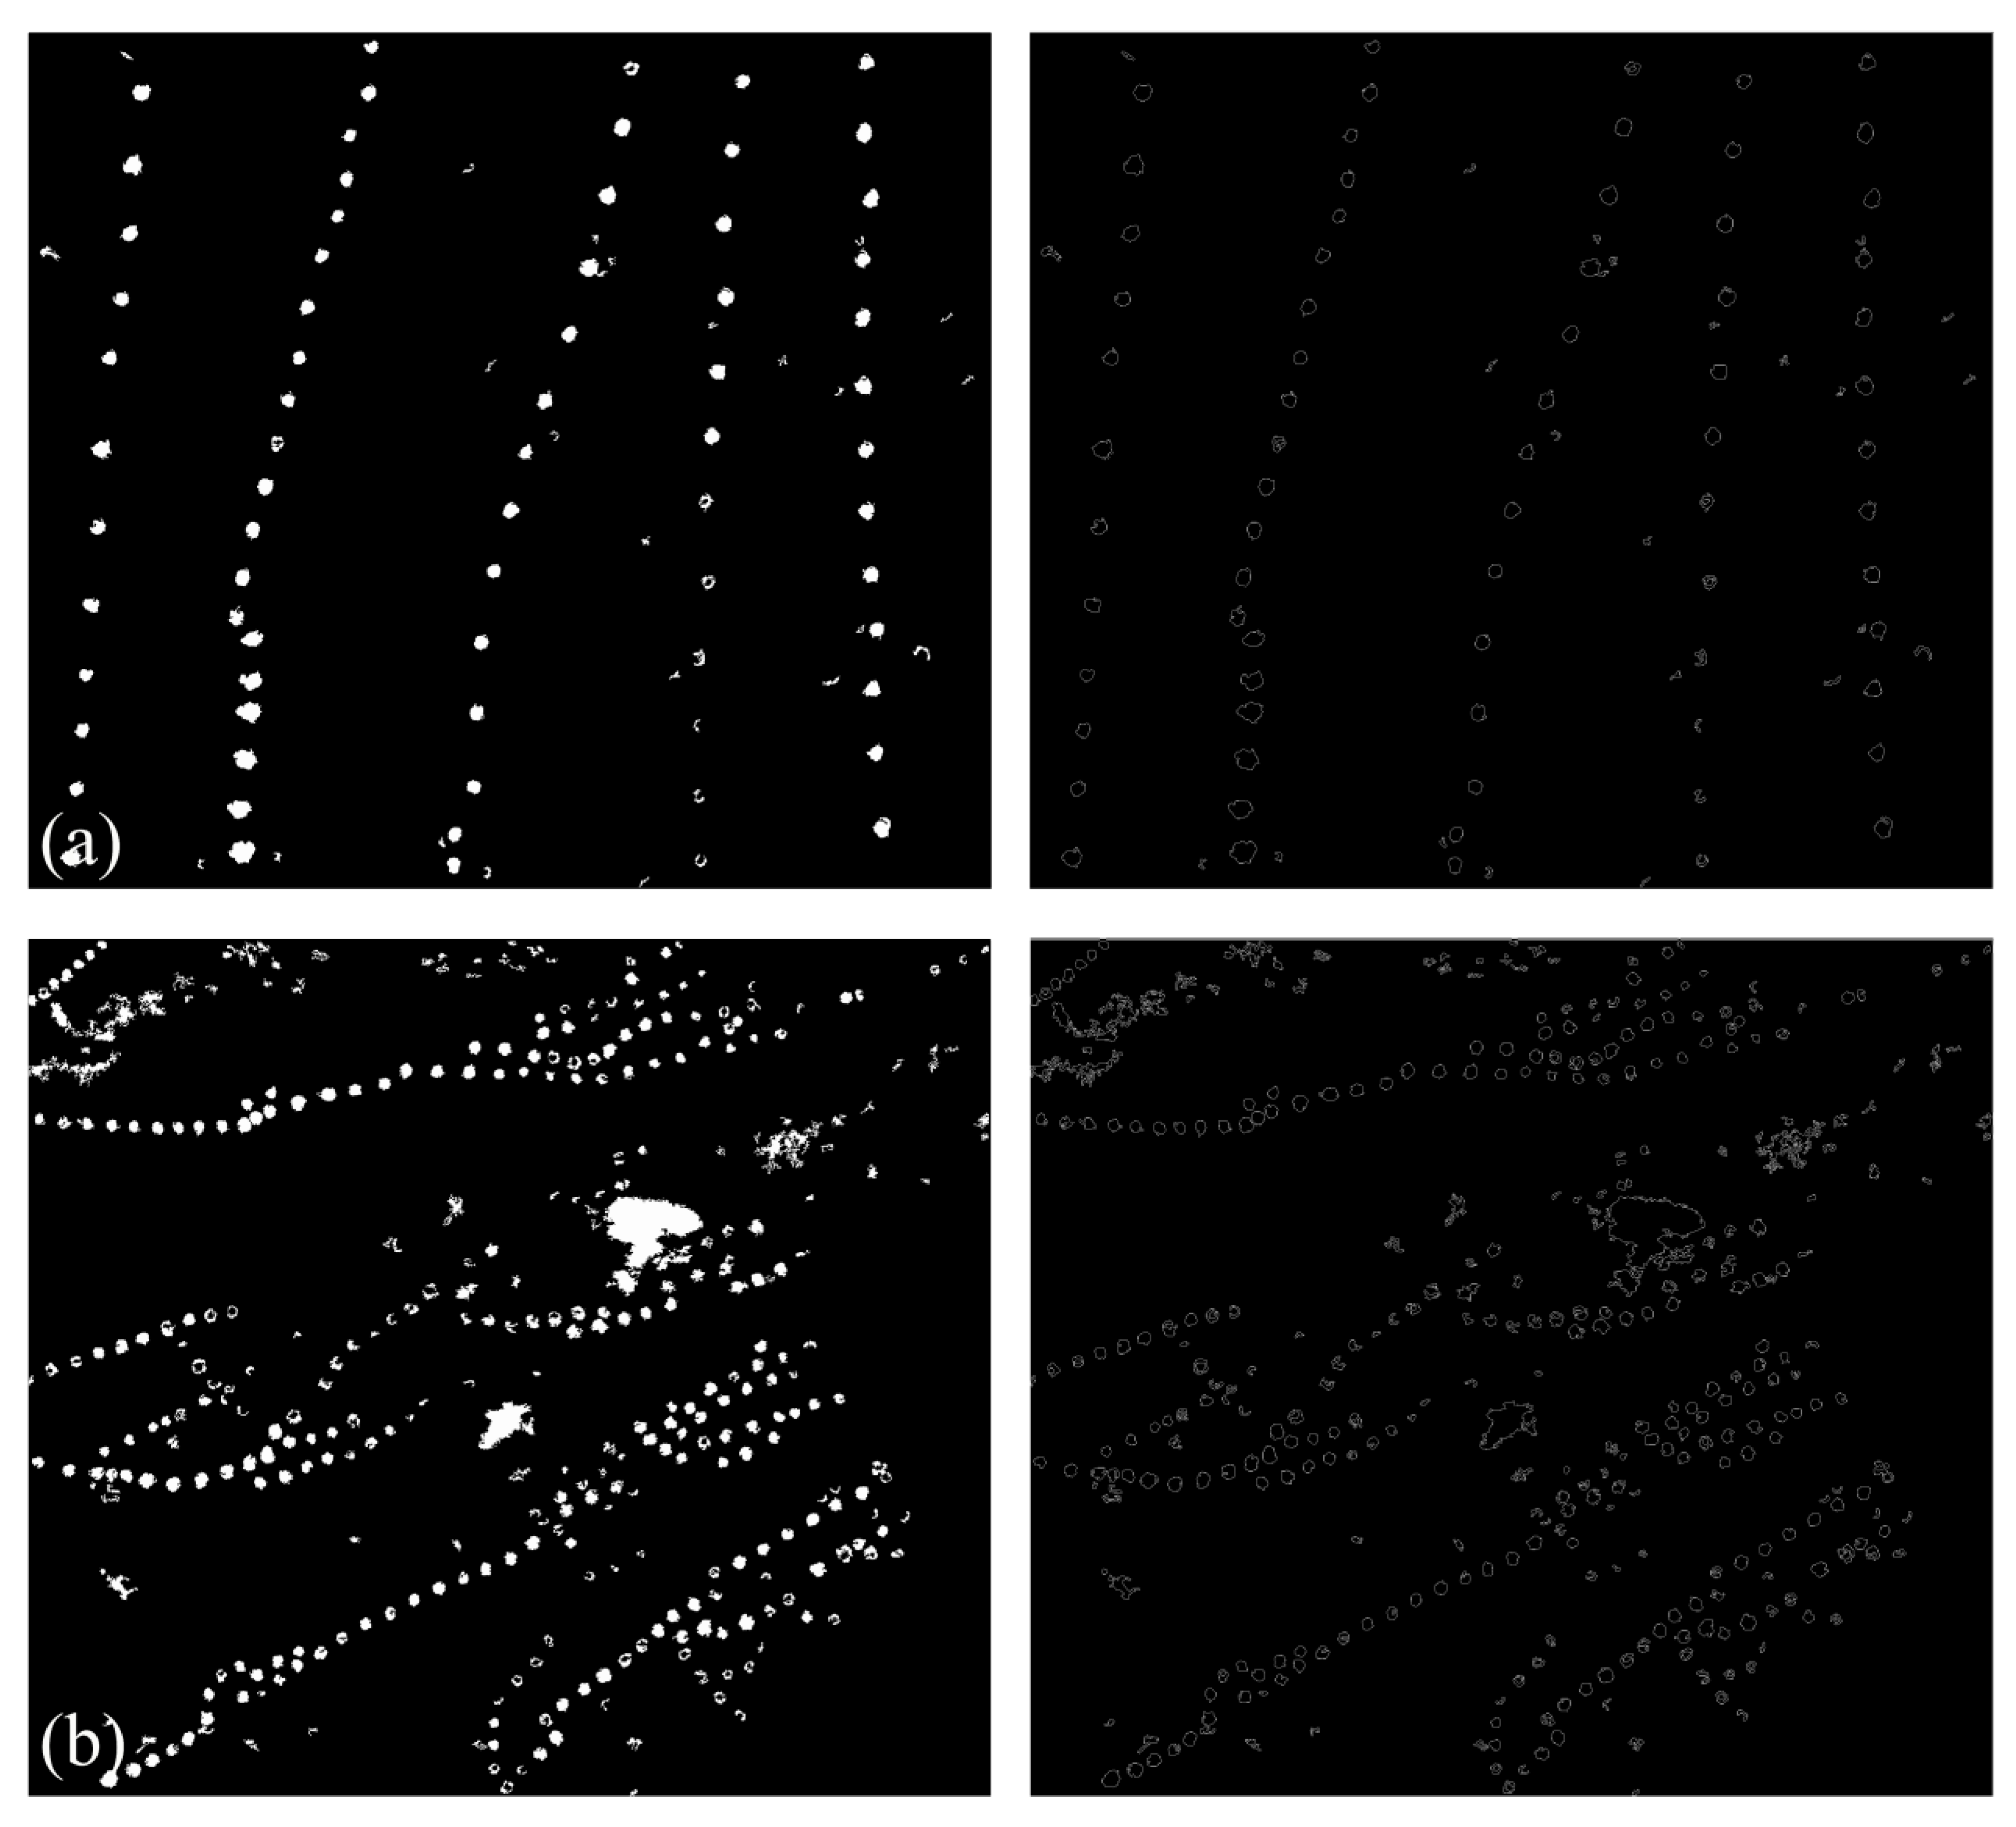
3.3. Mathematical Morphological Processing (MMP)

The derived binary images have many speckle-like patches due to background noise. Scattered distributed speckle-like patches disturb the delineation of the TQSs of interest. To obtain distinct images, mathematical morphological processing was done to the images. MMP involves operations based on set theory to extract features from an image. Two fundamental operations, erosion and dilation, are commonly employed to reduce (erode) or enlarge (dilate) the size of features in binary images [56,57]. The image is eroded at first and then dilation is performed. The idea behind MMP is to dilate an eroded image in order to recover as much of the eroded image as possible. It should not erode TQSs too much or enlarge the noise speckles too much.
Erosion is used to fill small holes and narrow gulfs in objects. Erosion of A by B is the set of all points z such that B, translated by z, is contained in A and represented by Equation (2). Dilation is an operation that ‘grows’ or ‘thickens’ objects in the binary images. Mathematically, dilation of A by B denoted as A B is defined as Equation (3). When the erosion is followed by dilation it is known as morphological opening, which is mathematically denoted by Equation (4):
A B = { z / ( B ) z A }
A B = { z / ( B ) z A Φ }
A B = ( A B ) B
where Φ is an empty set, B is the structuring element, and A is the object to be dilated.
The binary images were eroded using the vertical structuring element followed by the horizontal structuring element. After erosion of binary images, smoothening of the object was done in order to make the segmented object look natural. The binary images were smoothened by dilating the image twice using a disk structuring element. The object was smoothened by combining erosion with dilation to preserve the original size. The left panels in Figure 5 show the result of performing an opening operation using a disk structuring element. As the result demonstrates, an erosion operation removed speckle-like patches of sizes finer than the structuring element size whereas the dilation restored the shapes of large TQSs.
Comparing the morphological opening results with Google Earth VHR images indicates that MMP results have delineated most TQSs in the Google Earth VHR images. In the MMP process, speckle-like patches having high contrast in the binary image disappeared using a disk structuring element in the opening operation. The ability of an opening operation to preserve features larger than the structuring element size is very useful in archaeological applications. By using the MMP, the computational cost will decrease in the edge detection that follows.

3.4. Edge Detection: Canny Edge Detector (CED)

The edges in an image are formed where there are abrupt changes in the intensity of the pixels. There are different types of edge detectors that can be applied here [58,59]. The Canny edge detector [60] approach has a positive effect on noise and is highly sensitive to the edges. The CED is a very important tool for local preprocessing to locate changes in the intensity function with high signal to noise ratio. By using the Canny operator, the main criteria are the detection of all important edges, minimization of the distance between the actual and the located positions of the edges, and minimization of multiple responses to a single edge.
Based on the above three criteria, the CED first smoothed the image to eliminate noise with a Gaussian function of scale σ as given below in Equations (5) and (6). In the imagery, edge points were defined as points whose strengths were maximal in the direction of the gradient. Furthermore, the CED found the image gradient to highlight regions with high spatial derivatives. For each pixel, the direction n of the local edge for the CED was estimated by Equation (7). Thirdly, the CED tracked along these regions and suppressed any pixel that was not at the maximum (non-maximum suppression) with the help of Equation (8). Lastly, the gradient array was further reduced by hysteresis. Hysteresis is used to track along the remaining pixels that have not been suppressed. For thresholding, the magnitude of an edge was computed by Equation (9). Hysteresis uses two thresholds (T1 and T2, satisfying T1 < T2) and if the magnitude was below the first threshold, it was set to zero (made a non-edge). If the magnitude was above the high threshold, it was made an edge. If the magnitude was between the two thresholds, then it was set to zero unless there was a path from this pixel to a pixel with a gradient above the high threshold.
G ( x ,   σ ) = e ( x 2 / 2 σ 2 )
F ( x ,   σ ) = f ( x ) × G ( x ,   σ )
n = ( G × f ) | ( G × f ) |
2 n 2 G × f = 0
| G n × f | = | ( G × f ) |
where σ is the standard deviation and changes according to images. F (x, σ) represents a surface on the (x, σ) plane. G is a 2D Gaussian function and f is an image function.

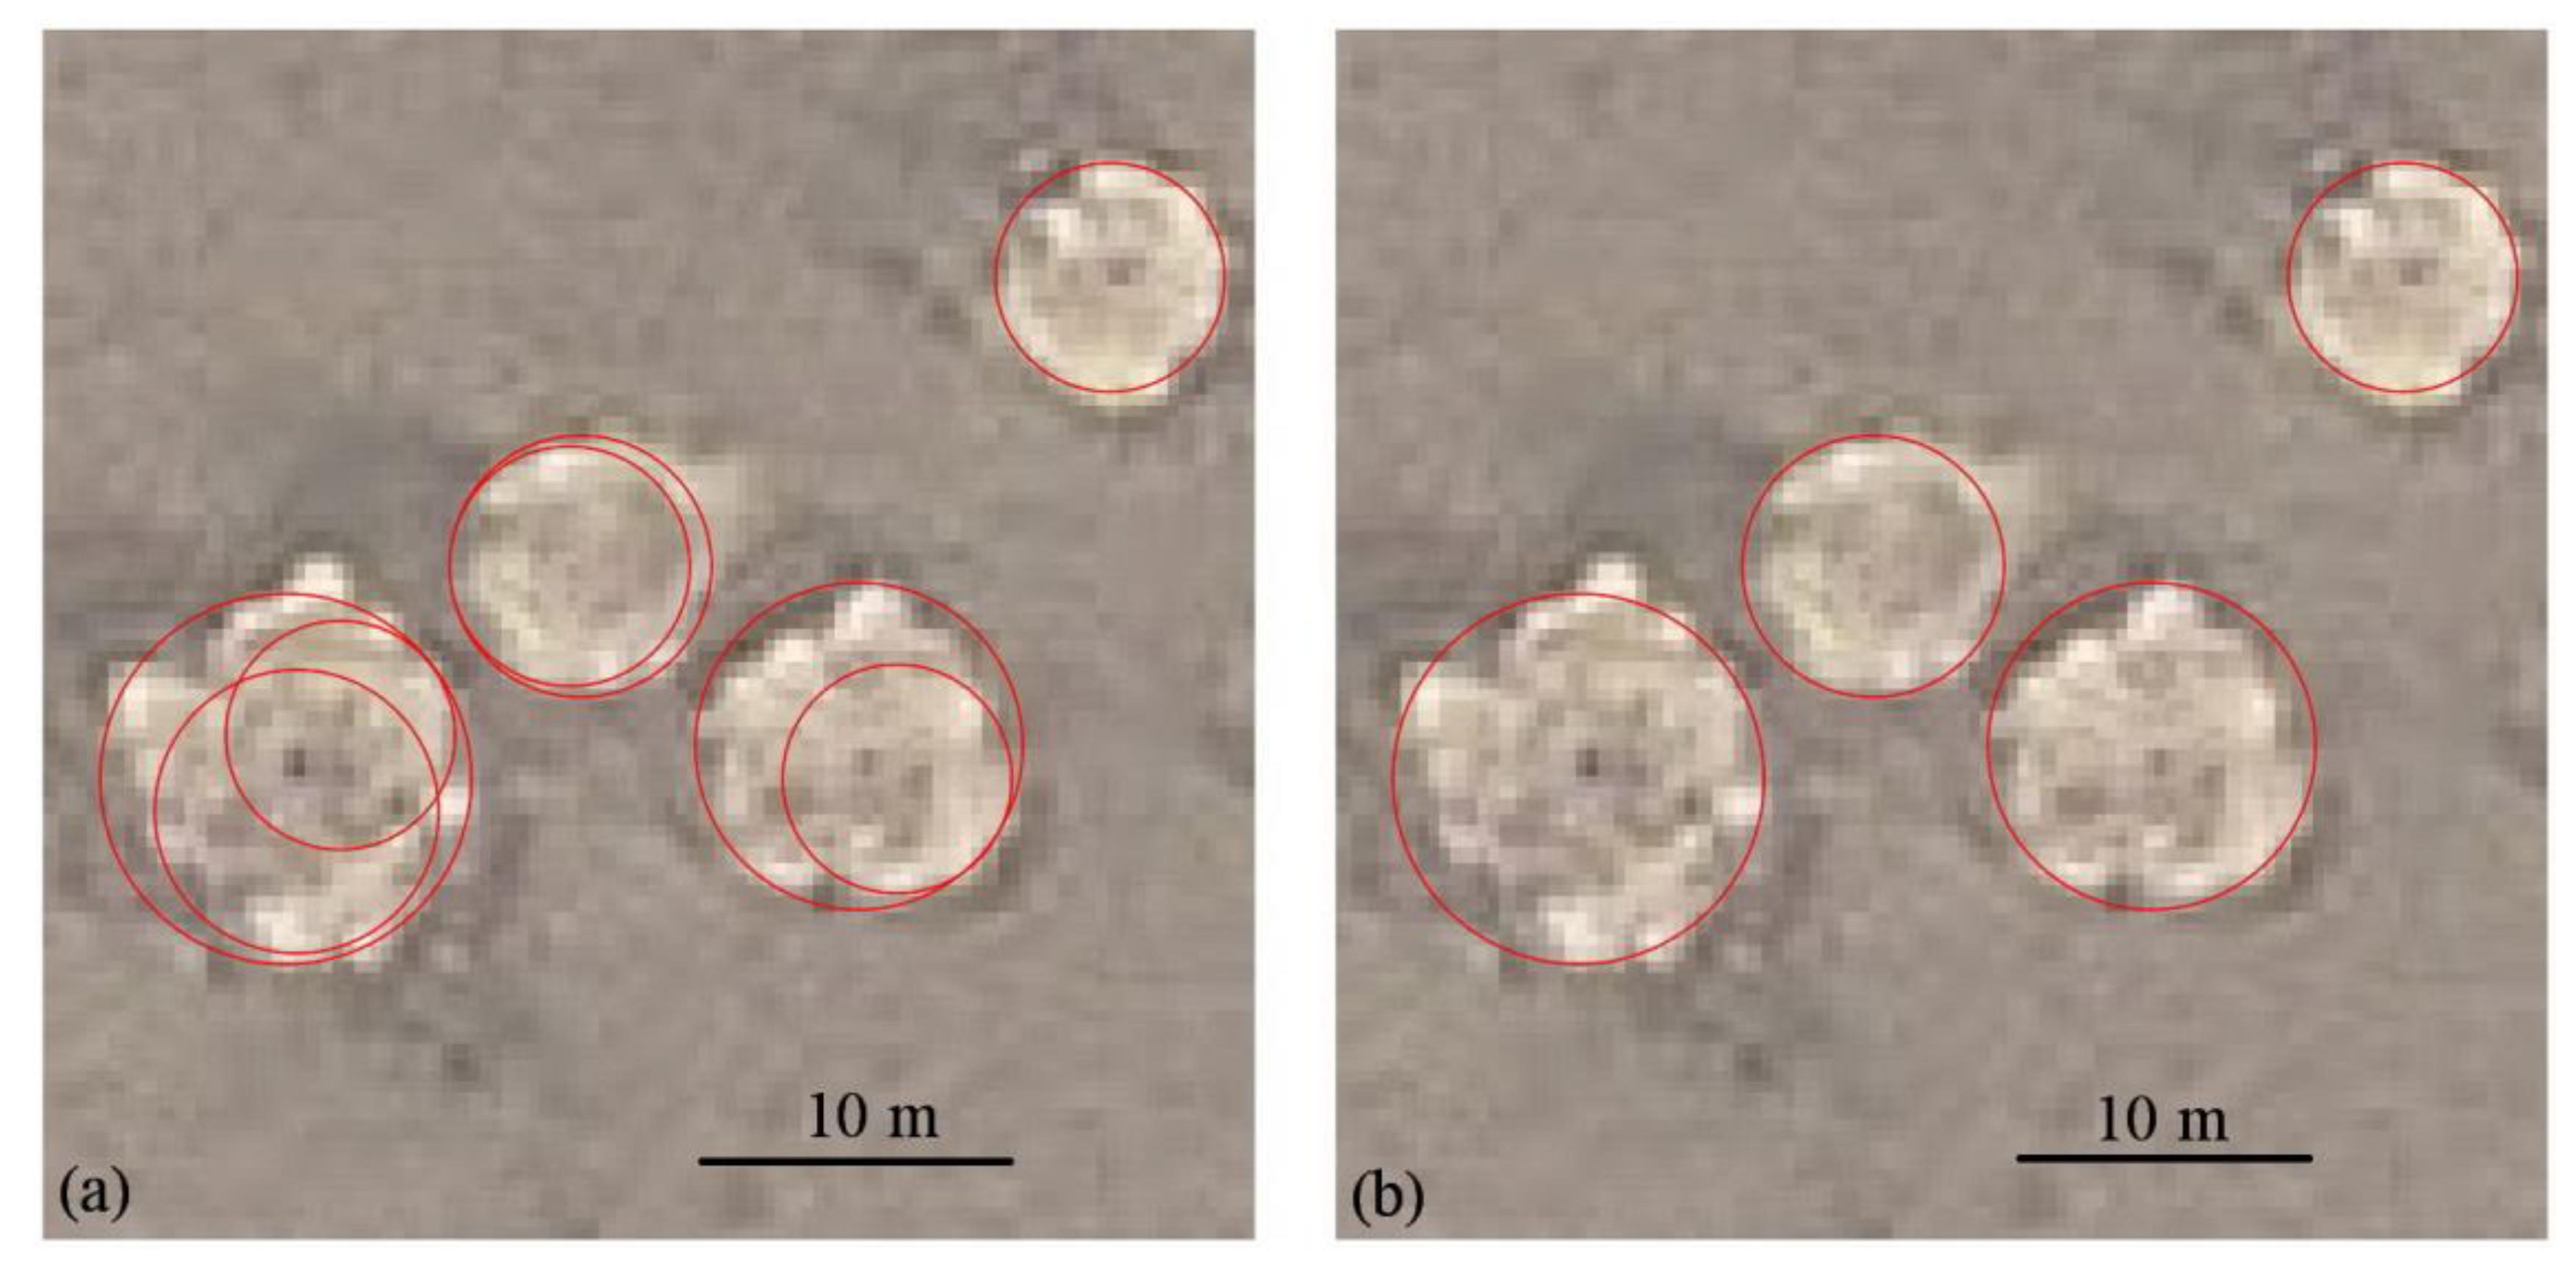
3.5. Circular Hough Transform (CHT)

Automated extraction of circular features has already attracted many researchers in digital image processing and computer vision. Most of them use the Hough transform [61], which is a template-based approach that transforms a binary edge map into multi-dimensional space that represents the parameters of specific shape (e.g., straight lines, circles and ellipses). The standard Hough transform is less sensitive to noise, shape disconnectedness, and occlusions, but has the disadvantage of massive requirements of computation and memory [21]. Some improved Hough transform-based methods have overcome the standard Hough transform’s deficiencies by combining edge orientation with it [62,63,64].
The Hough transform and several modified versions have been recognized as robust techniques for curve detection. The CHT, which was sketched by Duda and Hart [65], is a modified version of the Hough transform that aims to find circular patterns within an image. The CHT is used to transform a set of feature points in the image space into a set of accumulated votes in a parameter space. Then, for each feature point, votes are accumulated in an accumulator array for all parameter combinations. The array elements that contain the most votes indicate the presence of the shape. A circle pattern is described by Equation (10):
( x x 0 ) 2 + ( y y 0 ) 2 = r 2
where x0 and y0 are the coordinates of the center and r is the radius of the circle.
Figure 5. Left panels show the results of MMP. Right panels show the results of CED. (a) Test site 1; (b) Test site 2.
Remotesensing 06 11956 g005
The black circles indicate a set of edge points within the image. Each edge point contributes a circle of radius r to an output accumulator space indicated by the gray circles. The output accumulator space has a peak where these contributed circles overlap at the center of the original circle. The CHT for this work was improved by adding the new edge detection method integrating the Canny operator and morphological processing of thinning and connection. It relies on a specially developed interpolation method suitable for extraction of TQSs.
The TQSs coming in irregular round shapes and many sizes posed a difficult problem where several accumulated points were voted corresponding to a TQS. Three parameters, ρ, ΔC, and ΔR, were used to overcome this difficulty. Based on the edge detections, we calculated the centers (accumulated point) of the TQSs by CHT. If the ρ was more than the threshold T that was set before transformation, the circular form created with edge lines was regarded as a TQS candidate. The ρ was defined as Equation (11):
ρ = N / λ C
where N is the number of votes, C is the perimeter of the fitting circle, and λ is a constant used to offset the effect of ambiguous edges (the default was 0.9, due to digitization, the number of detectable edge pixels is about 90% of the calculated perimeter.). We sorted ρ in descending order.
In the next step, we removed the false extractions by using two parameters: ΔC and ΔR. The two parameters are explained as Equation (12):
Δ C = | x 1 x 2 | + | y 1 y 2 | ,   Δ R = | r 1 r 2 |
where (x1, y1, r1) and (x2, y2, r2) are coordinates of two circles. The defaults of ΔC and ΔR were 4 pixels and 8 pixels. If the values of the ΔC and ΔR were less than 4 and 8, then one of the candidate circles with a lower value of ρ was removed. Part of Site 2 in Google Earth VHR imagery was used as an example (Figure 6).
Figure 6. False extractions removed in the test image from the red box in Figure 4b. (a) Preliminary extractions of TQSs. (b) Revised extractions with,   ρ , ΔC, and ΔR. Red circles indicate the TQSs (T = 0.33).
Remotesensing 06 11956 g006

4. Results and Discussion

4.1. Results

In this section, the results of our proposed approach analyzing Google Earth VHR images at two sites are shown. According to the fieldwork, the diameter of the TQSs ranged from 7 to 17 m in the test sites. With consideration of the spatial resolution of Google Earth VHR images, we set the extracted sizes from 5 to 20 m in diameter. Figure 7 shows the results of automatic TQS extraction. The Google Earth VHR images of the test sites were displayed with extracted TQSs in different colors. It is shown that TQSs were extracted well in both Site 1 and Site 2. We used Google Earth VHR images instead of the edge maps to display the results, as small TQSs are more readily visible in an image than in edge maps.
According to the GPS-supported ground-truthing survey data, there remained 74 and 349 TQSs in Site 1 and Site 2, respectively, and our proposed extraction method identified 71 and 291 TQSs in Site 1 and Site 2, respectively (Figure 7). Based on GPS points, TQSs were manually extracted from Google Earth VHR images by using the editor tool in ArcGIS10.1. As far as numbers of extracted TQSs, automated extraction results were almost the same as the manual extractions. The remaining 61 TQSs should have been detected but were not because they had ambiguous boundaries after the edge detection, especially in Site 2.
The red circles denote TQSs that our approach extracted and that are present in the manual identifications catalog; there are 423 such TQSs altogether. Thus, we have detected 85.6% of all TQSs in the manual identifications catalog. The blue circles denote TQSs in the manual identifications catalog that our method failed to extract—61 in total. The 17 green circles denote false positives, or features identified as TQSs that are not. They are mostly small features located on the rims of large TQSs.
Figure 7. Extracted results of TQSs by the proposed automated approach. (a) Test site 1. (b) Test site 2. Red circles are extracted TQSs that are also present in the manual ground-truthing catalog, blue are missed TQSs, and green are false extractions.
Remotesensing 06 11956 g007

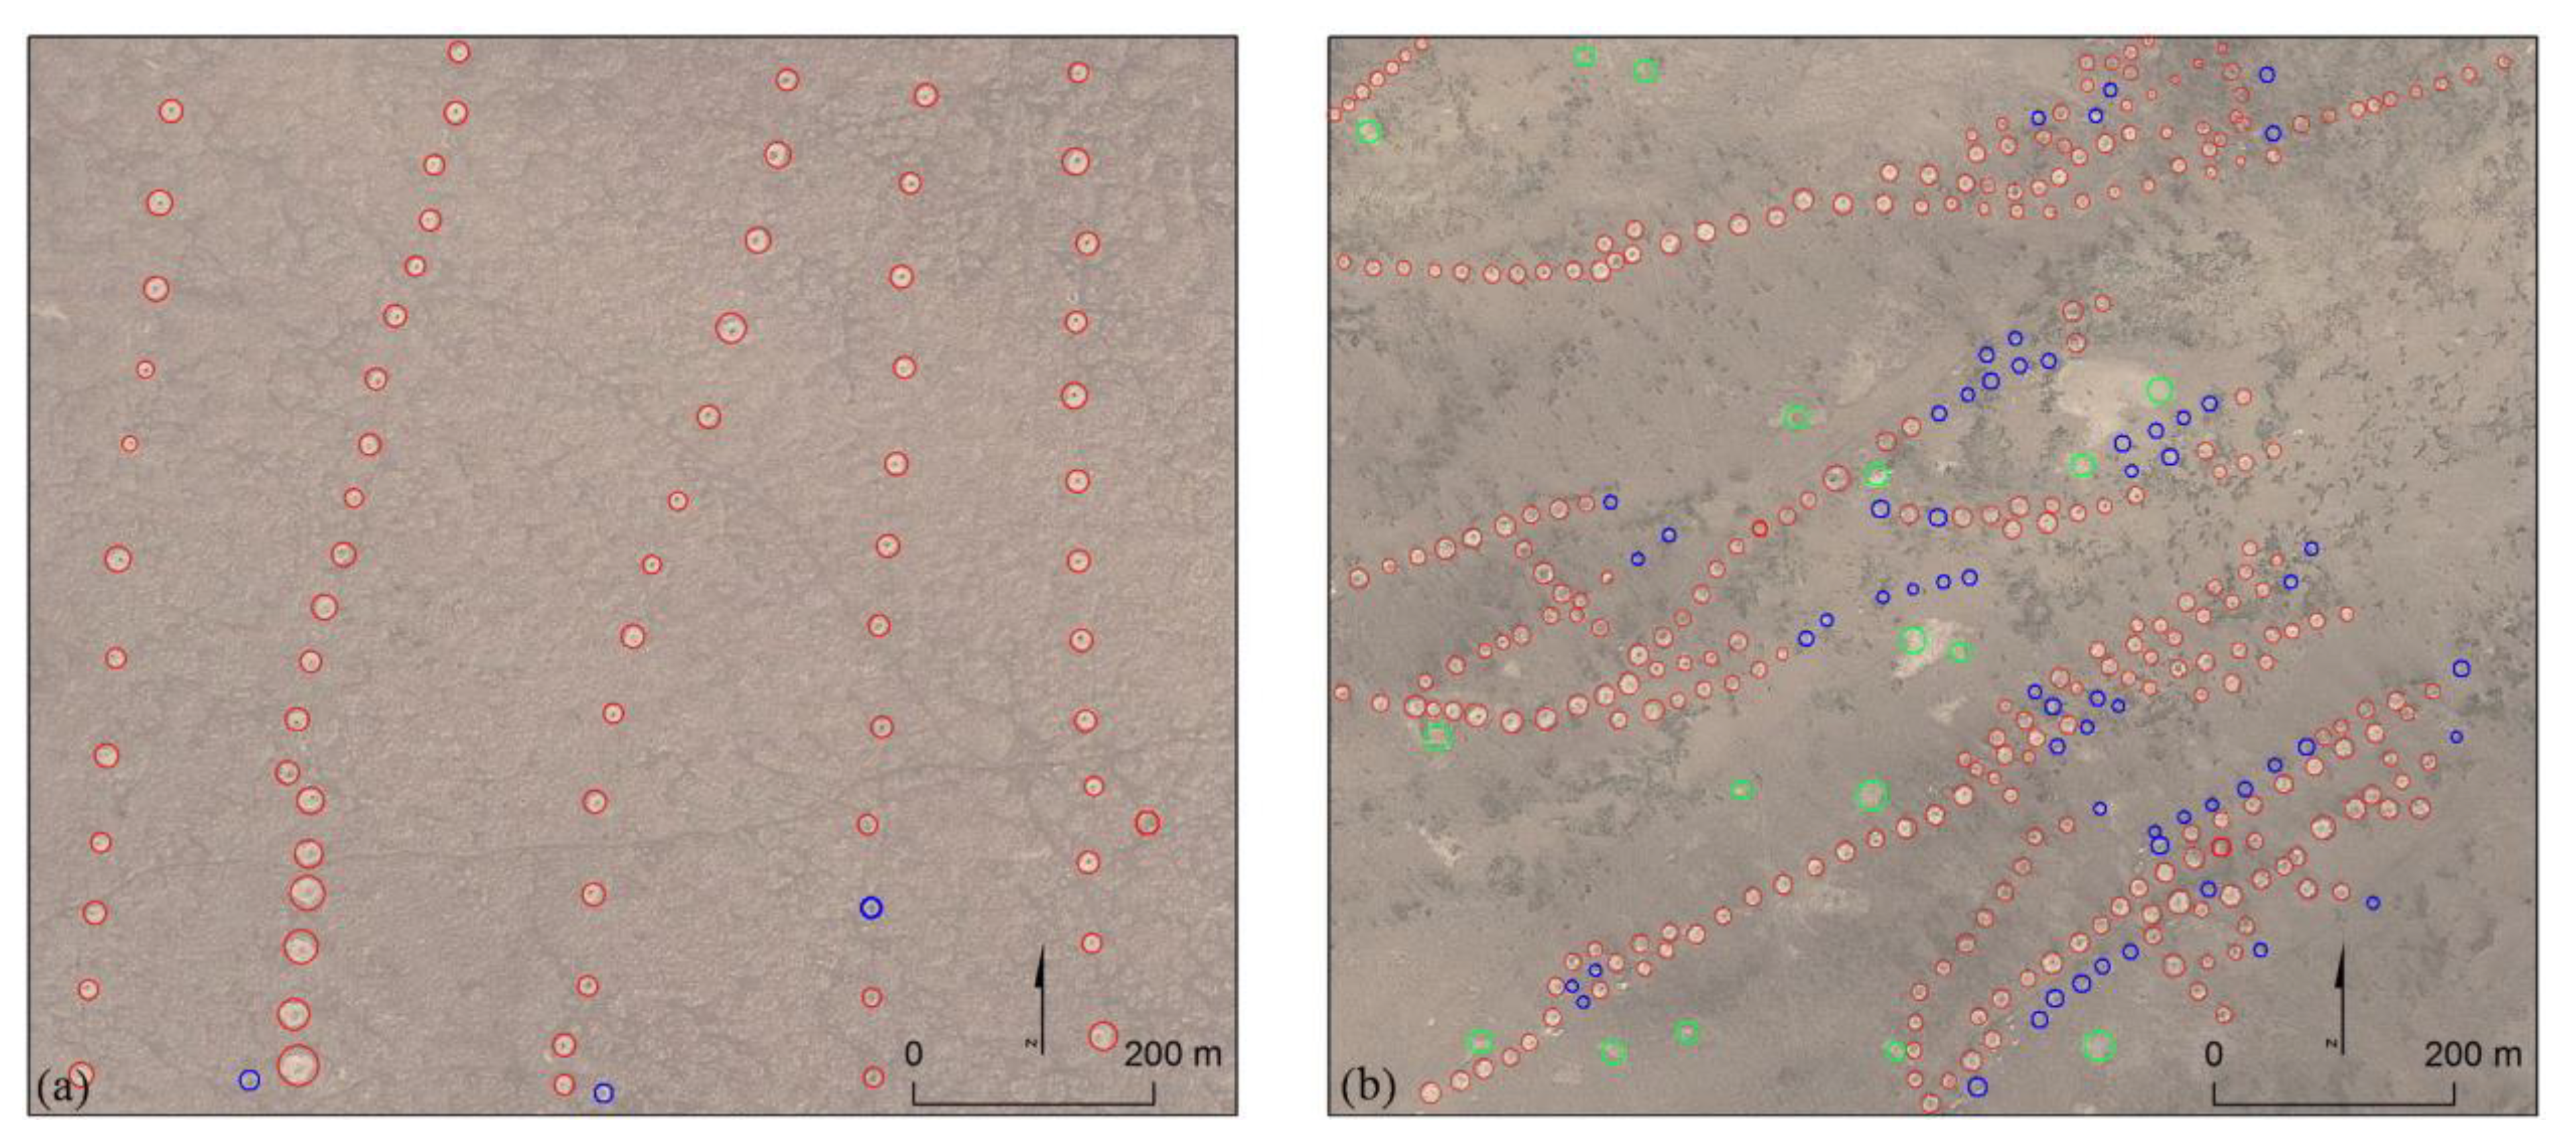
4.2. Quality Assessment

In order to compare different extraction methods, it is important to use standard quantitative quality assessment factors. We used factors developed in [66]: extraction percentage, E = 100TE/(TE + ME); branching factor, B = FE/TE; and quality percentage, Q = 100TE/(TE + FE + ME). Here, TE stands for the number of true positive extractions (extracted TQSs that are actual TQSs), FE stands for the number of false positive extractions (extracted TQSs that are not actual TQSs), and ME stands for the number of missing TQSs. E can be treated as a measure of TQS extraction performance, B as a measure of delineation performance, and Q as an overall measure of method performance. Calculation of these factors requires the existence of a ground-truthing reference catalog. In our case, there is no such reference catalog, so we assume that the manual ground-truthing identifications (423 TQSs together) constitute the ground-truthing (GT in Table 1 and Table 2) catalog. Our proposed extraction method has identified 362 TQSs.
By drawing a comparison to the standard CHT, the performance of our proposed method was evaluated. The factors for the proposed method are: E = 95.9%, B = 0, and Q = 95.9% in Site 1; and E = 83.4%, B = 0.058, and Q =79.5% in Site 2 (Table 1). The factors for the standard CHT are: E = 93.2%, B = 0.087, and Q = 86.3% in Site 1, and E = 75.9%, B = 0.204, and Q = 65.8% in Site 2. These factors, especially the quality of percentage Q, indicate that extraction performance of our proposed method is better than the performance of the standard CHT.
Both our proposed method and the standard CHT indicate very impressive performance in Site 1. However, the image was chosen not to include heavily collapsed and degraded TQSs. This explains the high value of E. The standard CHT has six false extractions compared to our proposed method with no false extraction. Our proposed method decreases the false extractions with a quality percentage Q higher than the standard CHT.
It is easy to notice that the results of Site 2 point to significantly worse performance from the standard CHT in comparison to our proposed method, especially considering the large number of false extractions. This explains the high value of B and the low value of E. The standard CHT has 54 false extractions compared to our proposed method with 17 false extractions. Due to many collapsed and degraded TQSs in Site 2, both our proposed method and the standard CHT missed a number of TQSs. The results of Site 2 indicate that the performance of the standard CHT, with a low value of Q and a high value of B, is not better than our method.
Table 1. Standard quantitative quality assessment of automated TQS extraction methods.
MethodsGTTEFEMEE/%BQ/%
Site 1Our proposed method74710395.9095.9
Standard CHT74696593.20.08786.3
Site 2Our proposed method349291175883.40.05879.5
Standard CHT349265548475.90.20465.8
The shortcoming of our proposed method is non-extraction of collapsed and degraded TQSs. These problems are encountered by all archaeological trace extraction approaches. The next-step in future research is to extract the collapsed and degraded TQSs using Radar and Lidar techniques, which offer a view of subsurface conditions and the high precision DEMs. A few TQSs identified by visual interpretation in the Google Earth VHR images were not extracted in the test sites’ images. This was caused by a failure to recognize edge pixels at the edge detection step in gray level images. Extracting degraded TQSs from optical satellite images still remains a challenging task. On the one hand, TQSs have ambiguous edge arcs or unclear changes in gray scale that could not be recognized by the automated approach but were extracted manually. On the other hand, vast TQSs are very small and difficult to identify manually, but detectable with the automated approach. In other words, the proposed approach is more suitable for small, numerous TQSs than manual extraction.

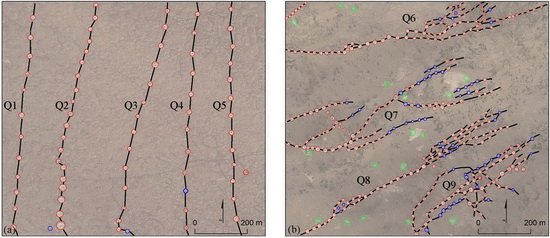
4.3. Mapping the Qanats
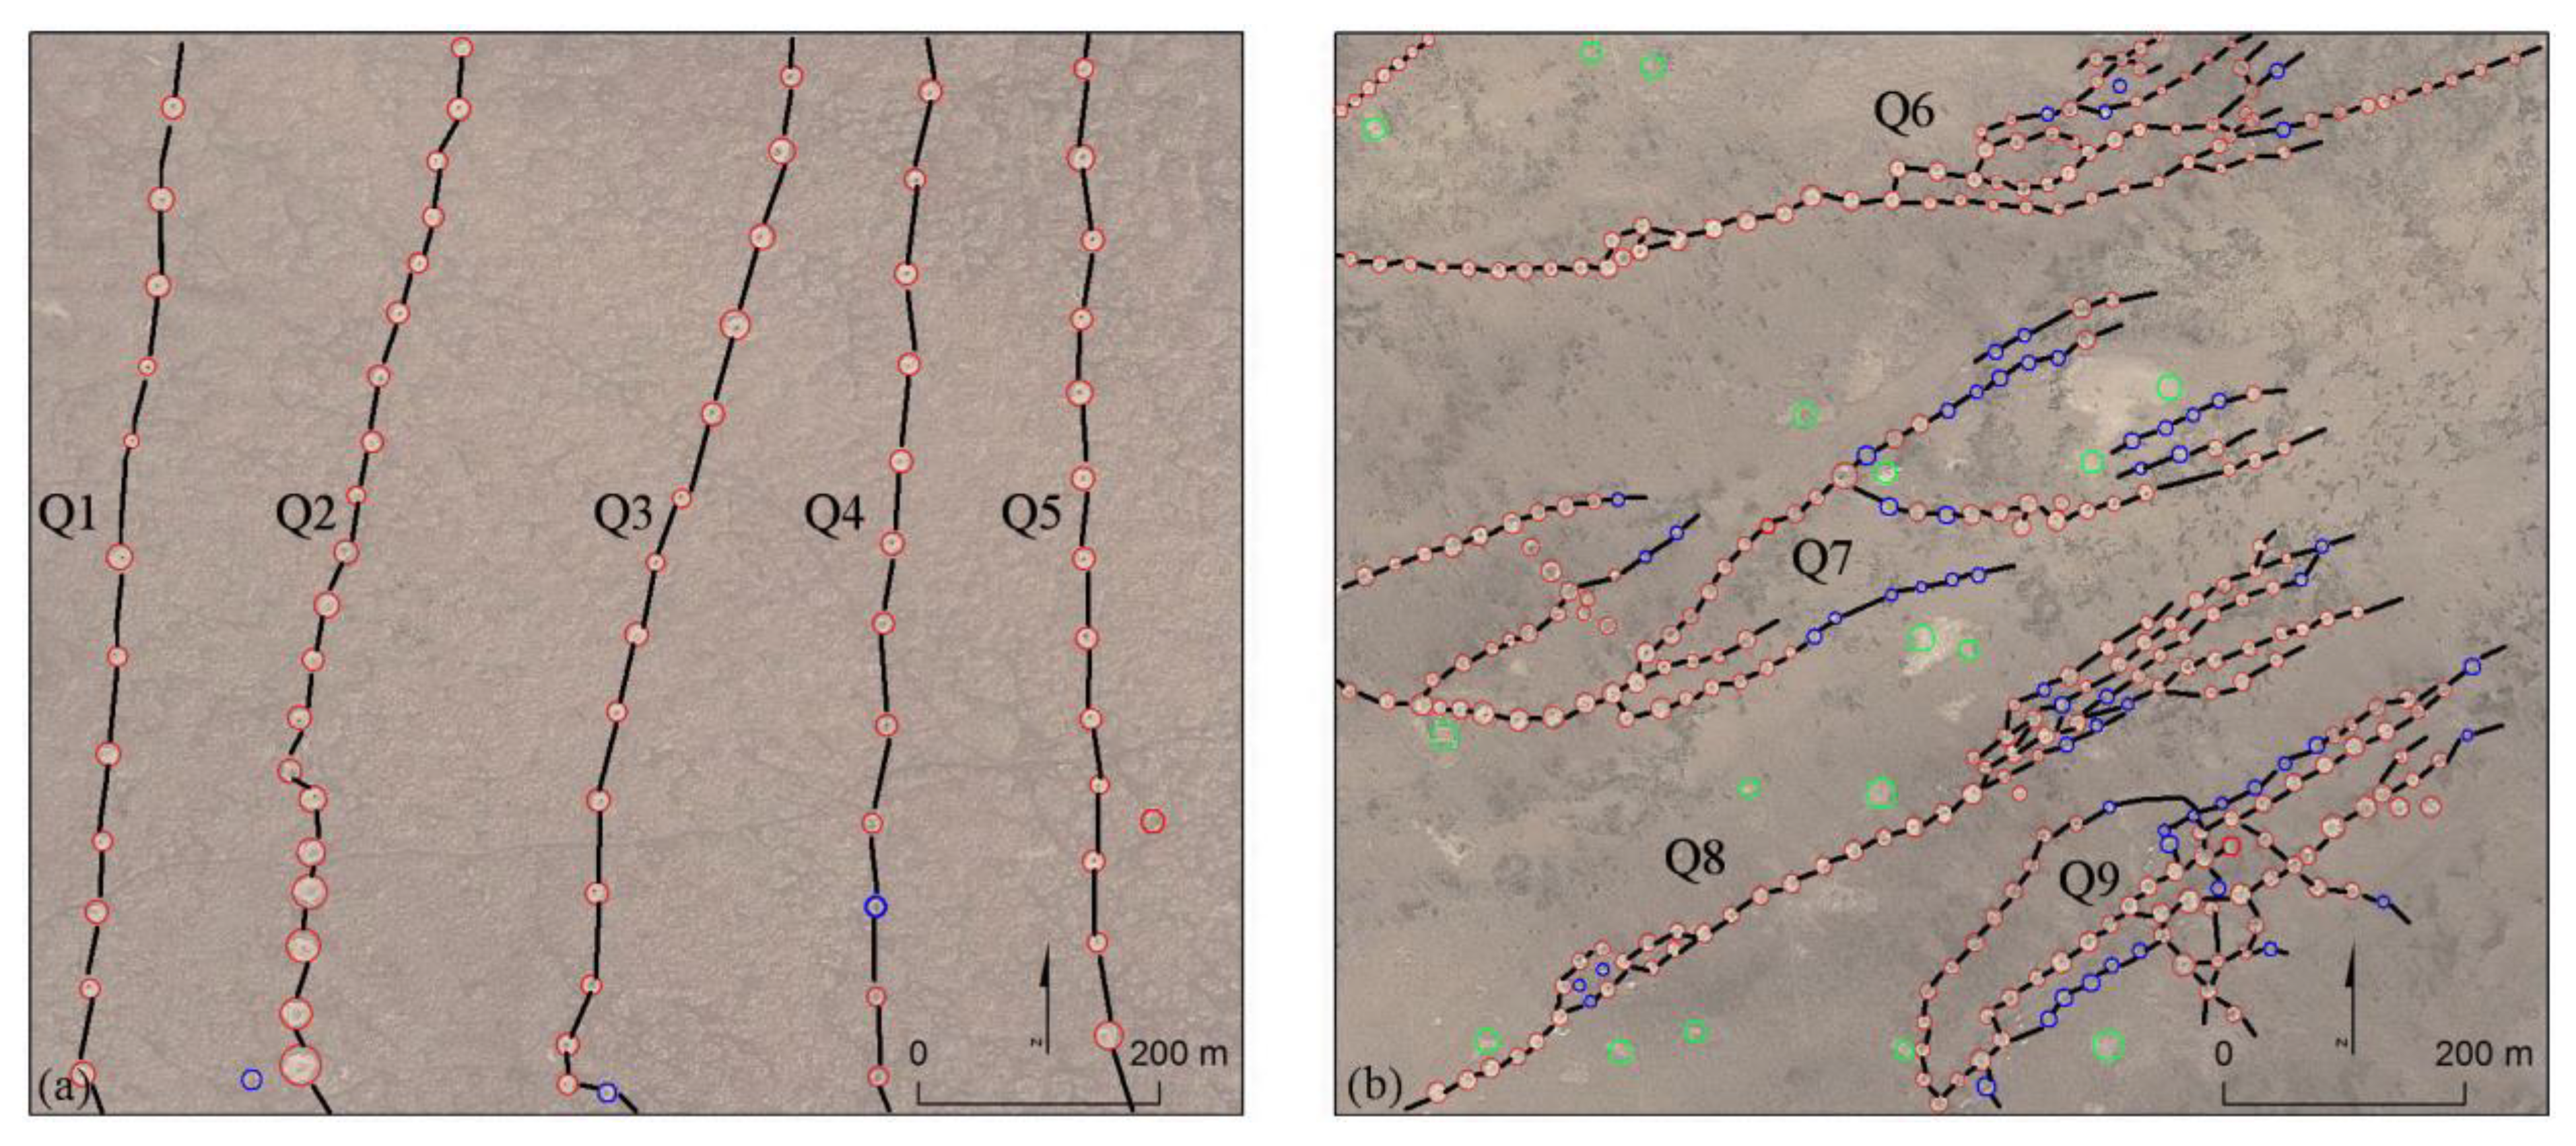
Most of the qanat systems in the Turpan Basin are relatively old though some are of recent origin. Since many qanats have become dry or are in the process of becoming dry, new, deeper qanats are being built and old ones are extended upwards towards the mountains. In general, the distance between the vertical shafts may be 10–20 m in the lower reaches of a qanat, and in the upper part it can be 30–70 m [51].
There are five north-south directional qanats (black dotted lines) in Site 1 based on the automated extractions (see Figure 8a). Qanats from left to right are named: Qanat-1 (Q1), Qanat-2 (Q2), Qanat-3 (Q3), Qanat-4 (Q4), and Qanat-5 (Q5). There are four west-east directional qanats (black dotted lines) in Site 2 based on the automated extractions (see Figure 8b). Qanats from top to bottom are named: Qanat-6 (Q6), Qanat-7 (Q7), Qanat-8 (Q8), and Qanat-9 (Q9). The number of TQSs and average distances between two adjacent TQSs in every qanat are listed in Table 2.
Figure 8. Mapping qanats based on automatic extractions and manual identifications. (a) Test site 1. (b) Test site 2. Black dotted lines indicate the qanats.
Remotesensing 06 11956 g008
The distances between two adjacent TQSs ranged from 42 m to 58 m in Qanat-1, and the average distance was 54 m. In Qanat-2, the distances between two adjacent TQSs ranged from 20 m to 35 m, and the average distance was 33 m. In Qanat-3, the distances between two adjacent TQSs ranged from 24 m to 57 m, and the average distance was 50 m. The distances between two adjacent TQSs in Qanat-4 ranged from 49 m to 61 m, and the average distance was 54 m. In Qanat-5, the distances between two adjacent TQSs ranged from 41 m to 56 m, and the average distance was 50 m. The intervals of adjacent qanats ranged from 87 m to 200 m.
Table 2. TQSs statistics for qanats.
QanatNumber of TQSsAverage Distances between Two Adjacent TQSSNormalized Number of TQSsNormalized Average Distance
Site 1Q112540.001.000
Q221331.000.000
Q315500.3330.810
Q412540.001.000
Q514500.2220.810
Site 2Q690170.6090.000
Q799201.0001.000
Q876190.0000.667
Q984180.3480.333
The distances between two adjacent TQSs ranged from 10 m to 24 m in Qanat-6, and the average distance was 17 m. The distances between two adjacent TQSs in Qanat-7 ranged from 10 m to 29 m, and the average distance was 20 m. In Qanat-8, the distances between two adjacent TQSs ranged from 13 m to 20 m, and the average distance was 19 m. In Qanat-9, the distances between two adjacent TQSs ranged from 12 m to 22 m, and the average distance was 18 m. The intervals of adjacent qanats, measured by the main courses, ranged from 105 m to 300 m.
Based on the above average distances between two adjacent TQSs in Table 2, this paper proposes that the TQSs in Site 1 are located in the upper reaches of the qanat system, while the TQSs in Site 2 are located in the lower reaches. Figure 8a shows qanats are continuous in Site 1, but the qanats are nonconsecutive in Site 2 (Figure 8b). Regarding structure, qanats in Site 1 are simple canal systems with no branches, but all qanats in Site 2 are radial canal systems with several branches. The radial canals indicate Site 2 needed more irrigation than Site 1 did in ancient times. Because many TQSs in Site 2 have disappeared from wind erosion, desertification, and degradation, we still could not map the complete qanat system based on both the automatic extractions and manual identifications.

5. Conclusions

The qanat system is one of the most significant water conservancy projects in arid areas and has been researched widely not only because it offers us valuable information on climate change and hydrology, but also because it is regarded as rare and irreproducible agricultural and cultural heritage. This paper proposes an automatic method to support the extraction of archaeological traces of TQSs from Google Earth in the Turpan Basin of Xinjiang in northwestern China.
The proposed method was applied to search for circular TQSs. In general, the TQSs appeared as circular archaeological traces with poor contrast in VHR satellite imagery. We proposed a new method consisting of a combination of MMP, CED, and CHT analysis. Experimental results on Google Earth VHR images showed that the method performed well in TQS extraction despite the degraded state of the features in the region. The overall performance for Google Earth VHR images increased to 95.9% and 79.5% from 86.3% and 65.8% in test Sites 1 and 2, respectively, which indicates a very impressive advancement. The proposed method can be generalized and applied to extract other circular archaeological traces such as crop marks and soil marks in other geographic locations.
Future work will be designed in conjunction with edge orientation information to improve the accuracy of the automated method. The scattered qanats in the whole area of the Turpan Basin will be detected automatically, and spatial characteristics of these qanats will be analyzed using integrated GIS tools and field investigation in the following work. In particular, knowing the spatial distribution of qanats across the region informs cognition on water resource distribution and utilization that is implicated in the evolution of ancient oasis irrigated agriculture.
The Turpan qanat system is considered one of the three great construction projects in ancient China, along with the Great Wall and the Grand Canal. We think that our proposed method will be helpful for locating potential agricultural and cultural heritage sites of qanats. Although it misses some true TQSs, the method will relieve the operators from time-consuming manual inspection of entire images.

Acknowledgments

This work was supported by the National Natural Science Foundation of China (No. 41271427), the National Key Technology R&D Program Grant (Grant No. 2012BAH27B05), the Directorial Foundation for Doctoral Student Research from Institute of Remote Sensing and Digital Earth (RADI), as well as by several grants from State Administration of Cultural Heritage. It is part of a Ph.D. program in integrated space information technologies and geophysical methods applied to archaeology on the Silk Road carried out by the first author. Many thanks are given to the Google Earth for providing the VHR remote sensing data that were used in this manuscript. Also appreciated was researcher Cai Heng’s assistance during paper writing and the technical assistance of Zou Lei from Louisiana State University.

Author Contributions

Lei Luo drafted the manuscript and was responsible for the research design, experiment and analysis. Xinyuan Wang reviewed the manuscript and was responsible for the research design and analysis. Huadong Guo and Chuansheng Liu supported the data preparation and the interpretation of the results. Jie Liu, Li Li, Xiaocui Du and Guoquan Qian provided some of the data and gave relevant technical support. All of the authors contributed to editing and reviewing the manuscript.

Conflicts of Interest

The authors declare no conflict of interest.

References

  1. Wilson, D.R. Air Photo Interpretation for Archaeologists; St. Martin’s Press: New York, NY, USA, 2012. [Google Scholar]
  2. Lasaponara, R.; Masini, N. Remote sensing in archaeology: From visual data interpretation to digital data manipulation. In Satellite Remote Sensing: A New Tool for Archaeology; Springer: New York, NY, USA, 2012; pp. 3–16. [Google Scholar]
  3. Beazeley, G.A. Air photography in archaeology. Geogr. J. 1919, 53, 330–335. [Google Scholar] [CrossRef]
  4. Musson, C.; Driver, T.; Pert, T. Air photo applications in Wales, UK. Exploration, landscape analysis, conservation and public presentation. In Proceedings of the 2nd International Conference on Remote Sensing in Archaeology, Rome, Italy, 4–7 December, 2006.
  5. McCauley, J.F.; Schaber, G.G.; Breed, C.S.; Grolier, M.J.; Haynes, C.V.; Issawi, B.; Elachi, C.; Blom, R. Subsurface valleys and geoarchaeology of the eastern Sahara revealed by shuttle radar. Science 1982, 218, 1004–1020. [Google Scholar] [CrossRef] [PubMed]
  6. Moore, E.; Freeman, T.; Hensley, S. Spaceborne and airborne radar at Angkor: Introducing new technology to the ancient site. In Remote Sensing in Archaeology; Wiseman, J., El-Baz, F., Eds.; Springer: New York, NY, USA, 2007; pp. 185–216. [Google Scholar]
  7. Stewarta, C.; Lasaponara, R.; Schiavona, G. Multi-frequency, polarimetric SAR analysis for archaeological prospection. Int. J. Appl. Earth Obs. 2014, 28, 211–219. [Google Scholar] [CrossRef]
  8. Chase, A.F.; Chase, D.Z.; Fisher, C.T.; Leisz, S.J.; Weishampel, J.F. Geospatial revolution and remote sensing LiDAR in Mesoamerican archaeology. PNAS 2012, 109, 12916–12921. [Google Scholar] [CrossRef] [PubMed]
  9. Johnson, K.M.; Ouimet, W.B. Rediscovering the lost archaeological landscape of southern New England using airborne light detection and ranging (LiDAR). J. Archaeol. Sci. 2014, 43, 9–20. [Google Scholar] [CrossRef]
  10. Aqdus, S.A.; Hanson, W.S.; Drummond, J. The potential of hyperspectral and multi-spectral imagery to enhance archaeological cropmark detection: A comparative study. J. Archaeol. Sci. 2012, 39, 1915–1924. [Google Scholar] [CrossRef]
  11. Atzberger, C.; Wess, M.; Doneus, M.; Verhoeven, G. ARCTIS—A MATLAB® toolbox for archaeological imaging spectroscopy. Remote Sens. 2014, 6, 8617–8638. [Google Scholar] [CrossRef] [Green Version]
  12. Cavalli, R.M.; Colosi, F.; Palombo, A.; Pignatti, S.; Poscolieri, M. Remote hyperspectral imagery as a support to archaeological prospection. J. Cult. Herit. 2007, 8, 272–283. [Google Scholar] [CrossRef]
  13. Challis, K.; Kincey, M.; Howard, A.J. Airborne remote sensing of valley floor geoarchaeology using Daedalus ATM and CASI. Archaeol. Prospect. 2009, 16, 17–33. [Google Scholar] [CrossRef]
  14. De Laet, V.; Paulissen, E.; Waelkens, M. Methods for the extraction of archaeological features from very high-resolution Ikonos-2 remote sensing imagery, Hisar (southwest Turkey). J. Archaeol. Sci. 2007, 34, 830–841. [Google Scholar] [CrossRef]
  15. Lasaponara, R.; Masini, N. Detection of archaeological crop marks by using satellite QuickBird multispectral imagery. J. Archaeol. Sci. 2007, 34, 214–221. [Google Scholar] [CrossRef]
  16. De Laet, V.; Paulissen, E.; Meuleman, K.; Waelkens, M. Effects of image characteristics on the identification and extraction of archaeological features from Ikonos-2 and Quickbird-2 imagery: Case study Sagalassos (southwest Turkey). Int. J. Remote Sens. 2009, 30, 5655–5668. [Google Scholar] [CrossRef]
  17. Lasaponara, R.; Masini, N. Pattern recognition and classification using VHR data for archaeological research. In Satellite Remote Sensing: A New Tool for Archaeology; Springer: New York, NY, USA, 2012; pp. 65–85. [Google Scholar]
  18. Noviello, M.; Ciminale, M.; Pasquale, V.D. Combined application of pansharpening and enhancement methods to improve archaeological cropmark visibility and identification in QuickBird imagery: Two case studies from Apulia, Southern Italy. J. Archaeol. Sci. 2013, 40, 3604–3613. [Google Scholar] [CrossRef]
  19. Lasaponara, R.; Masini, N. Beyond modern landscape features: New insights in the archaeological area of Tiwanaku in Bolivia from satellite data. Int. J. Appl. Earth Obs. Geoinf. 2014, 26, 464–471. [Google Scholar] [CrossRef]
  20. Luo, L.; Wang, X.; Liu, C.; Guo, H.; Du, X. Integrated RS, GIS and GPS approaches to archaeological prospecting in the Hexi Corridor, NW China: A case study of the royal road to ancient Dunhuang. J. Archaeol. Sci. 2014, 50, 178–190. [Google Scholar] [CrossRef]
  21. Wonsok, K.; Nie, Y.; Zhu, J.; Deng, B.; Yu, L.; Liu, F.; Gao, H. Local orientation based detection of circular soil marks of ancient graves by GA. J. Remote Sens. 2013, 17, 671–678. [Google Scholar]
  22. Myers, A. Camp Delta, Google Earth and the ethics of remote sensing in archaeology. World Archaeol. 2010, 42, 455–467. [Google Scholar] [CrossRef]
  23. Sheppard, S.; Cizek, P. The ethics of Google Earth: Crossing thresholds from spatial data to landscape visualization. J. Environ. Manage. 2008, 90, 2102–2117. [Google Scholar] [CrossRef] [PubMed]
  24. Parks, L. Digging into Google Earth: An analysis of “Crisis in Darfur”. Geoforum 2009, 40, 535–545. [Google Scholar] [CrossRef]
  25. Kennedy, D.; Bishop, M.C. Google Earth and the archaeology of Saudi Arabia, a case study from the Jeddah area. J. Archaeol. Sci. 2011, 38, 1284–1293. [Google Scholar] [CrossRef]
  26. Sadr, K.; Rodier, X. Google Earth, GIS and stone-walled structures in southern Gauteng, South Africa. J. Archaeol. Sci. 2012, 39, 1034–1042. [Google Scholar] [CrossRef]
  27. Kempe, S.; Al-Malabeh, A. Desert kites in Jordan and Saudi Arabia: Structure, statistics and function, a Google Earth study. Quat. Int. 2012, 297, 126–146. [Google Scholar] [CrossRef]
  28. Pringle, H. Google Earth shows clandestine worlds. Science 2010, 329, 1008–1009. [Google Scholar] [CrossRef] [PubMed]
  29. Ur, J. Google Earth and archaeology. SAA Record 2006, 6, 35–38. [Google Scholar]
  30. Luo, L.; Wang, X.; Cai, H.; Li, C.; Ji, W. Mapping a paleodrainage system of the Keriya River using remote sensing data and historical materials. J. Earth Sci. Eng. 2012, 2, 712–721. [Google Scholar]
  31. Morehart, C.T. Mapping ancient chinampa landscapes in the Basin of Mexico: A remote sensing and GIS approach. J. Archaeol. Sci. 2012, 39, 2541–2551. [Google Scholar] [CrossRef]
  32. Evans, D.; Pottier, C.; Fletcher, R.; Hensley, S.; Tapley, I.; Milne, A.; Barbetti, M. A comprehensive archaeological map of the world’s largest preindustrial settlement complex at Angkor, Cambodia. Proc. Natl. Acad. Sci. USA 2007, 104, 14277–14282. [Google Scholar] [CrossRef] [PubMed]
  33. Doneus, M.; Verhoeven, G.; Atzberger, C.; Wess, M.; Ruš, M. New ways to extract archaeological information from hyperspectral pixels. J. Archaeol. Sci. 2014, 52, 84–96. [Google Scholar] [CrossRef]
  34. D’Orazio, T.; Palumbo, F.; Guaragnell, C. Archaeological trace extraction by a local directional active contour approach. Pattern Recogn. 2012, 45, 3427–3438. [Google Scholar] [CrossRef]
  35. Lasaponara, R.; Masini, N. Satellite remote sensing in archaeology: Past, present and future perspectives. J. Archaeol. Sci. 2011, 38, 1995–2496. [Google Scholar] [CrossRef]
  36. Lasaponara, R.; Masini, N. Image enhancement, feature extraction and geospatial analysis in an archaeological perspective. In Satellite Remote Sensing: A New Tool for Archaeology; Springer: New York, NY, USA, 2012; pp. 17–63. [Google Scholar]
  37. Agapiou, A.; Alexakis, D.D.; Sarris, A.; Hadjimitsis, D.G. Orthogonal equations of multi-spectral satellite imagery for the identification of un-excavated archaeological sites. Remote Sens. 2013, 5, 6560–6586. [Google Scholar] [CrossRef]
  38. Tarantino, E.; Figorito, B. Steerable filtering in interactive tracing of archaeological linear features using digital true colour aerial images. Int. J. Digital Earth 2014, 7, 870–880. [Google Scholar] [CrossRef]
  39. Redfern, S.; Lyons, G. The Application of Digital Techniques to the Detection and Extraction of Archaeological Earthwork Monuments from Aerial Photographs. 1998. Available online: www.it.nuigalway.ie (accessed on 6 November 2013).
  40. Jahjah, M.; Ulivieri, C. Automatic archaeological feature extraction from satellite VHR images. Acta Astronaut. 2010, 66, 1302–1310. [Google Scholar] [CrossRef]
  41. Schuetter, J.; Goel, P.; McCorriston, J.; Park, J.; Senn, M.; Harrower, M. Autodetection of ancient Arabian tombs in high-resolution satellite imagery. Int. J. Remote Sens. 2013, 34, 6611–6635. [Google Scholar] [CrossRef]
  42. Trier, Ø.D.; Larsen, S.Ø.; Solberg, R. Automatic detection of circular structures in high-resolution satellite images of agricultural land. Archaeol. Prospect. 2009, 16, 1–15. [Google Scholar] [CrossRef]
  43. Figorito, B.; Tarantino, E. Semi-automatic detection of linear archaeological traces from orthorectified aerial images. Int. J. Appl. Earth Obs. 2014, 26, 458–463. [Google Scholar] [CrossRef]
  44. Pasolli, E.; Melgani, F.; Donelli, M.; Attoui, R.; de Vos, M. Automatic detection and classification of buried objects in GPR images using Genetic Algorithms and Support Vector Machines. In Proceedings of the 2008 IEEE International Geoscience and Remote Sensing Symposium, Boston, MA, USA, 7–11 July 2008; pp. II-525–II-528.
  45. Todd, D.K.; Mays, L.W. Introduction. In Groundwater Hydrology, 3rd ed.; Wiley: New York, NY, USA, 2004; pp. 7–41. [Google Scholar]
  46. Boustani, F. Sustainable water utilization in arid region of Iran by Qanats. Int. J. Human Soc. Sci. 2009, 4, 505–508. [Google Scholar]
  47. Karez: Afghanistan’s Traditional Irrigation System. Available online: http://www.adkn.org/en/agriculture/article.asp?a=67 (accessed on 25 September 2014).
  48. Ahmadi, H.; Samani, A.N.; Malekian, A. The Qanat: A living history in Iran. In Water and Sustainability in Arid Regions; Schneier-Madanes, G., Courel, M.F., Eds.; Springer: Landon, UK, 2010; pp. 125–138. [Google Scholar]
  49. Motiee, H.; Mcbean, E.; Semsar, A.; Gharabaghi, B.; Ghomashchi, V. Assessment of the contributions of Traditional Qanats in sustainable water resources management. Int. J. Water Res. Develop. 2006, 22, 575–588. [Google Scholar] [CrossRef]
  50. Abudu, S.; Cevik, S.Y.; Bawazir, S.; King, J.P.; Cui, C. Vitality of ancient Karez systems in arid lands: A case study in Turpan region of China. Water Hist. 2011, 3, 213–225. [Google Scholar] [CrossRef]
  51. Hu, W.; Zhang, J.; Liu, Y. The Qanats of Xinjiang: Historical development, characteristics and modern implications for environmental protection. J. Arid Land 2012, 4, 211–220. [Google Scholar] [CrossRef]
  52. Huang, S. Oasis Studies; Science Press: Beijing, China, 2003; pp. 3–17. (In Chinese) [Google Scholar]
  53. Li, J. A study on the origin and date of Xinjiang’s Kan’erjing. J. Xinjiang Norm. Univ. Soc. Sci. 2005, 26, 25–28. (In Chinese) [Google Scholar]
  54. Hosseini, S.A.; Shahraki, S.Z.; Farhudi, R.; Hosseini, S.M.; Salari, M.; Pourahmad, A. Effect of urban sprawl on a traditional water system (Qanat) in the City of Mashhad, NE Iran. Urb. Water J. 2010, 7, 309–320. [Google Scholar] [CrossRef]
  55. Haakon, L.; Shen, Y. The Disappearance of the Karez of Turfan; Report from the Project “Harvest from Wasteland. Land, People and Water Management Reforms in the Dry Lands of Xinjiang”; Acta Geographica Series A15; Department of Geography, Norwegian University of Science and Technology (NTNU): Trondheim, Norway, 2006. [Google Scholar]
  56. Haralick, R.M.; Sternberg, S.R.; Zhuang, X. Image analysis using mathematical morphology. IEEE Trans. Pattern Anal. Mach. Intell. 1987, PAMI-9, 532–550. [Google Scholar] [CrossRef]
  57. Gonzalez, R.C.; Woods, R.E. Morphological Image Processing. In Digital Image Processing, 2nd ed.; Prentice Hall: Upper Saddle River, NJ, USA, 2002; pp. 462–463. [Google Scholar]
  58. Maini, R.; Aggarwal, H. Study and comparison of various image edge detection techniques. Int. J. Image Process. 2009, 3, 1–11. [Google Scholar] [CrossRef]
  59. Rahnama, M.; Gloaguen, R. TecLines: A MATLAB-based toolbox for tectonic lineament analysis from satellite images and DEMs, part 1: Line segment detection and extraction. Remote Sens. 2014, 6, 5938–5958. [Google Scholar] [CrossRef]
  60. Canny, J. A computational approach to edge detection. IEEE Trans. Pattern Anal. Mach. Intell. 1986, PAMI-8, 679–698. [Google Scholar] [CrossRef]
  61. Hough, P.V.C. Method and Means for Recognizing Complex Patterns. U.S. Patent 3,069,654, 18 December 1962. [Google Scholar]
  62. Yuen, H.K.; Illingworth, J.; Kittler, J. Detecting partially occluded ellipses using the Hough transform. Image Vision Comput. 1989, 7, 31–37. [Google Scholar] [CrossRef]
  63. Rizon, M.; Yazid, H.; Saad, P.; Md Shakaff, A.Y.; Saad, A.R.; Sugisaka, M.; Yaacob, S.; Mamat, M.R.; Karthigayan, M. Object detection using circular Hough transform. Am. J. Appl. Sci. 2005, 2, 1606–1609. [Google Scholar] [CrossRef]
  64. Raymond, K.K.Y.; Peter, K.S.T.; Dennis, N.K.L. Modification of Hough transform for circles and ellipses detection using a 2-dimensional array. Pattern Recogn. 1992, 25, 1007–1022. [Google Scholar] [CrossRef]
  65. Duda, R.O.; Hart, P.E. Use of the Hough transform to detect lines and curves in pictures. Commun. ACM 1972, 15, 11–15. [Google Scholar] [CrossRef]
  66. Shufelt, J.A. Performance evaluation and analysis of monocular building extraction from Aerial imagery. IEEE Trans. Pattern Anal. Mach. Intell. 1999, 21, 311–326. [Google Scholar] [CrossRef]

