Abstract
The origin of large areas dominated by pristine open vegetation that is in sharp contrast with surrounding dense forest within the Amazonian lowland has generally been related to past arid climates, but this is still an issue open for debate. In this paper, we characterize a large open vegetation patch over a residual megafan located in the northern Amazonia. The main goal was to investigate the relationship between this paleolandform and vegetation classes mapped based on the integration of optical and SAR data using the decision tree. Our remote sensing dataset includes PALSAR and TM/Landsat images. Five classes were identified: rainforest; flooded forest; wooded open vegetation; grassy-shrubby open vegetation; and water body. The output map resulting from the integration of PALSAR and TM/Landsat images showed an overall accuracy of 94%. Narrow, elongated and sinuous belts of forest within the open vegetation areas progressively bifurcate into others revealing paleochannels arranged into distributary pattern. Such characteristics, integrated with pre-existing geological information, led us to propose that the distribution of vegetation classes highlight a morphology attributed to a Quaternary megafan developed previous to the modern fluvial tributary system. The characterization of such megafan is important for reconstructing landscape changes associated with the evolution of the Amazon drainage basin.
1. Introduction
The sharp contrast between forest and open vegetation has been one of the most intriguing features of the Amazonian ecosystem, and numerous publications have discussed this issue (e.g., [1,2,3,4,5,6,7]). Changes in the physical environment over geological time have been the most frequently claimed hypothesis to explain such occurrences [3,8,9,10,11,12]. However, deciphering the factors that have played the major role in determining these vegetation contrasts is a theme still open for debate.
Accurate maps of areas with such contrasting vegetation types remain to be provided, and these might be elaborated based on the application of remote sensing techniques. Given basic differences between synthetic aperture radar (SAR) and optical data, the integration of these products, particularly applying the decision tree technique, has the potential to improve land cover classification [13,14,15,16,17], as this technique works with non-homogeneous datasets and non-normal statistical distribution [18].
The area between the Negro and Branco Rivers in the northern Amazonian lowland displays one of the largest incidences of open vegetation of this entire region. It is intriguing that such occurrences are not randomly distributed, but they are confined to several large-scale, triangular-shaped morphologies related to residual megafan depositional systems [19] due to their resemblance to many megafans described in the literature [20,21,22,23,24]. This is because megafans are characterized by extensive (i.e., >103 km2) sedimentary deposits with triangular and/or conical geometry in plain view. Such depositional systems are typical of areas of low topographic gradients having numerous avulsive channels and paleochannels (remnant of an inactive river) arranged into a distributary pattern [25,26,27]. Except for the Viruá megafan (e.g., [28,29]), located at the left margin of the Branco River (see location in Figure 1b), areas of open vegetation related with megafans in northern Amazonia remain to be characterized in more detail. The largest of these occurrences is associated with the Demini River, where two patches of open vegetation total ~4180 km2. This phytophysiognomy has not yet been characterized in detail, particularly concerning the analysis of its relationship with the megafan morphology. Given the great extent of megafans, their characterization has been facilitated by the geometry extracted mostly from remote sensing (e.g., [27,28,30]).
This work integrates optical and SAR data to provide the detailed vegetation map of the Demini megafan. The goals were twofold: (i) to test the hypothesis that classification based on these products furnishes a more precise vegetation map for the Demini megafan; and (ii) to analyze its potential contribution for unraveling the relationship between modern vegetation patterns and the residual megafan morphology.
2. Physiography and Geologic Framework
The Demini area is located in a wetland between the Negro and Branco Rivers in the northern Amazonian lowland (Figure 1). This region is characterized by a tropical equatorial climate [31], with annual rainfall ranging from 2000 to 2400 mm. The dry season occurs between January and March. The remaining of the year corresponds to the wet season, with peaks between May and July. During austral summer, the Intertropical Convergence Zone (ITCZ) moves southward to latitudes between 10°S and 15°S. During winter, this system moves northward, increasing both precipitation and drought in southern and northern Amazonia, respectively. Precipitation decreases to the south and increases considerably to the north with the northward displacement of the ITCZ [32].
The physiography in the study area includes forest and open vegetation adapted to bimodal periods (dry and wet) with biophysical and physiological adaptations under water-stressed conditions. Forested areas generally correspond to non-flooded forest (i.e., terra firme) and flooded forest (i.e., várzea) that occur surrounding large patches of open vegetation and are flooded in wet periods. The latter corresponds to grass, shrub, wood and forest campinarana, with the prevalence of the second one. These campinarana types occupy large depressions in sandy areas that remain wet during rainy seasons. Soils developed on the sandy areas with open vegetation consist mostly of Gleyic and Ferric Podzols, while Ferralsols and Gleysols occur in the surrounding areas of non-flooded rainforest and flooded forest, respectively (FAO/UNESCO System of Soil Classification) [33].
Geologically, the study area is situated northeastward of Solimões Basin. Recent geological maps [34,35] of this region, inserted in a wetland area named Pantanal Setentrional [36], indicate the prevalence of fluvial deposits of the Içá Formation (Plio-Pleistocene), as well as unnamed fluvial and aeolian deposits of the late Quaternary age [37]. Precambrian igneous and metamorphic rocks of the Guiana Shield bound the study area to the north. These rocks also occur as inselbergs within the Pantanal Setentrional wetland.
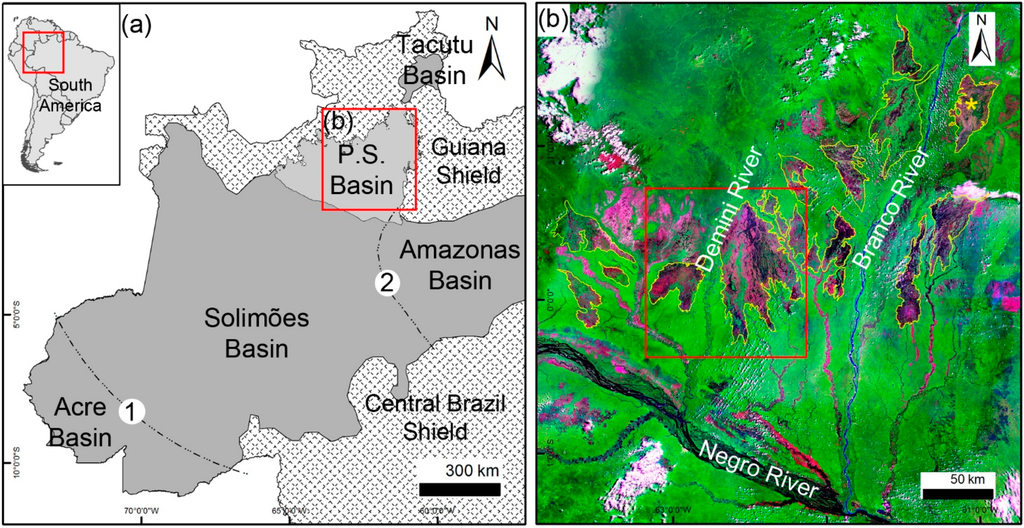
Figure 1.
(a) Location of the study area in the sub-basin named Pantanal Setentrional (P.S), in the northeast of Solimões Basin. The Iquitos (1) and Purus (2) structural arches bound this basin to the west and east, respectively; (b) Geocover Landsat 2000 mosaic of the study area in composite color Red (band 7), Green (band 4) and Blue (band 2), illustrating open vegetation patches (pink) in sharp contrast with forest (green). The red square depicts the studied open vegetated areas with triangular-shaped morphology at the Demini River.
3. Materials and Methods
3.1. Materials
This work was based on integration of Thematic Mapper (TM)/Landsat and SAR images. The latter was obtained in Fine Beam Dual (FBD) mode, with HH and HV polarizations (available in level 1.5 processing) using a Phased Array type L-band Synthetic Aperture (PALSAR) sensor aboard of the Advanced Land Observing Satellite (ALOS). The PALSAR images, accessible free of charge at the Brazilian Institute of Geography (ftp://geoftp.ibge.gov.br/imagens/Alos/), were previously georeferenced and orthorectified, with a planimetric accuracy of 31 m. Only five scenes from wet periods were available in this site in two orbits and two upcoming dates. Since the study area is characterized by high variability in water levels, a TM/Landsat image representing the dry stage was also considered in the analysis. This scene was selected based on the driest record available in the imagery catalog. Table 1 synthesizes the characteristics of the remote sensing data used in this work.
The study area has no evidence of anthropic impacts on land use change i.e., deforestation, agriculture or urban centers.

Table 1.
Characteristics of the remotely sensed data used in this work.
| Platform | Sensor | Bands | Date | Season | Incidence | Pixel (m) | Looks | Image Format |
|---|---|---|---|---|---|---|---|---|
| ALOS | PALSAR | L (HH and HV) | 06/June/2008 | Wet | 36.6°–40.9° | 12.5 | 4 | 16 bits |
| 23/June/2008 | ||||||||
| Landsat-5 | TM | 1,2,3,4,5 and 7 | 03/April/1987 | Dry | nadir | 30 | - | 8 bits |
3.2. Classification
The main phytophysiognomies of the study area were classified according to categories of regional vegetation maps (e.g., [38]) and followed the scheme (Figure 2): RF = Rainforest, predominantly composed of dense woody vegetation in non-flooded areas; FF = Flooded forest, corresponding to areas covered by water during flooding, also named Igapó forest; OVw = Wooded open vegetation; OVgs = Grassy-shrubby open vegetation; and W = Open water bodies.
The decision tree was the classification method chosen for this work, which allows integrating different attributes to refine the separability among classes of interest. This procedure is based on the development of a series of hierarchical rules from a dataset that can include optical, SAR and other remote sensing data. The rules consist of thresholds used to divide a dataset, called node, into two groups [39]. The nodes are chosen aiming to obtain more pure classes from certain rules in its leaves. A node for a data attribute is divided into branches from the rules, progressively generating new classes or new nodes until the classes of interest are identified. In a decision tree, the number of leaves does not necessarily correspond to the number of classes, and more than one leaf can exist to a certain class if necessary to subdivide several attributes to span the variability of existing classes. A better understanding of an attribute’s behavior in the distinction of classes is reached with the smallest size of the tree and leaves number.
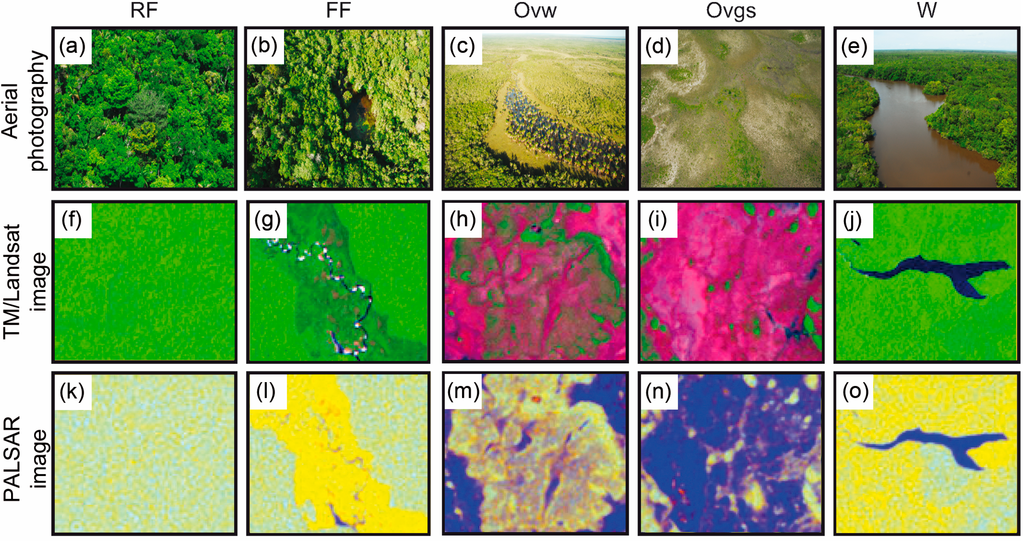
Figure 2.
(a–e) Aerial photographs illustrating the phytophysiognomic classes of the study area; (f–j) TM/Landsat image with composite color in Red (Band 5), Green (Band 4) and Blue (Band 3); (k–o) PALSAR image with composite color in Red (Band HH), Green (Band HV) and Blue (Ratio HH/HV) (RF = Rainforest; FF = Flooded forest; Ovw = Wooded open vegetation; Ovgs = Grassy-shrubby open vegetation; W = Open water bodies).
The attributes that best separated the phytophysiognomic types in the study area were determined with data mining [40]. Thresholds were defined to classify the mapping classes. The open-source software package Waikato Environment for Knowledge Analysis (WEKA) [41] was used in this procedure. This has several algorithms to generate decision trees, but a preliminary test showed that J48 algorithm produced the best result. This agrees with a previous publication which showed that the J48 algorithm produces better classification results than unsupervised classifiers, such as ISODATA [42]. The Java language reprogramming of the C4.5 algorithm [43] has been the most extensively tested and validated technique for generating decision trees, (e.g., [44]). This algorithm has the advantage to search the potentially smaller and more comprehensive trees with robust predictive performance [45]. The main criteria used in the J48 algorithm are the confidence factor and the minimum number of instances (sample) per leaf, which correspond to estimated error rates (see [44]). Lower confidence factor means more pruning (i.e., less nodes) in the decision tree. A leaf will not be considered as a class if fewer samples are present in one leaf than the assigned value.
3.3. Pre-Processing
The pre-processing to choose attributes for data mining was based on the physical values of surface reflectance (reflectance factor) of TM/Landsat-5 bands and normalized backscatter in σ° (sigma nought), the latter expressed in dB scale for the PALSAR data. Sigma nought represents the normalized measure of the radar, defined as per unit area on the ground. Selection of these physical attributes should be predictive than digital number (DN), with knowledge of spectral response being helpful for interpreting the decision tree.
Reflectance values were obtained from radiometric conversion of DN values to apparent reflectance, according to coefficients provided by [46]. Atmosphere correction was based on the 6S method (Second Simulation of a Satellite Signal in the Solar Spectrum) [47]. Correction parameters used were: tropical atmospheric mode, continental aerosol model, 50 km of visibility and 40 m of altitude (above sea level).
For PALSAR images in amplitude and 1.5 processing level, the enhanced-lee filtering algorithm (5 × 5 window) was applied to reduce the speckle. Such filter preserves feature edges that can influence a pixel-based classification, such as a decision tree. The images were converted from DN values (16 bits) to σ° based on parameters from [48]. Lastly, the PALSAR image was resampled by pixel aggregation to 30 m (same pixel size from TM/Landsat) for co-registration in the classification process.
The training sampling was performed by visual selection of small and evenly distributed polygons along scenes. These polygons aimed to collect approximately 10,000 pixels per class. Based on these pixels, a sampling procedure was applied with a random stratified method using. For this, a thousand pixels per class was considered. This procedure ensured the spatial independence of samples. Thus, there was a thousand points distributed for each class in which the reflectance values and sigma nought were extracted.
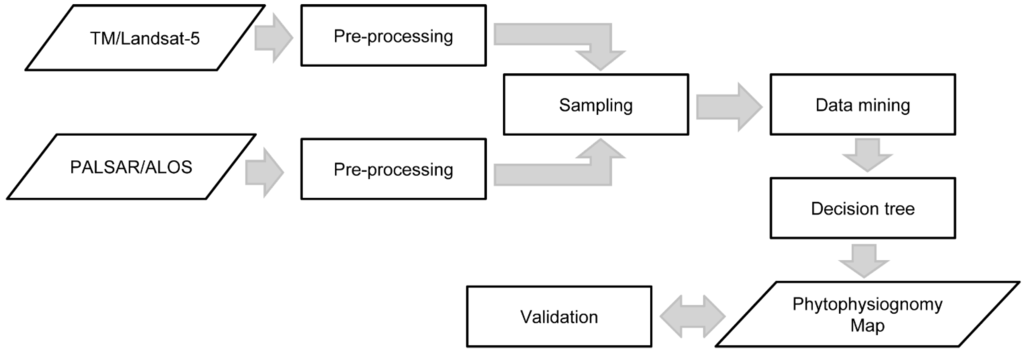
Figure 3.
Steps applied for processing the remote sensing products.
3.4. Validation of the Phytophysiognomic Map
The validation of the decision tree was performed with the same algorithms and parameters applied in the previous steps: TM/Landsat image; PALSAR image; and integration of these two products. The confidence factor of 0.25 (WEKA default value) and the minimum number of instances per leaf of 75 were considered for this classification. Based on the final classification, the stratified random sampling considered one hundred of samples per each class, selected by an independent interpreter with experience in this type of phytophysiognomical mapping. This procedure was then applied on the same images used for training in order to obtain the confusion matrix, overall accuracy and Kappa statistics with confidence interval. Confusion matrix is a square matrix whose dimension is equal to the class number. Each matrix column indicates the desired class and each row the estimated class where the crosses indicate the rights and wrongs from a classification and can be used to take parameters of the classification evaluation, as the Kappa index: a measure of how the classification is consistent with the reference data [49]. Hypothesis tests were performed for assessing the significance of these values [49]. Figure 3 presents the whole data flow applied from the initial processing of remote sensing products to the elaboration of the final phytophysiognomic map.
The phytophysiognomic product furnished the basis for interpreting the relationship between vegetation and megafan landforms in the study area. This was made possible mainly considering the geometry defined by the distribution of vegetation classes, such as shape, elongation, sinuosity, size, as well as pre-knowledge of the geomorphology from previous works undertaken in this region [19,28,29].
4. Results
Training samples from TM/Landsat and PALSAR images of the dry and wet periods, respectively, provided the following descriptive statistical analysis of vegetation classes for the study area (Figure 4).
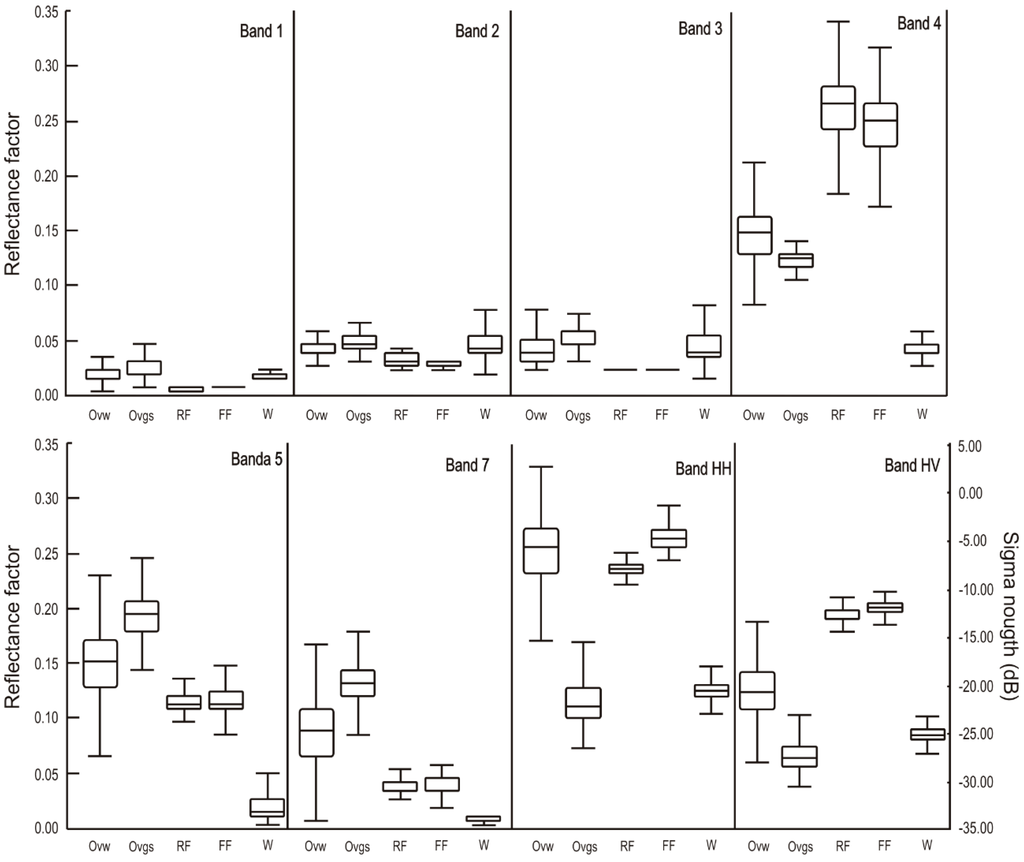
Figure 4.
Box-plots representing variation in reflectance and sigma nought for the training samples.
The visible bands provided less distinction between most of the classes, while the infrared bands and the polarizations HH and HV improved the class definition. The first and third quartile of open vegetation classes (Ovw and Ovgs) were promptly distinguished in bands 5 and 7 of TM images, as well as in the HV and HH polarizations of SAR data, with the latter being particularly useful for this purpose. Forest areas (RF and FF) were only distinguished in the HH polarization, which is mainly due to the double bounce effect of flooded forest and volumetric scattering of rainforest. The descriptive statistics of the decision tree, as well as the performance results are presented in the Table 2.
Table 2.
Characteristics of the decision tree and validation of the remote sensing datasets.
| Dataset | Number of Leaves | Size of the Tree | Overall Accuracy | Kappa Index | Confidence Interval (95%) | |
|---|---|---|---|---|---|---|
| Lower Limit | Upper Limit | |||||
| TM | 16 | 31 | 70.93 | 0.63 | 0.58 | 0.68 |
| PALSAR | 8 | 15 | 74.39 | 0.67 | 0.63 | 0.72 |
| TM+PALSAR | 5 | 9 | 94.40 | 0.93 | 0.90 | 0.95 |
The classification obtained with the TM/Landsat dataset produced the greatest tree size with 16 leaves for the five mapping classes. The independent validation with TM and PALSAR showed that both results were similar, but there was a reduction of the number of leaves by a half in the decision tree of the second dataset. When both sensors were integrated, validation showed a significant improvement, with the increment of the overall accuracy by 20% and a Kappa index of ~0.30. In addition, a short decision tree with only five leaves was produced by combination of TM/Landsat and PALSAR data (Figure 5). Shorter decision trees are better understood based on knowledge of spectral targets when using remote sensing data.
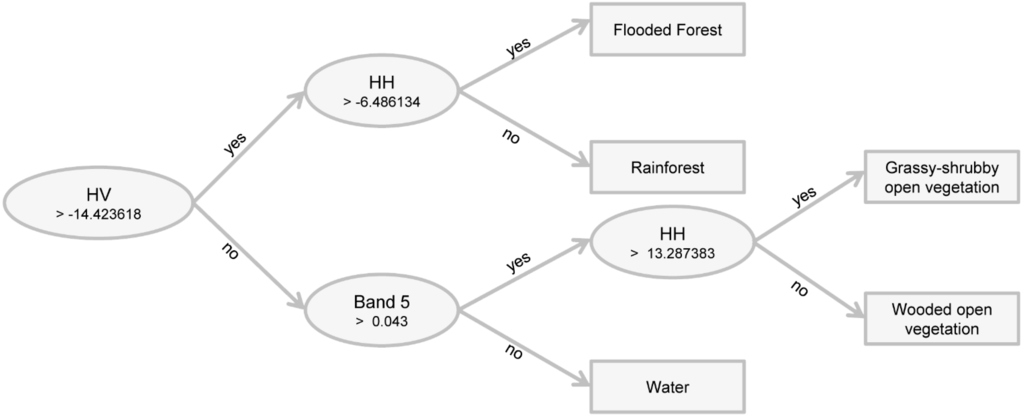
Figure 5.
Decision tree for the study area obtained with the C4.5 algorithm using TM/Landsat and PALSAR images.
The main node in the tree obtained with the integration of TM/Landsat and PALSAR images is in the HV polarization, which basically separated open vegetation from forest (Figure 6). Band 5 was the main one for classifying water bodies. The HH polarization from the HV partition was also useful for separating classes of open and forested vegetation.
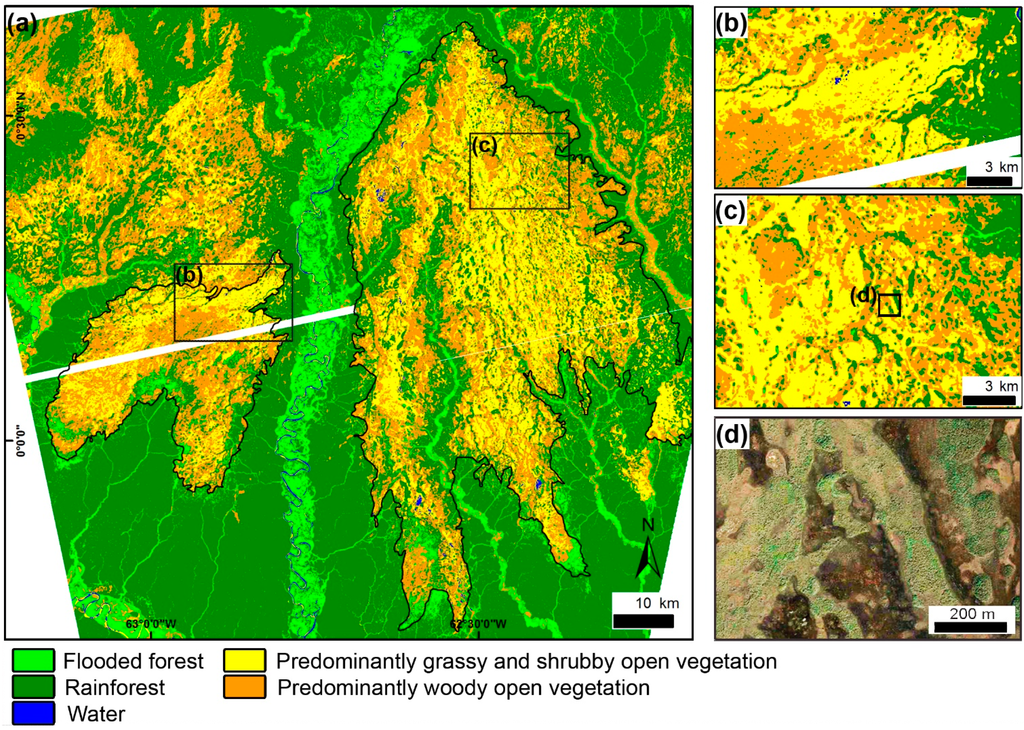
Figure 6.
(a) Phytophysiognomic map of the study area derived from the application of a decision tree integrating TM/Landsat and PALSAR images. Note that the main area of open vegetation corresponds to a large, triangular-shaped morphology, which is attributed to a megafan depositional system (highlighted by the black contour). The white strips within the classification result are due to a gap in the PALSAR coverage; (b,c) Details of the map, showing numerous narrow, elongated, sinuous belts of forest and woody open vegetation attributed to areas of paleochannels. Note that these features progressively bifurcate downstream along the megafan, characterizing a network of distributary channels; (d) GeoEye image from Google Earth® illustrating the distribution of phytophysiognomies in the study area.
The statistical analysis of the resulting classification showed an overall accuracy of 94.4% and a Kappa index of 0.93 (p < 0.001), with confidence interval 0.90–0.95 (Table 3). Classes were separated with producer’s and user’s accuracies averaging 94.4% and 95%, respectively. Woody open vegetation had the lowest Kappa index (0.88), which is due to its spectral response similar to grassy-shrubby open vegetation. In general, all classes show high values of producers, user accuracy and Kappa conditional index.
Visual analysis of the phytophysiognomic map shows that rainforest areas are confined mainly to the northern and southern extremes of the study area (Figure 6a). Interestingly, the boundaries of this class are notably sharp. In addition, classes of open vegetation define a major triangular-shaped morphology at the left margin of the Demini River (Figure 6a). This feature has a maximum length and width corresponding to 107 km and 60 km, respectively, and it shows a regional inclination of 0.008° in the main southward direction. Such data were analyzed in a recent work that discussed the regional topography in the northern Amazonia megafans [19]. In addition, its axis points to the NNW, i.e., into the Guiana Shield, and the fringe spreads out to the SSE. Several narrow, elongated, and sinuous belts of rainforest and woody open vegetation can be observed on the surface of this morphology (Figure 6b–d). These have widths ranging from 200 to 1200 m and lengths up to 40 km, but they can be extended into other similar belts that continue over the entire surface of the triangular morphology. Noteworthy is that these sinuous belts commonly bifurcate toward the fan fringe, configuring a network of interconnecting segments (Figure 6c,d).
Table 3.
Confusion matrix from classification with Kappa conditional.
| Class | RF | FF | W | OVw | OVgs | Total | User Accuracy (%) | Producer Accuracy (%) | Kappa |
|---|---|---|---|---|---|---|---|---|---|
| RF | 96 | 4 | 0 | 0 | 0 | 100 | 89 | 96 | 0.95 |
| FF | 5 | 95 | 0 | 0 | 0 | 100 | 95 | 95 | 0.94 |
| W | 0 | 0 | 98 | 2 | 0 | 100 | 100 | 98 | 0.98 |
| OVw | 7 | 1 | 0 | 90 | 2 | 100 | 91 | 90 | 0.88 |
| OVgs | 0 | 0 | 0 | 7 | 93 | 100 | 98 | 93 | 0.91 |
| Total | 108 | 100 | 98 | 99 | 95 | 500 |
5. Discussion
5.1. Decision Tree and Spectral Response
The largest number of leaves generated by the classification based either on TM/Landsat-5 or PALSAR data was not as efficient to generate better classification accuracy as both products combined. Additionally, the number of leaves generated by the classification using individual products should overlap the statistical distribution of reflectance values and sigma nought of the classes of interest, as shown in Figure 4. Confusion of classes meant that new leaves were generated to get a better classification. However, there was more confusion among samples when using either TM/Landsat-5 or PALSAR images than when both products were combined.
In addition, to have better accuracy compared to other classifications, the smallest size of the decision tree when combining PALSAR and TM/Landsat-5 allowed a better interpretation of the target’s spectral behavior. Results of data mining indicated that the HV polarization was more useful to separate areas of forest than of open vegetation. This polarization provides more information about vegetation canopy structure [50], justifying its position in a main node in the tree. The HH polarization was useful to separate wooded from grassy-shrubby open vegetation due to volumetric and ground backscattering, respectively. This polarization provides great penetration through the vegetation canopy [51]. Differences between the volumetric backscattering of rainforest and the double bounce backscattering of flooded forest provided by the HH polarization is a useful property for discriminating vegetation types in wetlands. Thus, this polarization has been often used for distinguishing between non-flooded and flooded forest [51]. The band 5 was suitable for classifying water bodies in the study area, following similar results previously obtained by others (i.e., [28,52]).
A minimum of leaves possible for five classes of mapping was reached on the vegetation map. The wooded open vegetation was the class with the highest confusion with the rainforest and grassy-shrubby open vegetation classes (conditional Kappa = 0.88). This happened because the wooded open vegetation contains larger trees, which occasionally causes confusion in the pixel-by-pixel classification. Other classes had a high accuracy rate given by the non-overlapping of the statistical distribution in spectral response of targets. This resulted in reasonable differentiation among classes because there was little confusion between them. Thus, the integration of multi-sensors applying a classification by decision tree is a useful tool for mapping vegetation types in the Demini megafan area and it can be in other similar regions.
5.2. Relationship between Vegetation and the Megafan Landform
The most remarkable information that might be extracted from the phytophysiognomic classes of the study area is their geometric distribution. This is because the grassland and shrubland open vegetation classes are not randomly distributed, but they highlight previously recognized residual megafan landform in the Demini area [19]. Such morphology reflects the accumulation of a large volume of sediment transported from highland basement rocks into the sedimentary basin represented by the Pantanal Setentrional wetland. Megafans form sedimentary deposits sourced from main channels, but which spread out over extensive, essentially flat-lying areas, which produce sedimentary successions with fan-like geometries [22]. Similar depositional system has been recorded in several modern settings [20,22,24], including an occurrence in the wetlands of Central Brazil [23]. In addition to the large scale triangular morphology, a striking relationship between the Demini megafan landform and the phytophysionomic classes is provided by the numerous narrow, elongated and sinuous belts of arboreal (forest and wooded open) vegetation within the class grassland. These characteristics, together with the progressive downslope bifurcation of the landforms, suggest the existence of distributary paleodrainage networks that do not conform to the tributary fluvial channels. It is interesting to note that tributary fluvial channels dominate the modern landscape of this region. Continental areas displaying channels with distributary patterns such as this one are typical of megafan depositional systems (e.g., [25,26,27,53]).
The factors leading to the development of such an unexpected depositional system in the study area is an intriguing issue that is beyond the scope of this article. However, future investigations should focus on climate and/or tectonic changes in the late Quaternary as the most likely hypotheses to explain the occurrence of megafans in this equatorial area. This is suggested because the origin of some megafans has been attributed to arid climates (e.g., [53]). On the other hand, many modern analogs of megafan systems are encountered in association with contemporaneously active tectonic settings (e.g., [21,23,26,27]). Therefore, future studies should address: (1) how climate and/or tectonics acted in the development of this depositional system; and (2) how changes in in this physical environment acted in order to lead to the establishment of the modern vegetation.
The detailed phytophysiognomic map obtained in this work constitutes an important input in studies aimed at relating the vegetation distribution with the physical environment evolution. The presence of such a large area of active sediment deposition in a relatively recent geological time would have been incompatible with vegetation growth. Thus, while areas surrounding the megafan remained vegetated with forest, vegetation growth was initiated on the surface of this landform only after sediment deposition, when the megafan became abandoned. Open vegetation, represented by grassland and shrubland campinarana types, constitutes the first colonization stage to dominate the megafan surface as it became progressively exposed to subaerial conditions with the onset of pedogenesis. It is expected that these vegetation types will be replaced by arboreal vegetation in successional stages, which is a process already suggested to explain similar vegetation patterns in other wetland areas of the northeastern Amazonia lowlands, for instance, the Marajó Island at the Amazon mouth (e.g., [54]). A comparison with that area also may explain the preferential occurrence of arboreal vegetation in association with paleochannels. According to field observations made by those authors (i.e., [54]), such landforms have slightly higher topographies with respect to surrounding floodplain areas. They explained that sandy channels are more cohesive, thus less prone to compaction after deposition, than muds from surrounding floodplains. This process would result in less compacted sediments over paleochannel areas, which may develop positive reliefs through the geological time. Thus, rather than soil nutrients or lithology, hydrological gradient controlled by the geomorphological nature associated with the megafan evolution might be a main factor controlling the distribution of arboreal and grassland/shrubland vegetation. However, this hypothesis should be further addressed based on geological field data in order to explain the distribution of vegetation patterns over the Demini megafan.
6. Conclusions
The optical and SAR data integration with the decision tree method provided the best classification results, as shown by the Kappa statistics. Such product aided the discovery of a residual megafan landform in the northern Brazilian Amazonia lowland. The HV and HH polarizations of the SAR images were the most appropriate dataset for this purpose. The former was useful for separating between forest and open vegetation classes, while the latter was efficient for classifying open vegetation types. The mapped phytophysiognomies do not show a random pattern, with the class of open vegetation highlighting the studied large-scale, triangular- to fan-shaped megafan morphology. Another important conclusion of the present research is the mapping of numerous narrow, elongated and sinuous belts of arboreal (forest and wooded open) vegetation within the class grassland, which were used to suggest distributary paleodrainage networks. These features are typical of megafan depositional systems. The occurrence of megafans in the northern Amazonia lowland should be better investigated due to implications regarding the reconstruction of climatic fluctuation and tectonic reactivation during the late Quaternary. The vegetation map resulting from the decision tree methodology suggested herein can help improve the megafan characterization and examine its relation to the modern distribution of vegetation classes in this and other tropical areas with similar characteristics.
Acknowledgments
The authors acknowledge the financial support provided by FAPESP−Research Funding Institute of the State of São Paulo (Projects # 2010/09484−2 and 13/50475−5). The Brazilian Institute for Space Research (INPE) provided all the computational resources needed for processing the remote sensing data. Four anonymous reviewers provided numerous comments and suggestions that contributed to improve significantly an earlier version of the manuscript.
Author Contributions
Édipo Henrique Cremon is the main author who performed the analyses and wrote the paper with contributions from all co-authors. Dilce de Fátima Rossetti supervised the research and contributed to the article’s organization. Hiran Zani was responsible for validating the map classification.
Conflicts of Interest
The authors declare no conflict of interest.
References
- Takeuchi, M. A estrutura da vegetação na Amazônia. II—As savanas do Norte da Amazônia. Bol. Mus. Para. Emilio Goeldi 1960, 7, 3–14. [Google Scholar]
- Prance, G.T.; Schubart, H.O.R. Nota preliminar sobre a origem das campinas abertas de areia branca do baixo Rio Negro. Acta Amaz. 1977, 7, 567–570. [Google Scholar]
- Salo, J. Pleistocene forest refuges in the Amazon evaluation of the biostratigraphical, lithostratigraphical and geomorphological data. Ann. Zool. Fenn. 1987, 24, 203–211. [Google Scholar]
- Anderson, A.B. White sand vegetation of Brazilian Amazonia. Biotropica 1981, 13, 199–210. [Google Scholar] [CrossRef]
- Sanaiotti, T.M.; Martinelli, L.A.; Victoria, R.L.; Trumbore, S.E.; Camargo, P.B. Past vegetation changes in Amazon savannas determined using carbon isotopes of soil organic matter. Biotropica 2002, 34, 2–16. [Google Scholar] [CrossRef]
- Cochrane, T.T.; Cochrane, T.A. Amazon Forest and Savanna Lands: A Guide to the Climates, Vegetation, Landscapes and Soils of Central Tropical South America; CreateSpace: New York, NY, USA, 2010. [Google Scholar]
- Behling, H.; Hooghiemstra, H. Holocene Amazon rainforest-savanna dynamics and climatic implications: High-resolution pollen record from Laguna Loma Linda in eastern Colombia. J. Quat. Sci. 2000, 15, 687–695. [Google Scholar] [CrossRef]
- Maslin, M.A.; Burns, S. Reconstruction of the Amazon Basin effective moisture availability over the past 14,000 years. Science 2000, 290, 5500–2285. [Google Scholar]
- Sifeddine, A.; Martin, L.; Turcq, B.; Volkmer-Ribeiro, C.; Soubiès, F.; Cordeiro, R.C.; Suguiu, K. Variations of the Amazonian rainforest environment: A sedimentological record covering 30,000 years. Palaeogeogr. Palaeoclimatol. Palaeoecol. 2001, 168, 221–235. [Google Scholar] [CrossRef]
- Malhi, Y.; Phillips, O. Tropical forests and global atmospheric change: A synthesis. Phil. Trans. R. Soc. B 2004, 359, 549–555. [Google Scholar] [CrossRef] [PubMed]
- Pennington, R.T.; Lewis, G.P.; Ratter, J.A. Neotropical Savannas and Seasonally Dry Forests: Plant Diversity, Biogeography and Conservation; CRC Press: London, UK, 2006. [Google Scholar]
- Rossetti, D.F.; Almeida, S.; Amaral, D.D.; Lima, C.M.; Pessenda, L.C.R. Coexistence of forest and savanna in an Amazonian area from a geological perspective. J. Veg. Sci. 2010, 21, 120–132. [Google Scholar] [CrossRef]
- Li, J.; Teng, X.; Xiao, J. Application of shuttle imaging radar data for land use investigations. Remote Sens. Environ. 1986, 19, 291–301. [Google Scholar] [CrossRef]
- Aschbacher, J.; Lichtenegger, J. Complementary nature of SAR and optical data: A case study in the tropics. Earth Observ. Q. 1990, 31, 4–8. [Google Scholar]
- Kuplich, T.M.; Freitas, C.C.; Soares, J.V. The study of ERS-1 SAR and Landsat TM synergism for land use classification. Int. J. Remote Sens. 2000, 21, 2101–2111. [Google Scholar] [CrossRef]
- Walker, W.S.; Stickler, C.M.; Kellndorfer, J.M.; Kirsch, K.M.; Nepstad, D.C. Large-Area classification and mapping of forest and land cover in the Brazilian Amazon: A comparative analysis of ALOS/PALSAR and Landsat data sources. IEEE J. Sel. Top. Appl. Earth Observ. Remote Sens. 2010, 3, 594–604. [Google Scholar] [CrossRef]
- Zhu, Z.; Woodcock, C.E.; Rogan, J.; Kellndorfer, J.M. Assessment of spectral, polarimetric, temporal, and spatial dimensions for urban and peri-urban land cover classification using Landsat and SAR data. Remote Sens. Environ. 2012, 117, 72–82. [Google Scholar] [CrossRef]
- Hansen, M.C.; Dubayah, R.; DeFries, R.S. Classification trees: An alternative to traditional land cover classifiers. Int. J. Remote Sens. 1996, 17, 1075–1081. [Google Scholar] [CrossRef]
- Rossetti, D.F.; Zani, H.; Cremon, É.H. Fossil megafans evidenced by remote sensing in the Amazonian wetlands. Z. Geomorphol. 2014, 58, 145–161. [Google Scholar] [CrossRef]
- Stanistreet, I.G.; McCarthy, T. The Okavango Fan and the classification of subaerial fan systems. Sediment. Geol. 1993, 85, 115–133. [Google Scholar] [CrossRef]
- Gumbricht, T.; McCarthy, T.S.; Merry, C.L. The topography of the Okavango Delta, Botswana, and its tectonic and sedimentological implications. South Afr. J. Geol. 2001, 104, 243–264. [Google Scholar] [CrossRef]
- Horton, B.; DeCelles, P. Modern and ancient fluvial megafans in the foreland basin system of the central Andes, southern Bolivia: Implications for drainage network evolution in fold-thrust belts. Basin Res. 2001, 13, 43–63. [Google Scholar] [CrossRef]
- Assine, M.L. River avulsions on the Taquari megafan, Pantanal wetland, Brazil. Geomorphology 2005, 70, 357–371. [Google Scholar] [CrossRef]
- Sinha, R.; Jain, V.; Babu, G.P.; Ghosh, S. Geomorphic characterization and diversity of the fluvial systems of the Gangetic Plains. Geomorphology 2005, 70, 207–225. [Google Scholar] [CrossRef]
- DeCelles, P.; Cavazza, W. A comparison of fluvial megafans in the Cordilleran (Upper Cretaceous) and modern Himalayan foreland basin systems. Geol. Soc. Am. Bull. 1999, 111, 1315–1334. [Google Scholar] [CrossRef]
- Leier, A.L.; DeCelles, P.G.; Pelletier, J.D. Mountains, monsoons and megafans. Geology 2005, 33, 289–292. [Google Scholar] [CrossRef]
- Hartley, A.J.; Weissmann, G.S.; Nichols, G.J.; Warwick, G.L. Large distributive fluvial systems: Characteristics, distribution, and controls on development. J. Sediment. Res. 2010, 80, 167–183. [Google Scholar] [CrossRef]
- Zani, H.; Rossetti, D.F. Multitemporal Landsat data applied for deciphering a megafan in northern Amazonia. Int. J. Remote Sens. Print 2012, 33, 6060–6075. [Google Scholar] [CrossRef]
- Rossetti, D.F.; Zani, H.; Cohen, M.C.L.; Cremon, É.H. A Late Pleistocene-Holocene wetland megafan in the Brazilian Amazonia. Sediment. Geol. 2012, 281, 50–68. [Google Scholar] [CrossRef]
- Buehler, H.A.; Weissmann, G.S.; Scuderi, L.A.; Hartley, A.J. Spatial and temporal evolution of an avulsion on the Taquari River distributive fluvial system from satellite image analysis. J. Sediment. Res. 2011, 81, 630–640. [Google Scholar] [CrossRef]
- Brazilian Institute of Geography and Statistics (IBGE). Mapa de Clima do Brasil; IBGE: Rio de Janeiro, Brazil, 1978. [Google Scholar]
- Latrubesse, E.M.; Ramonell, C.G. A Climatic model for southwestern Amazonia in Last Glacial Times. Quat. Int. 1994, 21, 163–169. [Google Scholar] [CrossRef]
- Brazilian Institute of Geography and Statistics (IBGE). Mapa de Solos do Brasil; IBGE: Rio de Janeiro, Brazil, 2001. [Google Scholar]
- Brazilian Institute of Geography and Statistics (IBGE). Geologia de Roraima; IBGE: Belém, Brazil, 2005. [Google Scholar]
- Brazilian Institute of Geography and Statistics (IBGE). Geologia do Amazonas; IBGE: Belém, Brazil, 2010. [Google Scholar]
- Santos, O.; Nelson, B.; Giovannini, C.A. Campos de dunas: Corpos de areia sob leitos abandonados de grandes ríos. Ciênc. Hoje 1993, 93, 22–25. [Google Scholar]
- Bezerra, P.E.L. Compartimentação Morfotectônica do Interflúvio Solimões-Negro. Ph.D. Thesis, Universidade Federal do Pará, Belém, Brazil, 2003. [Google Scholar]
- Brazilian Institute of Geography and Statistics (IBGE). Mapa de Vegetação de Roraima; IBGE: Belém, Brazil, 2005. [Google Scholar]
- Simard, M.; Saatchi, S.S.; Grandi, G. The use of decision tree and multiscale texture for classification of JERS-1 SAR data over tropical forest. IEEE Trans. Geosci. Remote Sens. 2000, 38, 2310–2321. [Google Scholar] [CrossRef]
- Fayyad, U.; Piatesky-Shapiro, G.; Smyth, P.; Uthurusamy, R. Advances in Knowledge Discovery and Data Mining; AAAI Press: Palo Alto, CA, USA, 1996. [Google Scholar]
- Hall, M.; Frank, E.; Holmes, G.; Pfahringer, B.; Reutemann, P.; Witten, I.H. The WEKA data mining software: An update. SIGKDD Explor. 2009, 11, 10–18. [Google Scholar] [CrossRef]
- Sharma, R.; Ghosh, A.; Joshi, P.K. Decision tree approach for classification of remotely sensed satellite data using open source support. J. Earth Syst. Sci. 2013, 122, 1237–1247. [Google Scholar] [CrossRef]
- Quinlan, J.R. C4.5: Programs for Machine Learning; Kaufmann Publishers: Burlington, MA, USA, 1993. [Google Scholar]
- Witten, I.; Frank, E. Data Mining: Pratical Machine Learnig Tools and Techniques, 2nd ed.; Morgam Kaufmann Publishers: San Francisco, CA, USA, 2005. [Google Scholar]
- Kohavi, R.; Quinlan, R. Decision tree discovery. In Handbook of Data Mining and Knowledge Discovery; Klosgen, W., Zytkow, J.M., Eds.; Oxford University Press: Oxford, UK, 2002; pp. 282–288. [Google Scholar]
- Chander, G.; Markham, B.L.; Helder, D.L. Summary of current radiometric calibration coefficients for Landsat MSS, TM, ETM+, and EO-1 ALI sensors. Remote Sens. Environ. 2009, 113, 893–903. [Google Scholar] [CrossRef]
- Vermote, E.F.; Tanré, D.; Deuzé, J.L.; Herman, M.; Morcrette, J.J. Second simulation of the satellite signal in the solar spectrum, 6S: An overview. IEEE Trans. Geosci. Remote Sens. 1997, 35, 675–686. [Google Scholar] [CrossRef]
- Shimada, M.; Isoguchi, O.; Tadono, T.; Isono, K. PALSAR radiometric and geometric calibration. IEEE Trans. Geosci. Remote Sens. 2009, 47, 3915–3932. [Google Scholar] [CrossRef]
- Congalton, R.G.; Green, K. Assessing the Accuracy of Remotely Sensed Data: Principles and Practices; CRC Press: London, UK, 2008. [Google Scholar]
- Rosenqvist, A.; Shimada, M.; Ito, N.; Watanabe, M. ALOS PALSAR: A pathfinder mission for global-scale monitoring of the environment. IEEE Trans. Geosci. Remote Sens. 2007, 45, 3307–3316. [Google Scholar] [CrossRef]
- Hess, L.L.; Melack, J.M.; Novo, E.M.L.M.; Barbosa, C.C.F.; Gastil, M. Dual-season mapping of wetland inundation and vegetation for the central Amazon basin. Remote Sens. Environ. 2003, 87, 404–428. [Google Scholar] [CrossRef]
- Frazier, P.S.; Page, K.J. Water body detection and delineation with Landsat TM data. Photogramm. Eng. Remote Sens. 2000, 66, 1461–1467. [Google Scholar]
- Nichols, G.; Fisher, J. Processes, facies and architecture of fluvial distributary system deposits. Sediment. Geol. 2007, 195, 75–90. [Google Scholar] [CrossRef]
- Mantelli, L.R.; Rossetti, D.F.; Albuquerque, P.G.; Valeriano, M.M. Applying SRTM digital elevation model to unravel Quaternary drainage in forested areas of Northeastern Amazonia. Comput. Geosci. 2009, 35, 2331–2337. [Google Scholar] [CrossRef]
© 2014 by the authors; licensee MDPI, Basel, Switzerland. This article is an open access article distributed under the terms and conditions of the Creative Commons Attribution license (http://creativecommons.org/licenses/by/4.0/).