Emissivity Measurements of Foam-Covered Water Surface at L-Band for Low Water Temperatures

 ,
,
Abstract
:
1. Introduction
2. Measurement Approach
 of the experimental system was estimated with that of the foam-free calm water surface:

 is the brightness temperature reached at antenna surface in the flat water experiment.
  represents the reflectivity of that surface, where ep is its emissivity, calculated by the Fresnel reflection coefficient.
  is the theoretical brightness temperature of the calm water surface.
  is the sum of brightness temperatures of the sky and atmospheric downwelling radiation. To derive brightness temperature from measured antenna temperature TA in our experiment, a linear relationship between brightness temperature and measured antenna temperature was defined as
  , where the coefficients a and b were determined by simulated brightness temperature (i.e., was calculated by the flat water surface model) and antenna temperature TA of flat water surface by applying measured antenna pattern. With this relationship, the effect of sidelobes picking radiation from the surroundings was removed. The main beam efficiency of radiometer antenna is 98.36% at whole space integration of antenna radiation pattern, which results that the maximum bias between the brightness temperature of theoretical model and the linear fitting brightness temperature with measured antenna temperature is about 0.1 K. For the case of foam-covered water surface, the above linear relationship between brightness temperature and measured antenna temperature was applied to derive the brightness temperature of foam-covered surface.
 reached at antenna surface includes the brightness temperatures of the foam-generating region, seawater region, and the reflected sky and atmospheric downwelling radiation:

 and
and  are emissivities of the foam and air-water mixture regions, respectively. The third term is the brightness temperature contribution of the foam-free water surface. The fourth term results from the total brightness temperature of the reflected sky and atmosphere downwelling radiation by the experimental water surface, where reflectivity
  of the foam experiment surface is calculated by
  . Substituting the noise brightness temperature of Equation (1) into Equation (2), emissivity of the foam-covered surface was estimated by
 of the air-water mixture can be calculated by the following method. Because the microwave wavelength of L-band (1.4 GHz) is larger than the size of air bubbles in the air-water mixture, that mixture is regarded as an effective medium. Then, the effective permittivity εe of the mixture is estimated by the Maxwell-Garnett Equation (4) of the spherical composite (i.e., air bubbles embedded in seawater) [30]:
is estimated by the Fresnel reflection coefficient.
of the air-water mixture can be calculated by the following method. Because the microwave wavelength of L-band (1.4 GHz) is larger than the size of air bubbles in the air-water mixture, that mixture is regarded as an effective medium. Then, the effective permittivity εe of the mixture is estimated by the Maxwell-Garnett Equation (4) of the spherical composite (i.e., air bubbles embedded in seawater) [30]:
is estimated by the Fresnel reflection coefficient.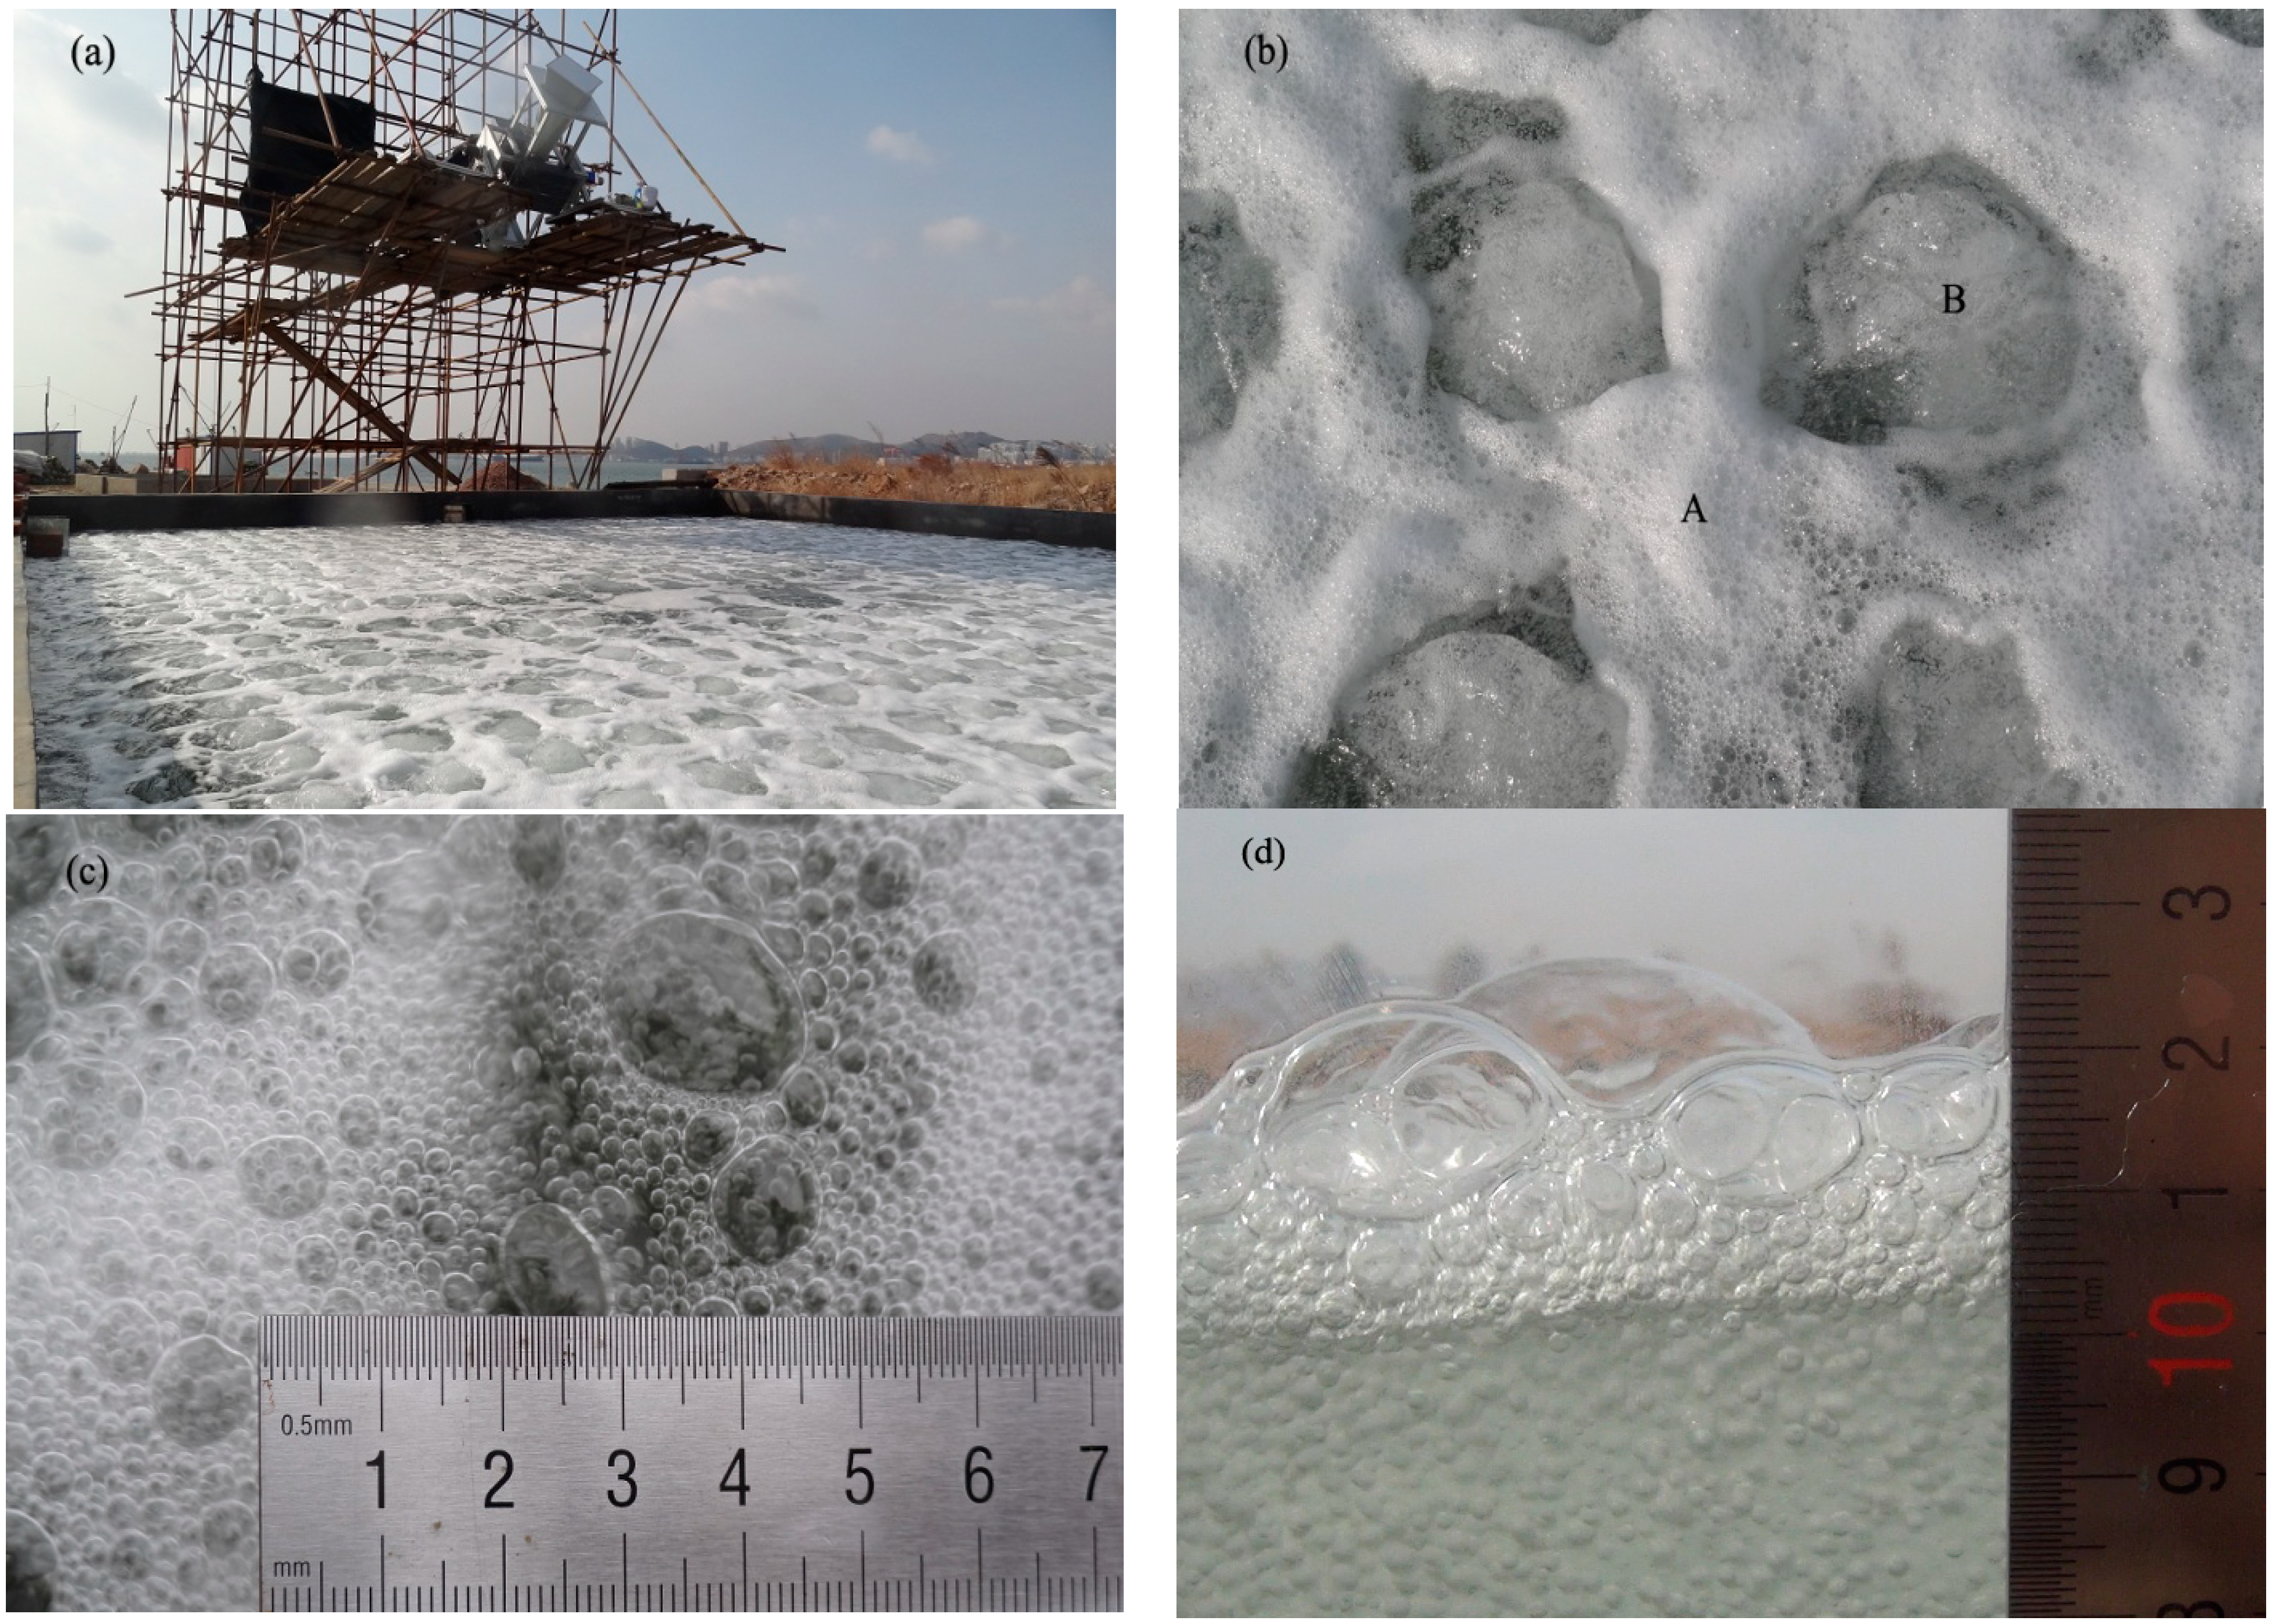 reached at antenna surface derived in the foam experiment, i.e., the sum of brightness temperatures of the foam generating region, seawater region, and the reflected sky and atmosphere downwelling radiation; (2) total brightness temperature of the sky and atmosphere downwelling radiation; (3) brightness temperature reached at antenna surface in the flat water surface experiment; (4) foam thickness, air bubble size, SSS and SST measured by video camera and A7CT sensors; (5) conductivities of the air-water mixture and seawater, used to estimate AVF faw of the air-water mixture; (6) emissivity , calculated by the Fresnel reflection coefficient and Equation (4); (7) the sum of w1 and w2, calculated by the antenna height above the water surface, incidence angle, and antenna solid angle; (8) the ratio of w1 to w2, estimated by analyzing photos of the foamy surfaces; (9) AVF of the foam layer, output by the theoretical emissivity models.
3. Experiment Description
for each experiment was used in Equation (3).4. Theoretical Emissivity Model
 of the foam-covered sea surface is calculated as

 of the foam-covered sea surface is calculated by
  . Here,
  is an attenuation factor, λ0 is the microwave wavelength in free space, and d and θi are the foam layer thickness and incidence angle, respectively.
  represents the Fresnel reflection coefficients from layers n to m:


| Model | LM | RM | MG |
|---|---|---|---|
| AVF fa | 0.8377 | 0.8883 | 0.9545 |
| RMSE H | 0.0079 | 0.0079 | 0.0083 |
| RMSE V | 0.0103 | 0.0109 | 0.0128 |
| RMSE H + V | 0.0182 | 0.0188 | 0.0211 |
5. Results and Discussion
5.1. Experimental Results and Theoretical Analyses
 , where the constant δ is film thickness of the water coating of an air bubble and b is the outer radius of a coated air bubble.
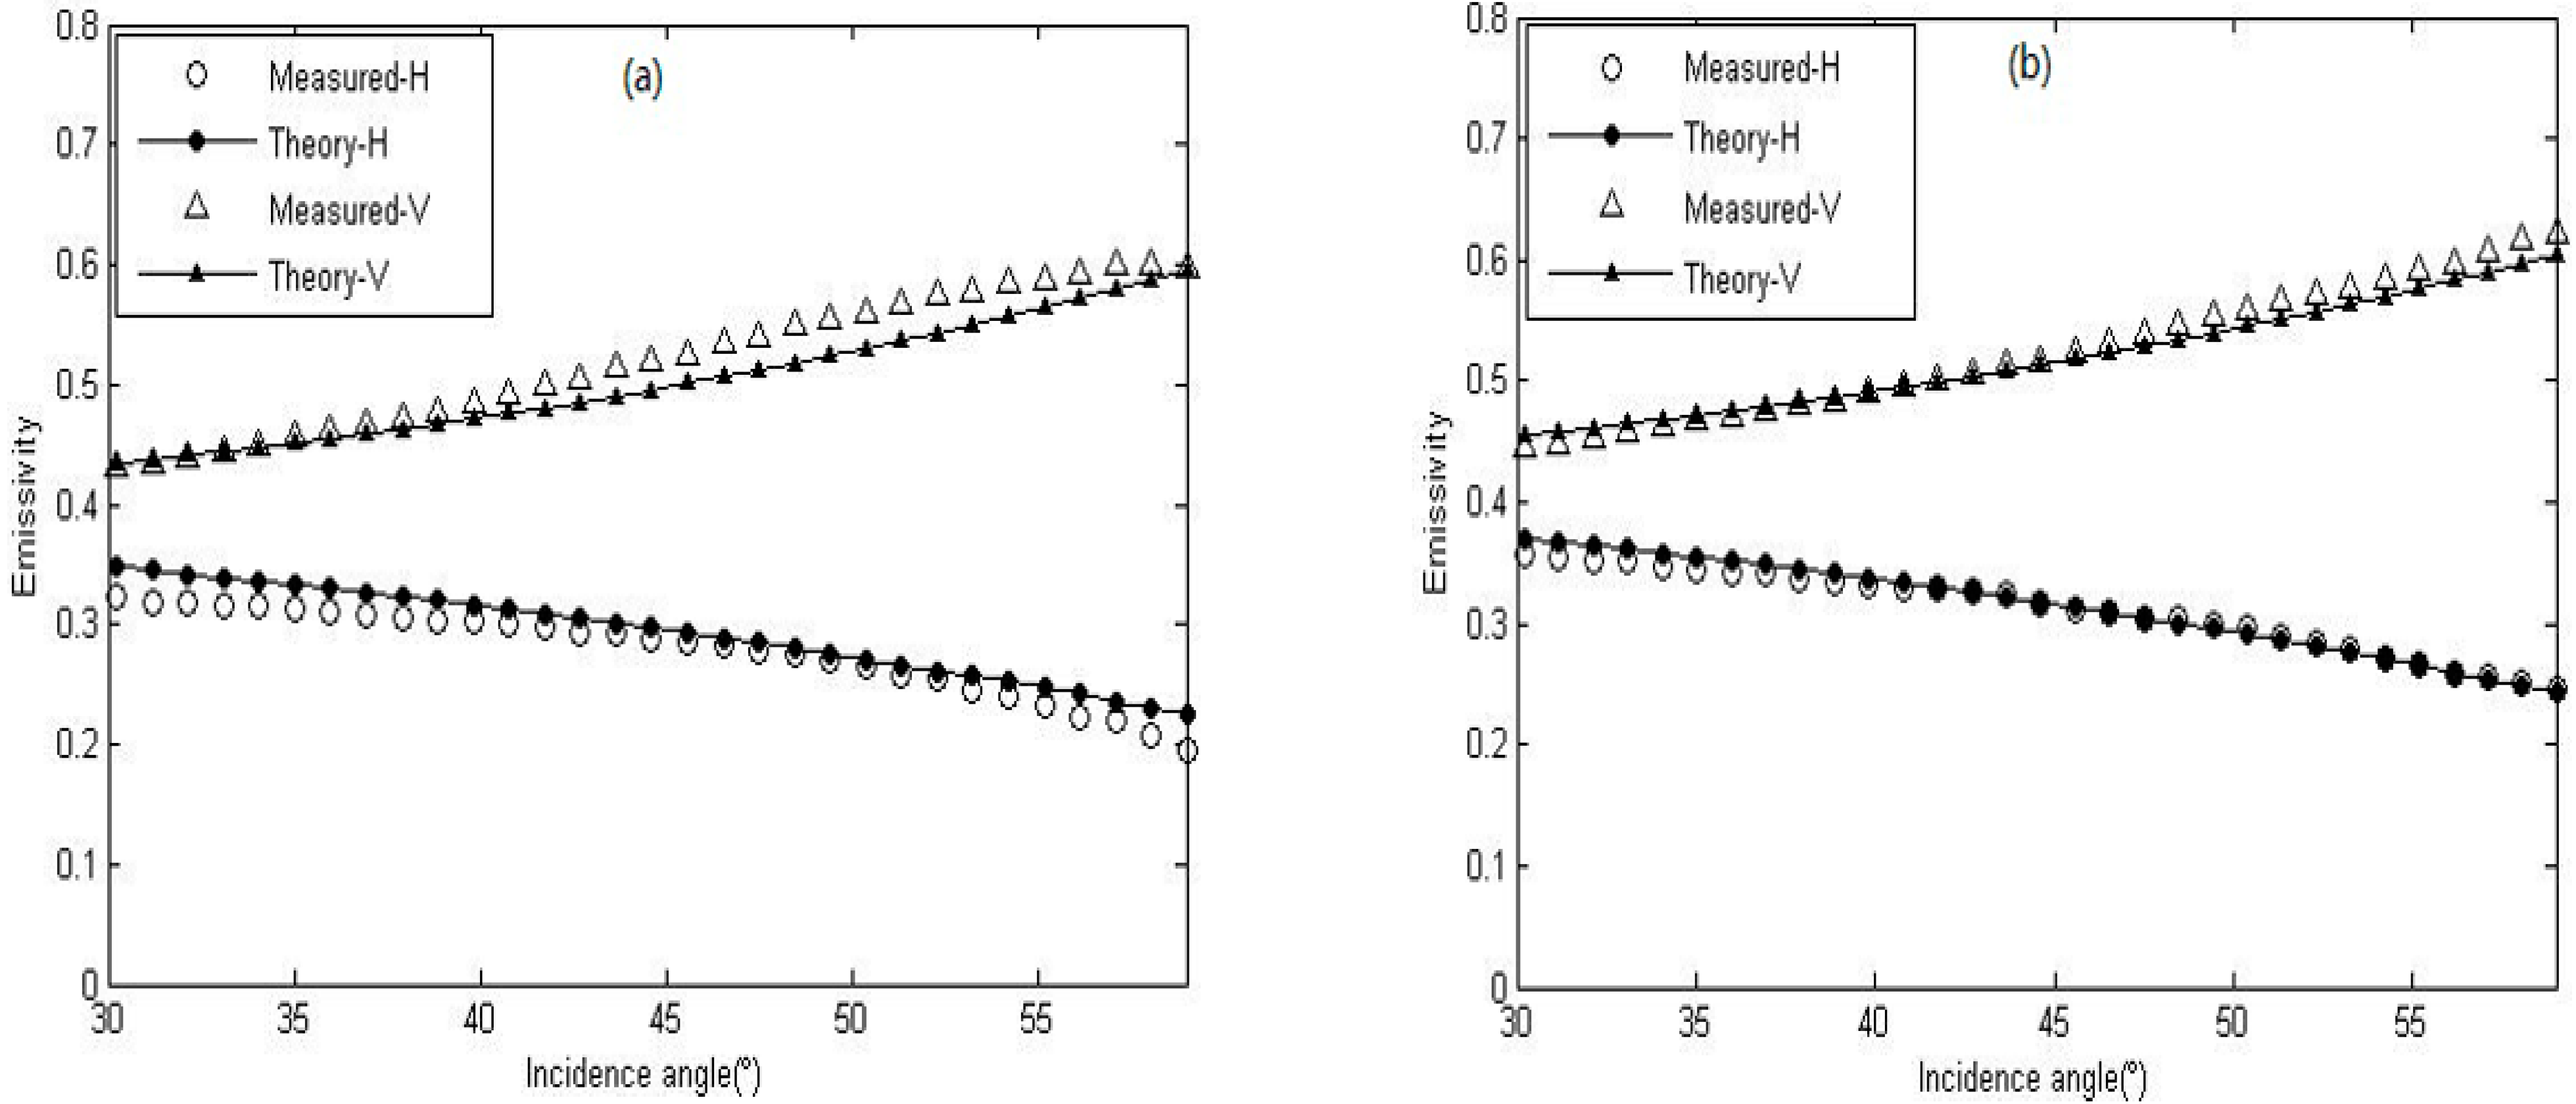
| Experiment | SSS (psu) | SST (°C) | AVF | Foam Thickness (cm) |
|---|---|---|---|---|
| Figure 2a | 31.23 | 1.66 | 0.9161 | 1.18 |
| Figure 2b | 31.71 | 0.20 | 0.9114 | 1.35 |
| Figure 2c | 32.50 | 1.56 | 0.9049 | 1.42 |
| Figure 2d | 32.76 | 0.92 | 0.9246 | 1.35 |
| Figure 2e | 33.63 | 1.52 | 0.9137 | 1.50 |
| Figure 2f | 34.66 | −1.43 | 0.8768 | 1.19 |
| Figure 2g | 36.50 | −1.00 | 0.8265 | 1.23 |
| Figure 2h | 37.74 | 0.11 | 0.8326 | 1.10 |

5.2. Emissivity Increments Induced by Foam Layer
 of foam-covered water surfaces were calculated with the measured emissivities. In Figure 5, for foam thickness 1 cm and SSS increasing from 31 to 38 psu, average emissivity increments increase from about 0.014 to 0.131 for H polarization and 0.022 to 0.150 for V polarization, respectively. This result is very similar to that of Camps’ experiment for higher SST [6]. However, with AVF and SST increase, the emissivity increments of both polarizations generally decrease for the foam thickness fixed at 1 cm. For this thickness in our experiments varying between 1.1 and 1.5 cm, the emissivity increments fluctuated around averages of 0.081 for H polarization and 0.089 for V polarization, under the influences of other foam factors. Therefore, interactions of foam factors such as AVF, foam thickness, SSS, and SST are also important in estimating the foam emissivity increments. These increments did not clearly depend on incidence angle.
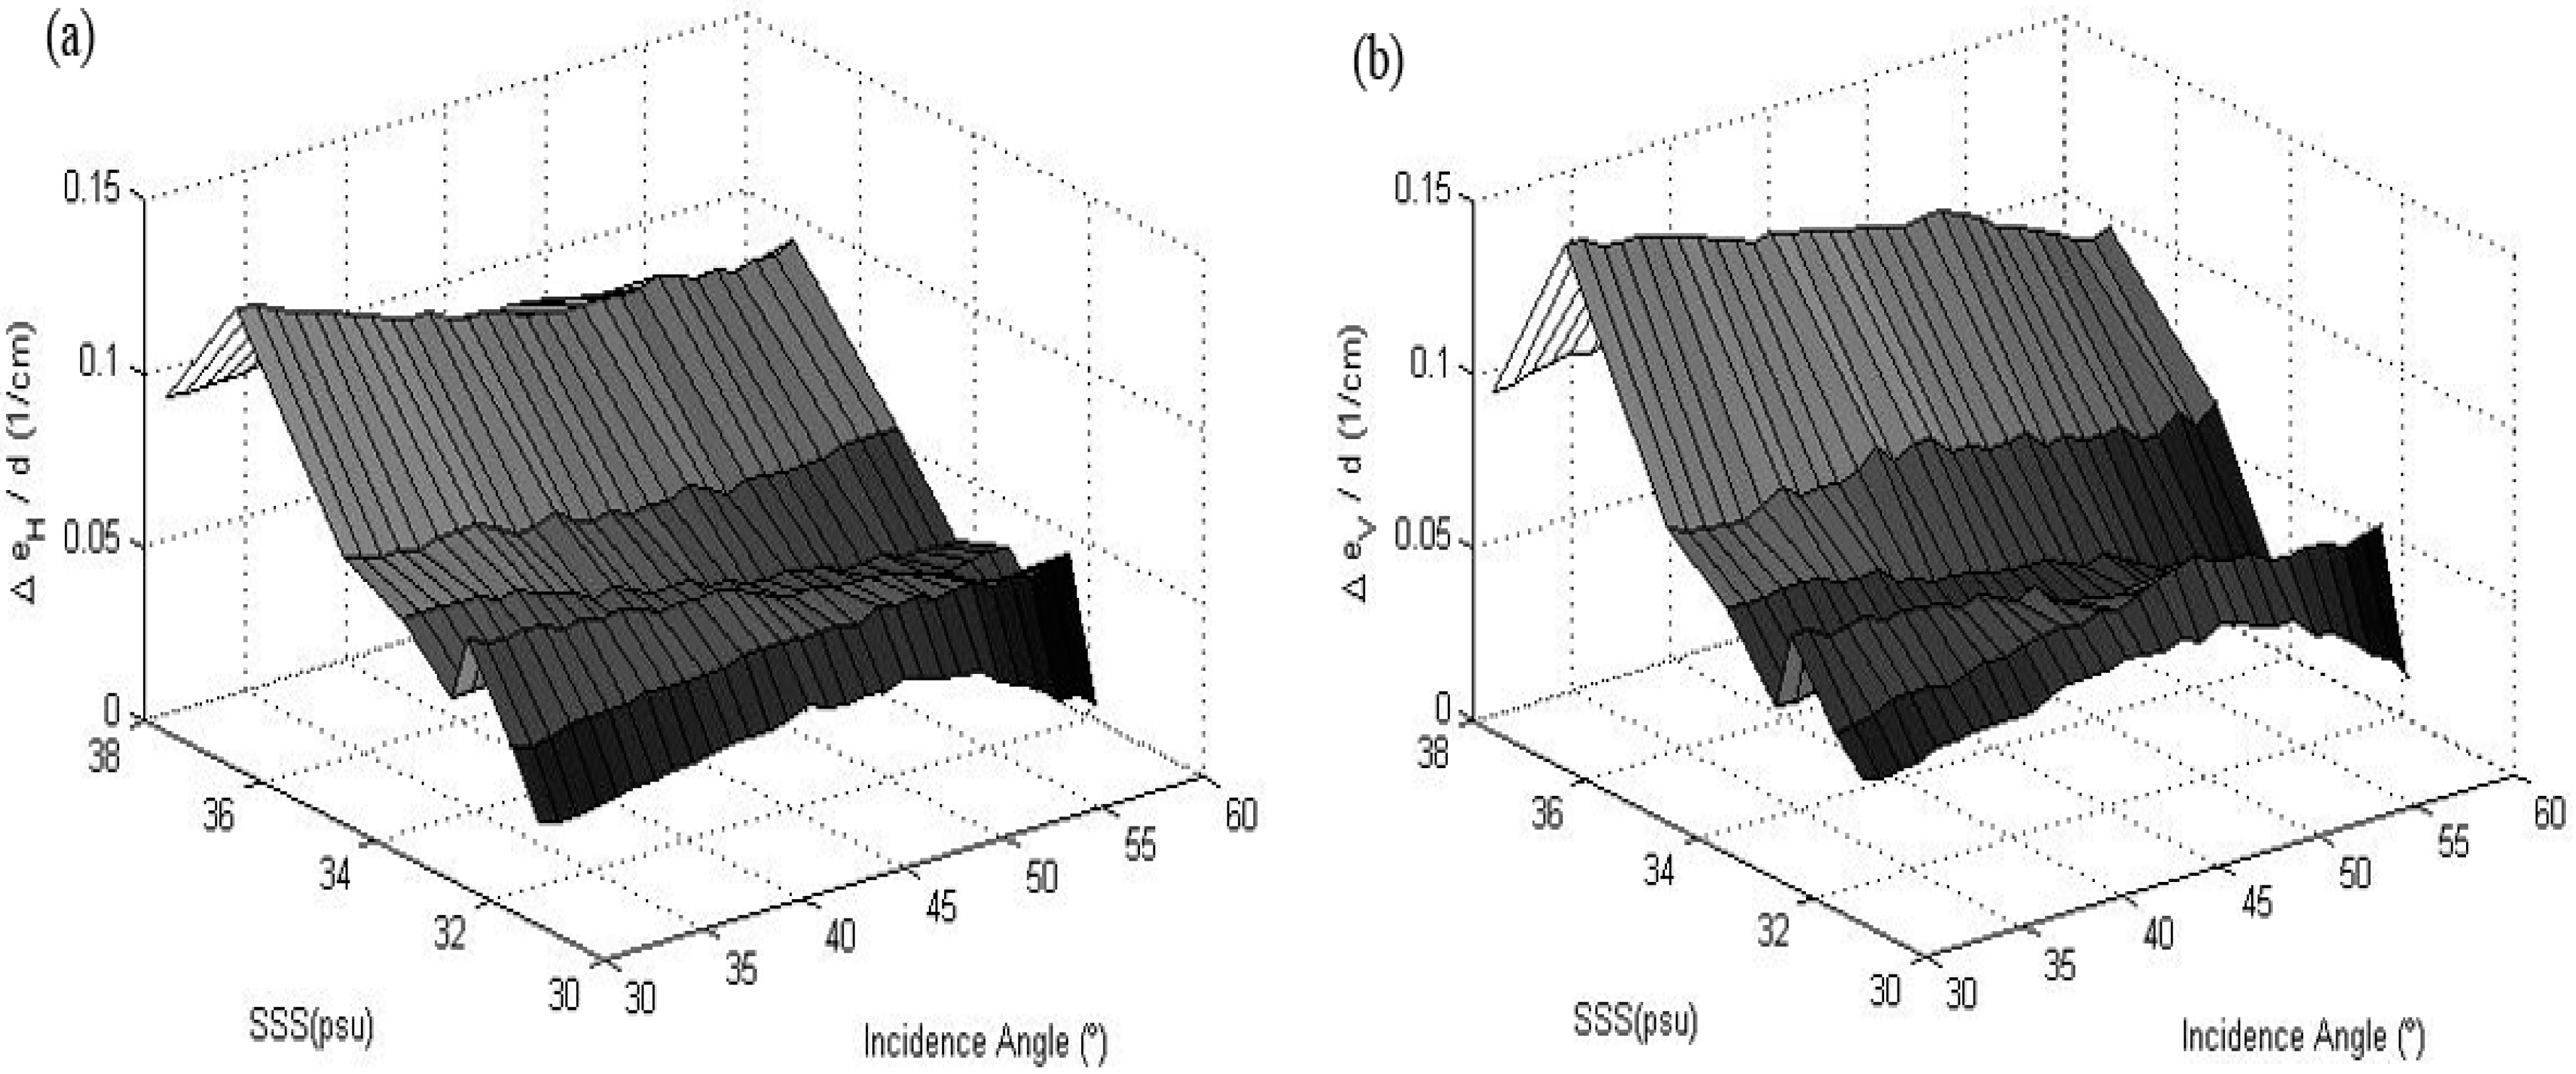
 induced by the meniscus at frequency 12 GHz, and the increments increased (or decreased) with frequencies increasing from 1 to 12 GHz (or from 12 to 25 GHz). However, emissivity increments
  induced by foam thickness of 1.3 cm had strong fluctuation with microwave frequency, with two maxima of emissivity increments, at 4 and 12 GHz. From the ratios of the emissivity increments
  to
to  varying with frequency, it was found that the meniscus made the largest contributions of 59% and 66% to the foam layer emissivity increments at 8 GHz for H and V polarizations, respectively. For frequencies higher than 20 GHz, the ratios were stable about 36% for H polarization and 45% for V polarization. However, at 1.4 GHz, the meniscus zone had a small fraction of foam emissivity increments, 7.8% and 8.6% for H and V polarizations, respectively. Generally, from the aforementioned findings, it is concluded that the meniscus transition zone has a stronger effect on foam emissivity increase for microwave frequency higher than 5 GHz. Nevertheless, for complex meniscus structures of a natural sea surface, its emissivity should be further investigated by theoretical and experimental methods.
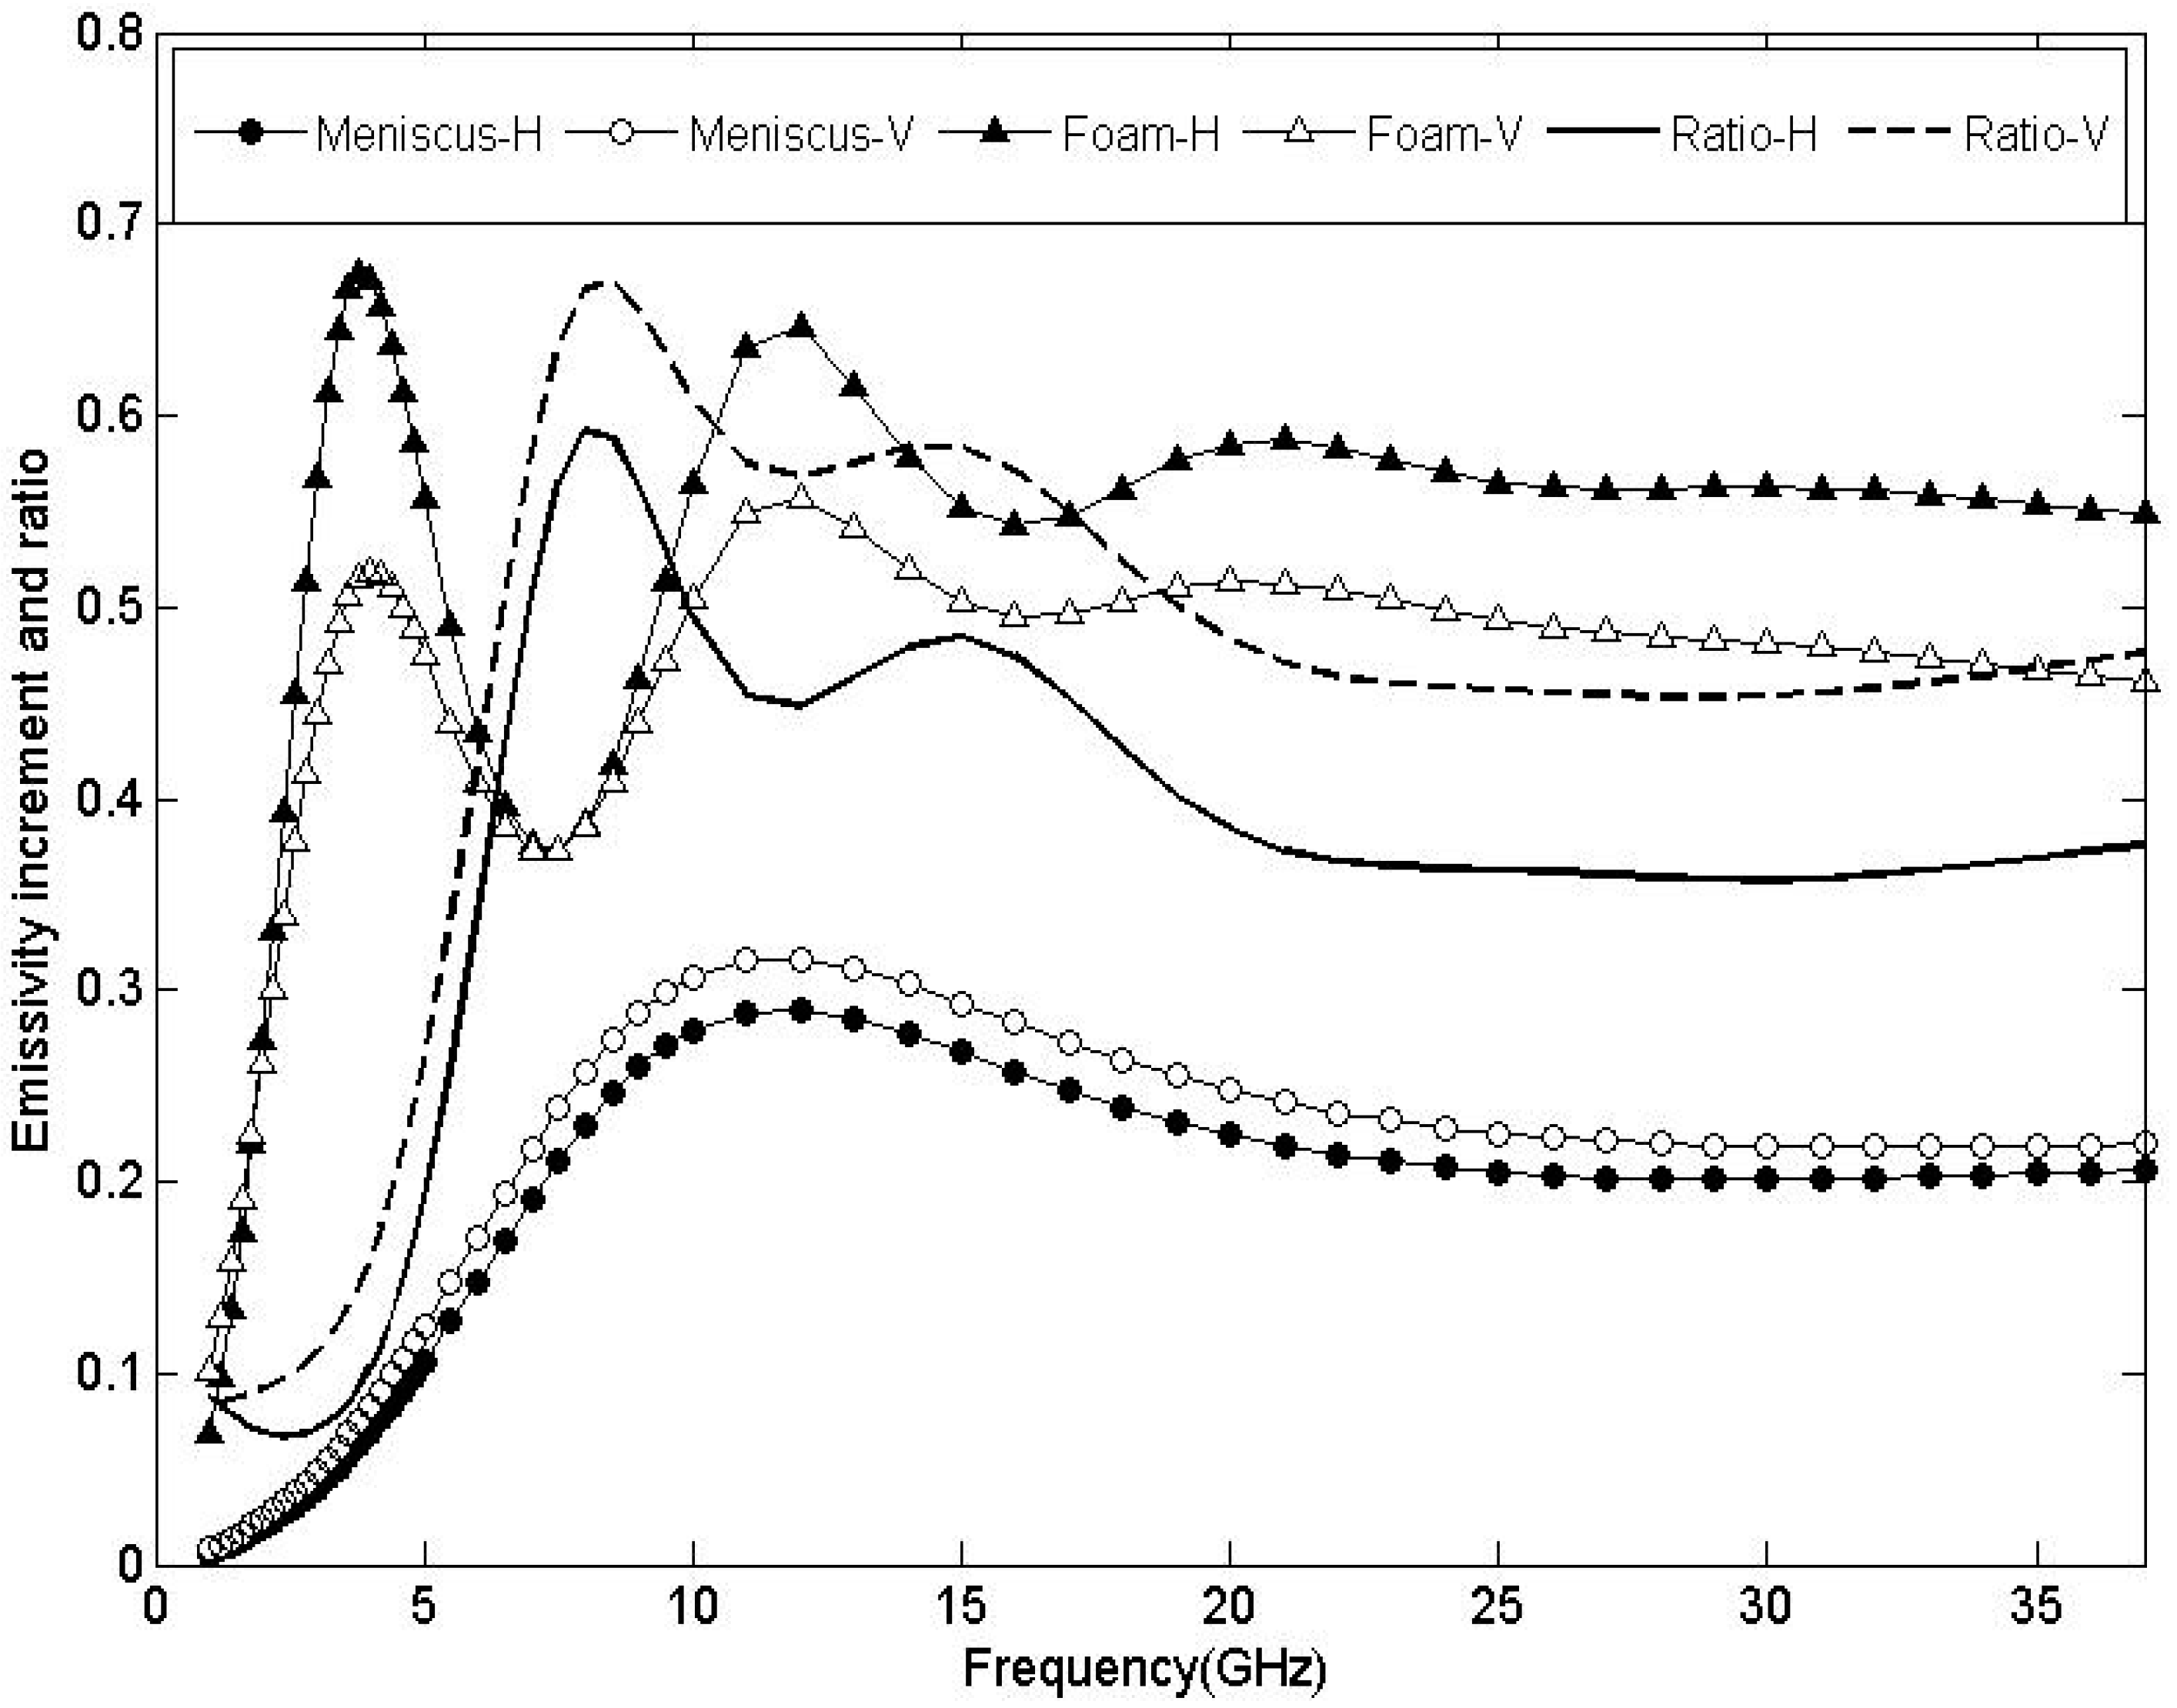
5.3. Effects of Foam Layer on Retrieving Sea Surface Salinity
 in our experiments were about 0.079 for H polarization and 0.083 for V polarization at incidence angle 44.6°. Brightness temperature errors induced by the foam layer were about 0.22 K for the H polarization model and 0.23 K for the V polarization model for w = 1%, (i.e., the second term on right side of Equation (11)). For the low SST of 1.52 °C and SSS = 33.63 psu, sensitivities of sea surface brightness temperatures to SSS were about 0.21 and 0.31 K/psu for H and V polarizations, respectively. Then, the SSS retrieval errors were about 1.0 and 0.74 psu for H and V polarization models of the flat sea surface, respectively. For comparison to the case of low SST, SSS retrieval errors of higher SST were estimated using the measured emissivity increments (0.098 for H polarization and 0.15 for V polarization) of Figure 11g in [6] for a foam-covered sea surface at incidence angle 45°, where SST = 18.7°C, SSS = 33.21 psu, and foam thickness = 1.665 cm. In this case, sensitivities of sea surface brightness temperatures to SSS were about 0.45 and 0.69 K/psu for H and V polarizations, respectively. For w = 1%, retrieval errors of SSS were around 0.64 and 0.63 psu for H and V polarizations, respectively. This result indicates that the effect of the foam layer on SSS retrieval with the low SST is greater than that of the high SST, owing to the weak sensitivity of sea surface brightness temperatures to SSS at the low SST. For a rough sea surface, emissivity of the flat surface can be replaced by that of a rough surface in Equation (11). This example indicates that the foam layer indeed generates a large error of SSS retrieval under high wind speeds and low SST, and should be considered in establishing a theoretical retrieval model of SSS. In addition, for the open ocean with high wind speeds, foam coverage fraction w is an important variable in retrieving SSS. From Equation (11), brightness temperature error ∆wTp induced by measured error ∆w of foam coverage fraction can be calculated with the term of
  (i.e.,
  ). The SSS retrieval error will be estimated by ∆wTp divided by sensitivities of sea surface brightness temperatures to SSS.
6. Conclusions
Acknowledgments
Author Contributions
Conflicts of Interest
References
- Font, J.; Lagerloef, G.; le Vine, D.; Camps, A.; Zanife, O. The determination of surface salinity with the European SMOS space mission. IEEE Trans. Geosci. Remote Sens. 2004, 42, 2196–2205. [Google Scholar]
- Lagerloef, G.; Colomb, F.R.; le Vine, D.; Went, Z.; Yueh, S.; Ruf, C.; Lilly, J.; Gunn, J.; Chao, Y.; deCharon, A.; et al. The Aquarius/SAC-D Mission: Designed to meet the salinity remote sensing challenge. Oceanography 2008, 21, 68–81. [Google Scholar]
- Anguelova, M.D. Complex dielectric constant of sea foam at microwave frequencies. J. Geophys. Res. 2008, 113, C08001. [Google Scholar]
- Tang, C.C.H. The effect of droplets in the air-sea transition zone on the sea brightness temperature. J. Phys. Oceanogr. 1974, 4, 579–593. [Google Scholar]
- Anguelova, M.D.; Gaiser, P.W. Microwave emissivity of sea foam layers with vertically inhomogeneous dielectric properties. Remote Sens. Environ. 2013, 139, 81–96. [Google Scholar]
- Camps, A.; Vall-Liossera, M.; Reul, N.; Chapron, B.; Corbella, I.; Duffo, N.; Torres, F. The emissivity of foam-covered water surface at L-band: Theoretical modeling and experimental results from the frog 2003 field experiment. IEEE Trans. Geosci. Remote Sens. 2005, 43, 925–937. [Google Scholar]
- Chen, D.; Tsang, L.; Zhou, L.; Reising, S.C.; Asher, W.E.; Rose, L.A.; Ding, K.H. Microwave emission and scattering of foam based on Monte Carlo simulations of dense media. IEEE Trans. Geosci. Remote Sens. 2003, 41, 782–789. [Google Scholar]
- Rose, L.A.; Asher, W.E.; Reising, S.C.; Gaiser, P.W.; Germain, K.M.; Dowgiallo, D.J.; Horgan, K.A.; Farquharson, G.; Knapp, E.J. Radiometric measurements of the microwave emissivity of foam. IEEE Trans. Geosci. Remote Sens. 2002, 40, 2619–2625. [Google Scholar]
- Wei, E.B. Microwave vector radiative transfer equation of a sea foam layer by the second-order Rayleigh approximation. Radio Sci. 2011, 46, RS5012–RS5013. [Google Scholar]
- Wei, E.B. Effective Medium approximation model of sea foam layer microwave emissivity of a vertical profile. Int. J. Remote Sens. 2013, 34, 1180–1193. [Google Scholar]
- Wei, E.B.; Liu, S.B.; Wang, Z.Z.; Liu, J.Y.; Dong, S. Emissivity measurements and theoretical model of foam-covered sea surface at C-band. Int. J. Remote Sens. 2014, 35, 1511–1525. [Google Scholar]
- Smith, P.M. The emissivity of sea foam at 19 and 37 GHz. IEEE Trans. Geosci. Remote Sens. 1988, 26, 541–547. [Google Scholar]
- Breward, C.J.W. The Mathematics of Foam. Ph.D. Thesis, University of Oxford, Oxford, UK, 1999. [Google Scholar]
- Podzimek, J. Size spectra of bubbles in the foam patches and of sea salt nuclei over the surf zone. Tellus 1984, 36, 192–202. [Google Scholar]
- Koehler, S.A.; Hilgenfeldt, S.; Stone, H.A. A generalized view of foam drainage: Experiment and theory. Langmuir 2000, 16, 6327–6341. [Google Scholar]
- Stogryn, A. The emissivity of sea foam at microwave frequencies. J. Geophys. Res. 1972, 77, 1658–1666. [Google Scholar]
- Guo, J.; Tsang, L; Asher, W.E.; Ding, K.H.; Chen, C.T. Applications of dense media radiative transfer theory for passive microwave remote sensing of foam covered ocean. IEEE Trans. Geosci. Remote Sens. 2001, 39, 1019–1027. [Google Scholar]
- Wei, E.B.; Liu, Y. Application of effective medium approximation theory to ocean remote sensing under wave breaking. Sci. China Ser. D Earth Sci. 2007, 50, 474–480. [Google Scholar]
- Wei, E.B.; Ge, Y. A microwave emissivity model of sea surface under wave breaking. Chin. Phys. 2005, 14, 1259–1264. [Google Scholar]
- Liu, S.B.; Wei, E.B.; Jia, Y.X. Estimating microwave emissivity of sea foam by Rayleigh method. J. Appl. Remote Sens. 2013, 7, 073598. [Google Scholar]
- Raizer, V.Y. Macroscopic foam-spray models for ocean microwave radiometry. IEEE Trans. Geosci. Remote Sens. 2007, 45, 3138–3144. [Google Scholar]
- Ding, K.H.; Mandt, C.; Tsang, L.; Kong, J.A. Monte Carlo simulations of pair distribution function of dense discrete random media with multiple sizes of particles. J. Electromagn. Waves Appl. 1992, 6, 1015–1030. [Google Scholar]
- Zhang, Y.; Yang, Y.E.; Kong, J.A. A composite model for estimation of polarimetric thermal emission from foam-covered wind-driven ocean surface. Prog. Electromagn. Res. 2002, 37, 143–190. [Google Scholar]
- Padmanabhan, S.; Reising, S.C.; Asher, W.E.; Rose, L.A.; Gaiser, P.W. Effects of foam on ocean surface microwave emission inferred from radiometric observations of reproducible breaking wave. IEEE Trans. Geosci. Remote Sens. 2006, 44, 569–583. [Google Scholar]
- Williams, G.F. Microwave emissivity measurements of bubbles and foam. IEEE Trans. Geosci. Electron. 1971, 9, 221–224. [Google Scholar]
- Militskii, Y.A.; Raizer, V.Y.; Sharkov, E.A.; Etkin, V.S. Thermal radio emission from foam structures. Sov. Phys.Tech. Phys. (Engl. Trans.) 1978, 23, 601–602. [Google Scholar]
- Boutin, J.; Martin, N.; Yin, X.B.; Font, J.; Reul, N.; Spurgeon, P. First assessment of SMOS data over open ocean: Part II Sea surface salinity. IEEE Trans. Geosci. Remote Sens. 2012, 50, 1662–1675. [Google Scholar]
- Yueh, S.H.; West, R.; Wilson, W.J.; Li, F.K.; Njoku, E.G.; Rahmat-Smii, Y. Error source and feasibility for microwave remote sensing of ocean surface salinity. IEEE Trans. Geosci. Remote Sens. 2001, 39, 1049–1060. [Google Scholar]
- Yueh, S.H.; Chaubell, J. Sea surface salinity and wind retrieval using combined passive and active L-band microwave observations. IEEE Trans. Geosci. Remote Sens. 2012, 50, 1022–1032. [Google Scholar]
- Garnett, J.C.M. Colours in Metal Glasses, in Metallic Films, and in Metallic Solution. Philos. Trans. R. Soc. A 1906, 205, 237–288. [Google Scholar]
- Blanch, S.; Aguasca, A. Dielectric permittivity measurements of sea water at L-band. In Proceedings of the First Results Workshop on EuroSTARRS, WISE, LOSAC Campaigns, Toulouse, France, 4–6 November 2002; Fletcher, p., Ed.; ESA Publications Division: Noordwijk, The Netherlands, 2003. ESA SP-525. pp. 137–141. [Google Scholar]
- Tsang, L.; Kong, J.A.; Ding, K.H. Scattering and emission by layered media. In Scattering of Electromagnetic Waves: Theories and Application; John Wiley & Sons: New York, NY, USA, 2000; pp. 203–207. [Google Scholar]
- Ulaby, F.T.; Moore, R.K.; Fung, A.K. Passive microwave sensing of the ocean. In Microwave Remote Sensing: Active and Passive; Artech House, Inc.: Dedham, MA, USA, 1986; Volume III, pp. 1440–1447. [Google Scholar]
- Wilheit, T.T. A model for the microwave emissivity of the ocean’s surface as a function of wind speed. IEEE Trans. Geosci. Electron. 1979, 17, 244–249. [Google Scholar]
- Anguelova, M.D.; Gaiser, P.W. Skin depth at microwave frequencies of sea foam layers with vertical profile of void fraction. J. Geophys. Res. 2011, 116, C11002. [Google Scholar]
- Monahan, E.C.; O’Muircheartaigh, I.G. Optimal power-law description of oceanic whitecap coverage dependence on wind speed. J. Phys. Oceanogr. 1980, 10, 2094–2099. [Google Scholar]
© 2014 by the authors; licensee MDPI, Basel, Switzerland. This article is an open access article distributed under the terms and conditions of the Creative Commons Attribution license (http://creativecommons.org/licenses/by/4.0/).
Share and Cite
Wei, E.-B.; Liu, S.-B.; Wang, Z.-Z.; Tong, X.-L.; Dong, S.; Li, B.; Liu, J.-Y. Emissivity Measurements of Foam-Covered Water Surface at L-Band for Low Water Temperatures. Remote Sens. 2014, 6, 10913-10930. https://doi.org/10.3390/rs61110913
Wei E-B, Liu S-B, Wang Z-Z, Tong X-L, Dong S, Li B, Liu J-Y. Emissivity Measurements of Foam-Covered Water Surface at L-Band for Low Water Temperatures. Remote Sensing. 2014; 6(11):10913-10930. https://doi.org/10.3390/rs61110913
Chicago/Turabian StyleWei, En-Bo, Shu-Bo Liu, Zhen-Zhan Wang, Xiao-Lin Tong, Shuai Dong, Bin Li, and Jing-Yi Liu. 2014. "Emissivity Measurements of Foam-Covered Water Surface at L-Band for Low Water Temperatures" Remote Sensing 6, no. 11: 10913-10930. https://doi.org/10.3390/rs61110913