Article

A Comparative Analysis between GIMSS NDVIg and NDVI3g for Monitoring Vegetation Activity Change in the Northern Hemisphere during 1982–2008

1
State Key Laboratory of Earth Surface Processes and Resource Ecology, Beijing Normal University, Beijing 100875, China
2
College of Resources Science & Technology, Beijing Normal University, Beijing 100875, China
3
Environmental Sciences Division, Oak Ridge National Laboratory, Oak Ridge, TN 37831, USA
*
Author to whom correspondence should be addressed.
Remote Sens. 2013, 5(8), 4031-4044; https://doi.org/10.3390/rs5084031
Submission received: 9 June 2013 / Revised: 18 July 2013 / Accepted: 6 August 2013 / Published: 12 August 2013
(This article belongs to the Special Issue Monitoring Global Vegetation with AVHRR NDVI3g Data (1981-2011))

Abstract

:
The long-term Normalized Difference Vegetation Index (NDVI) time-series data set generated from the Advanced Very High Resolution Radiometers (AVHRR) has been widely used to monitor vegetation activity change. The third version of NDVI (NDVI3g) produced by the Global Inventory Modeling and Mapping Studies (GIMMS) group was released recently. The comparisons between the new and old versions should be conducted for linking existing studies with future applications of NDVI3g in monitoring vegetation activity change. Based on simple and piecewise linear regression methods, this study made a comparative analysis between NDVIg and NDVI3g for monitoring vegetation activity change and its responses to climate change in the middle and high latitudes of the Northern Hemisphere during 1982–2008. Our results indicated that there were large differences between NDVIg and NDVI3g in the spatial patterns for both the overall changing trends and the timing of Turning Points (TP) in NDVI time series, which spread over almost the entire study region. The average NDVI trend from NDVI3g was almost twice as great as that from NDVIg and the detected average timing of TP from NDVI3g was about one year later. Although the general spatial patterns were consistent between two data sets for detecting the responses of growing-season NDVI to temperature and precipitation changes, there were large differences in the response magnitude, with a higher response magnitude to temperature in NDVI3g and an opposite response to precipitation change for the two data sets. These results demonstrated that the NDVIg data set may underestimate the vegetation activity change trend and its response to climate change in the middle and high latitudes of the Northern Hemisphere during the past three decades.

1. Introduction

Vegetation plays an important role in the global carbon cycle [1]. It has been proven that vegetation activity change was closely related to the growth rate of atmospheric CO2 [2]. Therefore, the monitoring of vegetation activity change is crucial not only for assessing ecosystem responses to climate change but also for examining the carbon exchange between the biosphere and the atmosphere.
The terrestrial ecosystems in the Northern Hemisphere play a significant role in slowing down the atmospheric accumulation of anthropogenic CO2 [3,4]. However, the magnitude and location of the sink of CO2 show large uncertainties [5,6], which lead to continuous researches focusing on monitoring vegetation activity change in the middle and high latitudes of the Northern Hemisphere. There are many investigations about the interannual variation in vegetation activity over the middle and high latitudes of the Northern Hemisphere based on the satellite-derived long-term records of Normalized Difference Vegetation Index (NDVI) data sets [711]. The vegetation activity in the northern middle and high latitudes demonstrated a consistent increasing trend according to the studies with the Global Inventory Monitoring and Modeling Studies (GIMMS) group produced NDVI data sets during 1981–1991 [12] and 1981–1999 [7]. However, this monotonic increasing trend in vegetation activity may be interrupted by abrupt or Turning Points (TP). For example, the research using a prolonged growing season (April to October) GIMMS NDVI data records (i.e., 1982–2006) demonstrated that the temperate and boreal Eurasia experienced a reversed trend from 1997 to 2006 though a significantly increasing trend was still observed during 1982–1997 [13].
The satellite-derived Vegetation Index (VI) data sets are important for monitoring vegetation activity change at large spatial scales (e.g., at regional or global scale), but the discrepancies in different VI data sets could get completely different results [14,15]. For example, Saleska et al. [8] demonstrated that the Amazon rainforests greened up during the 2005 drought when they investigated the changes in vegetation activity using the Collection 4 Enhanced Vegetation Index (EVI) product, while Samanta et al. [10] found there was no clear green-up in the 2005 drought in the Amazon rainforests when using the improved Collection 5 EVI product. Recently, the latest version of the GIMMS NDVI data set (NDVI3g) was released, which has better overall calibration and post processing normalizations. The GIMMS NDVI3g specifically aims to improve data quality in the high latitudes [16] and is better suited to study vegetation activity change in northern ecosystems [17]. Therefore, it is imperative to compare the latest GIMMS NDVI3g with the old GIMMS NDVIg version in monitoring vegetation activity change in the middle and high latitudes of the Northern Hemisphere.
This study aims to compare the two generation GIMMS NDVI data sets (i.e., NDVI3g and NDVIg) for monitoring vegetation activity variation over the middle and high latitudes of the Northern Hemisphere (30–90°N) during 1982–2008. Using the simple and piecewise linear regression methods, we explored the differences and similarities between the two GIMMS NDVI data sets for the overall changing trends, the timing of TP, and the responses of vegetation activity to climate change. Our hypotheses are: (1) that the two different NDVI data sets may have large discrepancies in monitoring vegetation activity change (e.g., the spatial patterns in the overall changing trends and the timing of TP in NDVI time series), and (2) that the response of vegetation activity to climate change may be different in its spatial patterns and response magnitudes when using two different NDVI data sets. The results of our study can provide an evaluation of the performance of these different NDVI data sets for monitoring vegetation activity change.

2. Data and Methods

2.1. Data and Processing

2.1.1. NDVI Data

The two versions of NDVI data sets (i.e., NDVIg and NDVI3g) were both obtained from the GIMMS group. The NDVIg data was from July 1981 to December 2008 with a spatial resolution of 0.072 degree and a temporal interval of 15 days, while the NDVI3g data had a spatial resolution of 0.083 degree with a 15-day temporal interval and was extended to December 2011. In order to match the climate data, we aggregated the original resolution (0.072 or 0.083 degree) to half degree by calculating the average of the included grid cells. The monthly NDVI was generated with the maximum value composite method [18]. The growing-season NDVI was calculated by the average monthly NDVI from April to October in each calendar year [13]. Since the data in 1981 did not cover an entire year and the two data sets had different temporal coverage, we only focused on the overlapping study period from January 1982 to December 2008 for NDVIg and NDVI3g.
Only the vegetated area in the middle and high latitudes (30–90°N) of the Northern Hemisphere were analyzed in this study. The vegetated area was extracted from the NDVI3g data with two criteria: (1) each NDVI value during June to August was greater than 0.1 in all years and (2) the average NDVI value during June to August was greater than 0.3 in all years [7]. Figure 1 demonstrated the identified vegetated area in this study.

2.1.2. Climate Data

The monthly temperature and precipitation data sets were provided by the Climatic Research Unit (CRU) at University of East Anglia. The current version 3.20 had a spatial resolution of half degree and covered the period 1901–2011. We extracted the monthly climate data in the same period with the NDVI time series (i.e., 1982–2008). The growing-season temperature was computed as the average monthly temperature from April to October, while the growing-season precipitation was calculated as the total monthly precipitation from April to October.

2.2. Methods

A simple linear regression method was used to retrieve the long-term trend in the interannual variations of NDVI (i.e., year as the independent variable and NDVI as the dependent variable). A piecewise linear regression [19] was used to investigate whether there were TPs in the growing-season NDVI time series for each grid cell during the study period (i.e., 1982–2008). Since the study period was not long enough (27 years) and many previous studies also indicated that only one TP occurred around the 1990s [9,11], we assumed that there was only one TP during the given period and confined the timing of TP in the middle piece of the study period by excluding the first and last five years in order to avoid too few data points in the linear regression. Since the piecewise linear regression will always have smaller residual error compared with the overall linear regression, we applied the Akaike information criterion (AIC) [20,21] to evaluate the necessity of introducing TP. If the information criterion of the piecewise linear regression model was smaller than that of the overall linear regression model, a TP was introduced for the NDVI time series.
The response of NDVI to temperature/precipitation change was expressed as the linearly regressed slope of NDVI against temperature/precipitation for each pixel. Statistical significance testing at the 0.05 level for linear regression was conducted by the F-test. It should be noted that since the data in the study were all latitude-longitude gridded, each pixel should be area-weighted with the square root of cosine of latitude to get equal area before statistical analysis [22].

3. Results and Discussion

3.1. Differences in the Interannual Variations of Vegetation Activity

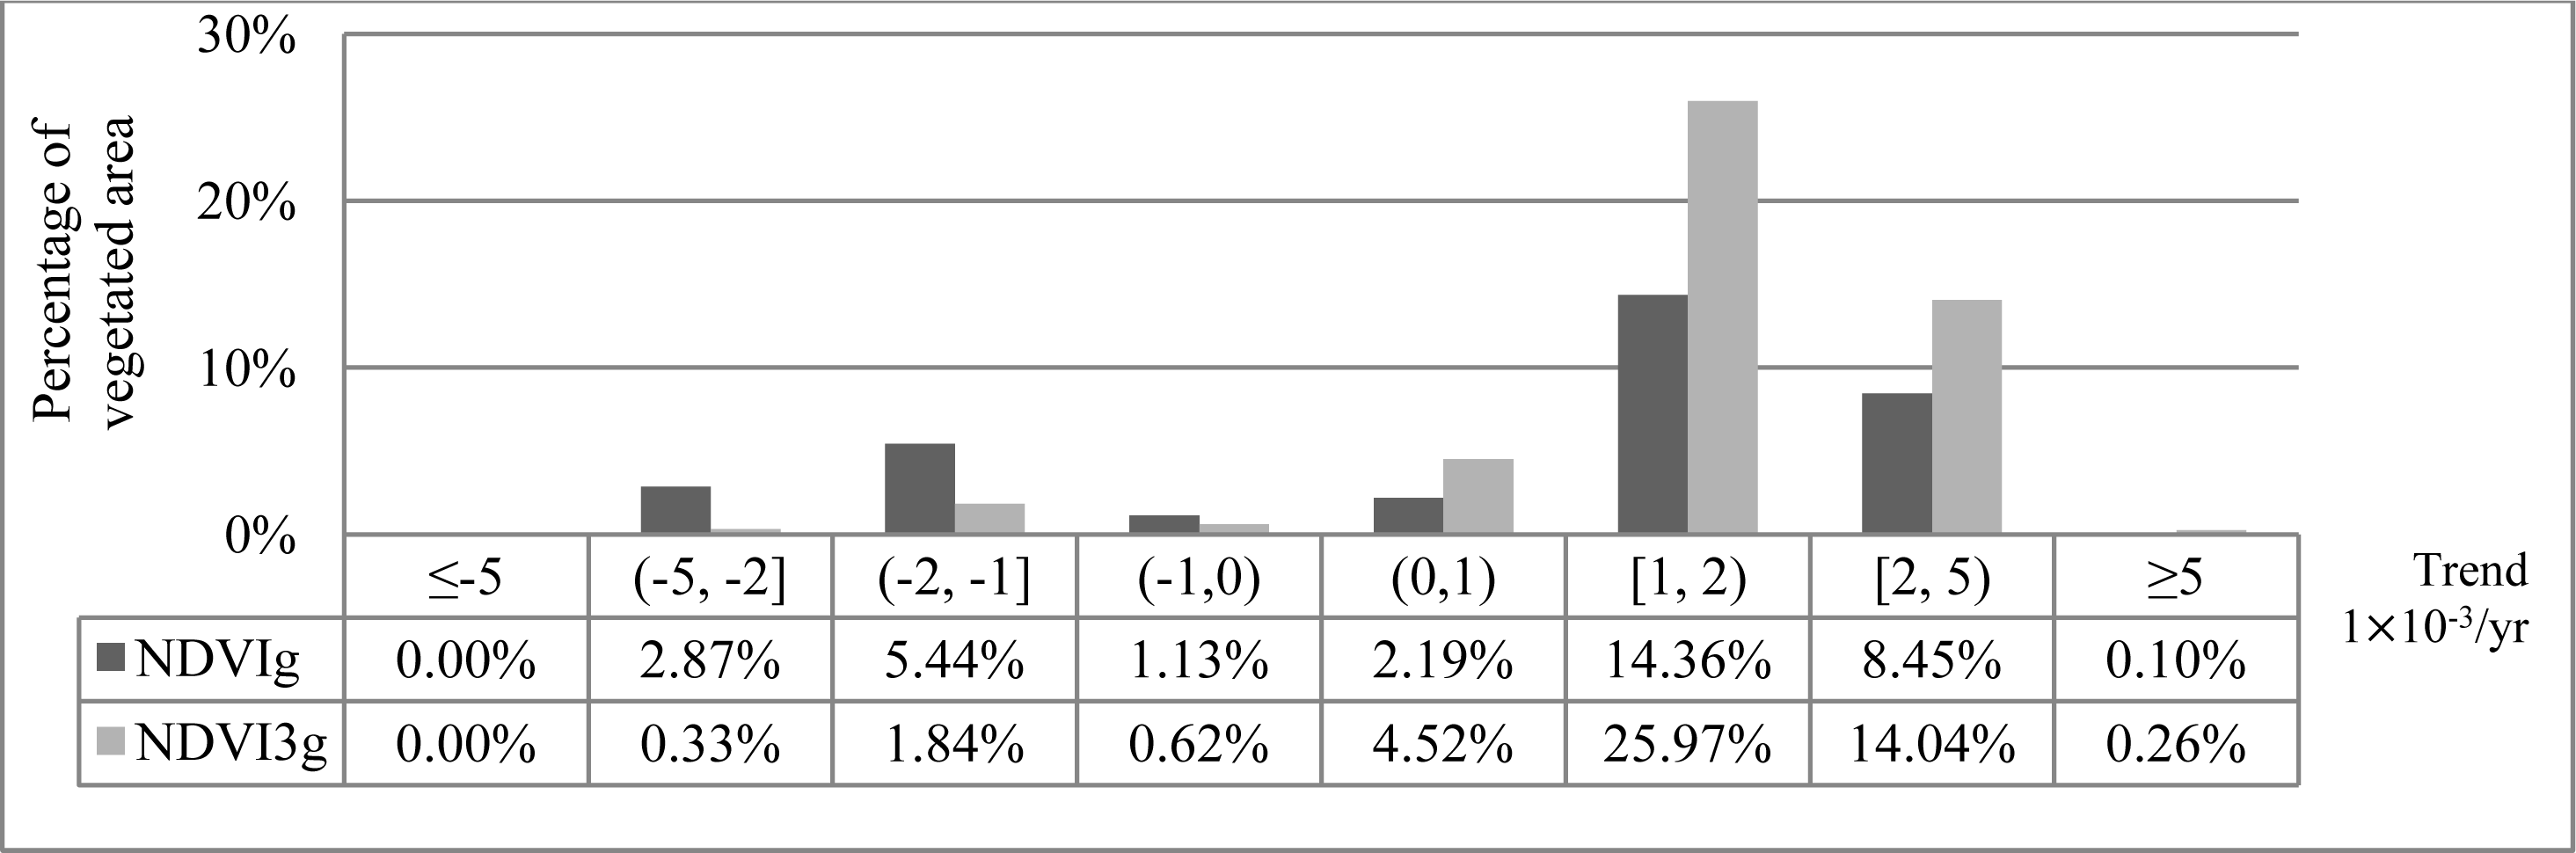
3.1.1. Overall Changing Trends in NDVI Time Series

NDVIg data showed a larger proportion of increasing trends (62.9%) and a smaller proportion of decreasing trends (37.1%) in growing-season NDVI during 1982–2008 (Figures 2a and 3). The pixels with a significant increasing trend (25.1%) spread over northern Alaska, southern and eastern Canada, central Europe and eastern Russia, while those with a significantly decreasing trend (9.4%) were mainly distributed in southern Alaska, western Canada and northern Russia (Figure 2a). The area-weighted average for all significantly changing trends in NDVIg was 0.00085 yr−1, the average for significantly increasing trends was 0.00183 yr−1 and the average for significantly decreasing trends was −0.00176 yr−1. NDVI3g demonstrated an even larger proportion of increasing trends (81.7%) and smaller proportion of decreasing trends (18.3%) in growing-season NDVI (Figures 2b and 3). The pixels with significantly increasing trends (44.8%) were distributed in northern Alaska, northwestern and southern Canada, entire Europe, western and eastern Russia, and central China, while those with significantly decreasing trends (2.8%) were mainly scattered over Canada, central Russia and northeastern China (Figure 2b). The area-weighted average for all significantly changing trends in NDVI3g was 0.00161 yr−1, the average for significantly increasing trends was 0.0018 yr−1, and the average for significantly decreasing trends was −0.0014 yr−1.
Both NDVIg and NDVI3g had more pixels for increasing trends than for decreasing trends in growing-season NDVI during 1982–2008 (Figure 2 and 3). Over 70% of the pixels showed the consistent overall changing trends for both data sets (i.e., both NDVIg and NDVI3g showed increasing or decreasing trends); however, a large difference in spatial distribution patterns was found (Figure 4). The discrepancies spread over almost the entire study region and were particularly evident in Alaska, Canada, northern Russia, northern Europe, and central China. NDVI3g showed a stronger increasing trend than NDVIg in most regions except in southern and eastern Canada (Figures 2 and 4). A 70% less area with significantly decreasing trends and 78% more area with significantly increasing trends were detected in NDVI3g as compared to NDVIg. The area-weighted average for the significantly increasing trends were similar between both data sets, while the area-weighted average for the significantly decreasing trends from NDVI3g was 20.45% less than that from NDVIg. The area-weighted averages for all significant trends were positive for both data sets, but the trend from NDVI3g was almost twice as great as that from NDVIg. NDVI3g and NDVIg also differed in the average values (0.56 vs. 0.49) and the overall changing trends (0.0009 yr−1vs. 0.0004 yr−1) for the area-weighted average growing-season NDVI during 1982–2008. The large differences in the high latitudes (especially in the areas greater than 60°N) of the Northern Hemisphere may be because the data quality in NDVI3g in the high latitudes was explicitly improved in calibrations and post-processing normalizations [16]. The dramatic changes over Russia around 75°N were caused by the artificial discontinuity of NDVIg data, because NDVIg used SPOT sensor data for intercalibration while NDVI3g corrected these abnormal values using SeaWiFS sensor data [17,23].

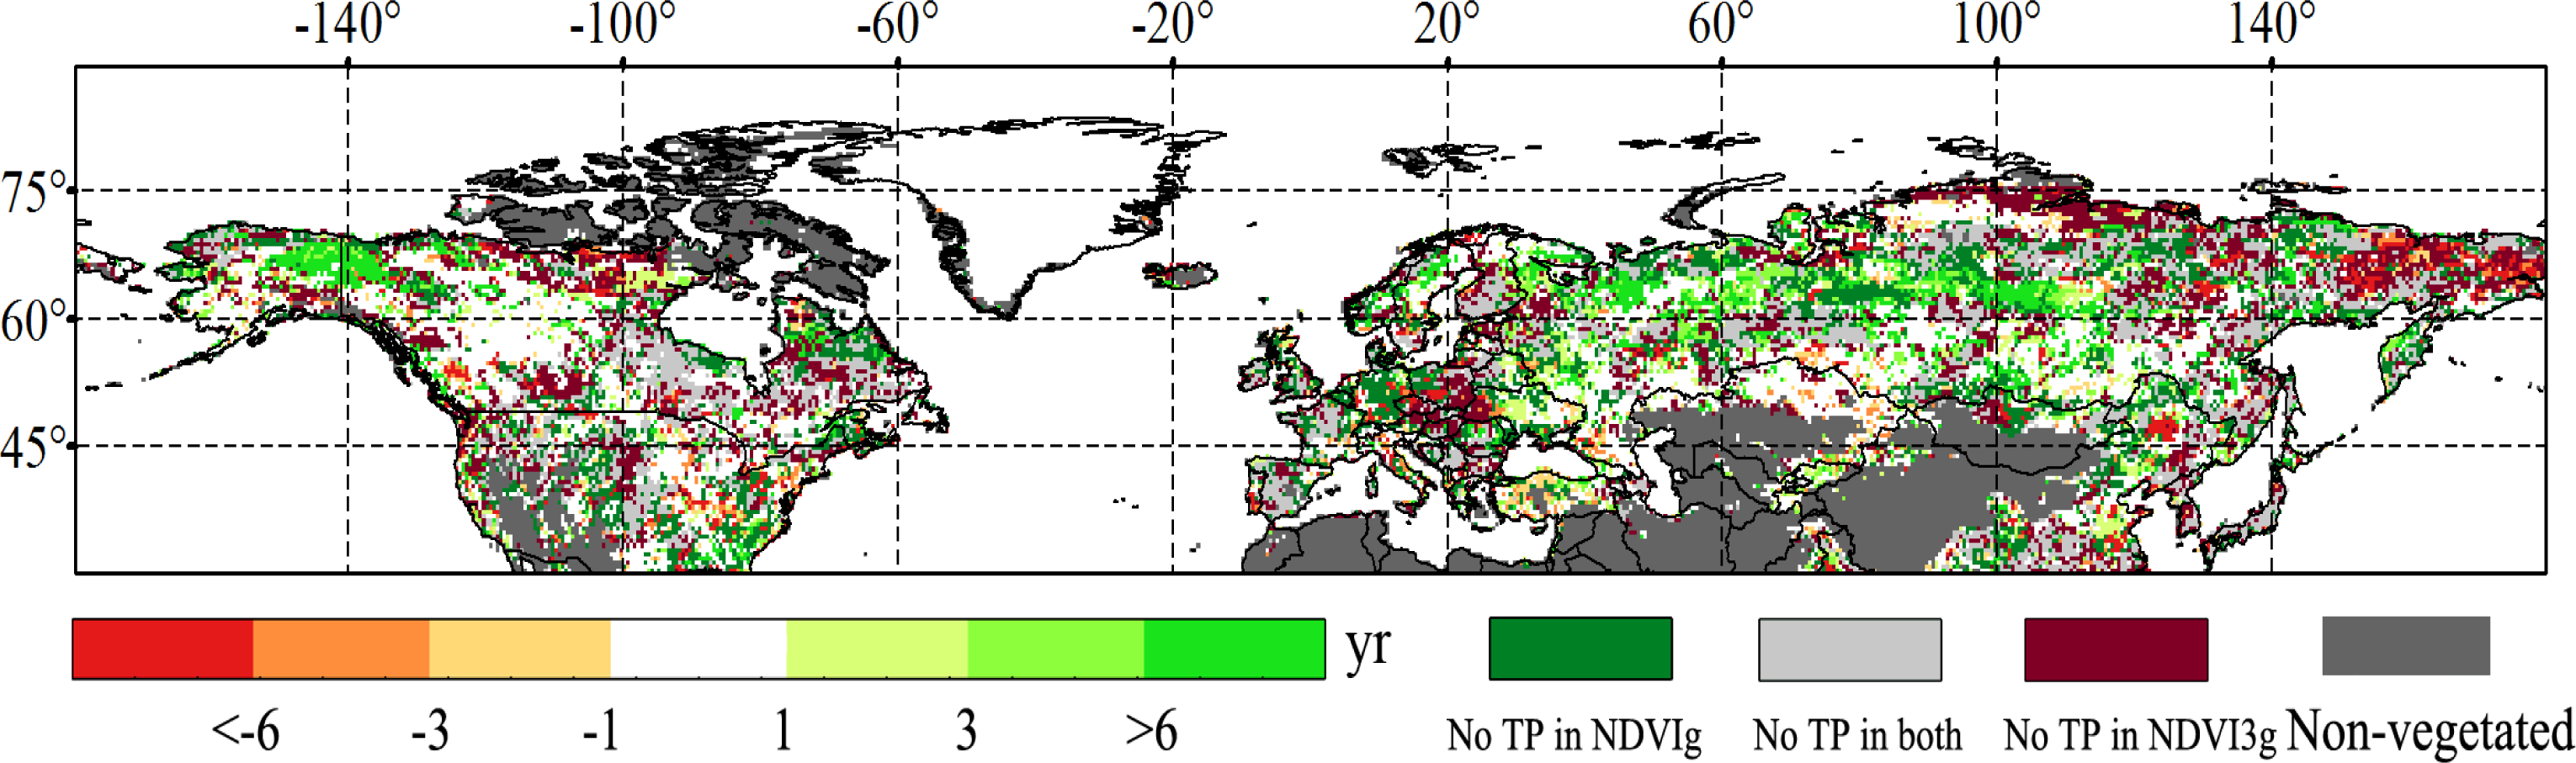
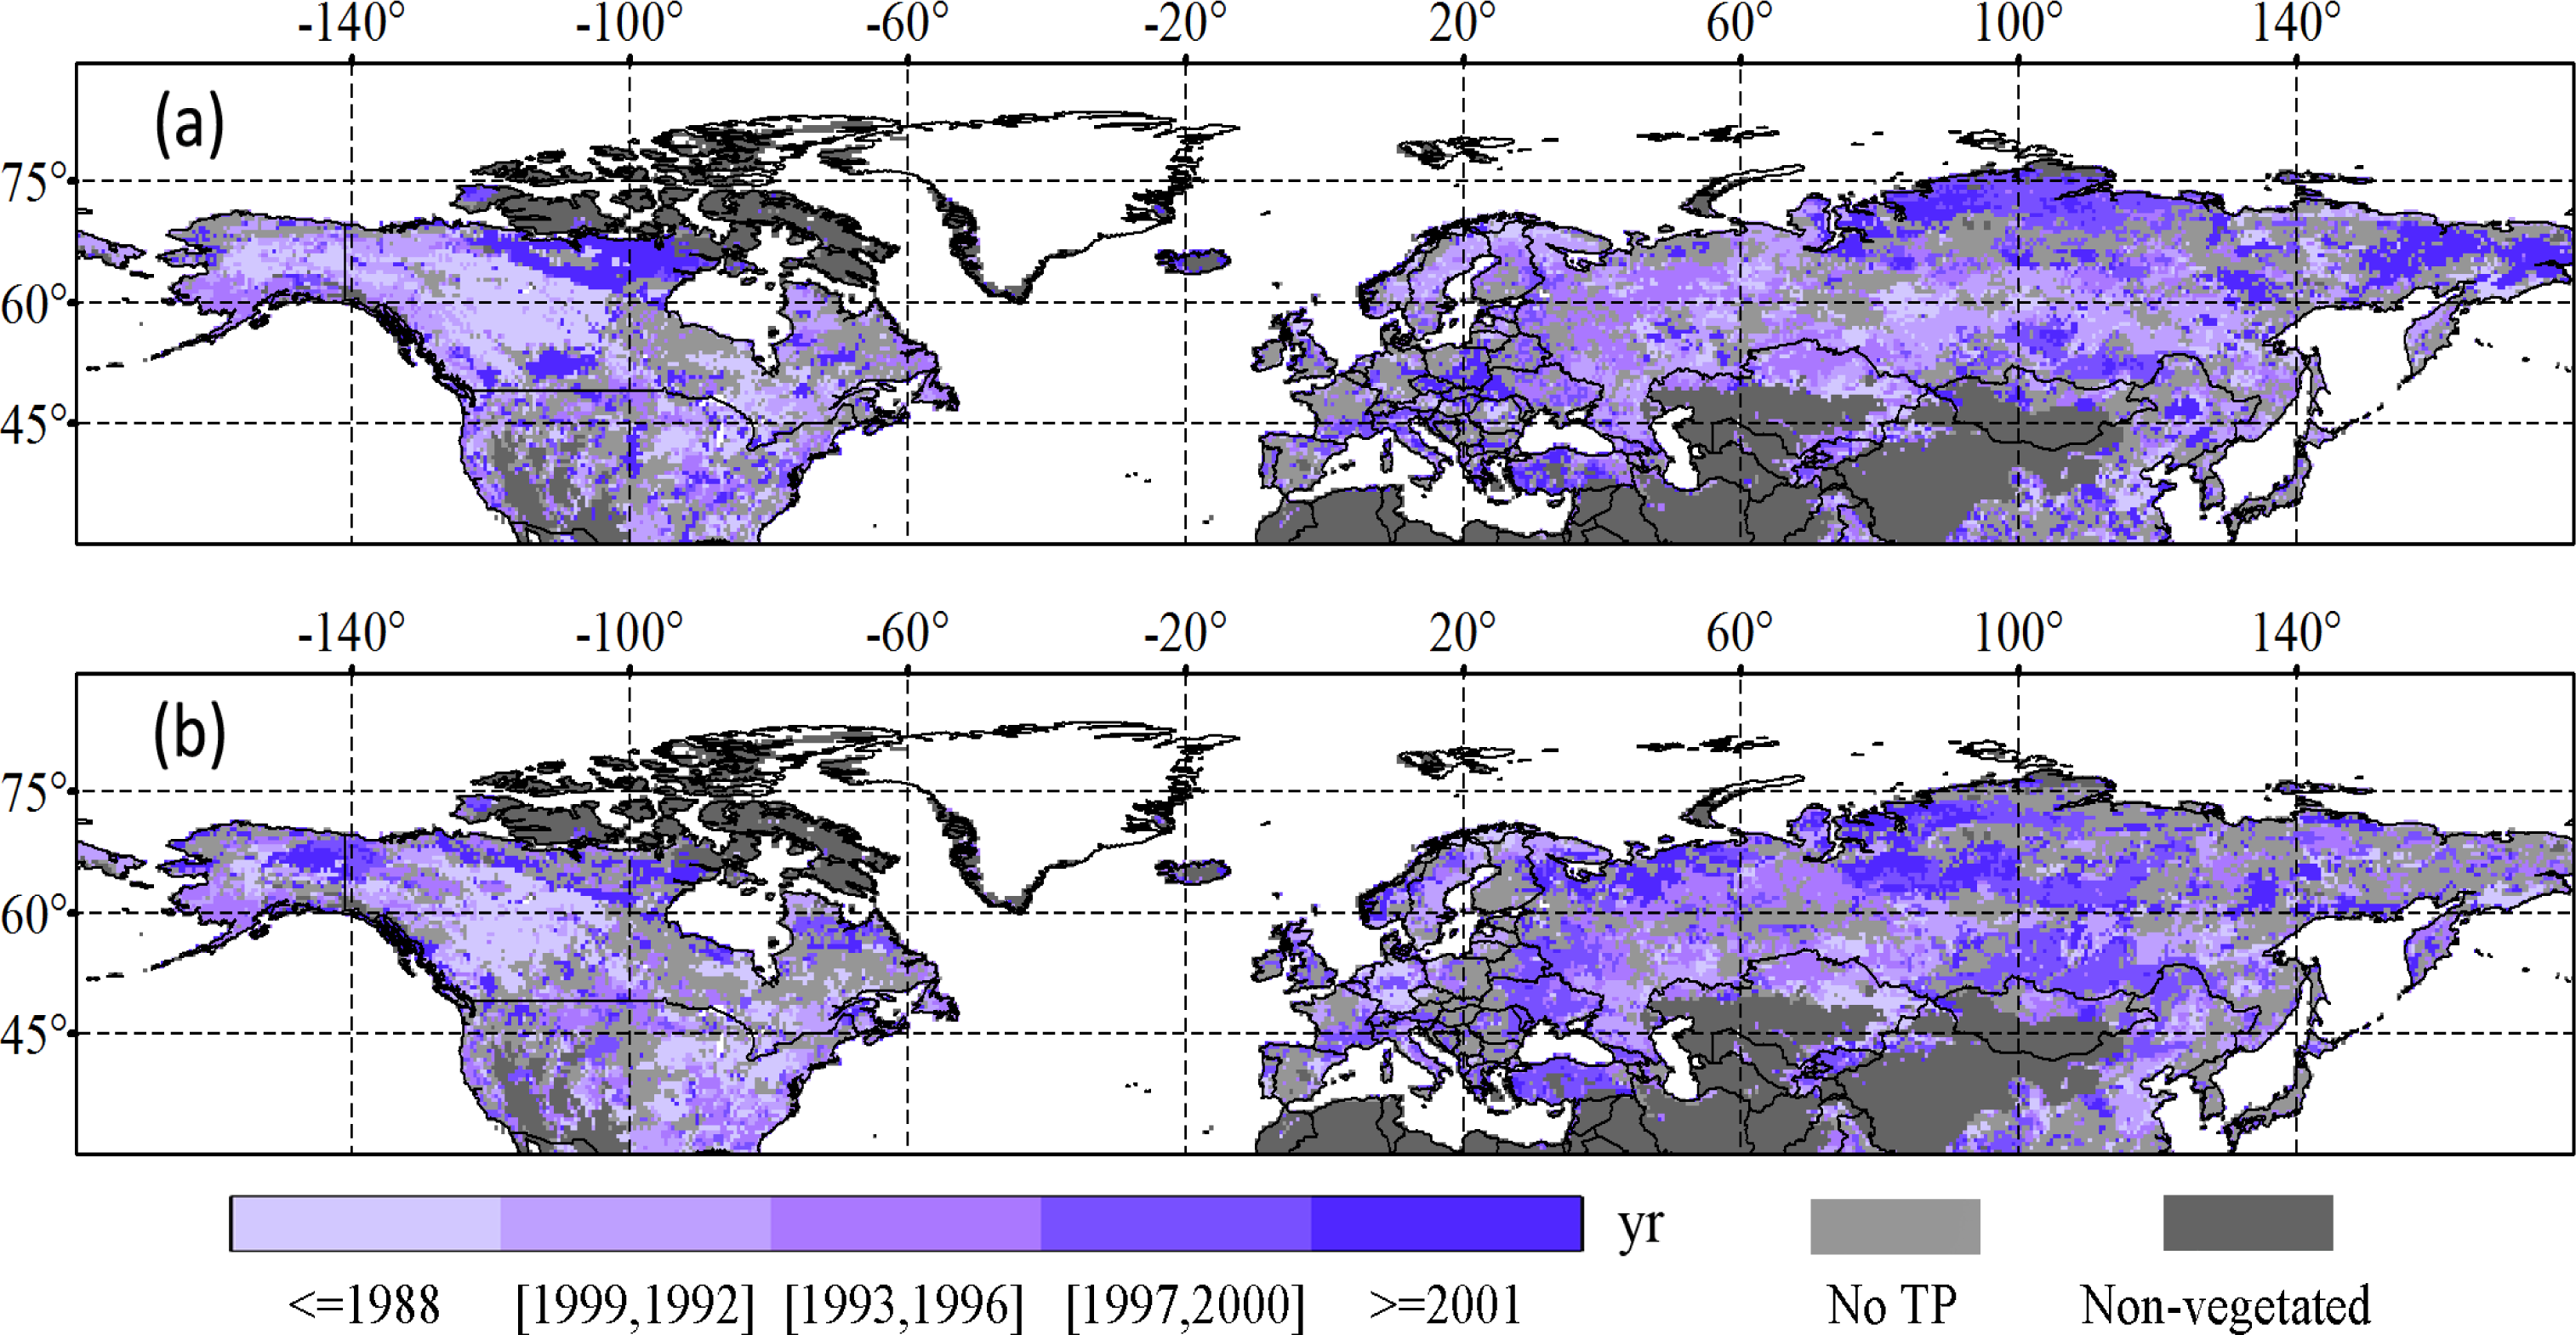
3.1.2. Turning Point in NDVI Time Series

The Turning Points (TP) detected from NDVIg mostly happened before 1996, and the pixels with TP later than 1996 were mainly distributed in the high latitudes, such as northern Canada and northern and eastern Russia (Figures 5a and 6). The average timing (calculated as the centroid of the polygon constituted by the frequency distribution of TP in Figure 6) of TP detected from NDVIg was in 1994. The proportions of the timing of TP detected from NDVI3g were similar for different periods (Figure 6), and the pixels with TP later than 1996 were mostly distributed in Alaska, eastern Europe and central Russia (Figure 5b). The average timing of TP detected from NDVI3g was in 1995.
The timing of TP detected from NDVIg and NDVI3g showed different spatial patterns during the period 1982–2008 (Figures 5 and 7). The differences were mainly located in the northern pan-arctic region (Figure 7). The pixels showing TPs in NDVIg while with no TPs in NDVI3g were distributed in central North America, central Europe, and northern and eastern Russia. About half of the study area had TPs for both data sets, but only 24% of the study area showed the same timing of TP (Figure 7). For some areas in Alaska and central Russia, timings of TPs detected from NDVI3g were later than those from NDVIg, while for some regions in eastern Russia, the detected TPs from NDVI3g were earlier than those from NDVIg.

3.2. Differences in the Response of Growing-Season NDVI to Climate Change

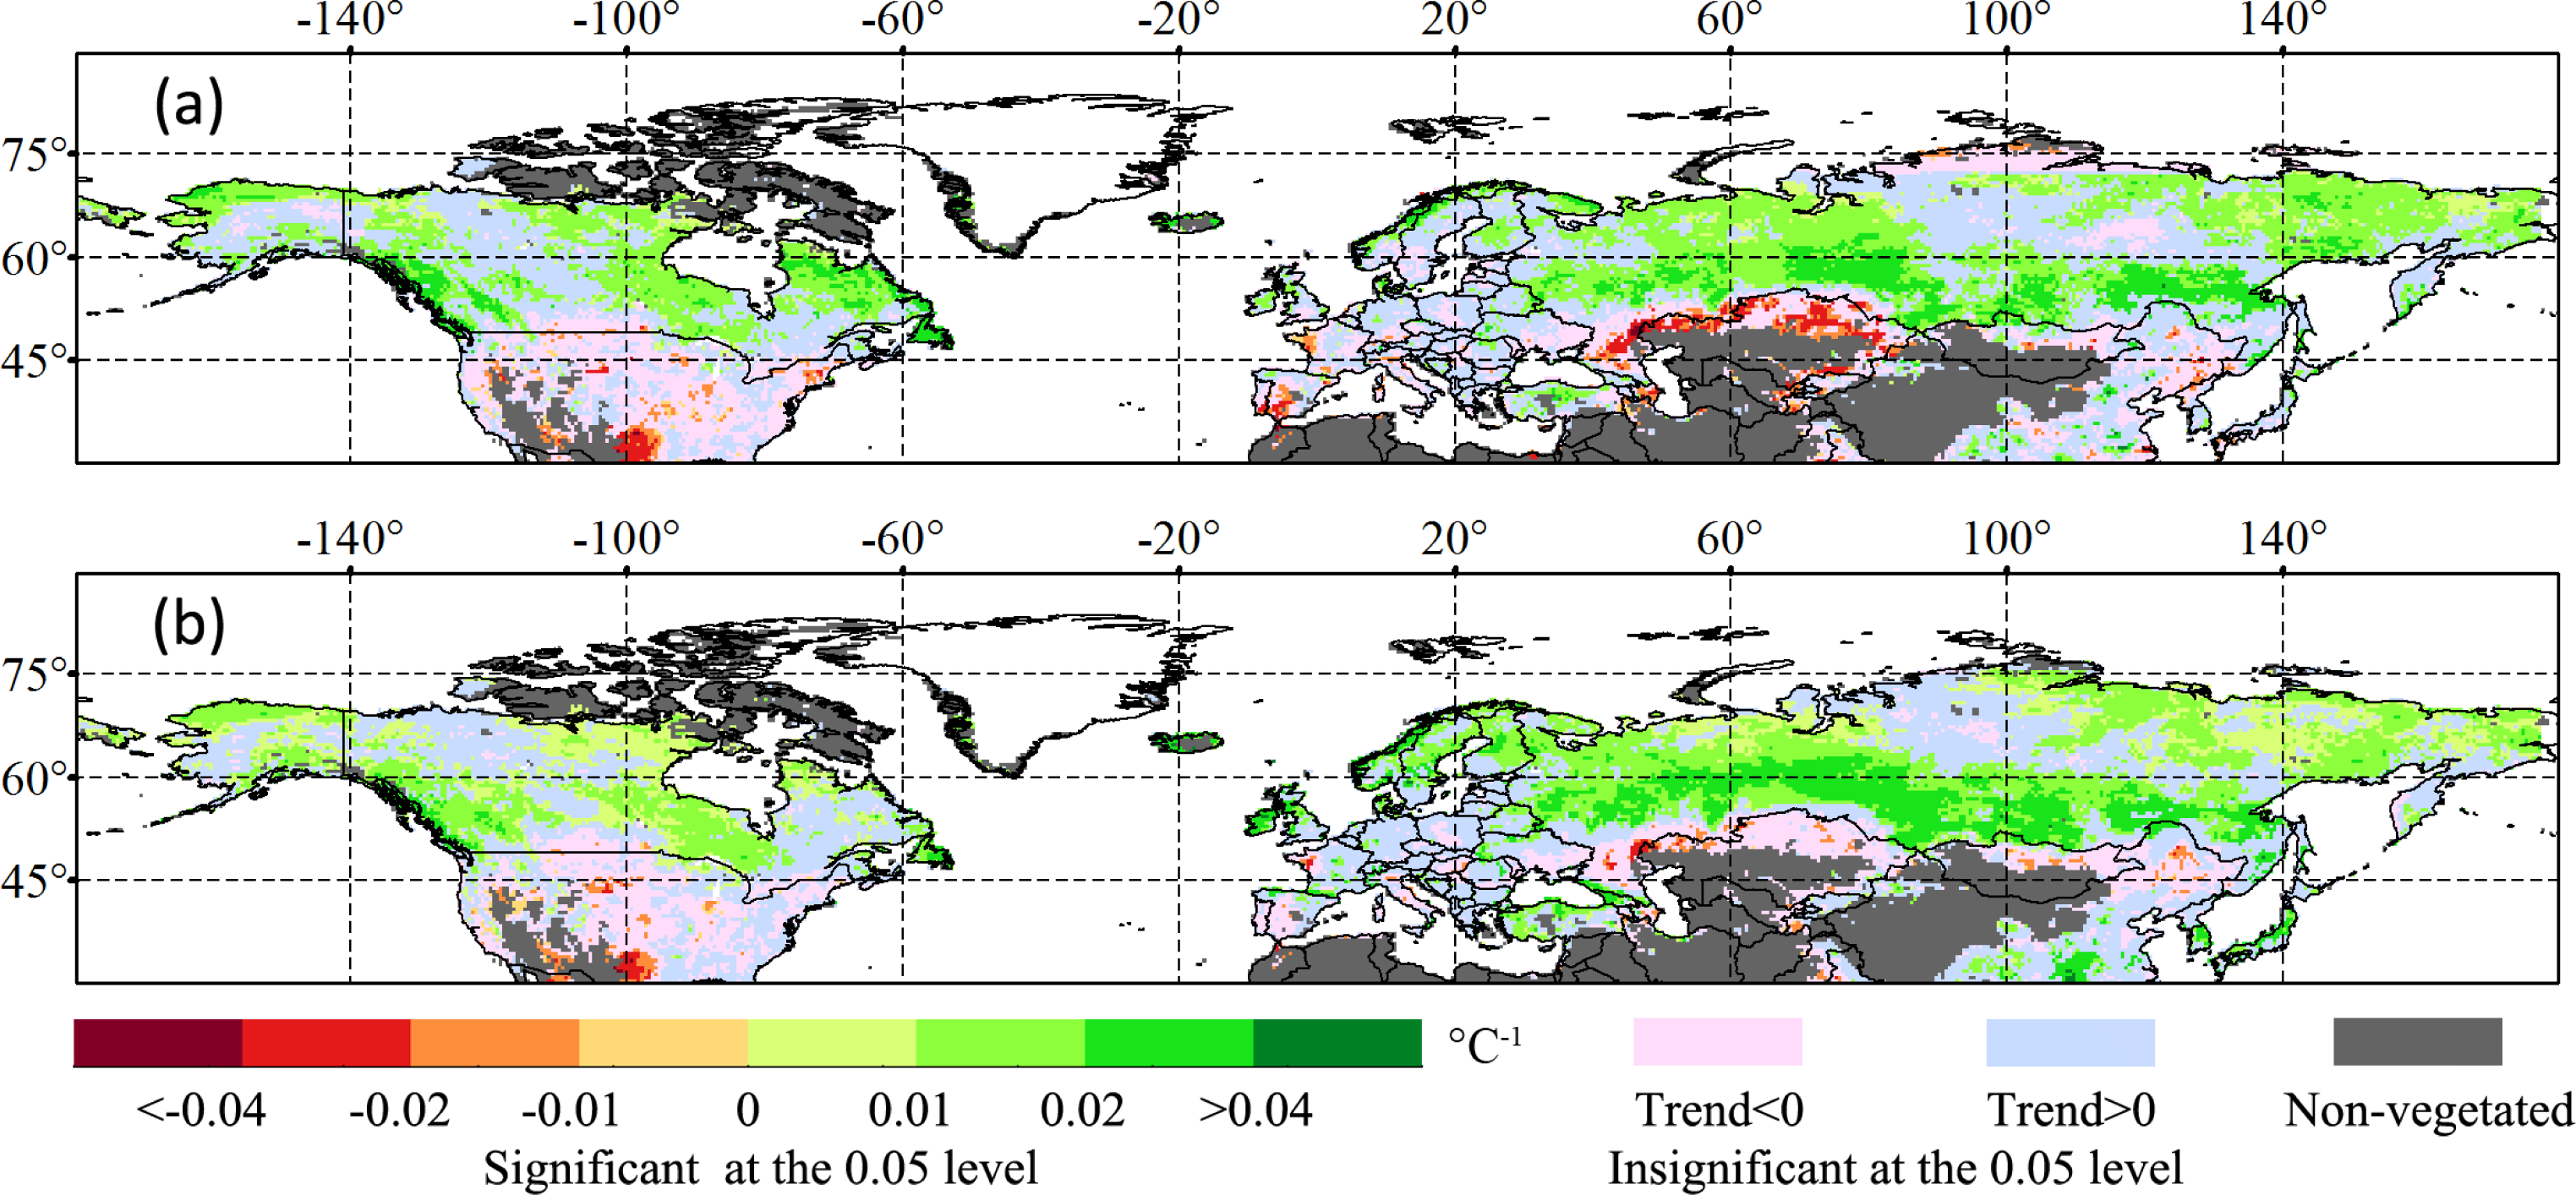
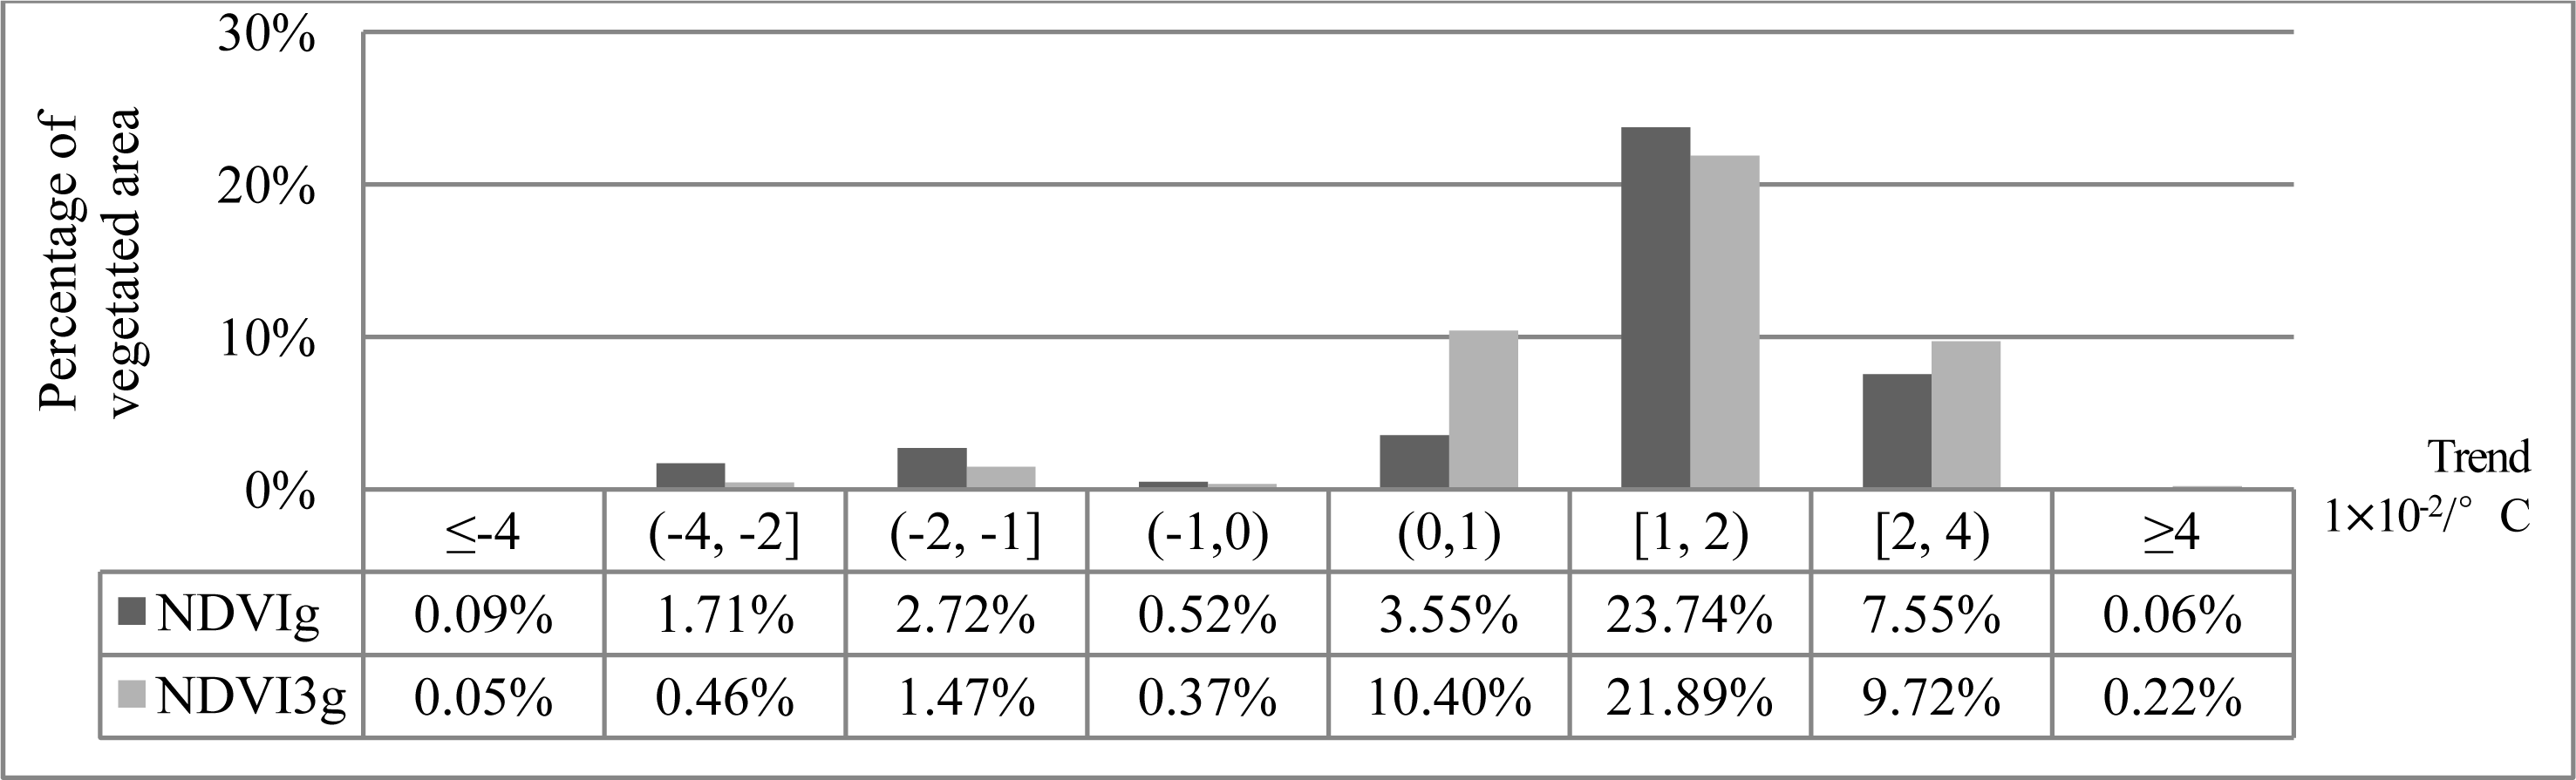
3.2.1. Differences in the Response of Growing-Season NDVI to Temperature Change

NDVIg and NDVI3g both showed a higher proportion of significantly positive (34.9% and 42.2%, respectively) than negative (5% and 2.4%, respectively) response of growing-season NDVI to temperature change during 1982–2008 (Figures 8 and 9). Both NDVI data sets demonstrated significantly positive responses to temperature change in Alaska, Canada and Russia, and significantly negative responses in the southern conterminous US and northern Kazakhstan. The pixels with significant response were mainly distributed between 45°N and 75°N. The spatial average for all significant responses of NDVIg to temperature change was 0.0118 °C−1, while the spatial averages for the positive and negative responses were 0.0162 °C−1 and −0.0186 °C−1, respectively. The spatial average for all significant responses of NDVI3g to temperature change was 0.0139 °C−1, while the spatial averages for the positive and negative responses were 0.0156 °C−1 and −0.0167 °C−1, respectively.
The general spatial patterns were consistent between NDVIg and NDVI3g in the response of NDVI to temperature change. However, NDVI3g data had 24% more pixels with a significantly positive response and 52% fewer pixels with a significantly negative response to temperature change than NDVIg (Figure 8). NDVI3g had more pixels with a significant response to temperature over Eurasia, such as northern Europe, as well as northern Russia and central China, while NDVIg showed more pixels with significant response to temperature change over Northern America and northern Kazakhstan (Figure 10). The spatial average for all significant responses to temperature change was 18% greater in NDVI3g than in NDVIg. Significant response (P < 0.001) was still found between the area-weighted average NDVI and average temperature change for both data sets, but the response magnitude of NDVI3g (0.0174 °C−1) was 65.71% greater than that of NDVIg (0.0105 °C−1).

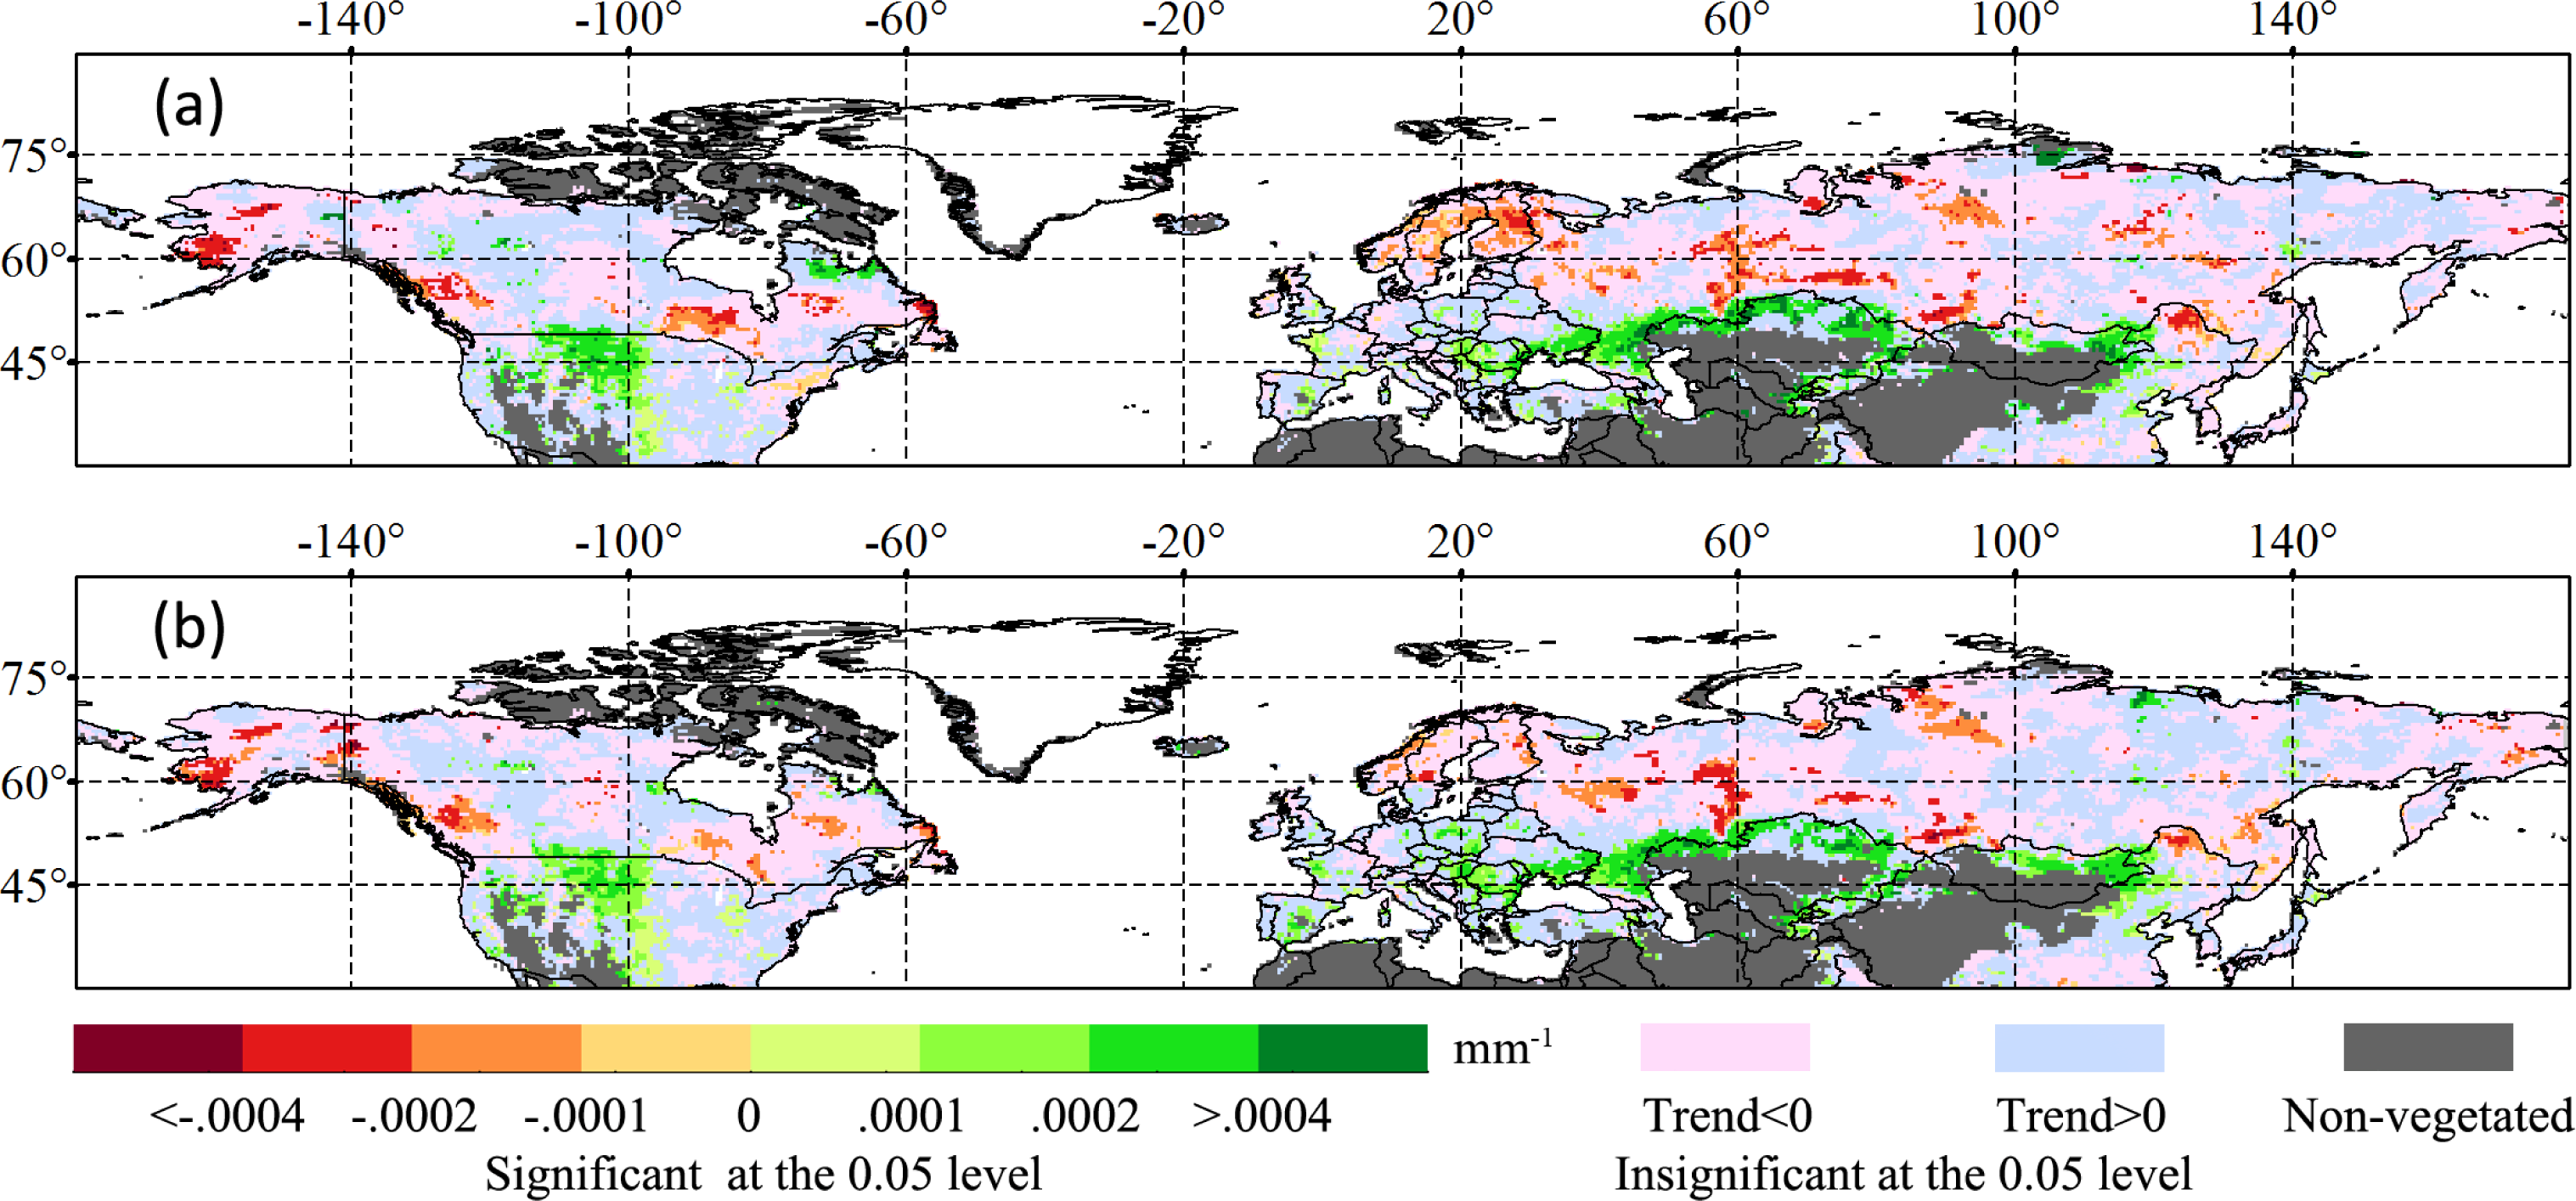
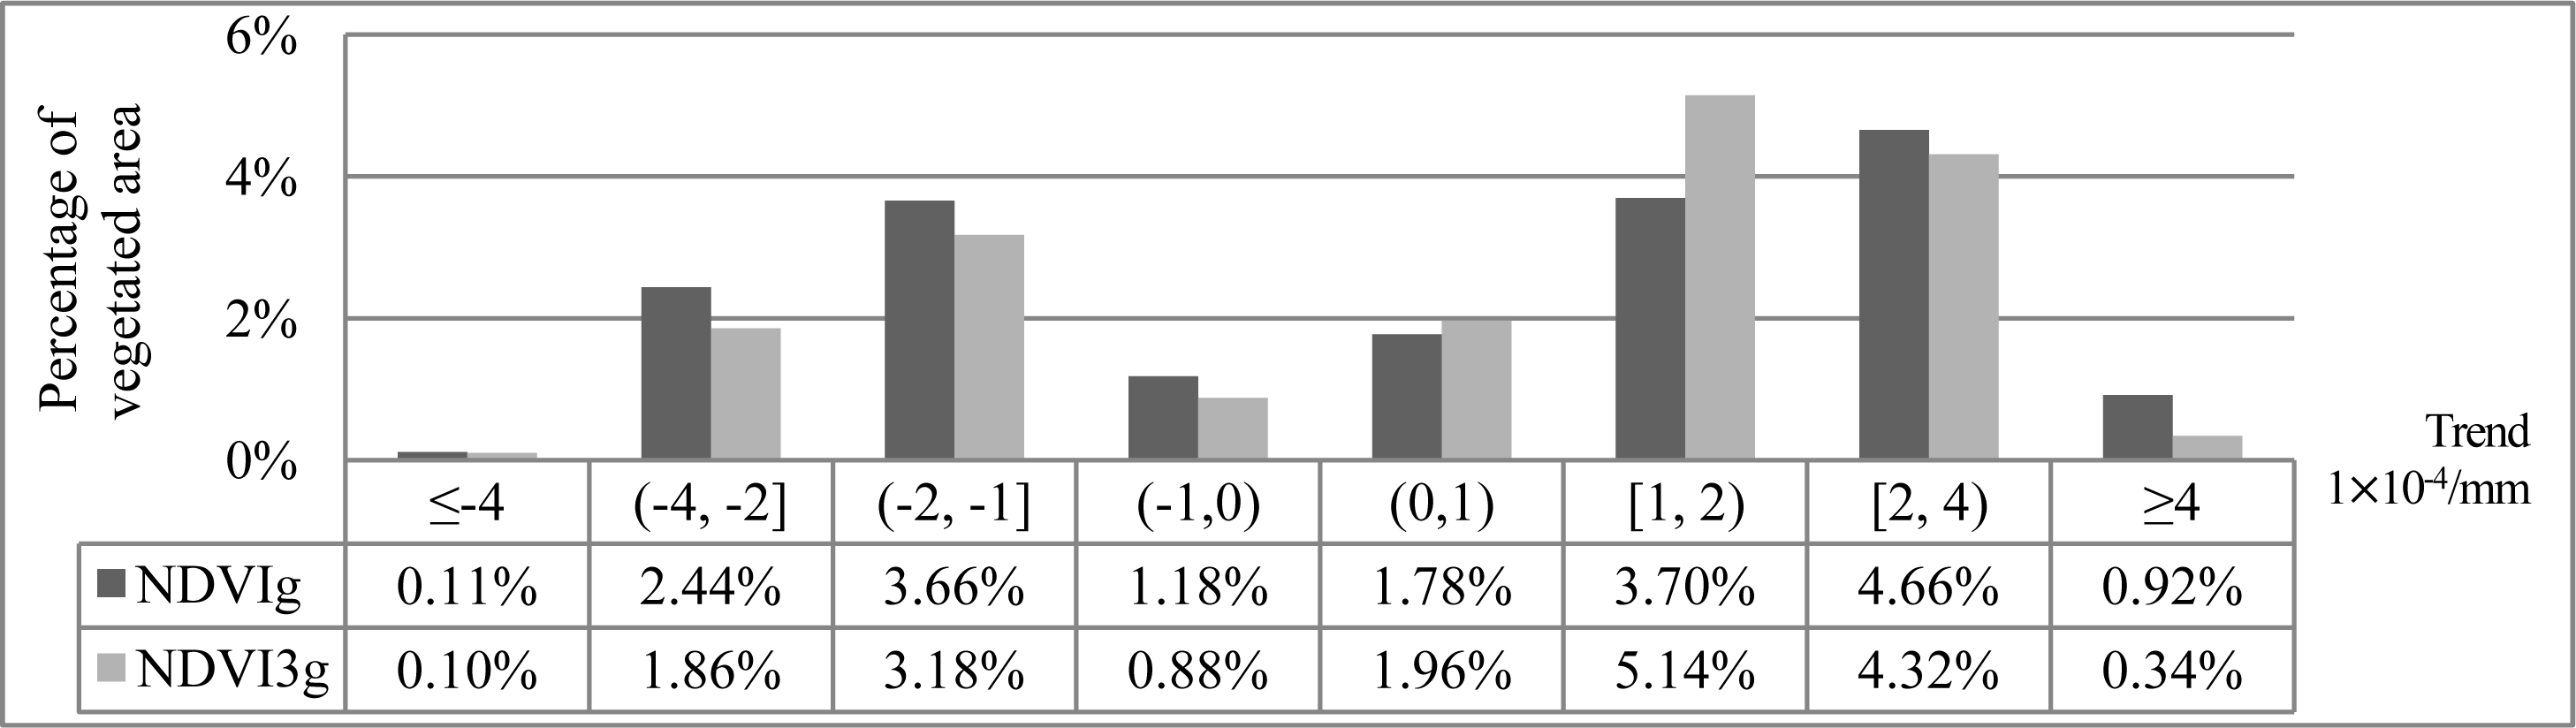
3.2.2. Differences in the Response of Growing-Season NDVI to Precipitation Change

NDVIg and NDVI3g both showed a lower proportion of significant response to precipitation change (Figures 11 and 12). There were 11.1% and 7.4% pixels showing significantly positive and negative responses to precipitation in NDVIg, respectively, while 11.8% and 6% in NDVI3g. The significant positive responses to precipitation change for both NDVIg and NDVI3g were mainly distributed between 30°N and 60°N, such as in northern conterminous US, southern Europe, northern Kazakhstan and northern Mongolia, while significant negative responses were distributed between 45°N and 75°N, such as in Alaska, Canada, northern Europe and Russia. The spatial average for all significant responses of NDVIg was 0.61 × 10⁻⁴ mm−1, while the spatial averages for the significantly positive and negative responses were 2.21 × 10⁻⁴ mm−1 and −1.79 × 10⁻⁴ mm−1, respectively. The spatial average for all significant responses of NDVI3g was 0.66 × 10⁻⁴ mm−1, while the spatial averages for the significant positive and negative responses were 1.90 × 10⁻⁴ mm−1 and −1.77 ×10⁻⁴ mm−1, respectively.
Since most pixels in the vegetated area demonstrated an insignificant response to precipitation change for both data sets, it was not surprising that the spatial patterns were generally consistent between the two NDVI data sets. However, some discrepancies existed between them at the border of Alaska and Canada, northern and eastern Canada, and northern Russia (Figure 13). More pixels showed a significant response for NDVI3g at the border of Alaska and Canada, while fewer pixels showed a significant response for NDVI3g in eastern Canada, northern Europe and northeastern Russia. Moreover, the responses of area-weighted average NDVI to average precipitation change were completely opposite between the two NDVI data sets (i.e., −0.91×10⁻⁴ mm−1vs. 1.29 × 10⁻⁴ mm−1).

3.3. Contributions and Challenges to the Monitoring of Vegetation Activity Change

Our comparative analysis between NDVIg and NDVI3g indicated that the two NDVI data sets had large discrepancies in monitoring vegetation activity change and its response to climate change, which may be underestimated based on the NDVIg data set in the middle and high latitudes of the Northern Hemisphere. It is urgent to check consistency and establish a connection between studies using the two versions of NDVI data sets to monitor vegetation activity change (e.g., [9,13,14,2432]). Our study only demonstrated the potential differences in monitoring vegetation activity change with different NDVI versions. Evaluating which NDVI data set was more reliable and whether the detected vegetation activity changing trends from NDVI3g revealed the actual change in vegetation activity was beyond the capability of this study, and further studies are needed to compare and evaluate the performance of both NDVI data sets in monitoring vegetation activity and their responses to climate change. To achieve this, other data sets, such as other satellite-derived NDVI data sets, ecological data sets from ground observations, and eddy flux tower observations, should be integrated. Other satellite-derived NDVI data with better quality (e.g., MODIS NDVI) could be used to evaluate GIMMS NDVIg and NDVI3g, but satellite-based data will always have much uncertainty because of discrepancies in the performance of the sensor, atmospheric conditions (e.g., cloud, vapor, aerosol, etc.) and sun-sensor-surface viewing geometries. The ecological data sets from ground observations could provide ground truth values for vegetation activity change, but we have to deal with the scaling-up issue when using them to compare satellite data. Fortunately, the eddy flux tower observations, whose footprints range from 250 m to 3 km, are comparable with the satellite-derived data and have been widely used to evaluate and validate satellite-derived vegetation parameters (e.g., net primary productivity) [3335]. Therefore, we could use the eddy flux tower observations to further evaluate which GIMMS NDVI data set could better reflect the actual variation in vegetation activity in the future.

4. Conclusions

In this study, we compared the old version (NDVIg) and the third version (NDVI3g) of the Normalized Difference Vegetation Index (NDVI) produced by the Global Inventory Modeling and Mapping Studies (GIMMS) group for monitoring vegetation activity change and its responses to climate change in the middle and high latitudes of the Northern Hemisphere. The main findings can be summarized as follows:
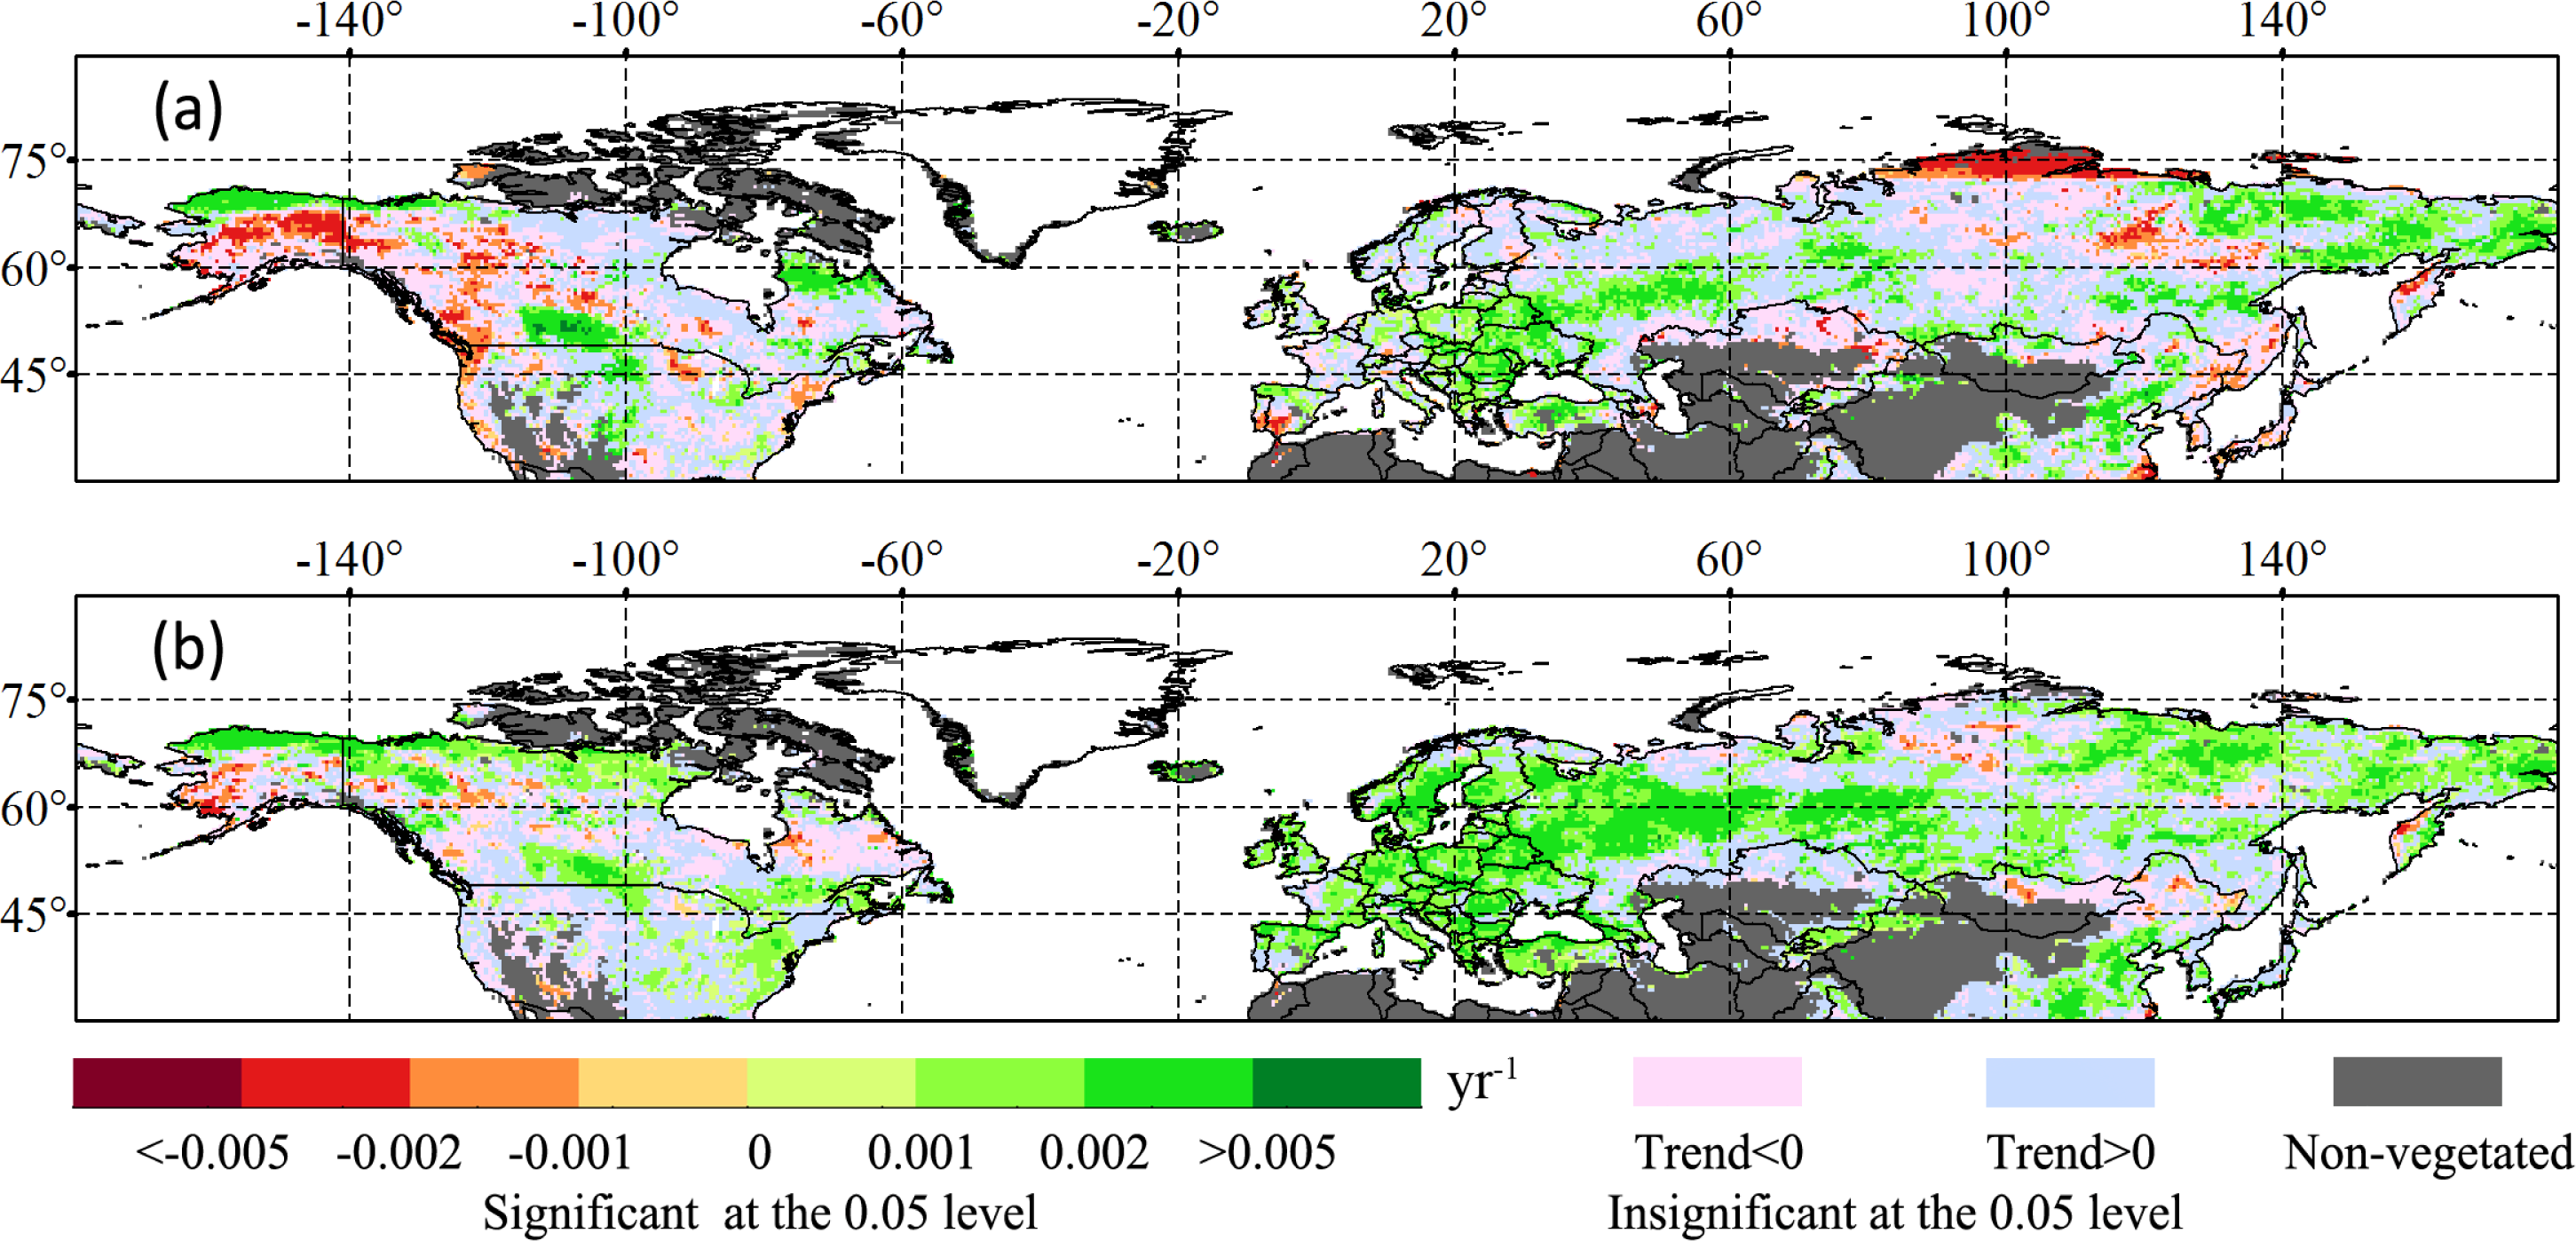
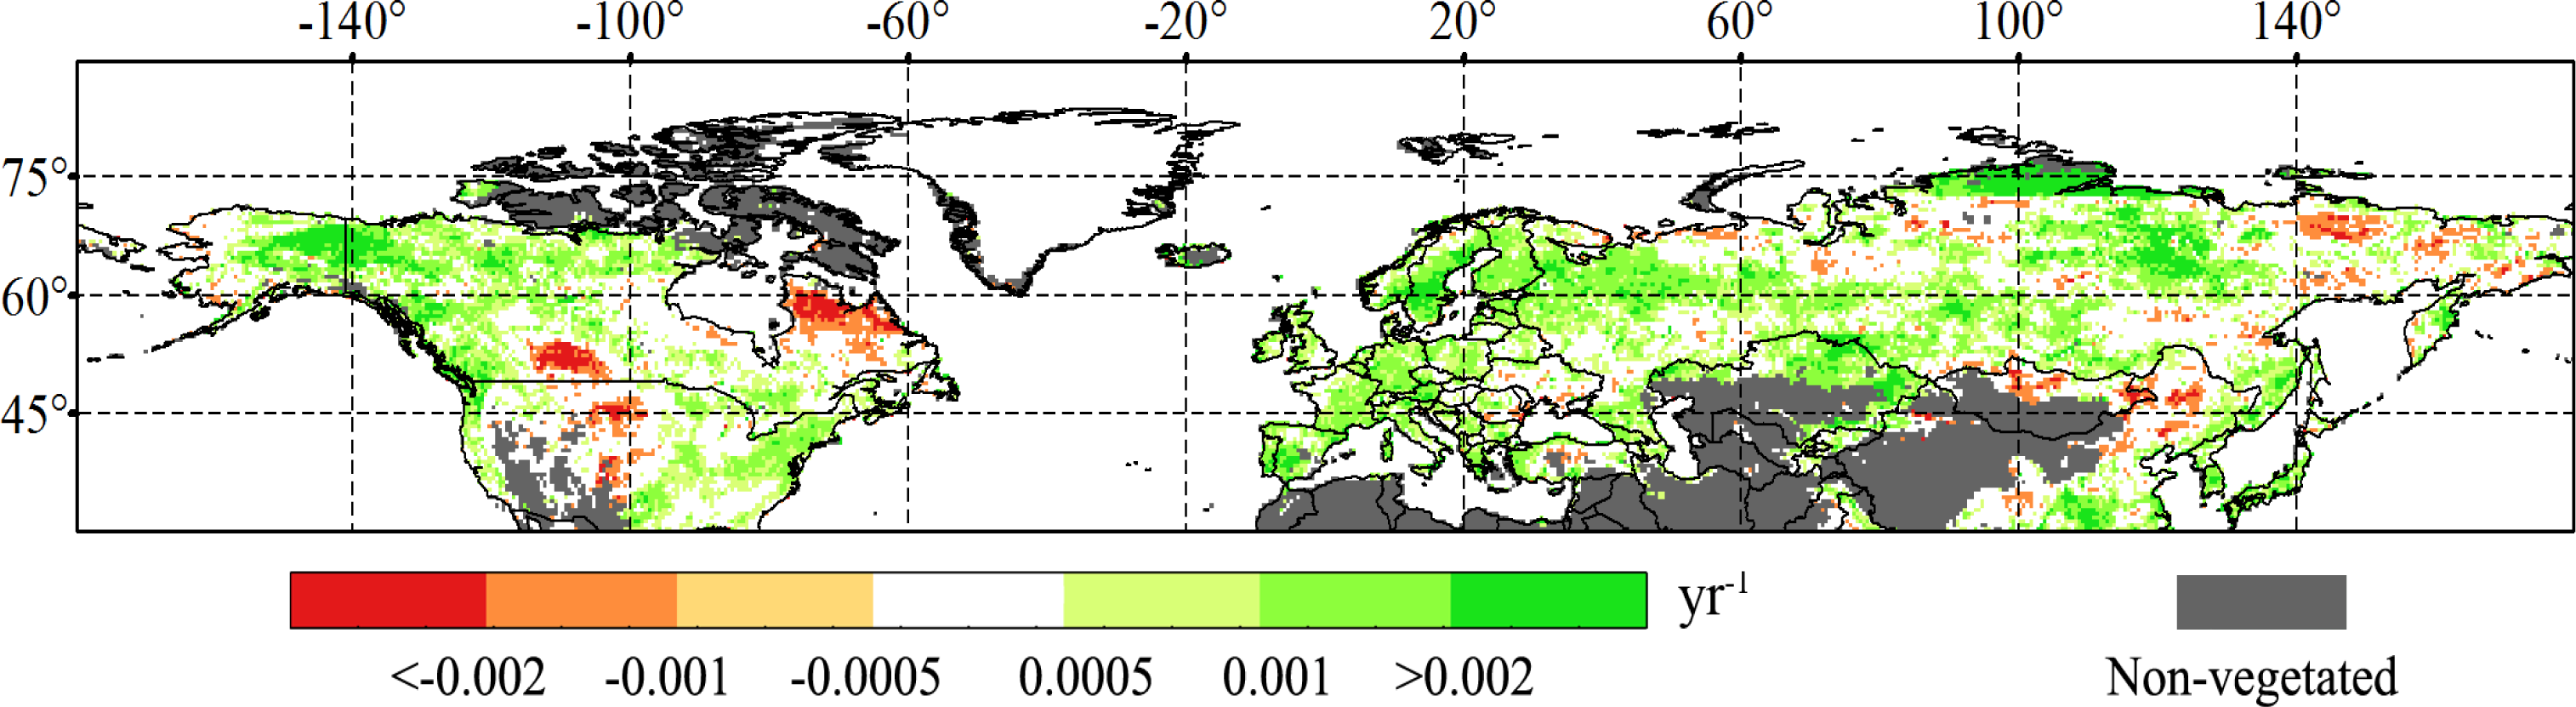
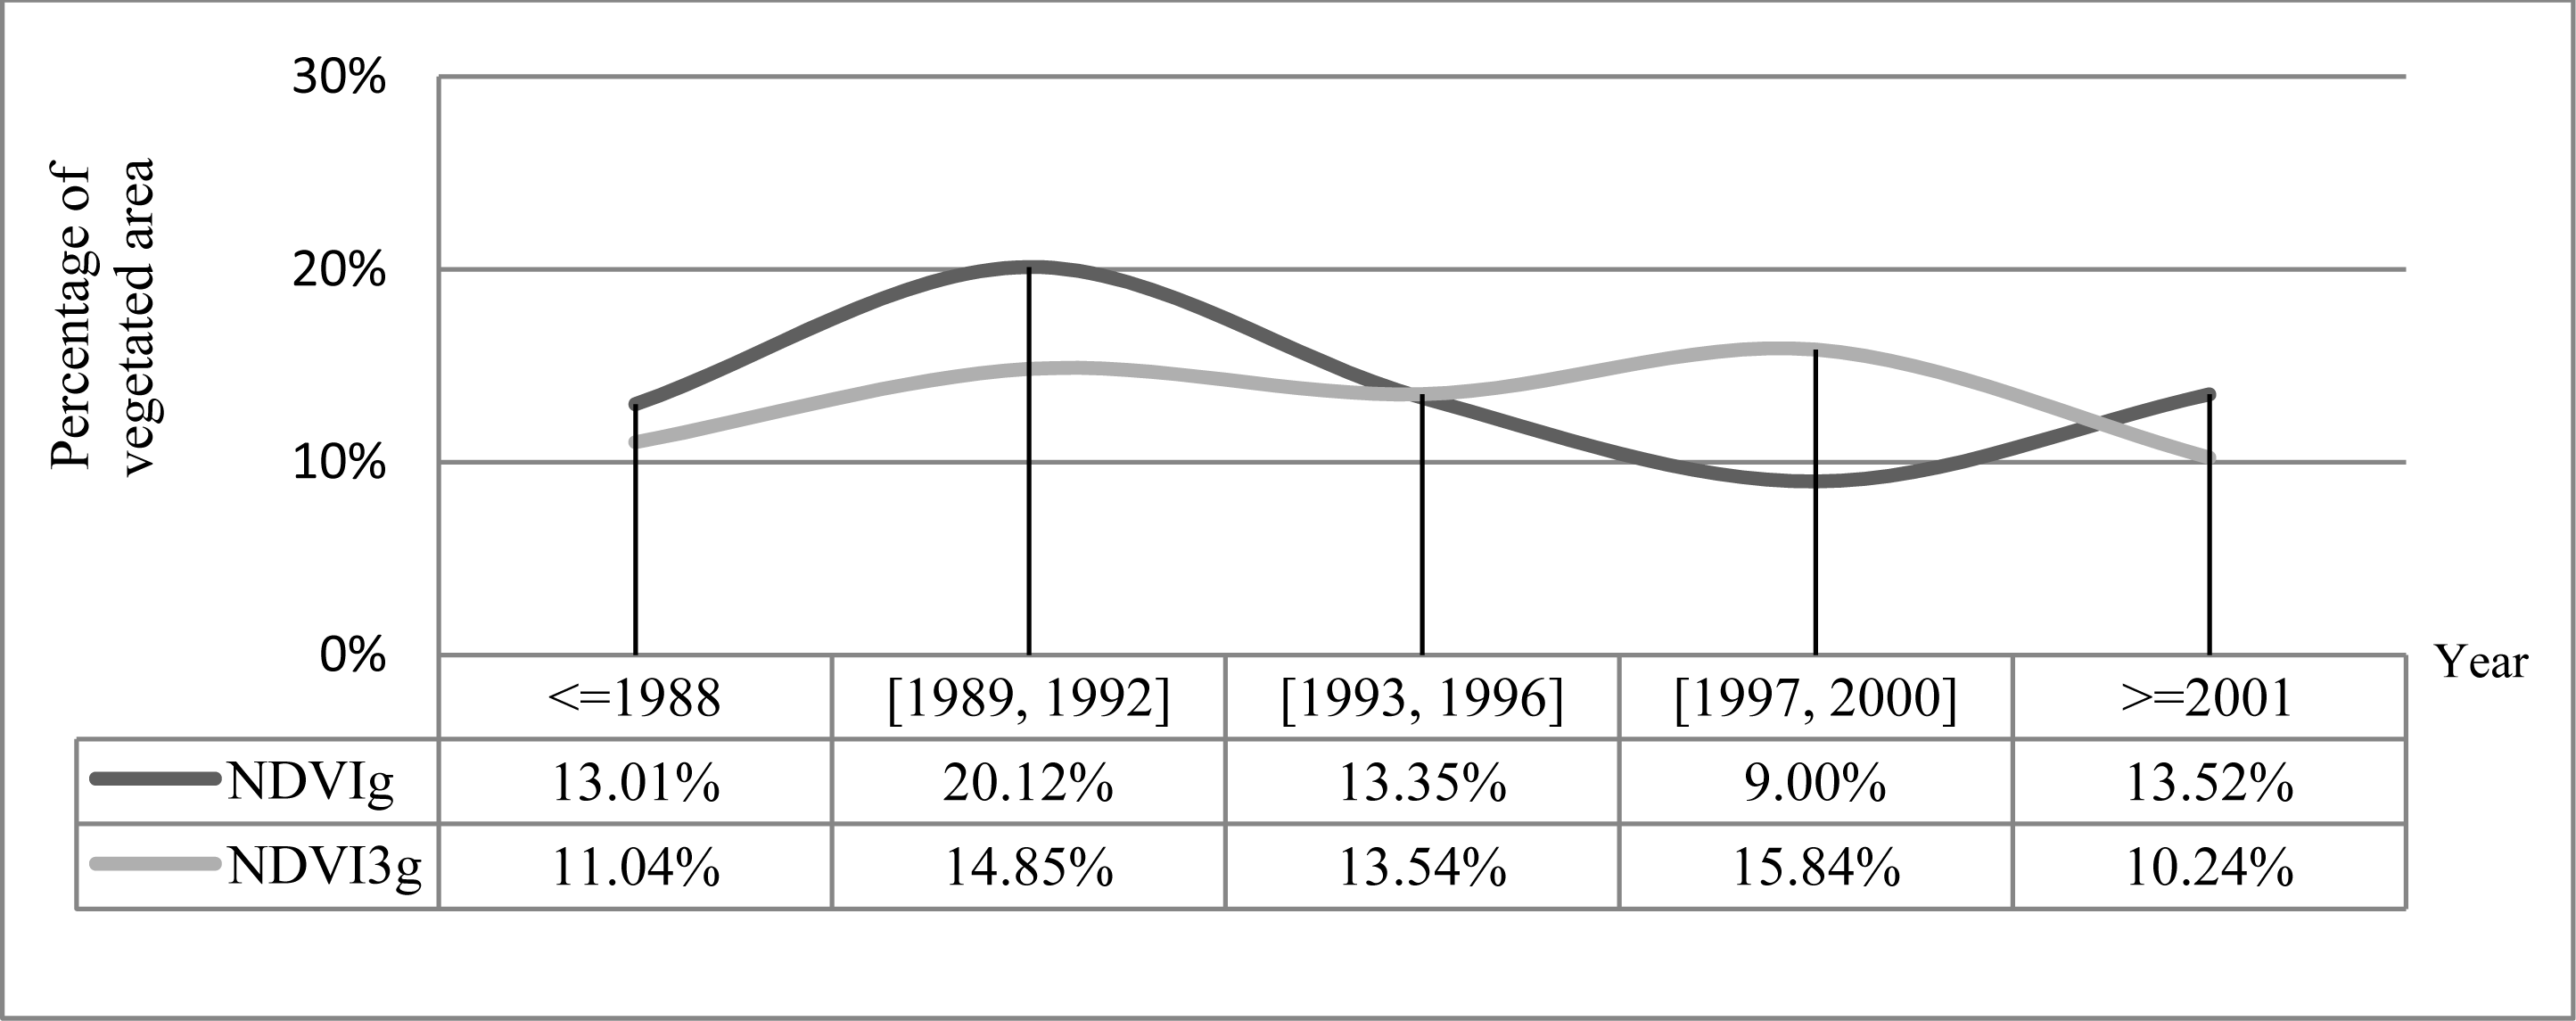
  • Vegetation activities detected from the two NDVI versions during the same study periods (i.e., 1982–2008) showed large differences in the spatial patterns for both the overall changing trends and the timing of Turning Points (TP), which spread over almost the entire study region. There was 78% more area with significantly increasing trends and 70% less area with significantly decreasing trends in NDVI3g, and the detected average changing trend from NDVI3g was almost twice as great as that from NDVIg. Only 24% of the study area showed the same timing of TP for both data sets and the average timing of TP was one year later in NDVI3g than in NDVIg.
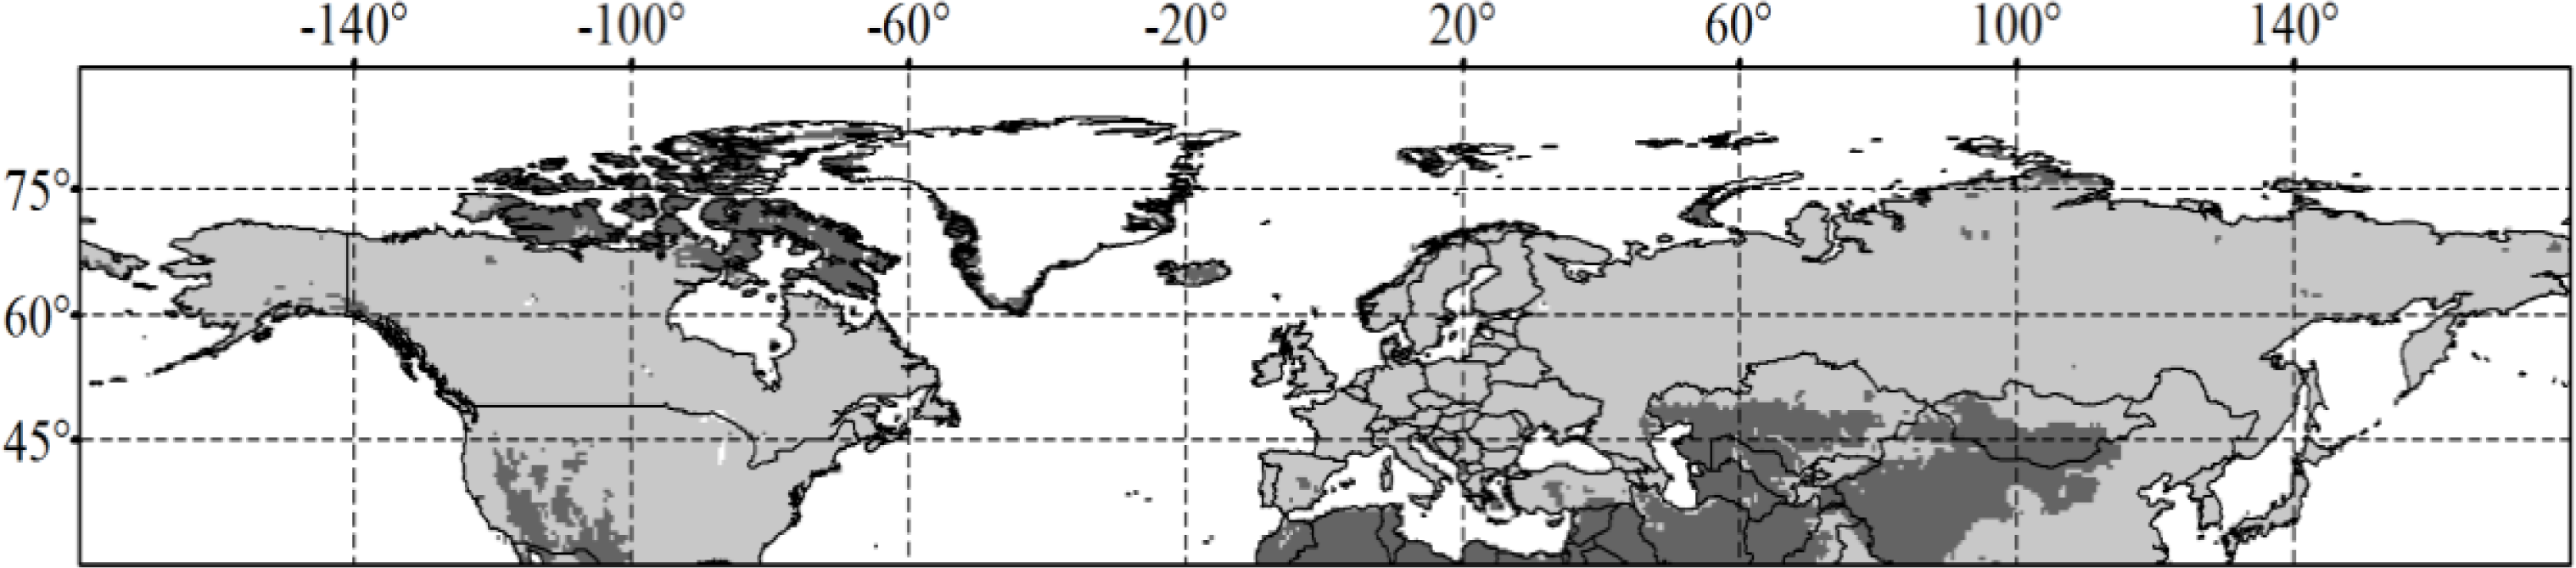
  • The responses of NDVI to temperature/precipitation had consistent spatial patterns between NDVIg and NDVI3g, but there were large differences in the response magnitude. NDVI3g had a higher response magnitude to temperature than NDVIg. There were 24% more pixels with statistically significantly positive responses and 52% fewer pixels with significantly negative responses to temperature change in NDVI3g than in NDVIg. Area-weighted average NDVIg and NDVI3g had insignificant but opposite responses to precipitation change.
  • Our comparative analysis between NDVIg and NDVI3g indicated that NDVIg data set may underestimate the vegetation activity change trend and its response to climate change in the middle and high latitudes of the Northern Hemisphere during the past three decades. It is urgent to check consistency and establish a connection between existing studies based on the two NDVI versions. Moreover, other ecological data sets (e.g., eddy flux tower observations) should be further integrated to evaluate and validate the detected vegetation activity changes from NDVI3g time series.

Acknowledgments

This work was supported by the National Basic Research Program of China (Grant No. 2011CB952001), the State Key Laboratory of Earth Surface Processes and Resource Ecology (Grant No. 2013-ZY-14), and the Fundamental Research Funds for the Central University. We thank C. J. Tucker, J. Pinzon, and R. B. Myneni for providing GIMMS NDVI3g data set and valuable suggestions.

Conflict of Interest

The authors declare no conflict of interest.

References

  1. Schimel, D.S. Terrestrial ecosystems and the carbon cycle. Glob. Change Biol 1995, 1, 77–91. [Google Scholar]
  2. Cao, M.; Woodward, F.I. Dynamic responses of terrestrial ecosystem carbon cycling to global climate change. Nature 1998, 393, 249–252. [Google Scholar]
  3. Fan, S.; Gloor, M.; Mahlman, J.; Pacala, S.; Sarmiento, J.; Takahashi, T.; Tans, P. A large terrestrial carbon sink in north America implied by atmospheric and oceanic carbon dioxide data and models. Science 1998, 282, 442–446. [Google Scholar]
  4. Bousquet, P.; Peylin, P.; Ciais, P.; Le Quéré, C.; Friedlingstein, P.; Tans, P.P. Regional changes in carbon dioxide fluxes of land and oceans since 1980. Science 2000, 290, 1342–1346. [Google Scholar]
  5. Goodale, C.L.; Apps, M.J.; Birdsey, R.A.; Field, C.B.; Heath, L.S.; Houghton, R.A.; Jenkins, J.C.; Kohlmaier, G.H.; Kurz, W.; Liu, S.; et al. Forest carbon sinks in the Northern Hemisphere. Ecol. Appl 2002, 12, 891–899. [Google Scholar]
  6. Ciais, P.; Canadell, J.G.; Luyssaert, S.; Chevallier, F.; Shvidenko, A.; Poussi, Z.; Jonas, M.; Peylin, P.; King, A.W.; Schulze, E.; et al. Can we reconcile atmospheric estimates of the Northern terrestrial carbon sink with land-based accounting? Curr. Opin. Env. Sust 2010, 2, 225–230. [Google Scholar]
  7. Zhou, L.; Tucker, C.J.; Kaufmann, R.K.; Slayback, D.; Shabanov, N.V.; Myneni, R.B. Variations in northern vegetation activity inferred from satellite data of vegetation index during 1981 to 1999. J. Geophys. Res 2001, 106, 20069–20083. [Google Scholar]
  8. Saleska, S.R.; Didan, K.; Huete, A.R.; Da Rocha, H.R. Amazon forests green-up during 2005 drought. Science 2007, 318, 612–612. [Google Scholar]
  9. Park, H.; Sohn, B.J. Recent trends in changes of vegetation over East Asia coupled with temperature and rainfall variations. J. Geophys. Res 2010, 115, D14101. [Google Scholar]
  10. Samanta, A.; Ganguly, S.; Hashimoto, H.; Devadiga, S.; Vermote, E.; Knyazikhin, Y.; Nemani, R.R.; Myneni, R.B. Amazon forests did not green-up during the 2005 drought. Geophys. Res. Lett 2010, 37, L5401. [Google Scholar]
  11. Wang, X.; Piao, S.; Ciais, P.; Li, J.; Friedlingstein, P.; Koven, C.; Chen, A. Spring temperature change and its implication in the change of vegetation growth in North America from 1982 to 2006. Proc. Natl. Acad. Sci. USA 2011, 108, 1240–1245. [Google Scholar]
  12. Myneni, R.B.; Tucker, C.J.; Asrar, G.; Keeling, C.D. Interannual variations in satellite-sensed vegetation index data from 1981 to 1991. J. Geophys. Res 1998, 103, 6145–6160. [Google Scholar]
  13. Piao, S.; Wang, X.; Ciais, P.; Zhu, B.; Wang, T.; Liu, J. Changes in satellite-derived vegetation growth trend in temperate and boreal Eurasia from 1982 to 2006. Glob. Change Biol 2011, 17, 3228–3239. [Google Scholar]
  14. Beck, H.E.; McVicar, T.R.; van Dijk, A.I.J.M.; Schellekens, J.; de Jeu, R.A.M.; Bruijnzeel, L.A. Global evaluation of four AVHRR-NDVI data sets: Intercomparison and assessment against Landsat imagery. Remote Sens. Environ 2011, 115, 2547–2563. [Google Scholar]
  15. Luo, X.; Chen, X.; Xu, L.; Myneni, R.; Zhu, Z. Assessing performance of NDVI and NDVI3g in monitoring leaf unfolding dates of the deciduous broadleaf forest in Northern China. Remote Sens 2013, 5, 845–861. [Google Scholar]
  16. Zhu, Z.; Bi, J.; Pan, Y.; Ganguly, S.; Anav, A.; Xu, L.; Samanta, A.; Piao, S.; Nemani, R.R.; Myneni, R.B. Global data sets of Vegetation Leaf Area Index (LAI)3g and Fraction of Photosynthetically Active Radiation (FPAR)3g derived from Global Inventory Modeling and Mapping Studies (GIMMS) Normalized Difference Vegetation Index (NDVI3g) for the period 1981 to 2011. Remote Sens 2013, 5, 927–948. [Google Scholar]
  17. Xu, L.; Myneni, R.B.; Chapin, F.S., III; Callaghan, T.V.; Pinzon, J.E.; Tucker, C.J.; Zhu, Z.; Bi, J.; Ciais, P.; Tommervik, H.; et al. Temperature and vegetation seasonality diminishment over northern lands. Nat. Clim. Change 2013, 3, 581–586. [Google Scholar]
  18. Holben, B.N. Characteristics of maximum-value composite images for temporal AVHRR data. Int. J. Remote Sens 1986, 7, 1417–1434. [Google Scholar]
  19. Tomé, A.R.; Miranda, P.M.A. Piecewise linear fitting and trend changing points of climate parameters. Geophys. Res. Lett 2004, 31, L2207. [Google Scholar]
  20. Akaike, H. A new look at the statistical model identification. IEEE Trans Autom. Control 1974, 19, 716–723. [Google Scholar]
  21. Hurvich, C.M.; Tsai, C. Regression and time series model selection in small samples. Biometrika 1989, 76, 297–307. [Google Scholar]
  22. Wallace, J.M.; Thompson, D.W.J.; Fang, Z. Comments on “Northern Hemisphere teleconnection patterns during extreme phases of the zonal-mean circulation”. J. Clim 2000, 13, 1037–1039. [Google Scholar]
  23. Bhatt, U.S.; Walker, D.A.; Raynolds, M.K.; Comiso, J.C.; Epstein, H.E.; Jia, G.; Gens, R.; Pinzon, J.E.; Tucker, C.J.; Tweedie, C.E.; et al. Circumpolar Arctic tundra vegetation change is linked to sea ice decline. Earth Interact 2010, 14, 1–20. [Google Scholar]
  24. Jeong, S.; Ho, C.; Gim, H.; Brown, M.E. Phenology shifts at start vs. end of growing season in temperate vegetation over the Northern Hemisphere for the period 1982–2008. Glob. Change Biol 2011, 17, 2385–2399. [Google Scholar]
  25. Debeurs, K.M.; Henebry, G.M. Trend analysis of the Pathfinder AVHRR Land (PAL) NDVI data for the deserts of Central Asia. IEEE Geosci. Remote Sens. Lett 2004, 1, 282–286. [Google Scholar]
  26. Piao, S.; Mohammat, A.; Fang, J.; Cai, Q.; Feng, J. NDVI-based increase in growth of temperate grasslands and its responses to climate changes in China. Global Environ. Change 2006, 16, 340–348. [Google Scholar]
  27. Zhang, G.; Zhang, Y.; Dong, J.; Xiao, X. Green-up dates in the Tibetan Plateau have continuously advanced from 1982 to 2011. Proc. Natl. Acad. Sci. USA 2013, 110, 4309–4314. [Google Scholar]
  28. Fensholt, R.; Rasmussen, K.; Kaspersen, P.; Huber, S.; Horion, S.; Swinnen, E. Assessing land degradation/recovery in the African Sahel from long-term earth observation based primary productivity and precipitation relationships. Remote Sens 2013, 5, 664–686. [Google Scholar]
  29. Rogier, D.J.; Verbesselt, J.; Zeileis, A.; Schaepman, M.E. Shifts in global vegetation activity trends. Remote Sens 2013, 5, 1117–1133. [Google Scholar]
  30. Hashimoto, H.; Wang, W.; Milesi, C.; Xiong, J.; Ganguly, S.; Zhu, Z.; Nemani, R.R. Structural uncertainty in model-simulated trends of global Gross Primary Production. Remote Sens 2013, 5, 1258–1273. [Google Scholar]
  31. Mao, J.; Shi, X.; Thornton, P.E.; Hoffman, F.M.; Zhu, Z.; Myneni, R.B. Global latitudinal-asymmetric vegetation growth trends and their driving mechanisms: 1982–2009. Remote Sens 2013, 5, 1484–1497. [Google Scholar]
  32. Vrieling, A.; de Leeuw, J.; Said, M.Y. Length of growing period over Africa: Variability and trends from 30 years of NDVI time series. Remote Sens 2013, 5, 982–1000. [Google Scholar]
  33. Heinsch, F.A.; Zhao, M.; Running, S.W.; Kimball, J.S.; Nemani, R.R.; Davis, K.J.; Bolstad, P.V.; Cook, B.D.; Desai, A.R.; Ricciuto, D.M. Evaluation of remote sensing based terrestrial productivity from MODIS using regional tower eddy flux network observations. IEEE Trans. Geosci. Remote Sens 2006, 44, 1908–1925. [Google Scholar]
  34. Running, S.W.; Baldocchi, D.D.; Turner, D.P.; Gower, S.T.; Bakwin, P.S.; Hibbard, K.A. A global terrestrial monitoring network integrating tower fluxes, flask sampling, ecosystem modeling and EOS satellite data. Remote Sens. Environ 1999, 70, 108–127. [Google Scholar]
  35. Reich, P.B.; Turner, D.P.; Bolstad, P. An approach to spatially distributed modeling of net primary production (NPP) at the landscape scale and its application in validation of EOS NPP products. Remote Sens. Environ 1999, 70, 69–81. [Google Scholar]
Figure 1. Vegetated area (light gray) identified in this study.
Remotesensing 05 04031f1
Figure 2. Overall changing trends in the growing-season NDVI detected from (a) NDVIg and (b) NDVI3g during 1982–2008.
Remotesensing 05 04031f2
Figure 3. Frequency distribution for the overall changing trends (P < 0.05) in growing-season NDVI derived from different NDVI data sets.
Remotesensing 05 04031f3
Figure 4. Differences between NDVI3g and NDVIg in the overall changing trends of growing-season NDVI during 1982–2008.
Remotesensing 05 04031f4
Figure 5. Timing of turning point (TP) in the growing-season NDVI time series detected from (a) NDVIg and (b) NDVI3g during 1982–2008.
Remotesensing 05 04031f5
Figure 6. Frequency distribution for the turning point (TP) in the growing-season NDVI derived from different NDVI data sets.
Remotesensing 05 04031f6
Figure 7. Differences between NDVI3g and NDVIg in the timing of turning point (TP) of growing-season NDVI during 1982–2008.
Remotesensing 05 04031f7
Figure 8. Response of growing-season NDVI to temperature change detected from (a) NDVIg and (b) NDVI3g during 1982–2008.
Remotesensing 05 04031f8
Figure 9. Frequency distribution for the response of growing-season NDVI to temperature change (P < 0.05) derived from different NDVI data sets.
Remotesensing 05 04031f9
Figure 10. Differences between NDVI3g and NDVIg in the response of growing-season NDVI to temperature change during 1982–2008.
Remotesensing 05 04031f10
Figure 11. Response of growing-season NDVI to precipitation change detected from (a) NDVIg and (b) NDVI3g during 1982–2008.
Remotesensing 05 04031f11
Figure 12. Frequency distribution for the response of growing-season NDVI to precipitation change (P < 0.05) derived from different NDVI data sets.
Remotesensing 05 04031f12
Figure 13. Differences between NDVI3g and NDVIg in the response of growing-season NDVI to precipitation change during 1982–2008.
Remotesensing 05 04031f13

