3.1. GPS Reflected Signals and Physical Reflectivity
According to
Equation (1), the multipath signatures caused by GPS reflected signals are critically dependant on the satellite elevation angle (
ε) and GPS antenna height (
H). It is assumed that GPS scattered and reflected wavelengths (
λ) as well as the ratio of the reflected signal amplitude relative to the direct one (
α) (
α = 0.06; according to [
10]) are constants.
In order to present the multipath signature variability with respect to
H and
ε variations during the specified time period, the velocity equations are used. In fact, the velocity equations are the derivatives of the original shifted phase signal to the total value of direct and reflected signal upon subjecting to
H and
ε values, which have been proposed respectively in
Equations (5) and
(10).
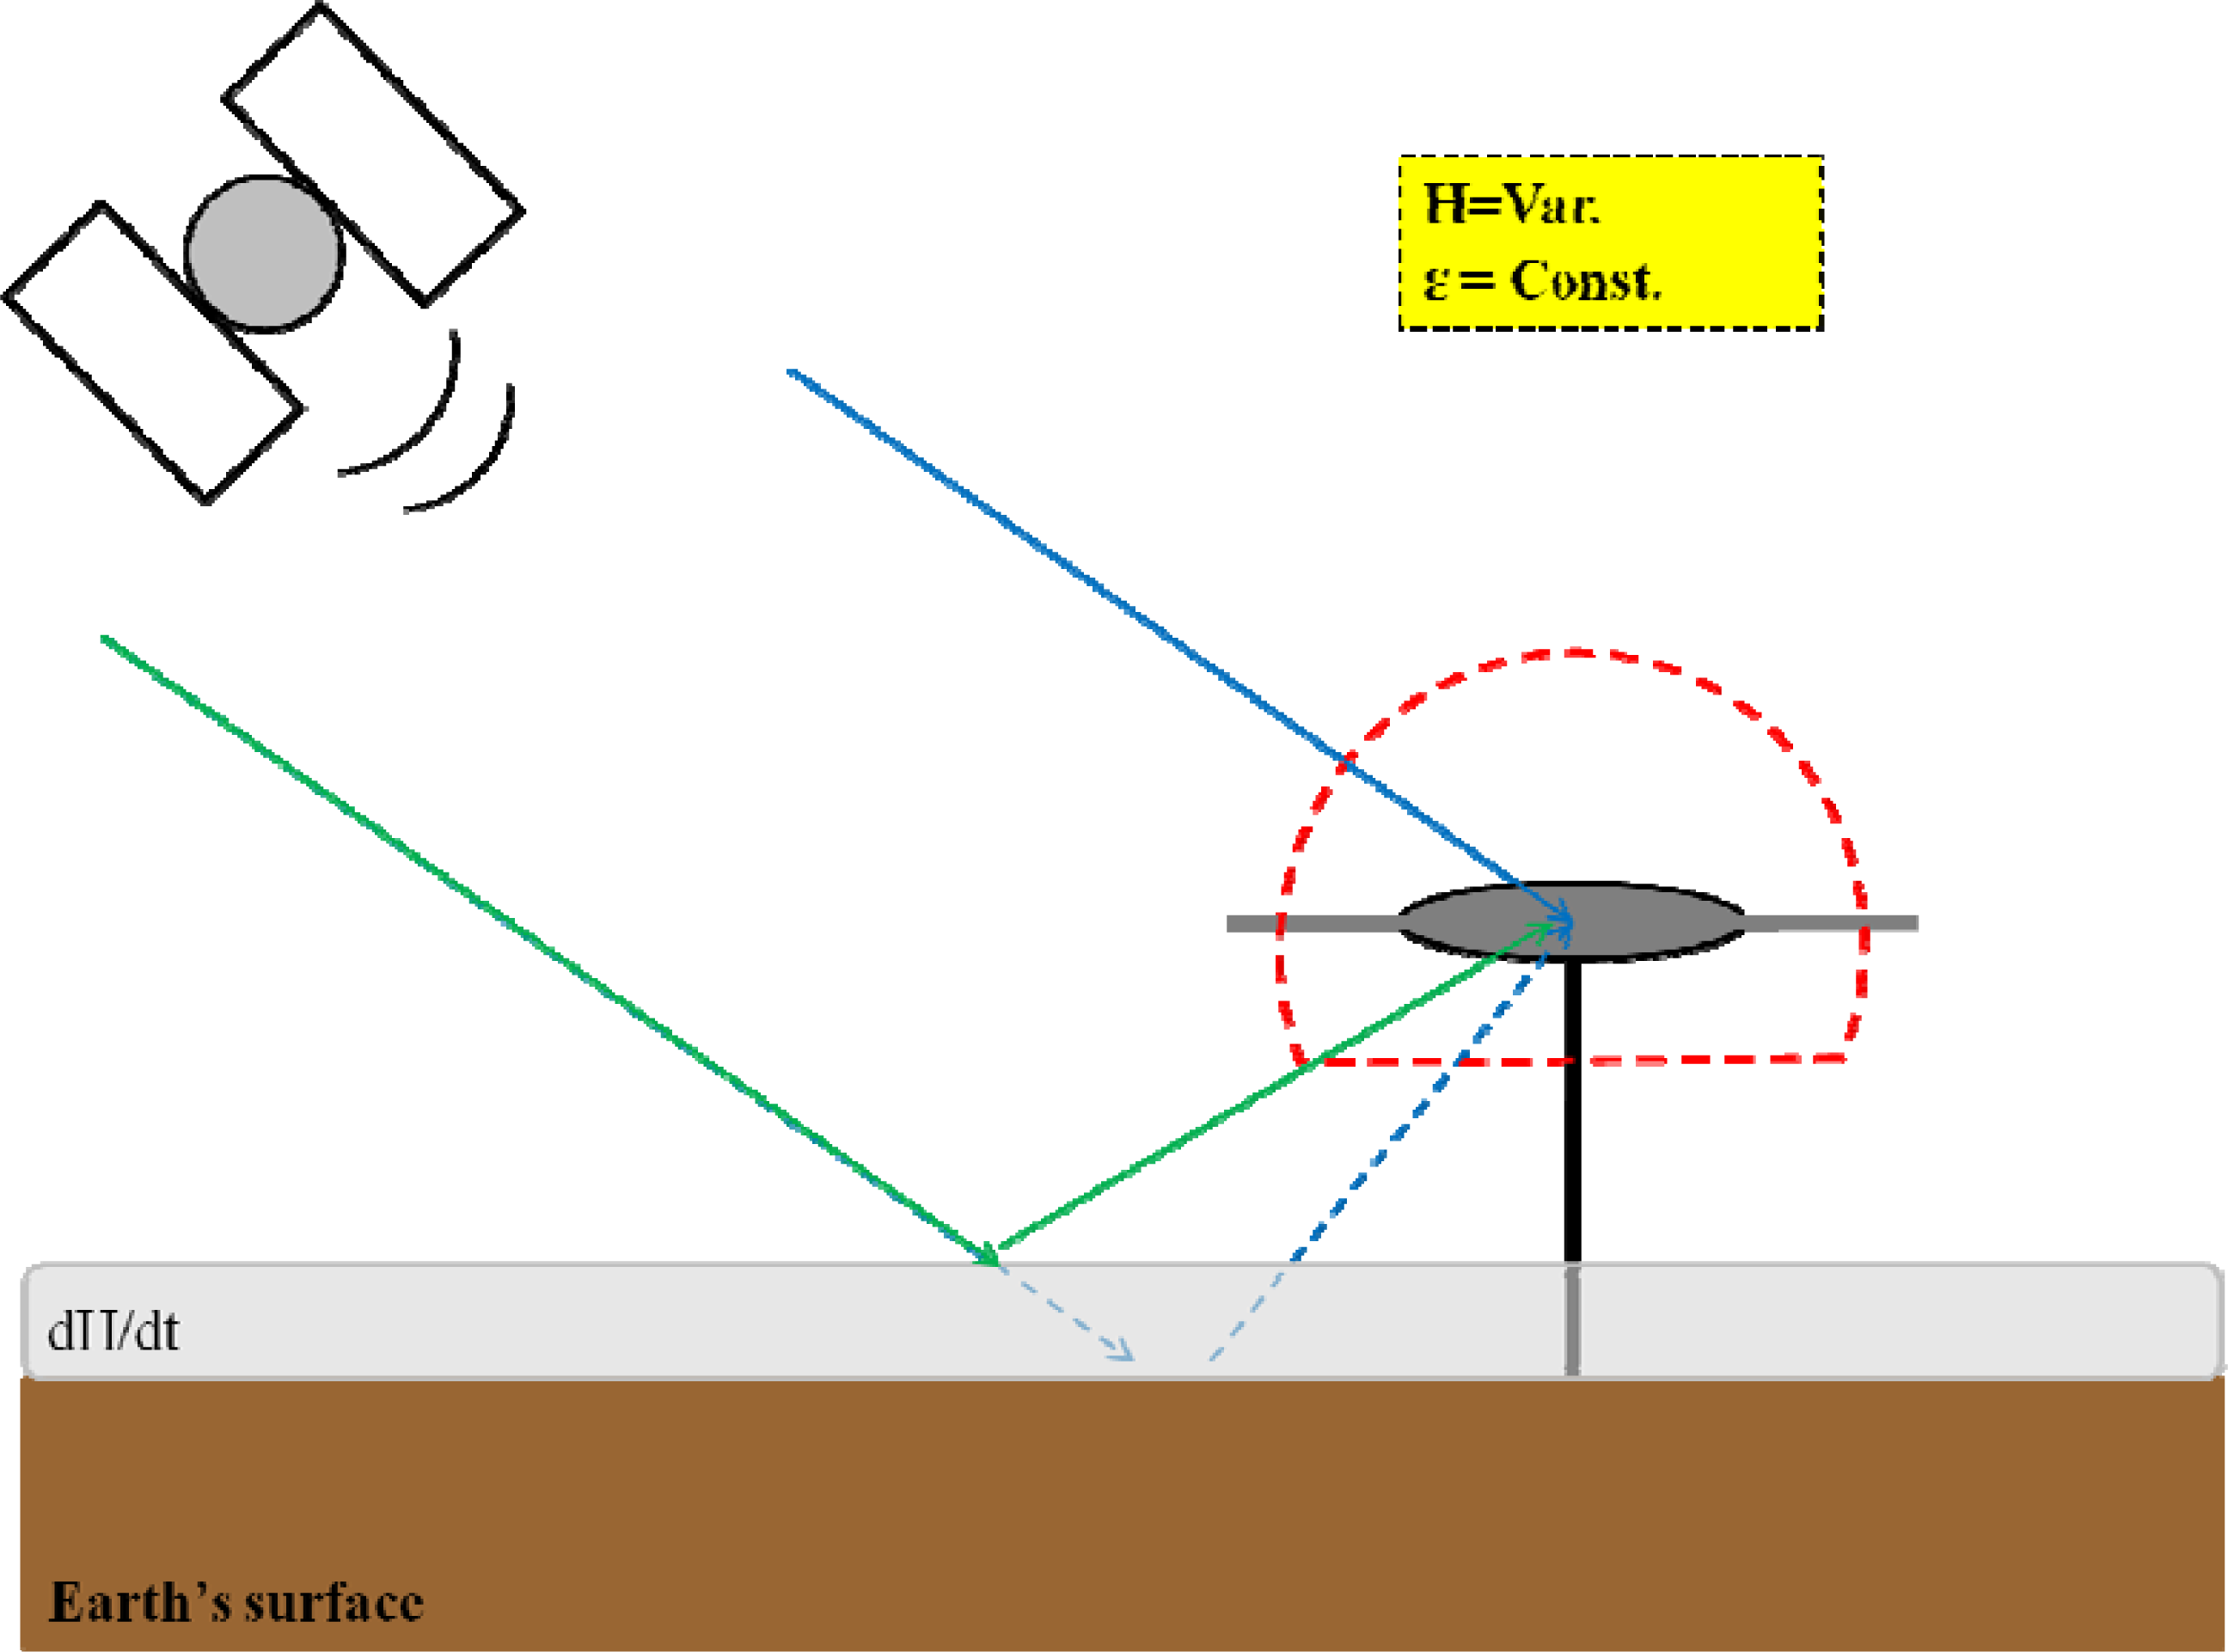
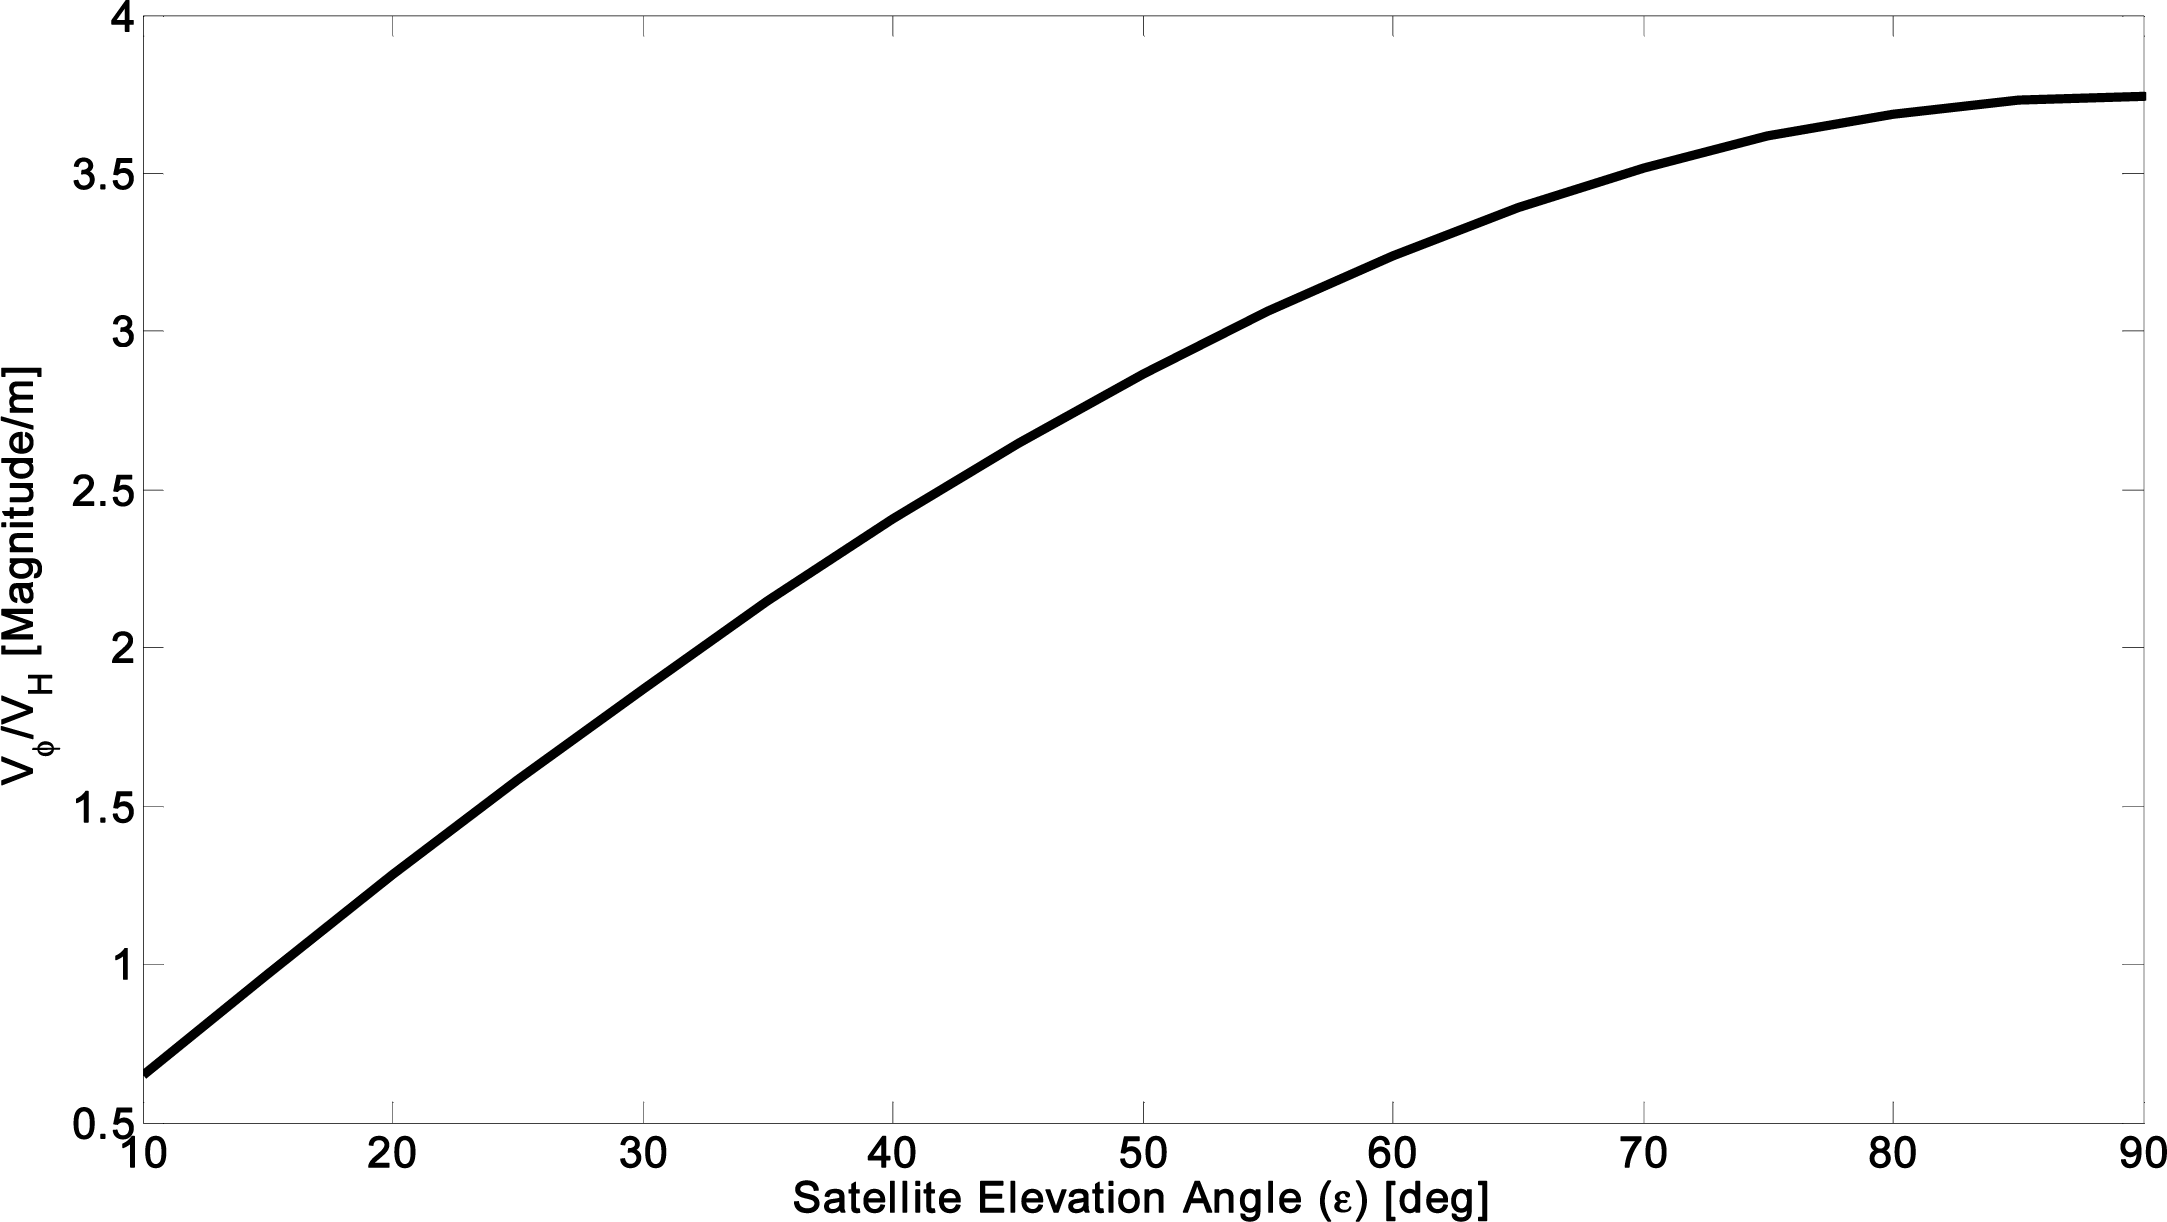
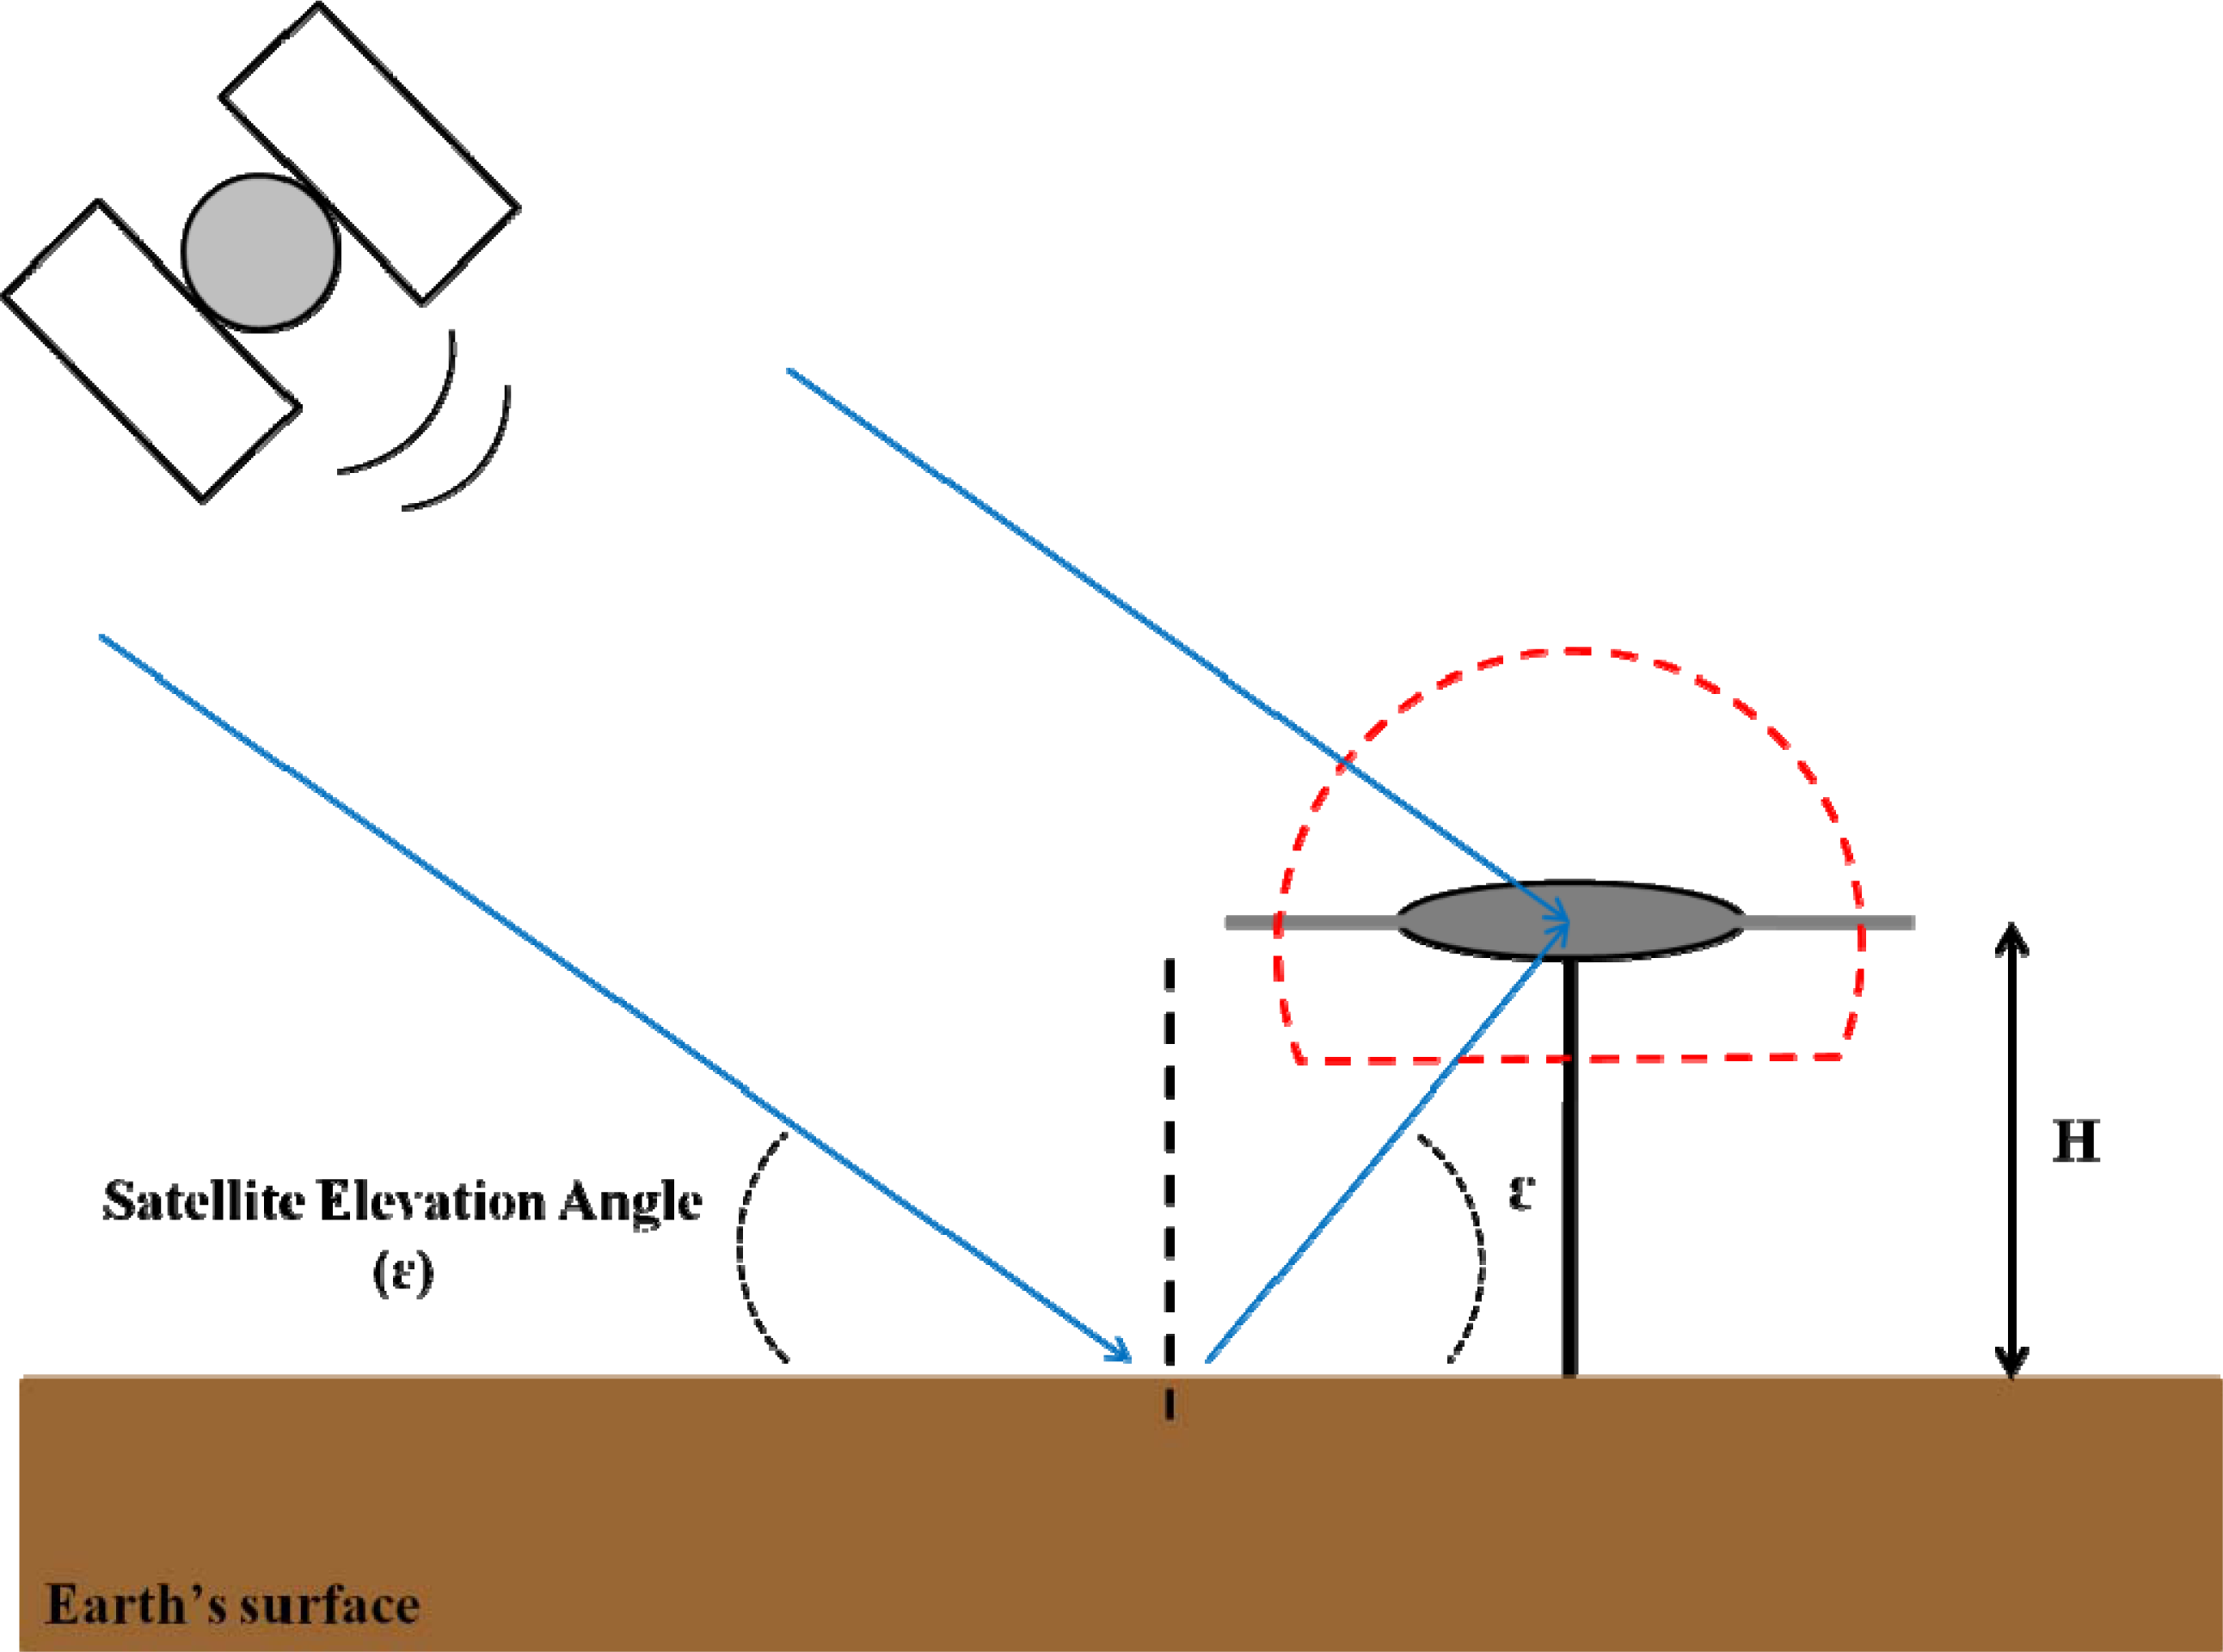
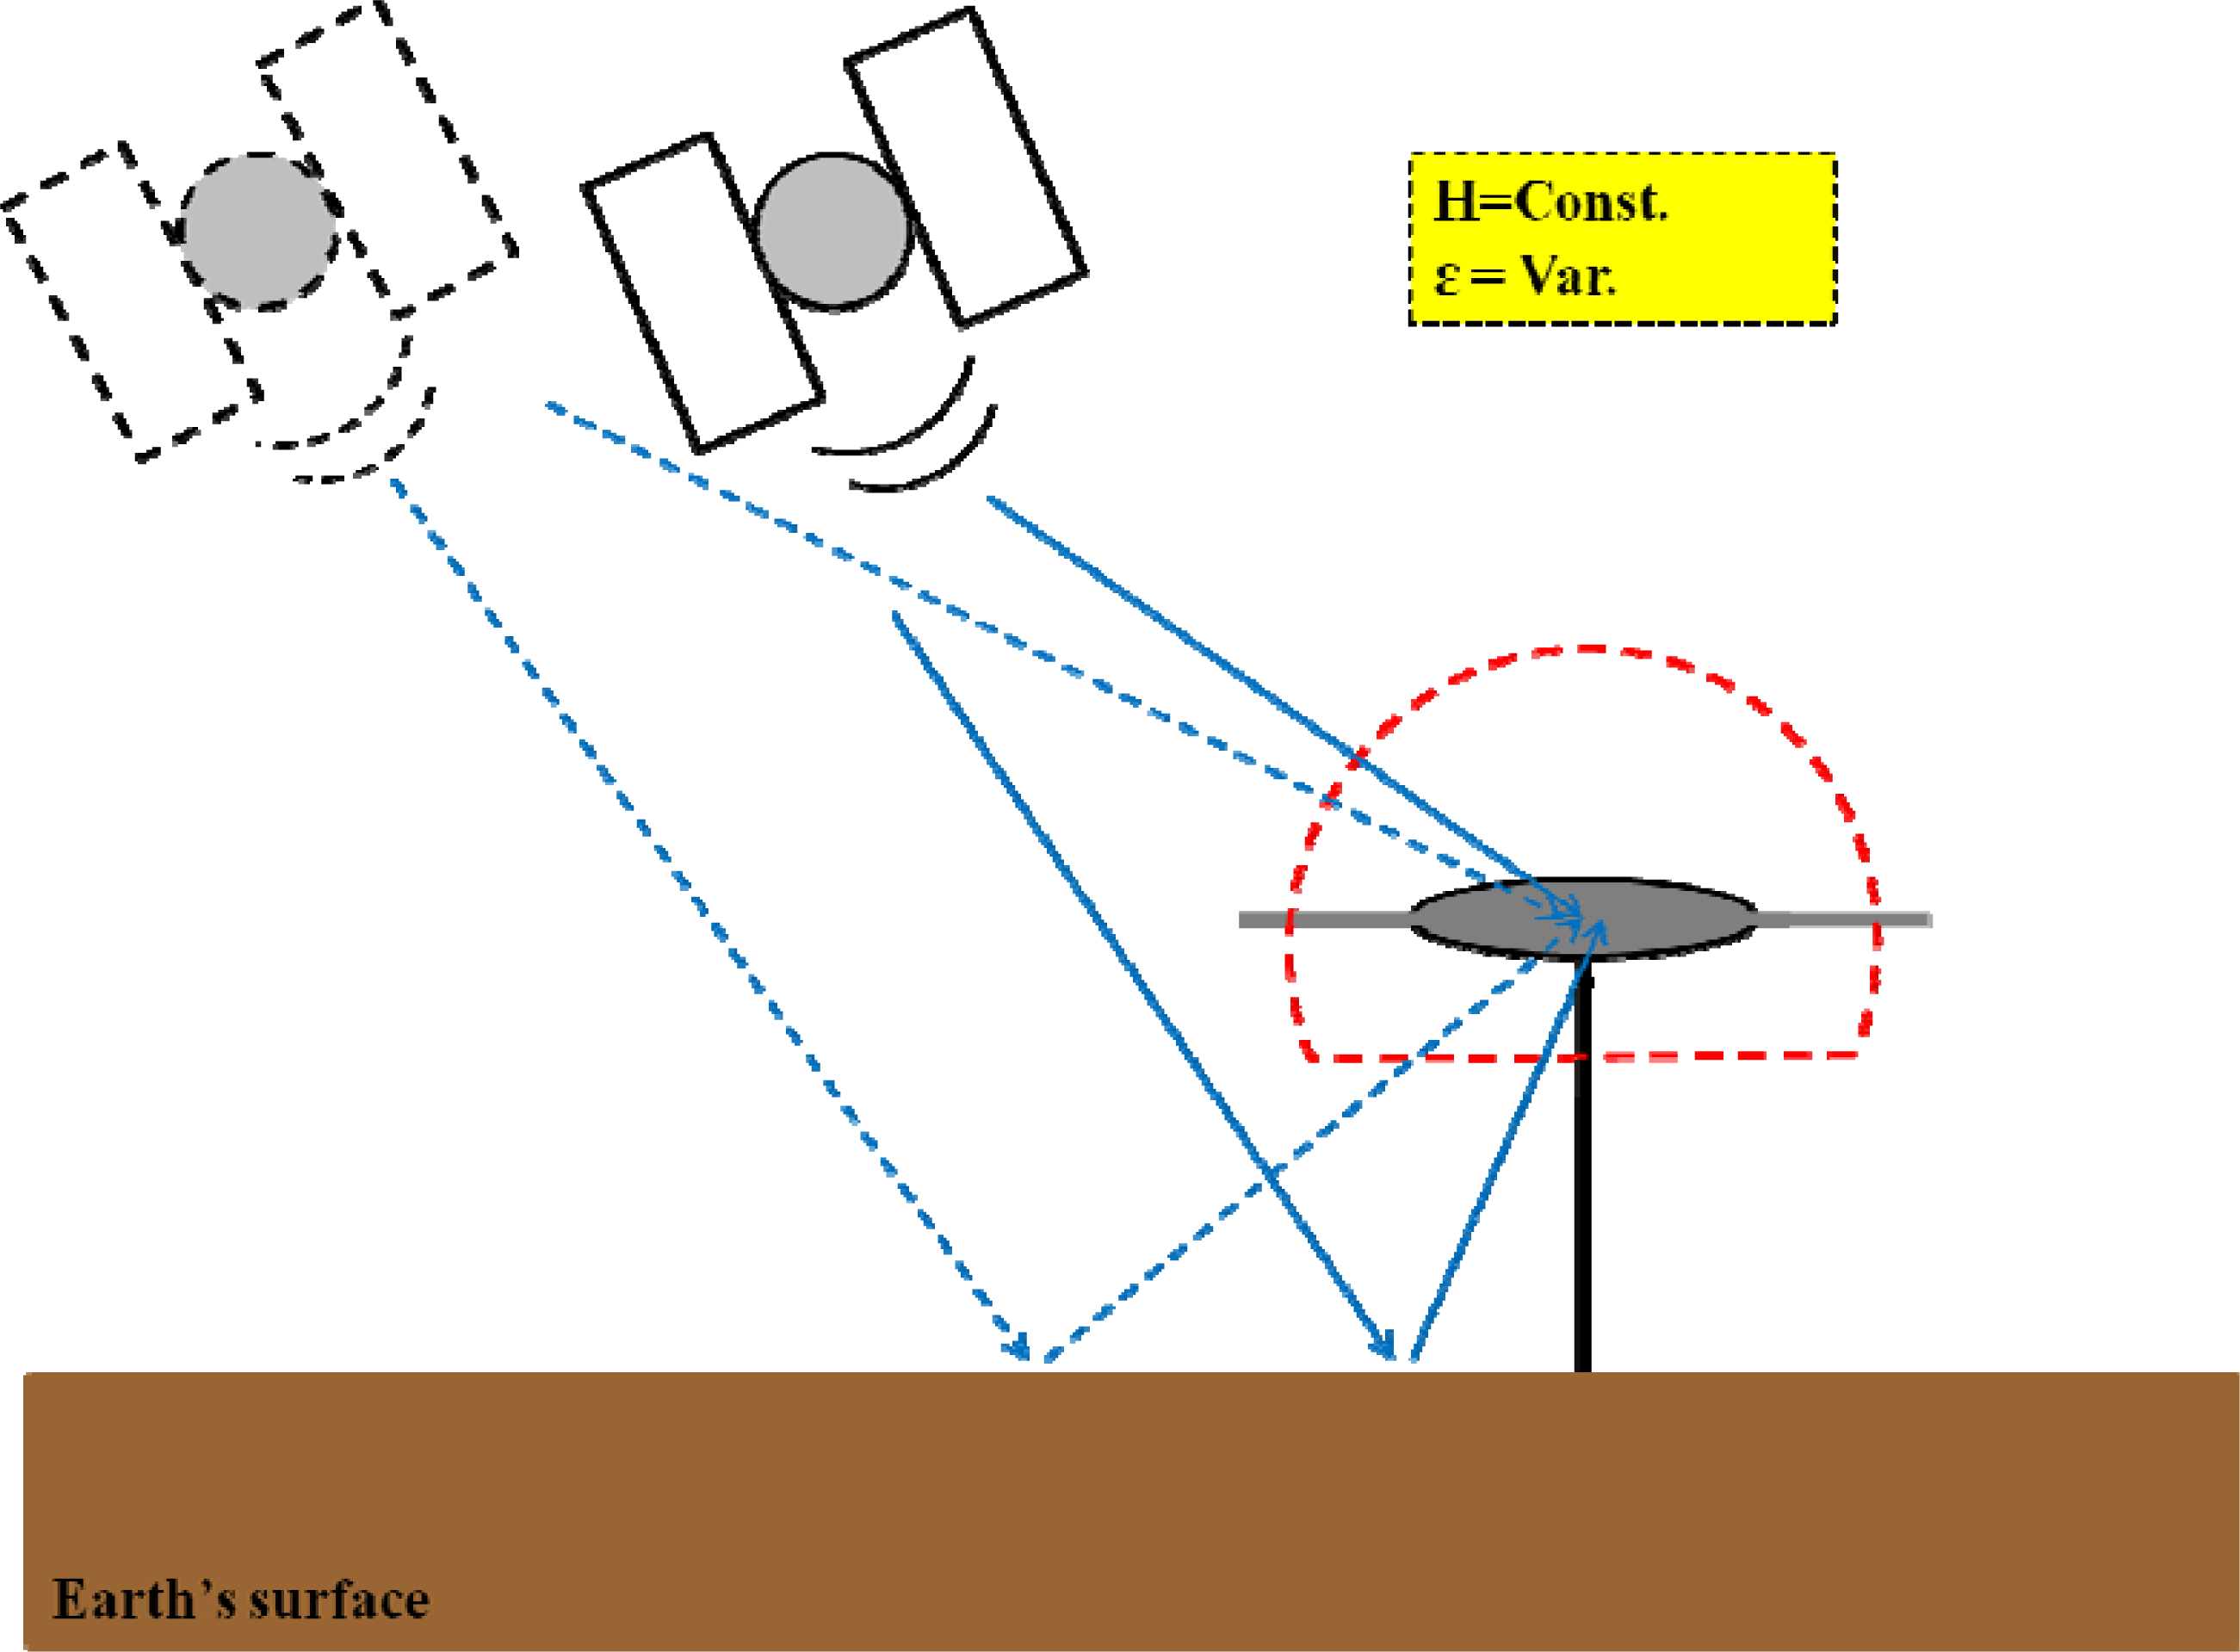
If no change has been made into surrounding the ground GPS station receiver’s initial natural condition practically (e.g., snow accumulation) or the GPS antenna is not being replaced with another one, H will be constant (
Figure 4). Thereafter, the variability of multipath signatures subjected to the changes in satellite elevation angle itself (
Vε) and also the variability of multipath signatures subjected to the GPS antenna height variations (
VH) can be analyzed in the different
H values (depending on the type of GPS antenna product). They are presented in
Figures 5 and
6, respectively.
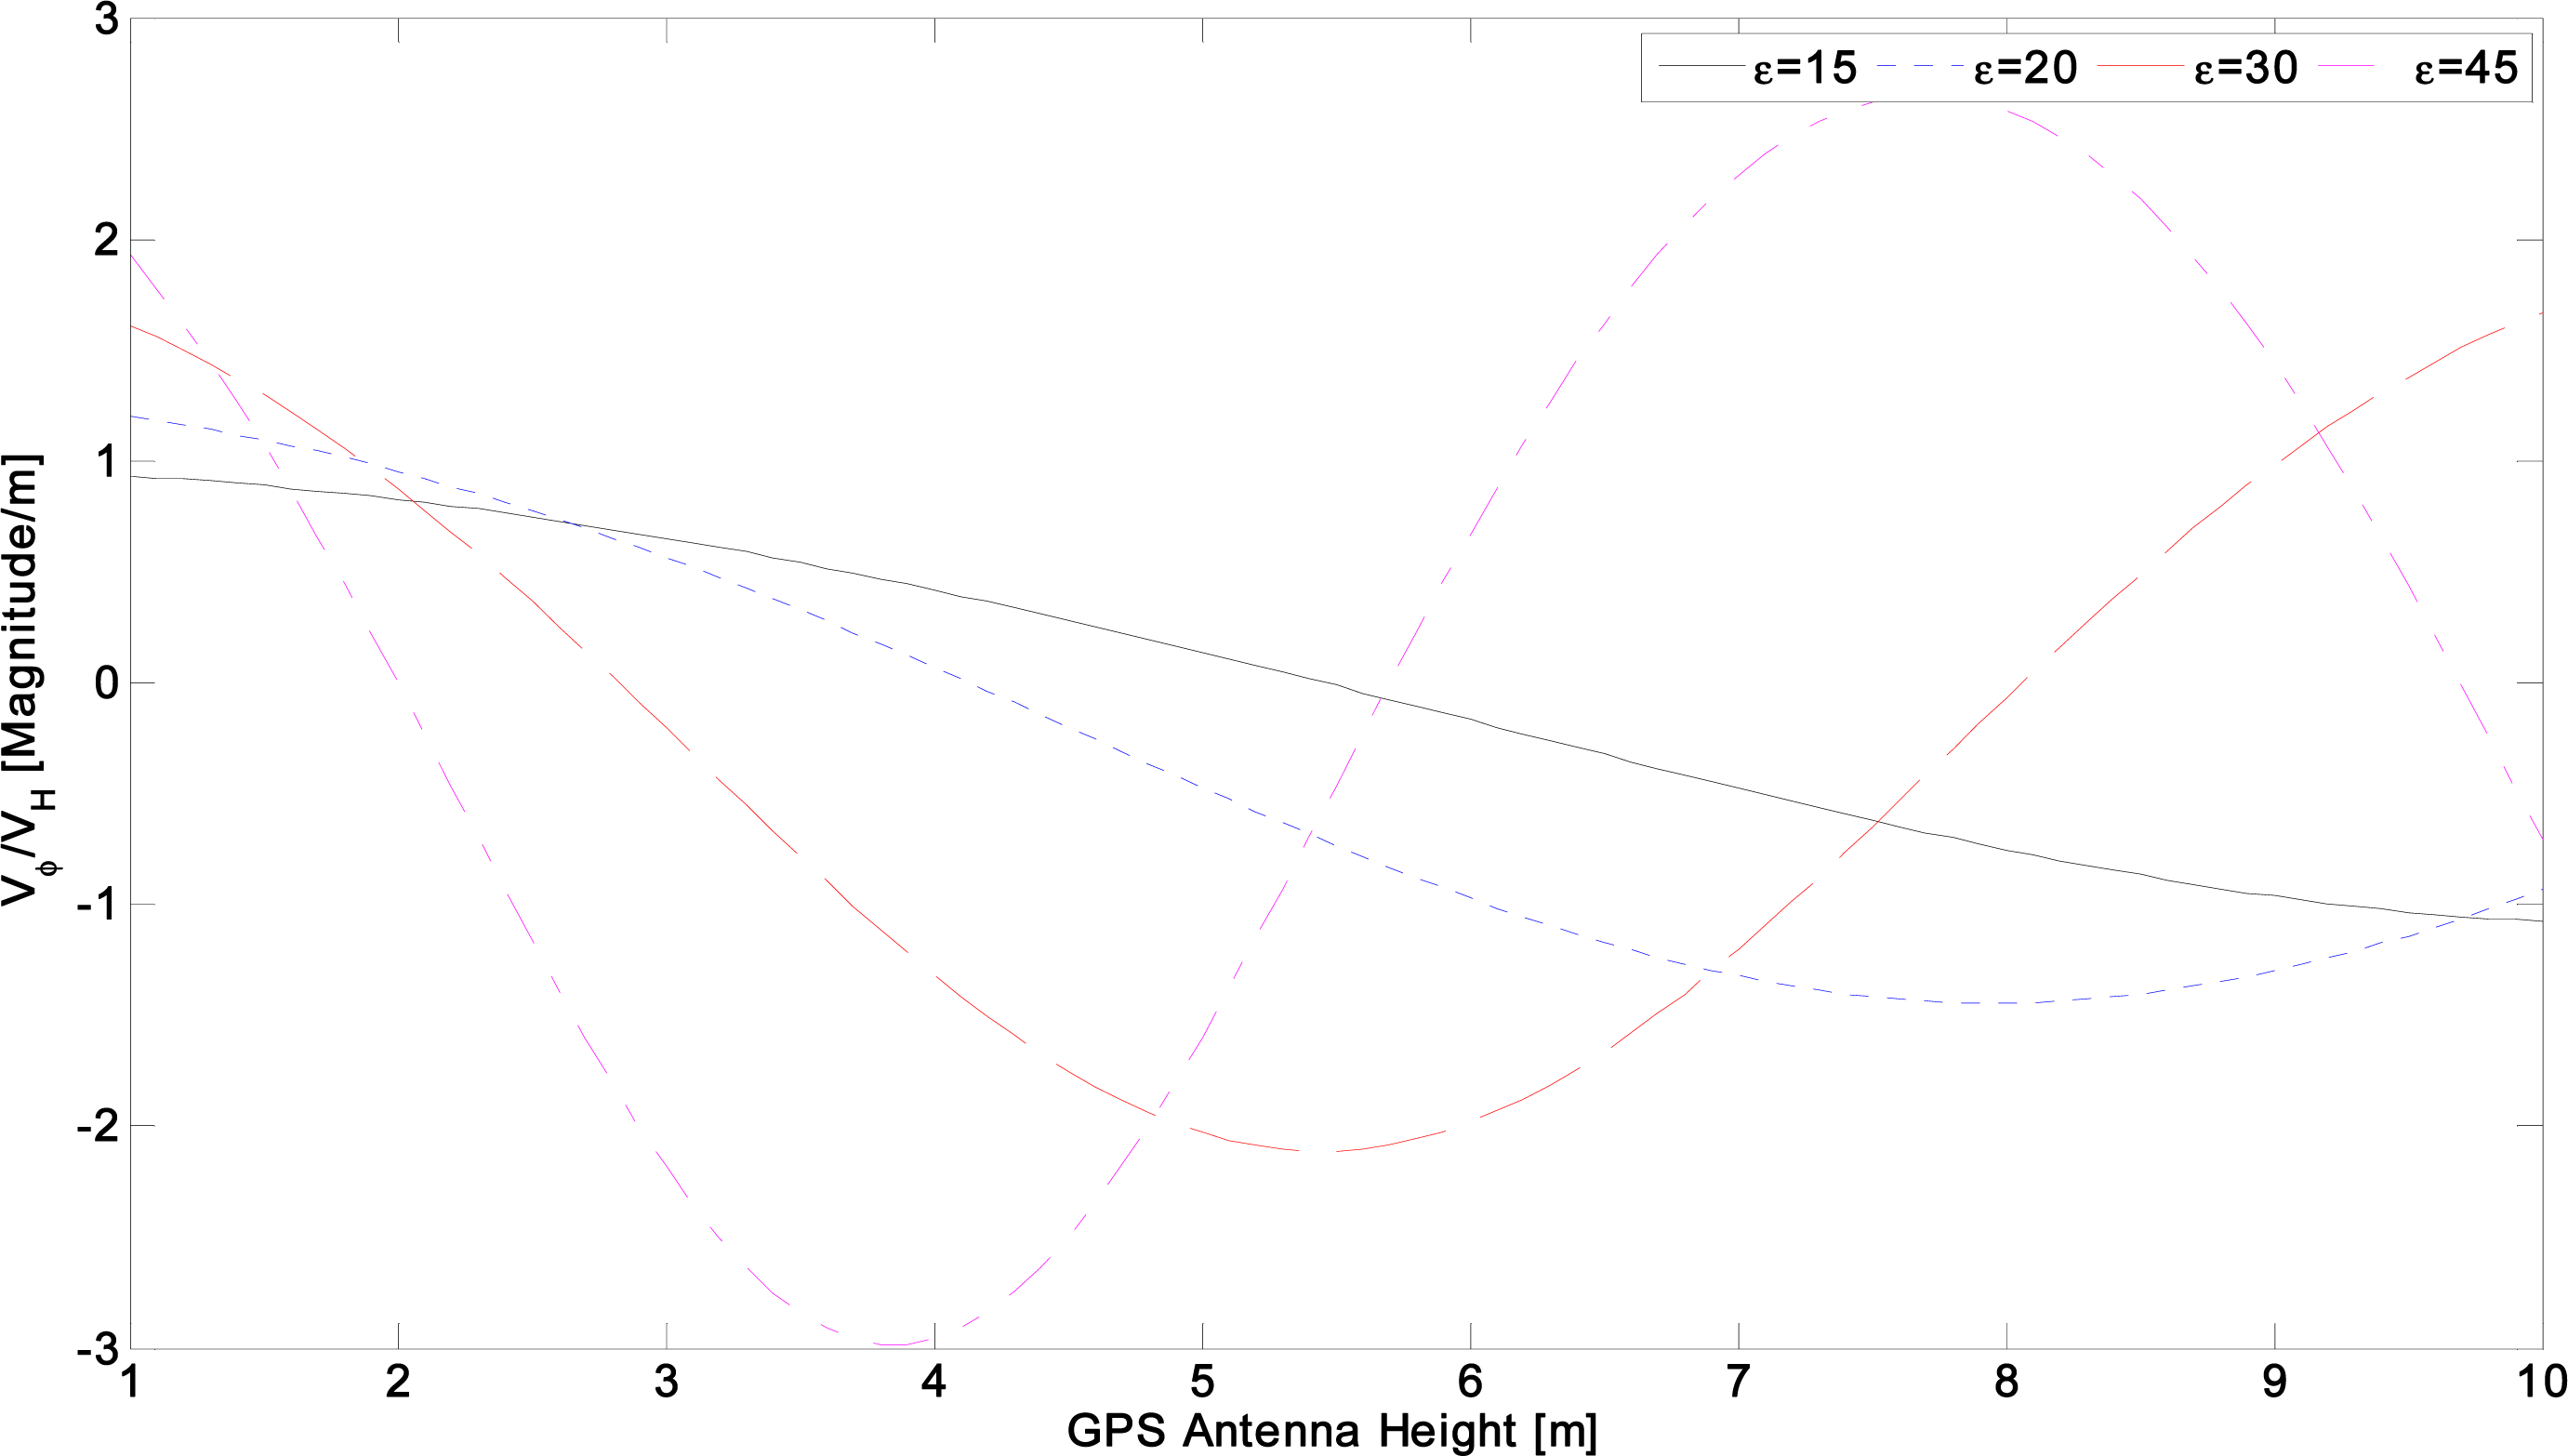
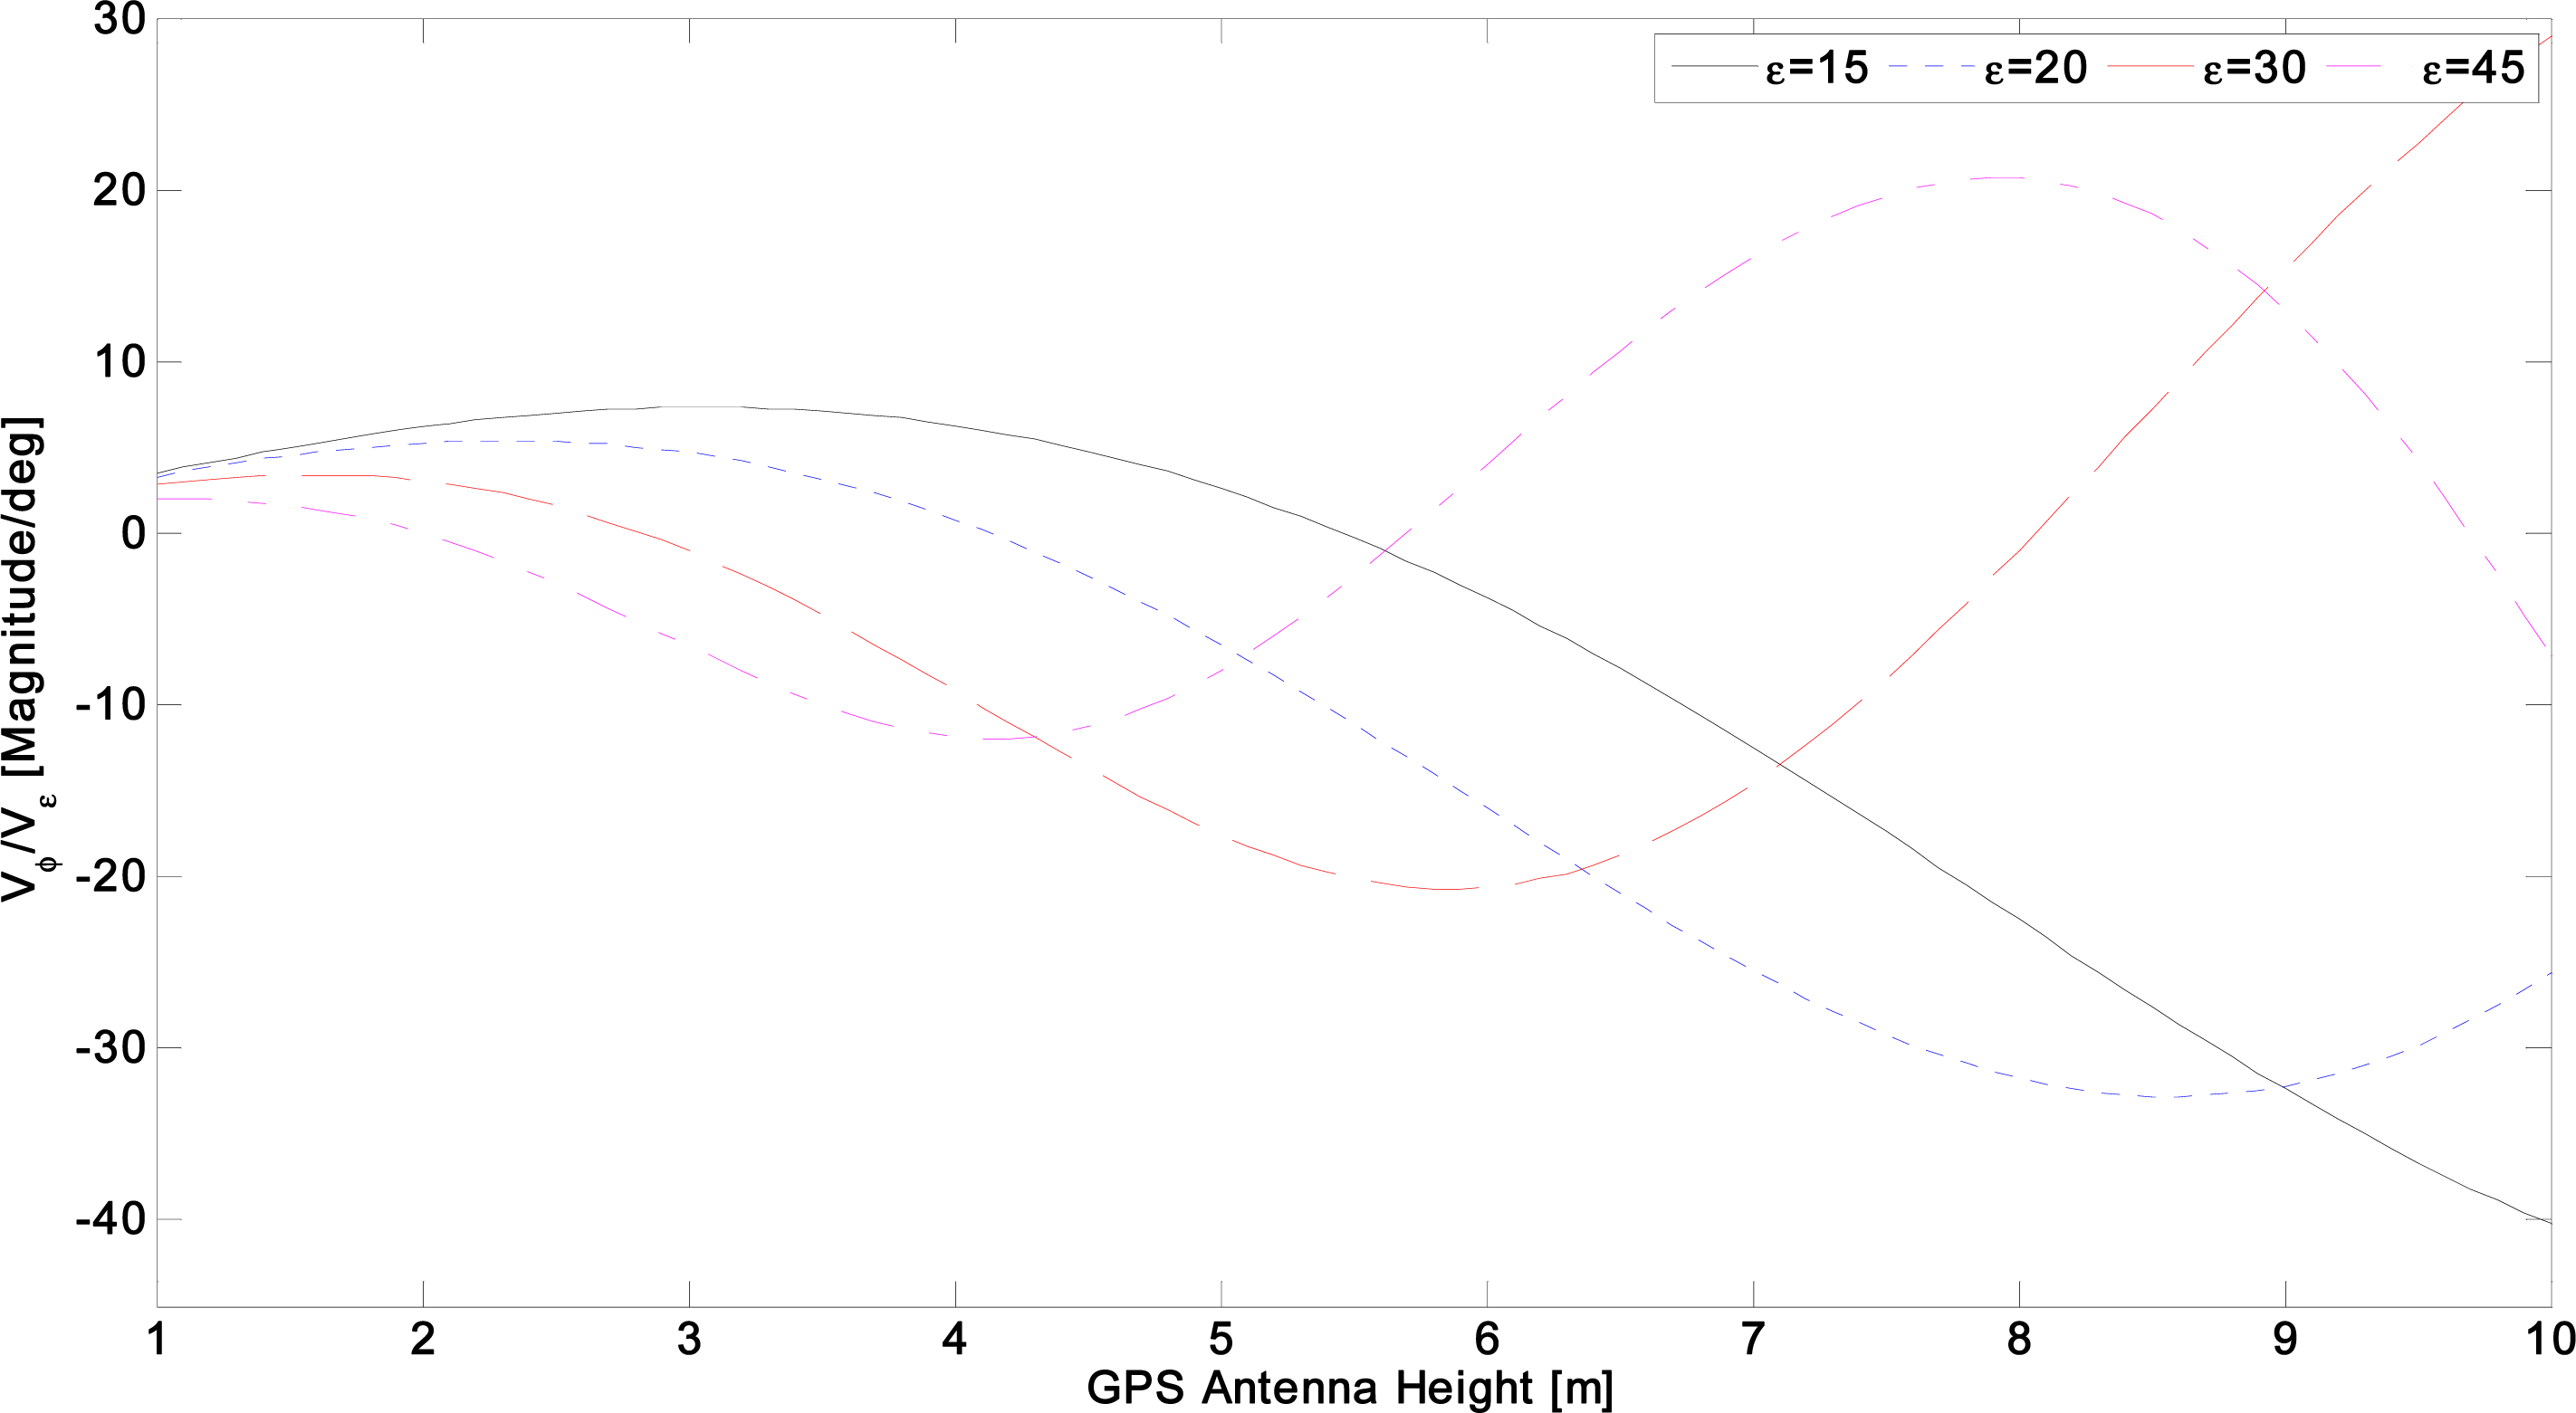
Although in this case where
H is constant and
ε is varying as GPS satellites are moving perpetually during the specified time span, but as presented in
Figures 5 and
6, the variability of multipath signature for
ε variations is more sensitive than
H ones. The
VΦ/
Vε for a determined H and ε value has a much greater value than the same
H and
ε for
VΦ/
VH (for example in both
Figures 5 and
6, the unique values of
H = 4 m and
ε = 45° have
VΦ/
VH ≈ −3 and
VΦ/
Vε ≈ −10 or
H = 7 m and
ε = 30° have
VΦ/
VH ≈ −1 and
VΦ/
Vε ≈ −20, respectively). This demonstrates the determinant role of
ε in multipath signature variability when ε is changing. According to this, an investigation is needed for the case where both
ε and
H are varied.
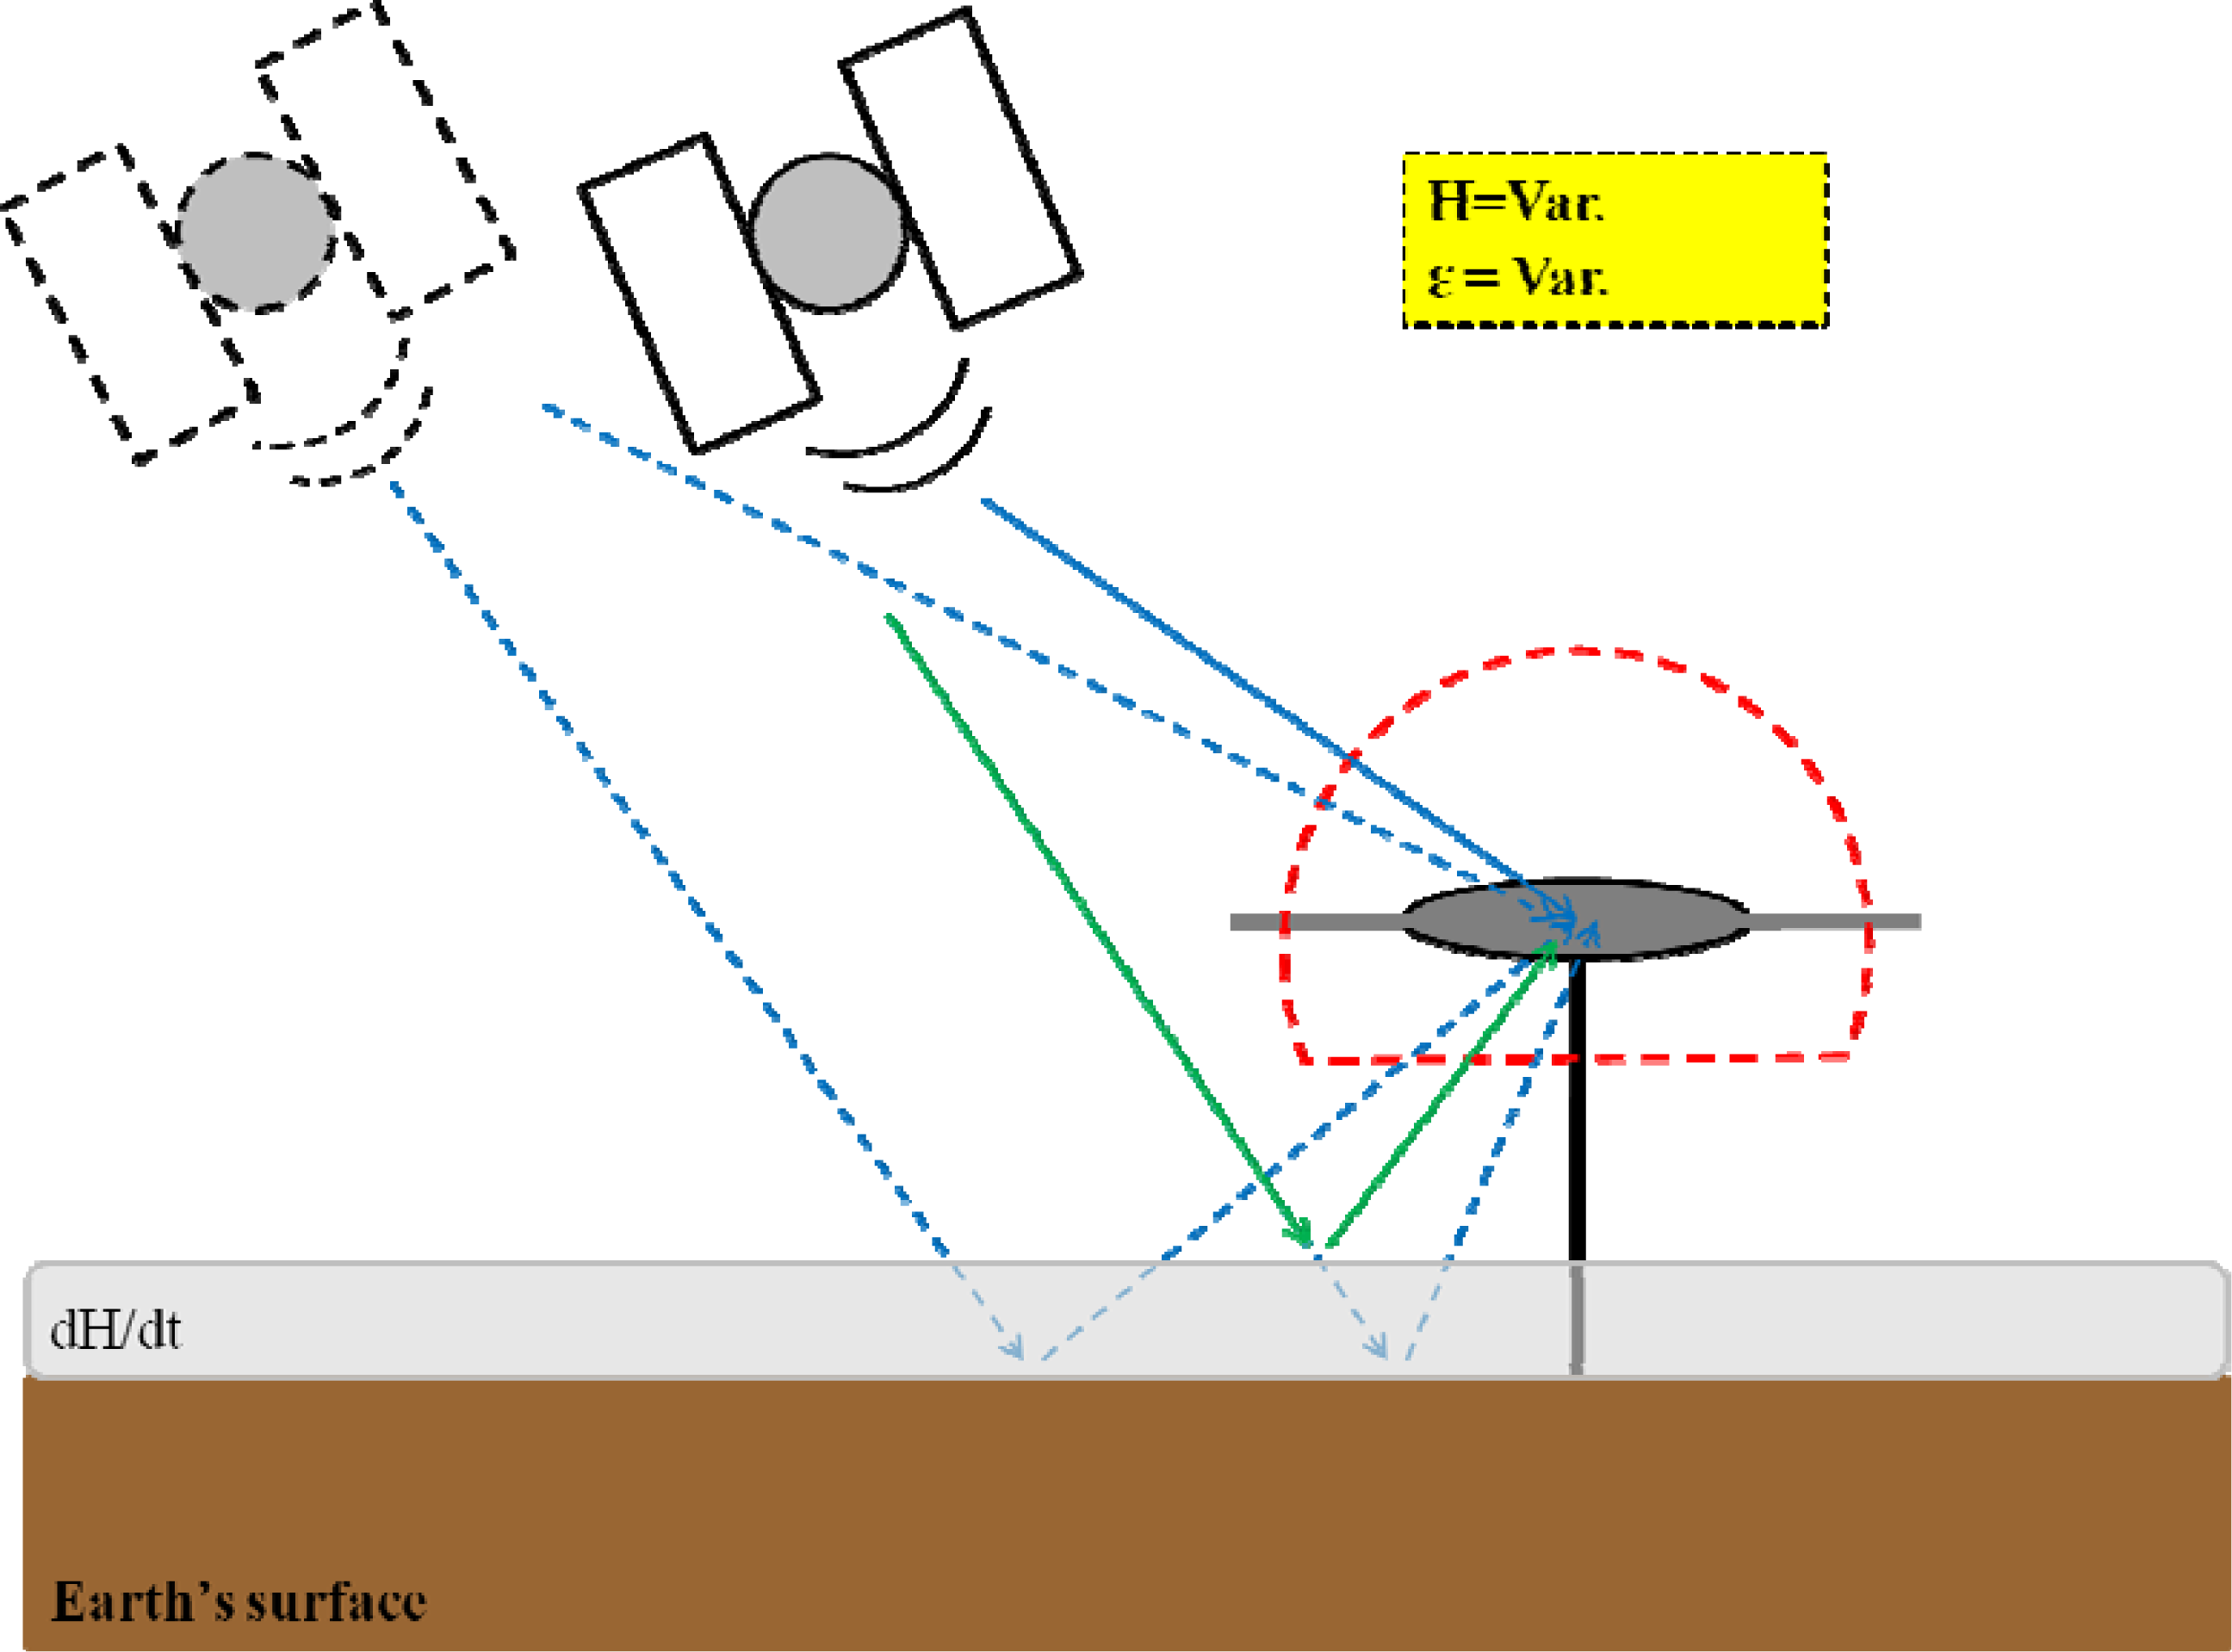
Therefore, to take into account the
ε variations during the certain time span, if
H changes sizably (e.g., due to snow accumulation or ice melting), it will lead to the sudden physical variations in ground GPS station’s surrounds (
Figure 7). By using
Equations (5) and
(10) as the derivatives of multipath signatures variations subjected to the variability in
H and
ε, it can provide us with the trend of GPS scattered and reflected signals interacting with the ground GPS station receiver’s environment, as shown in
Figures 8 and
9, respectively.
From
Figure 7, when the GPS satellite location changes, obviously the scattered and reflected signals are changed as the direction of these signals is switching to different planes. However, as described in
Figures 4 and
6, the
ε variations result in large multipath signature variability values; particularly a sudden small increase in
H can make it more sensitive to the small changes in
ε, shown in both
Figures 8 and
9. Additionally, the multipath signature variability with respect to
ε is more sensitive than
H, which is clear by comparing
Figure 8 and
Figure 9.
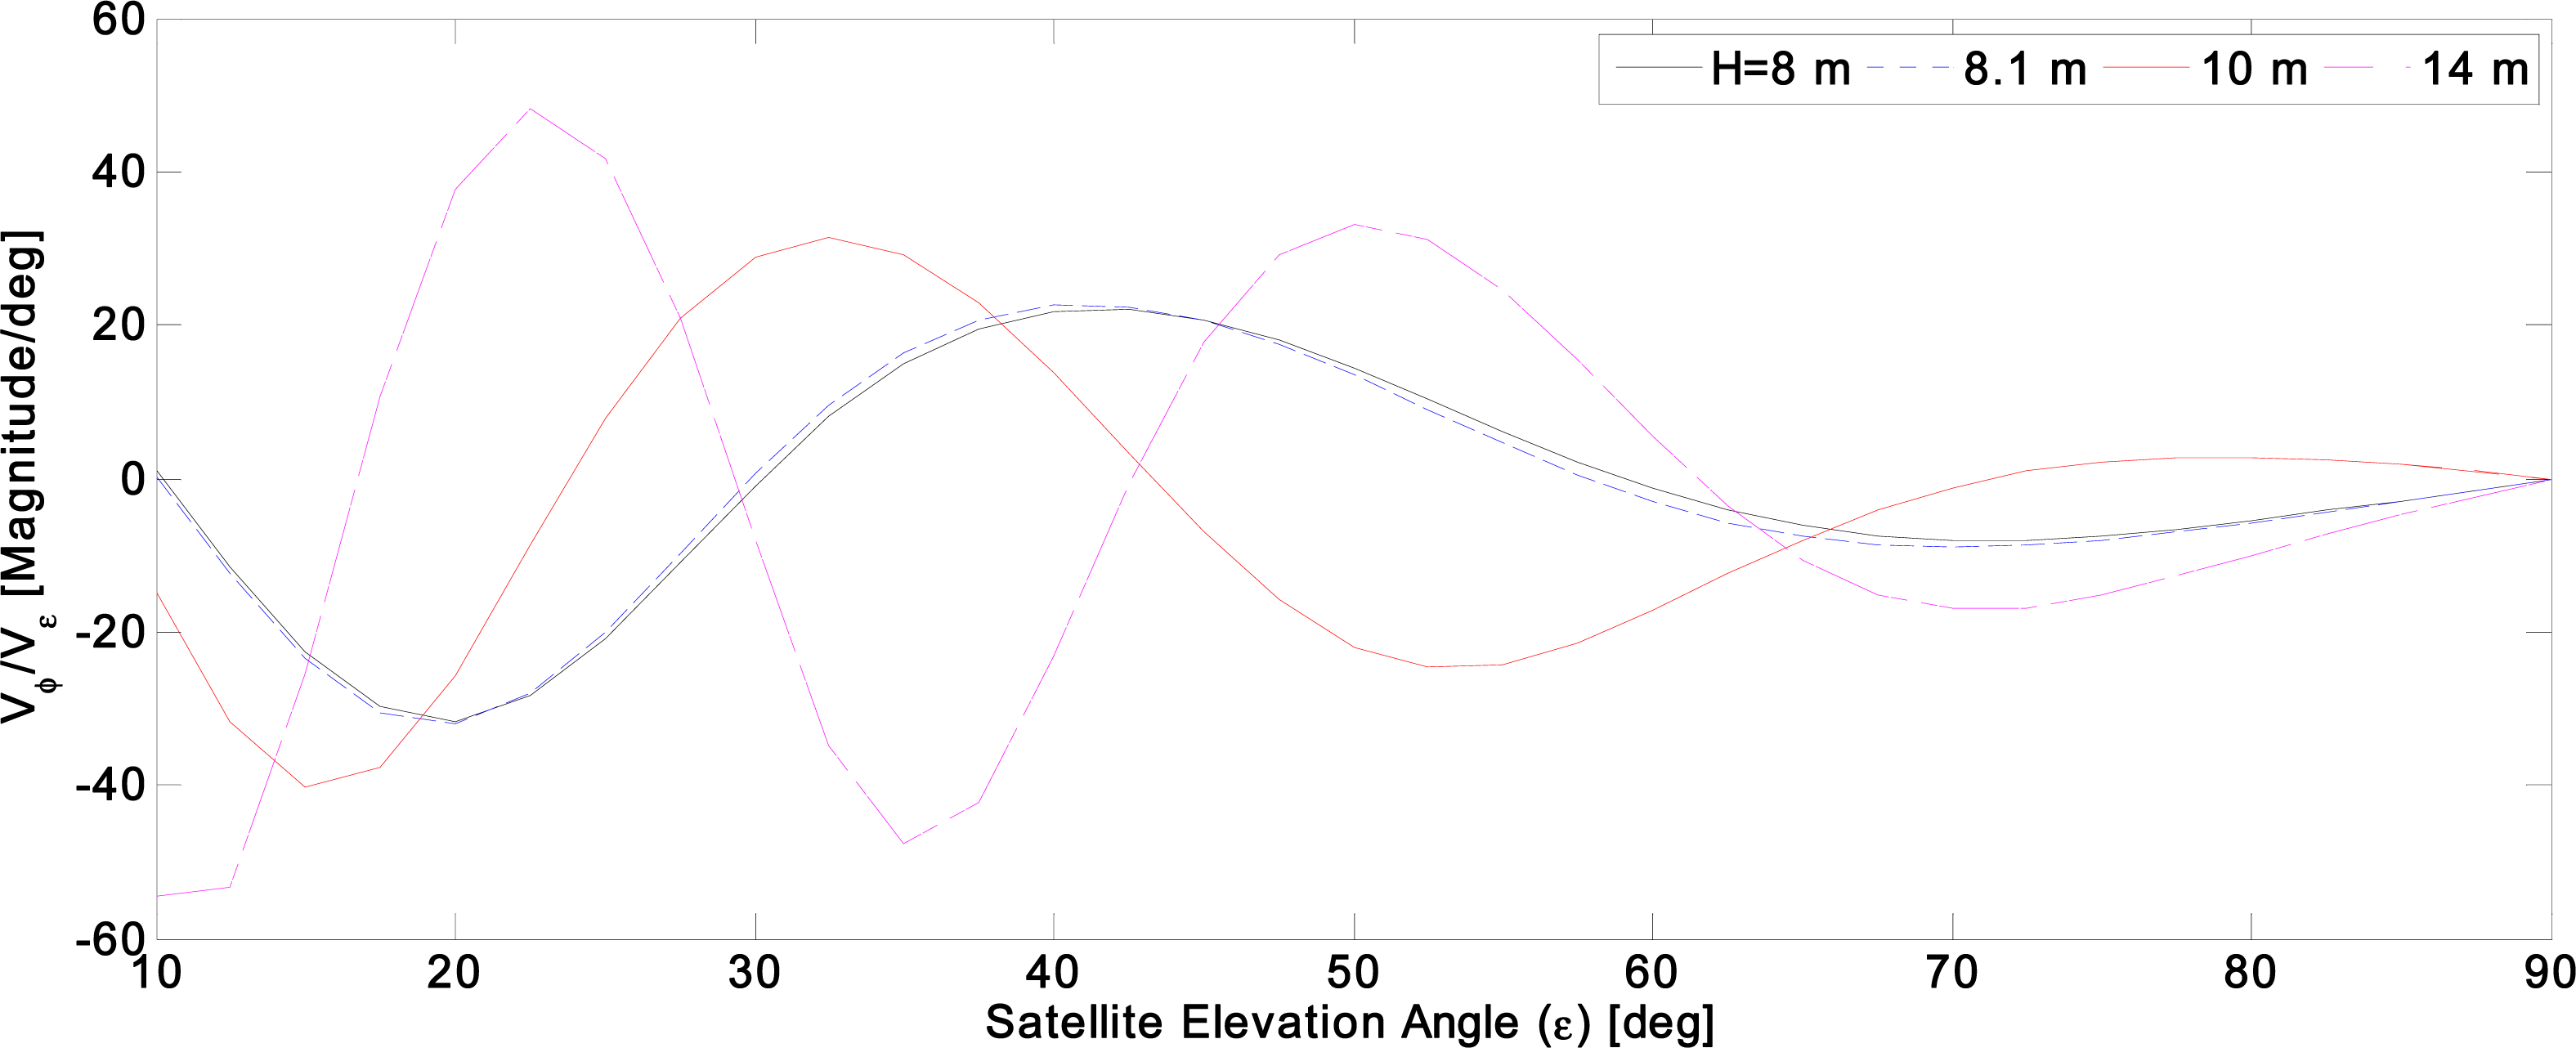
Similarly, if
ε does not vary during this time, or the ground GPS receiver only tracks a specific single GPS satellite, and in a certain elevation (e.g.,
Figure 10), the multipath signature variability values with respect to
H variations will be periodic. These variability values critically depend on
H (clearly, also depend on a fixed
ε value), which is demonstrated in
Figure 11 for
H between a height of 8 and 8.8 m.
The only reason that can restrict the reflected signal’s angle when
ε is constant and
H is varied during the time is the sudden variation in
H (it may be due to H variation manually or changes in the physical conditions surrounding the ground receiver). As it is shown in
Figure 11, a nearly 15 cm increase in
H value (e.g., from 8.15 to 8.3 m) can lead to a significant change in multipath signature variability from a maximum value to a minimum one (See
Figure 11). In addition, this variability has periodic trend and depends on a fixed
ε value which is considered here equal to 25° (
ε = 25°).
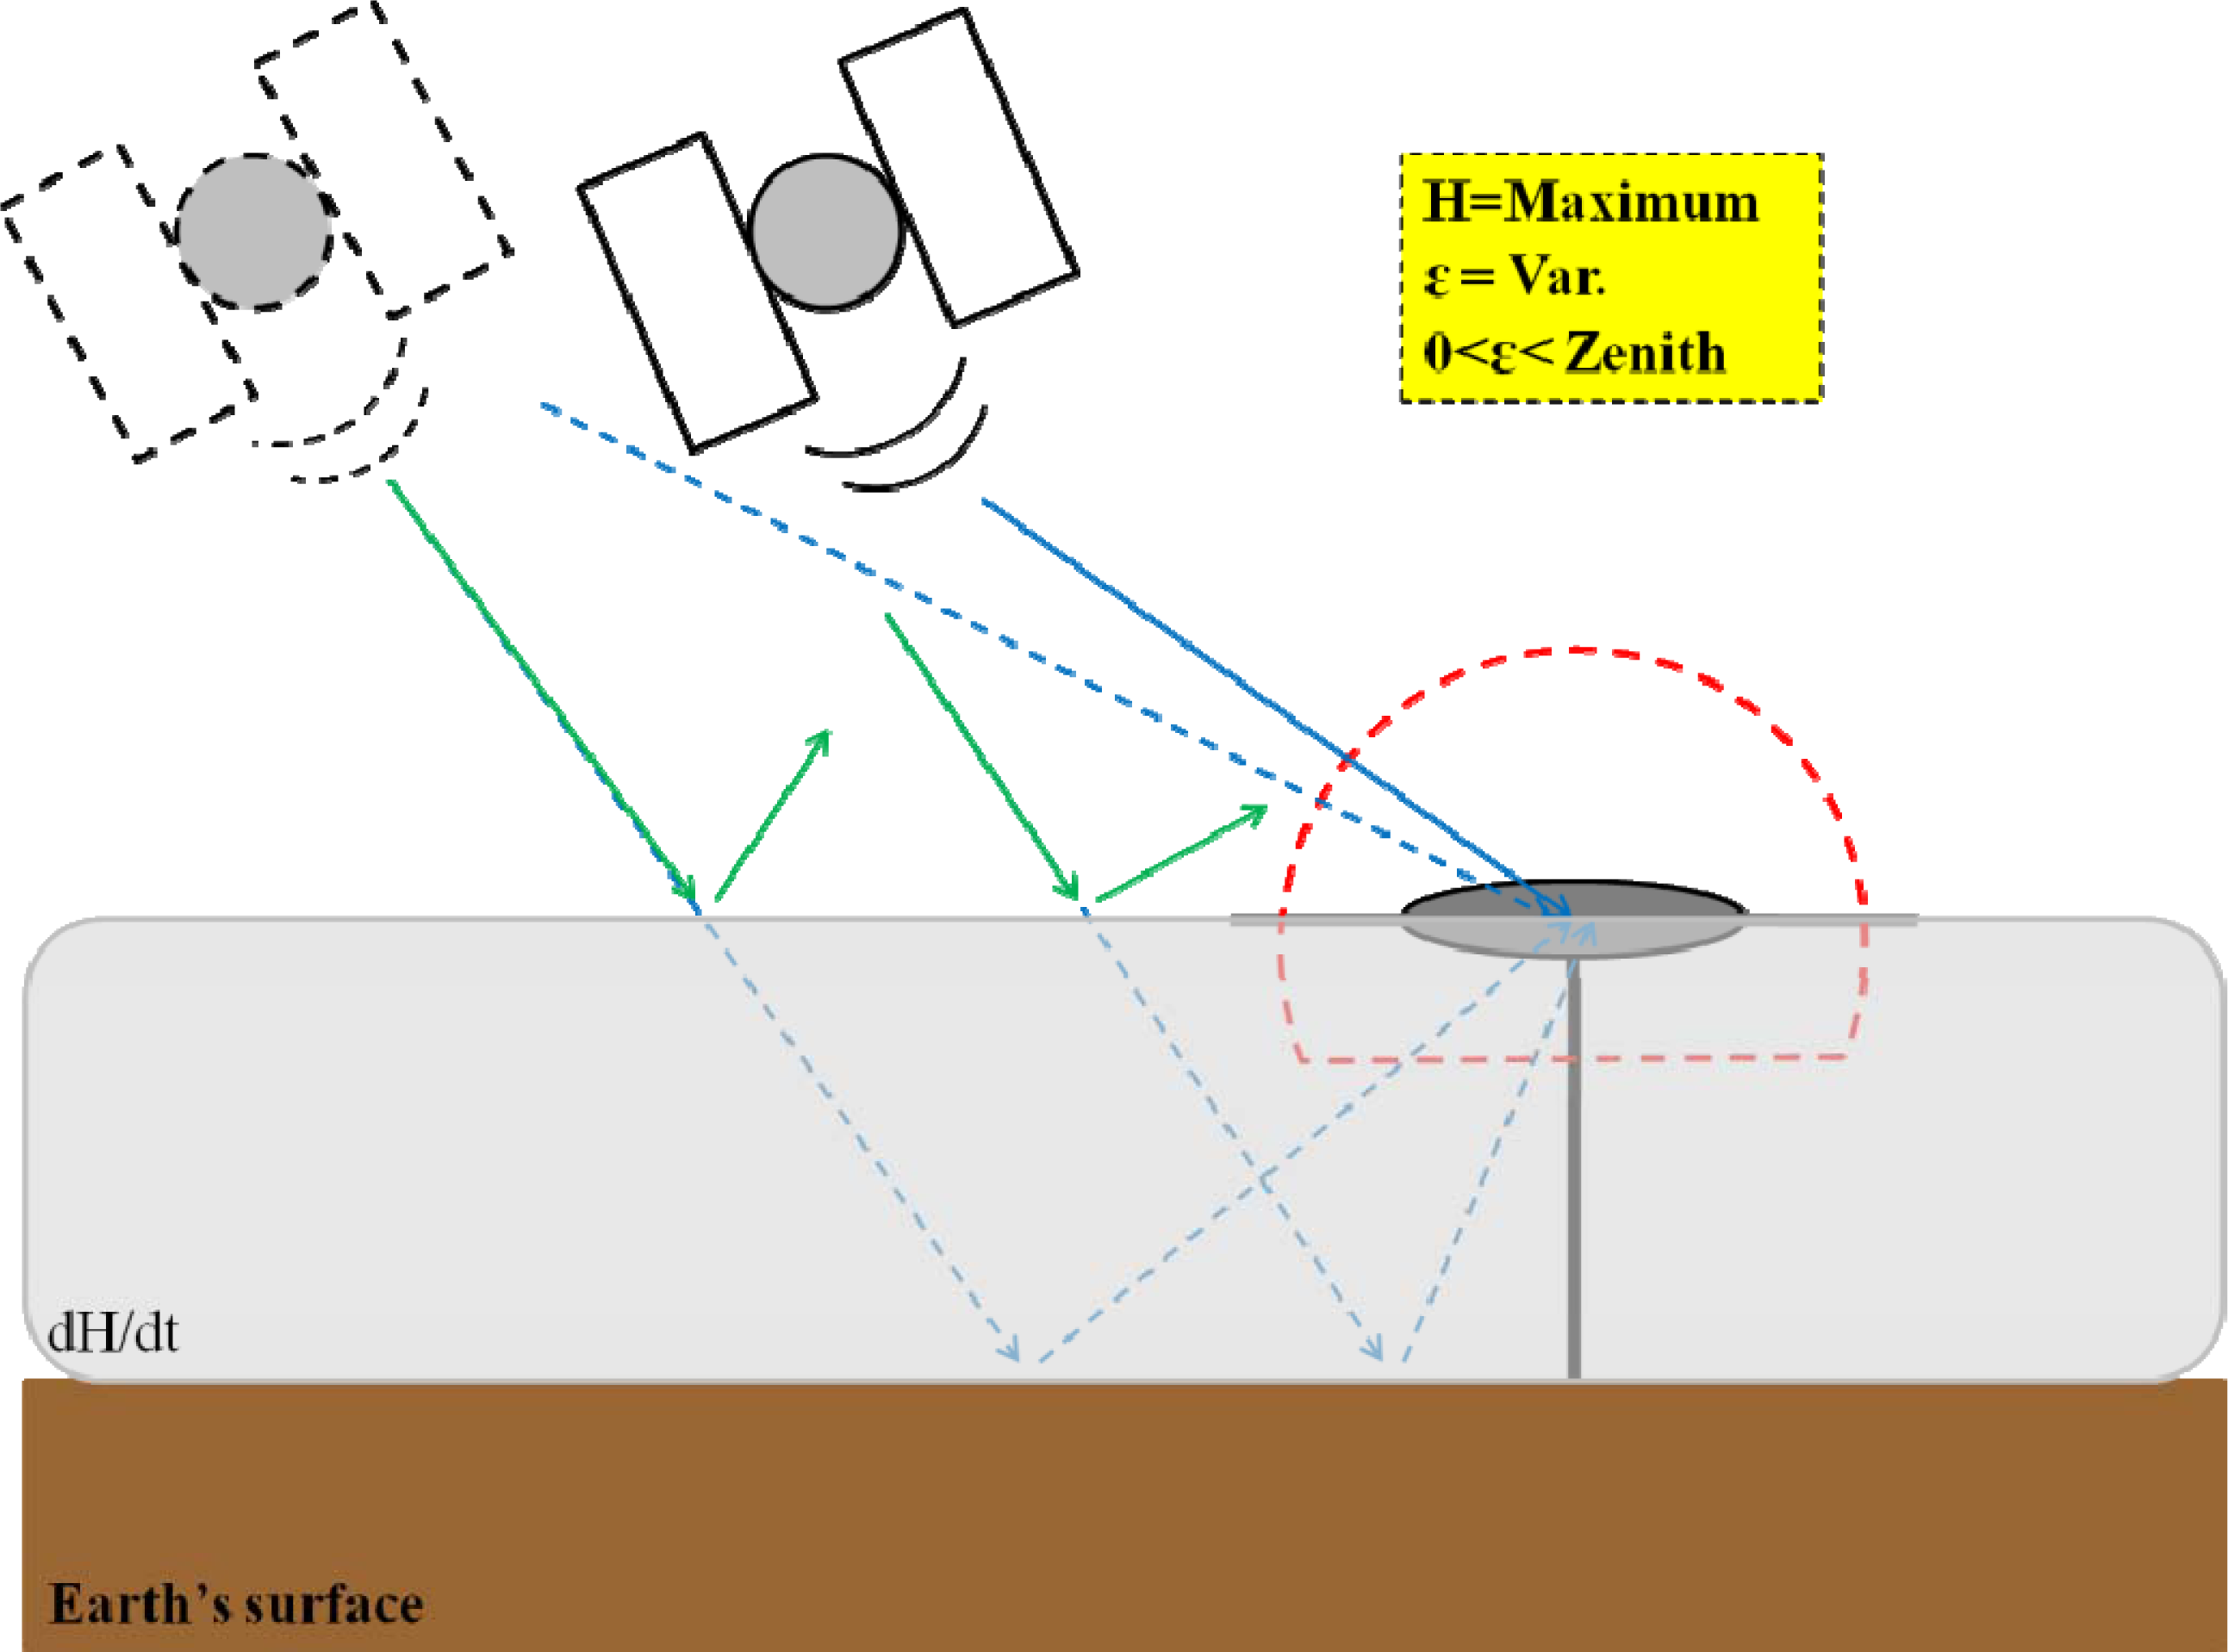
According to
Equation (11), the multipath signature variability with respect to
H variations is directly a function of
ε. Therefore, if we assume the following schematics for the GPS satellite and ground receiver, as shown in
Figures 12 and
13.
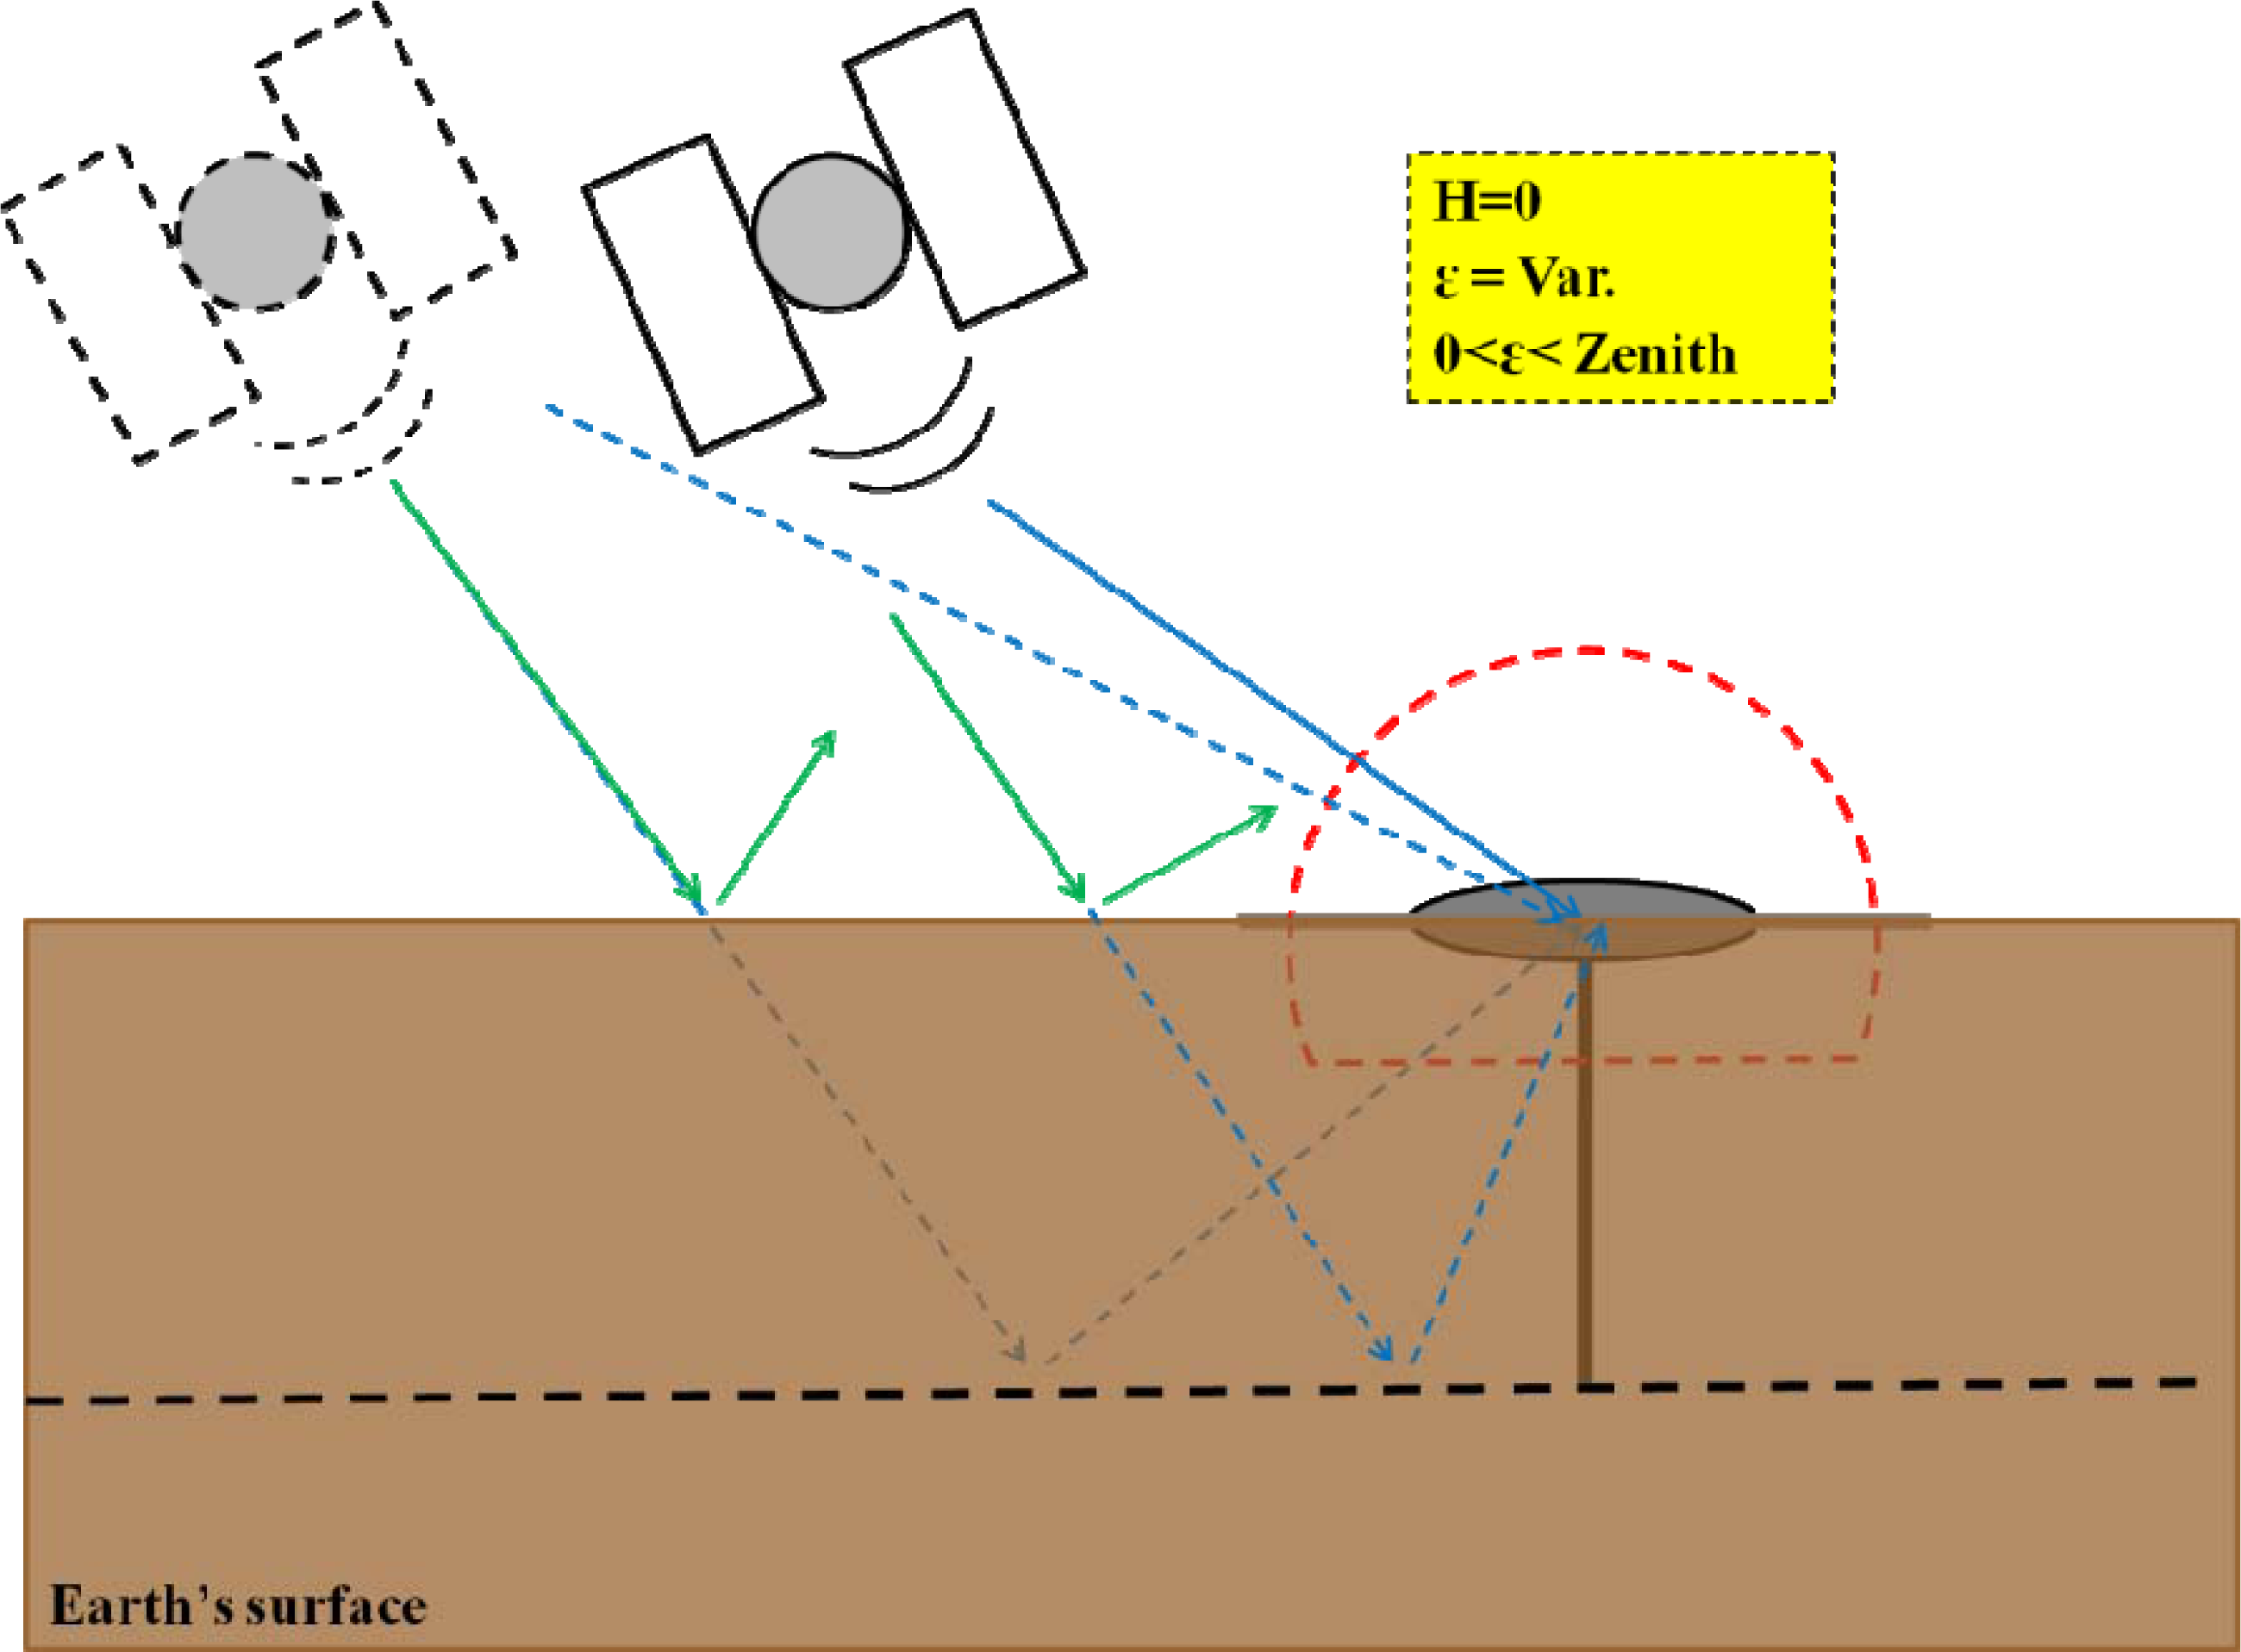
It is clear that the reflected signals from maximum snow surface (or ice surface) in
Figure 12 or Earth’s surface, represented in
Figure 13, are similar in terms of reflected signal angle from snow (ice) and Earth’s ground surface, respectively. However, there are differences in signal strength and amplitude as they have been reflected from different surfaces with unequal reflectance polarization coefficients, but as mentioned in the physical reflectivity’s introduction, we concentrate only on the physical status of scattered and reflected signals interacting with the selected surfaces and ground receiver rather than signal strength and amplitude values. Therefore, the multipath signature variability subject to
H variations for both
Figure 12 (
H = Maximum) and
Figure 13 (
H = 0) are similar. These different values for
ε with
H = 0, are presented in
Figure 14.
As it can be understood from
Figures 12 and
14, increases in the satellite elevation angle up to its zenith angle lead to maximum variability in multipath signatures as the reflected signals are going to interact with the ground GPS receiver antenna. Moreover, the low satellite elevation angle gives more reflected signals from the surface rather than what can be received by the ground GPS receiver itself.
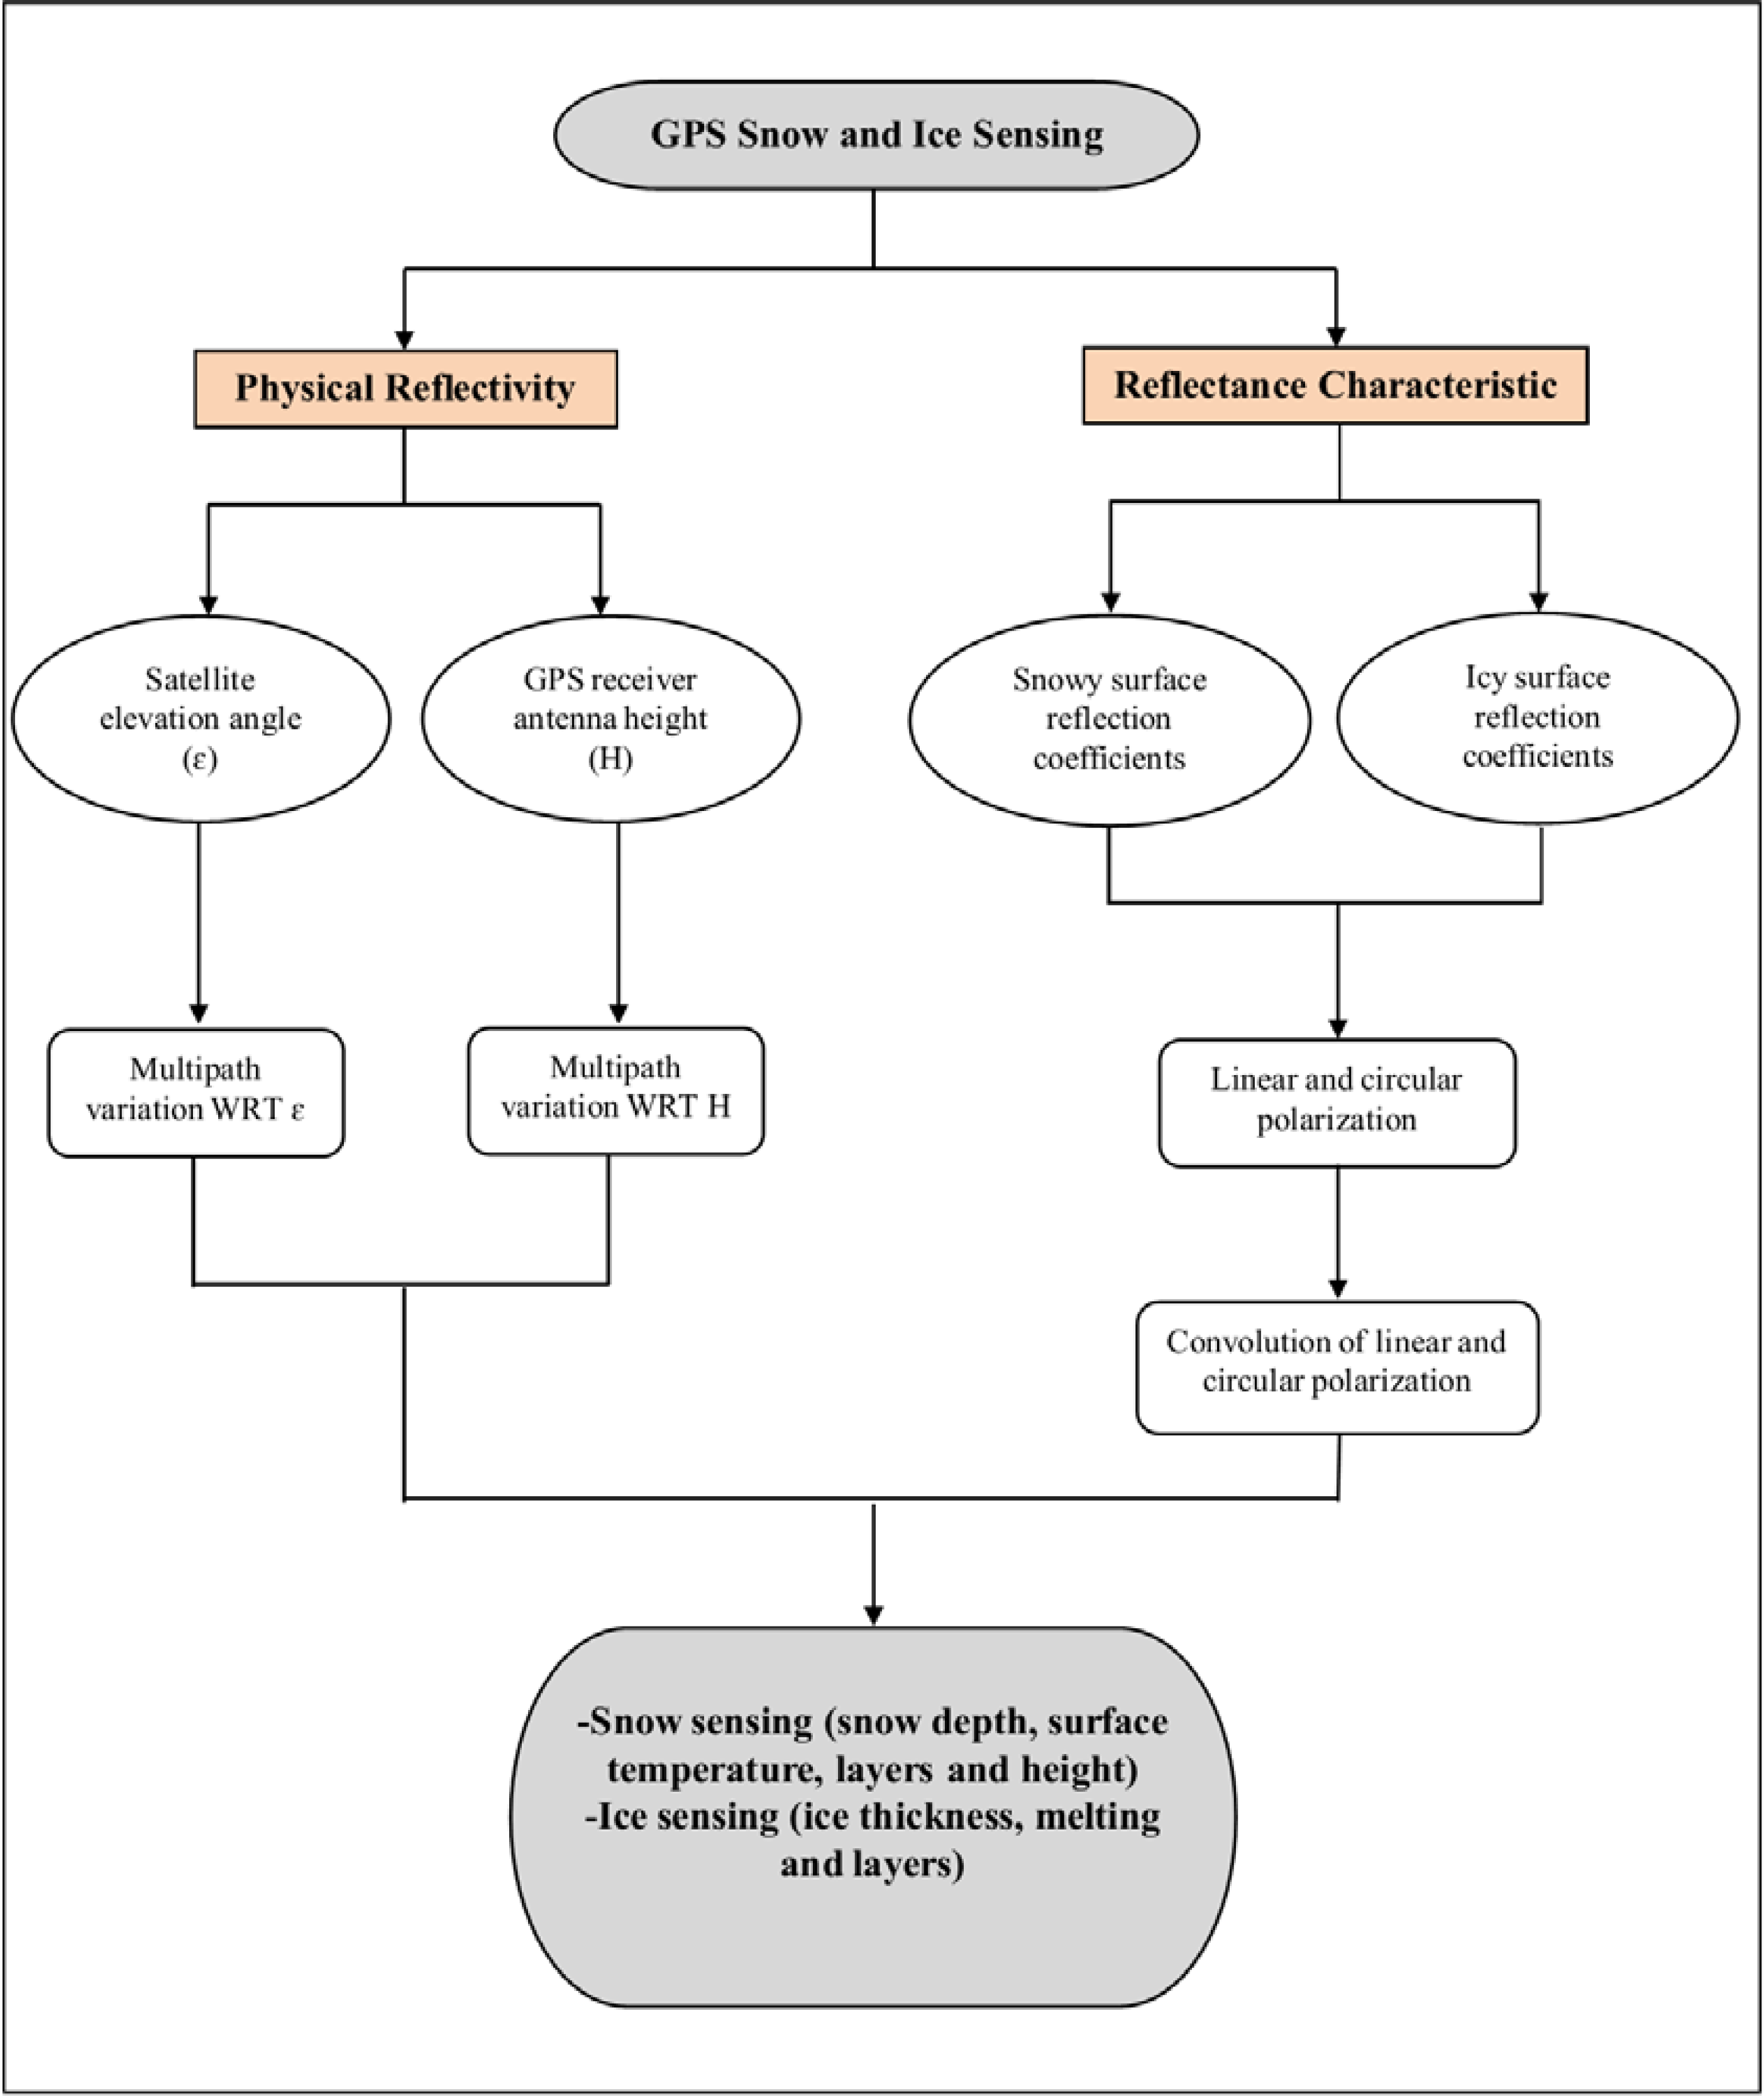
3.2. GPS Reflected Signals Surface and Reflectance Characteristics
The reflected signals from a surface are associated principally by two factors: the physical formation of interacting signals and the surface characteristic. The former is defined here as physical reflectivity of multipath signatures and the latter is described as reflectance characteristics. The physical reflectivity was expatiated completely in Section 3.1. In this part, the specular reflection and the total reflectivity as well as linear and circular polarization and their corresponding convolution functions are discussed in detail.
Theoretically, almost all objects can emit specular reflections, although the amount of the reflections varies and depends on the object’s optical properties, such as the surface roughness, the Fresnel reflection coefficients, and so on [
26].
Figure 15 presents a diagram of characteristic reflectance in interacting with incidence signal (scattered signal) from a certain surface. The result of such interaction is refracted and reflected signals with different surface polarization reflectances.
As pointed out in the theory and methodology section, the environment geometry of signals (incident and reflected signal angles) and the surface electrical properties (conductivity and relative permittivity) are playing consequential roles in the surface reflectance features where the reflection coefficients for a surface provide applicable information on the nature of reflected signals [
27].
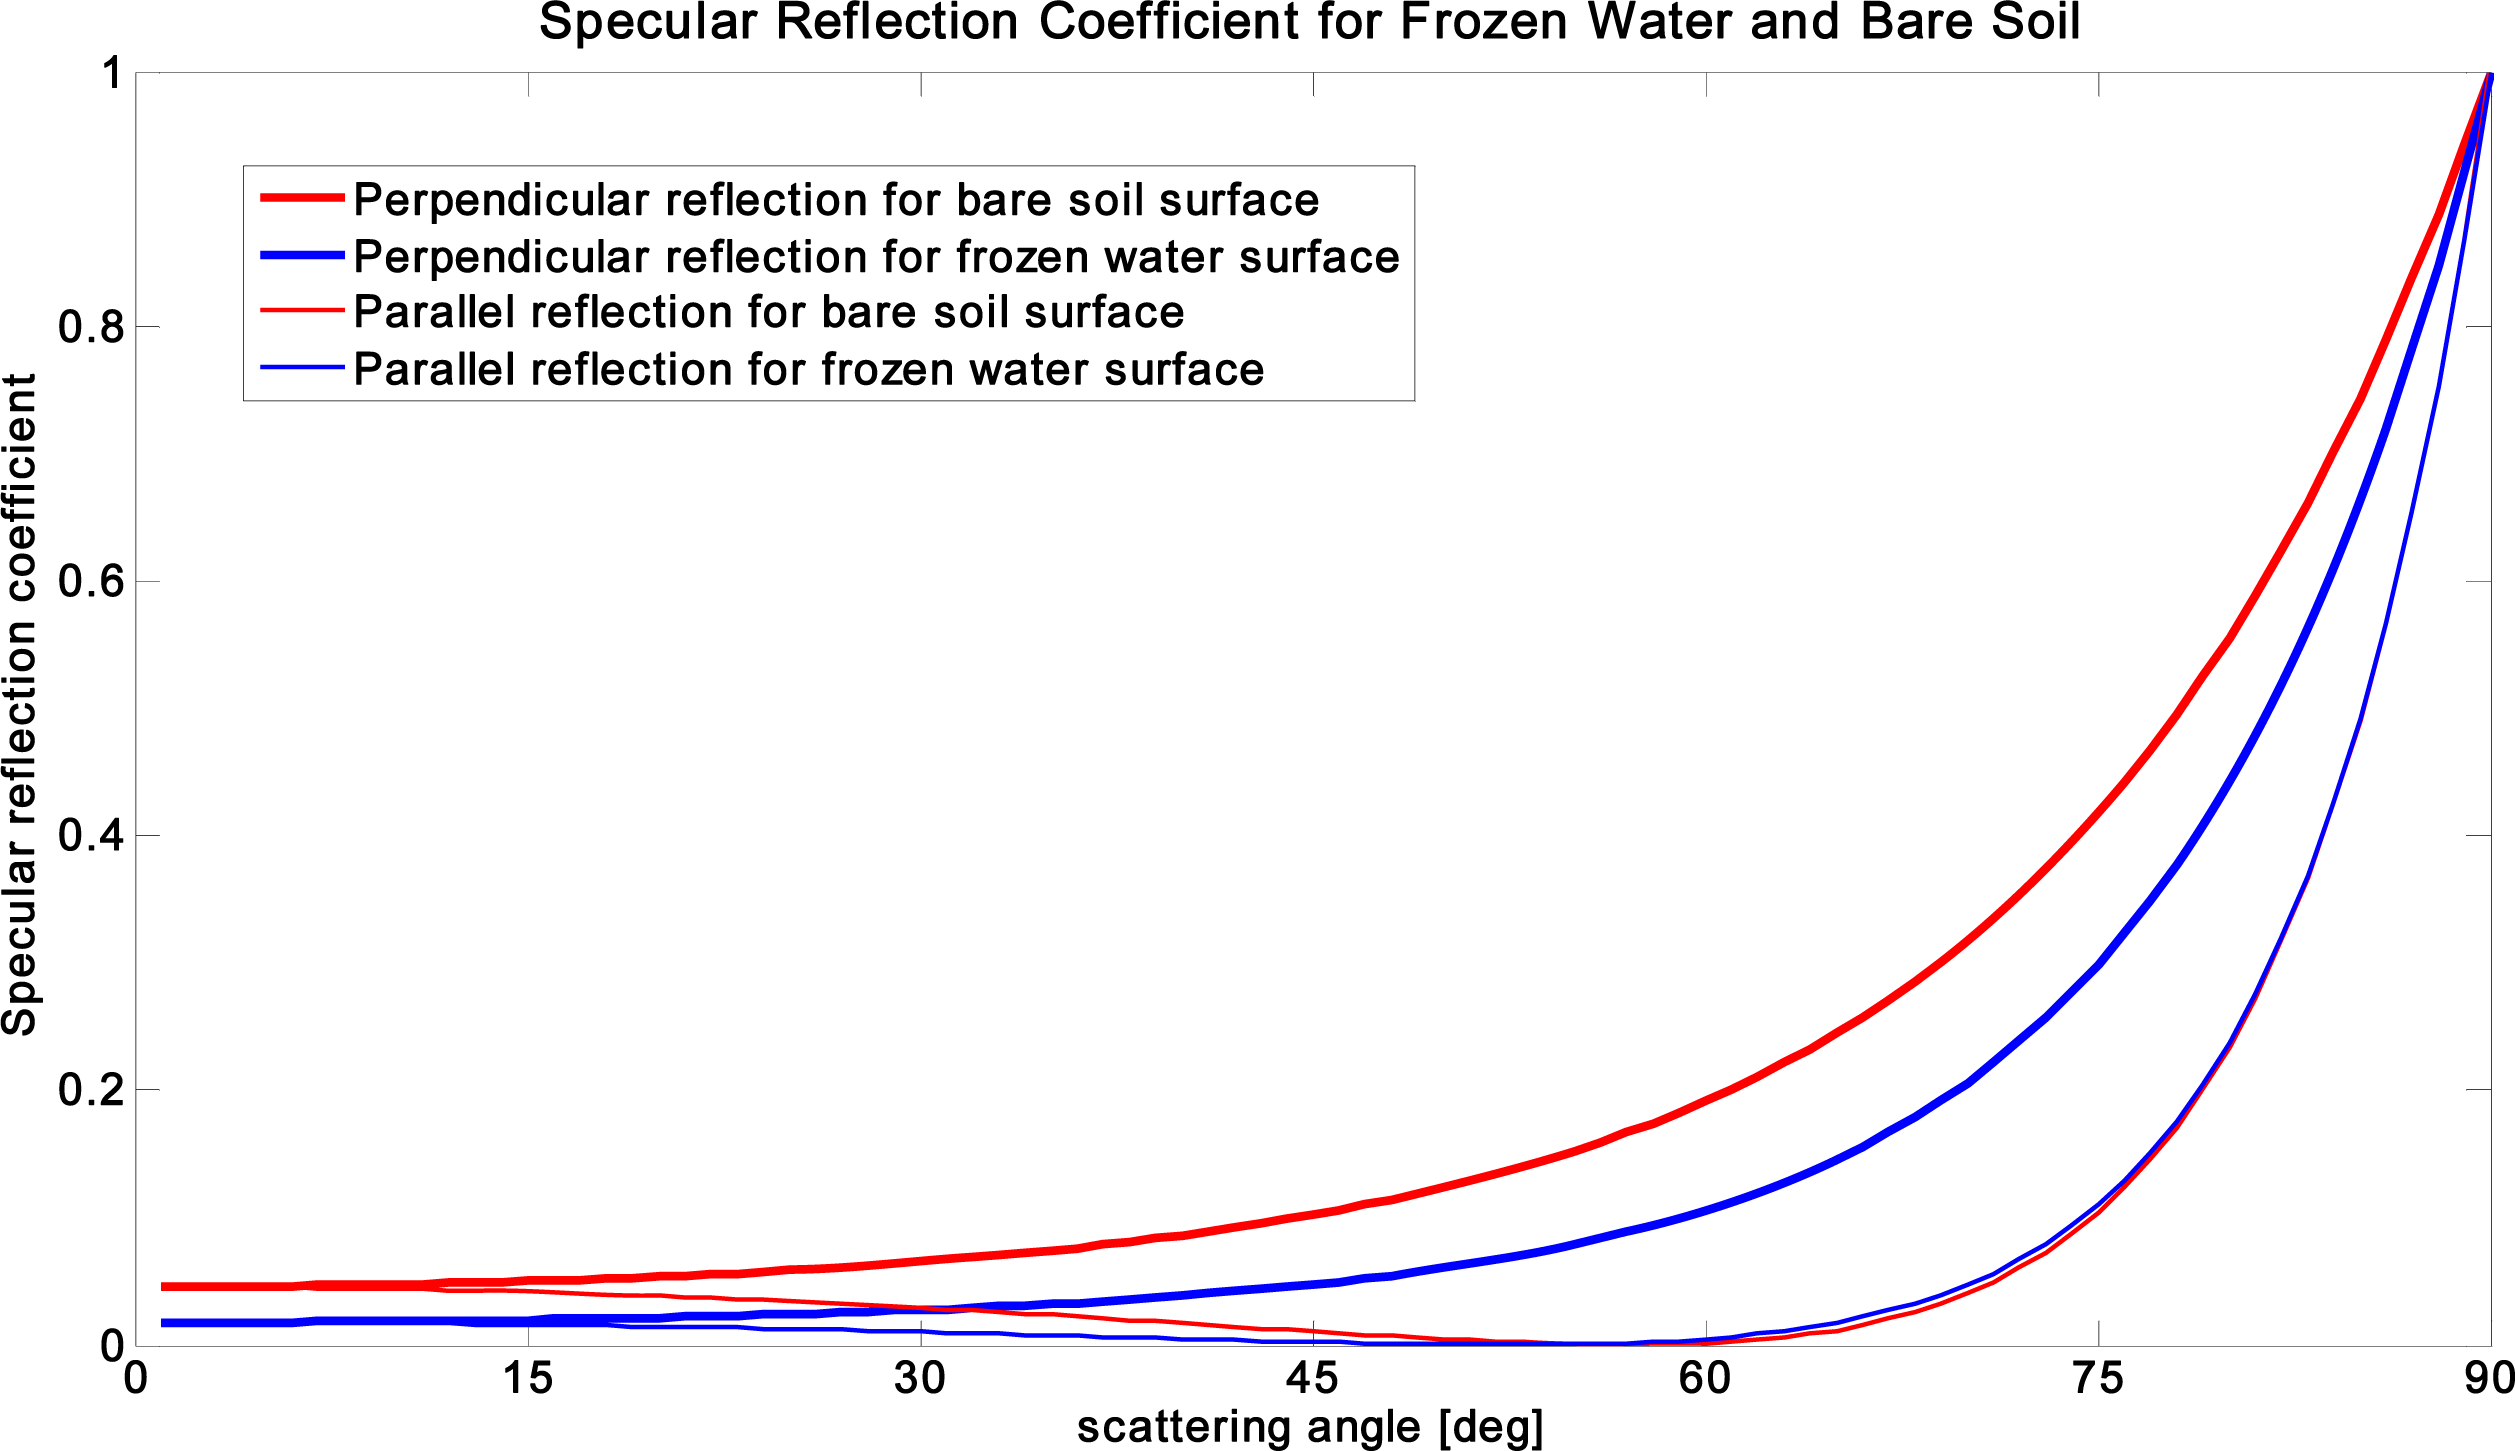
To consider the most significant phases of natural substances covered on the Earth’s surface, frozen water (e.g., snow or ice) and soil (mixed with rock) are the most crucial surfaces with a refractivity index of 1.309 and 1.540, respectively [
19], which have been analyzed through specular reflection coefficients
versus scattering perpendicular and parallel angles (see
Table 1).
Figure 16 represents specular reflection coefficients for each selected surface and the parallel reflection coefficients with deceleration to reach a unique value, rather than perpendicular ones.
The specular reflection coefficients for each surface are increasing continuously and monotonically in
Figure 16. Since the soil surface has maximum perpendicular reflection coefficients, the parallel specular reflection coefficients are almost in the same trend-value for both these two surfaces. Although each surface may change its reflection coefficients to signal scattering depending on the geometry or other significant environmental factors that eventually would affect these values, initially we assumed idealistic situations that are not changing for the scattered and reflected signals during these results.
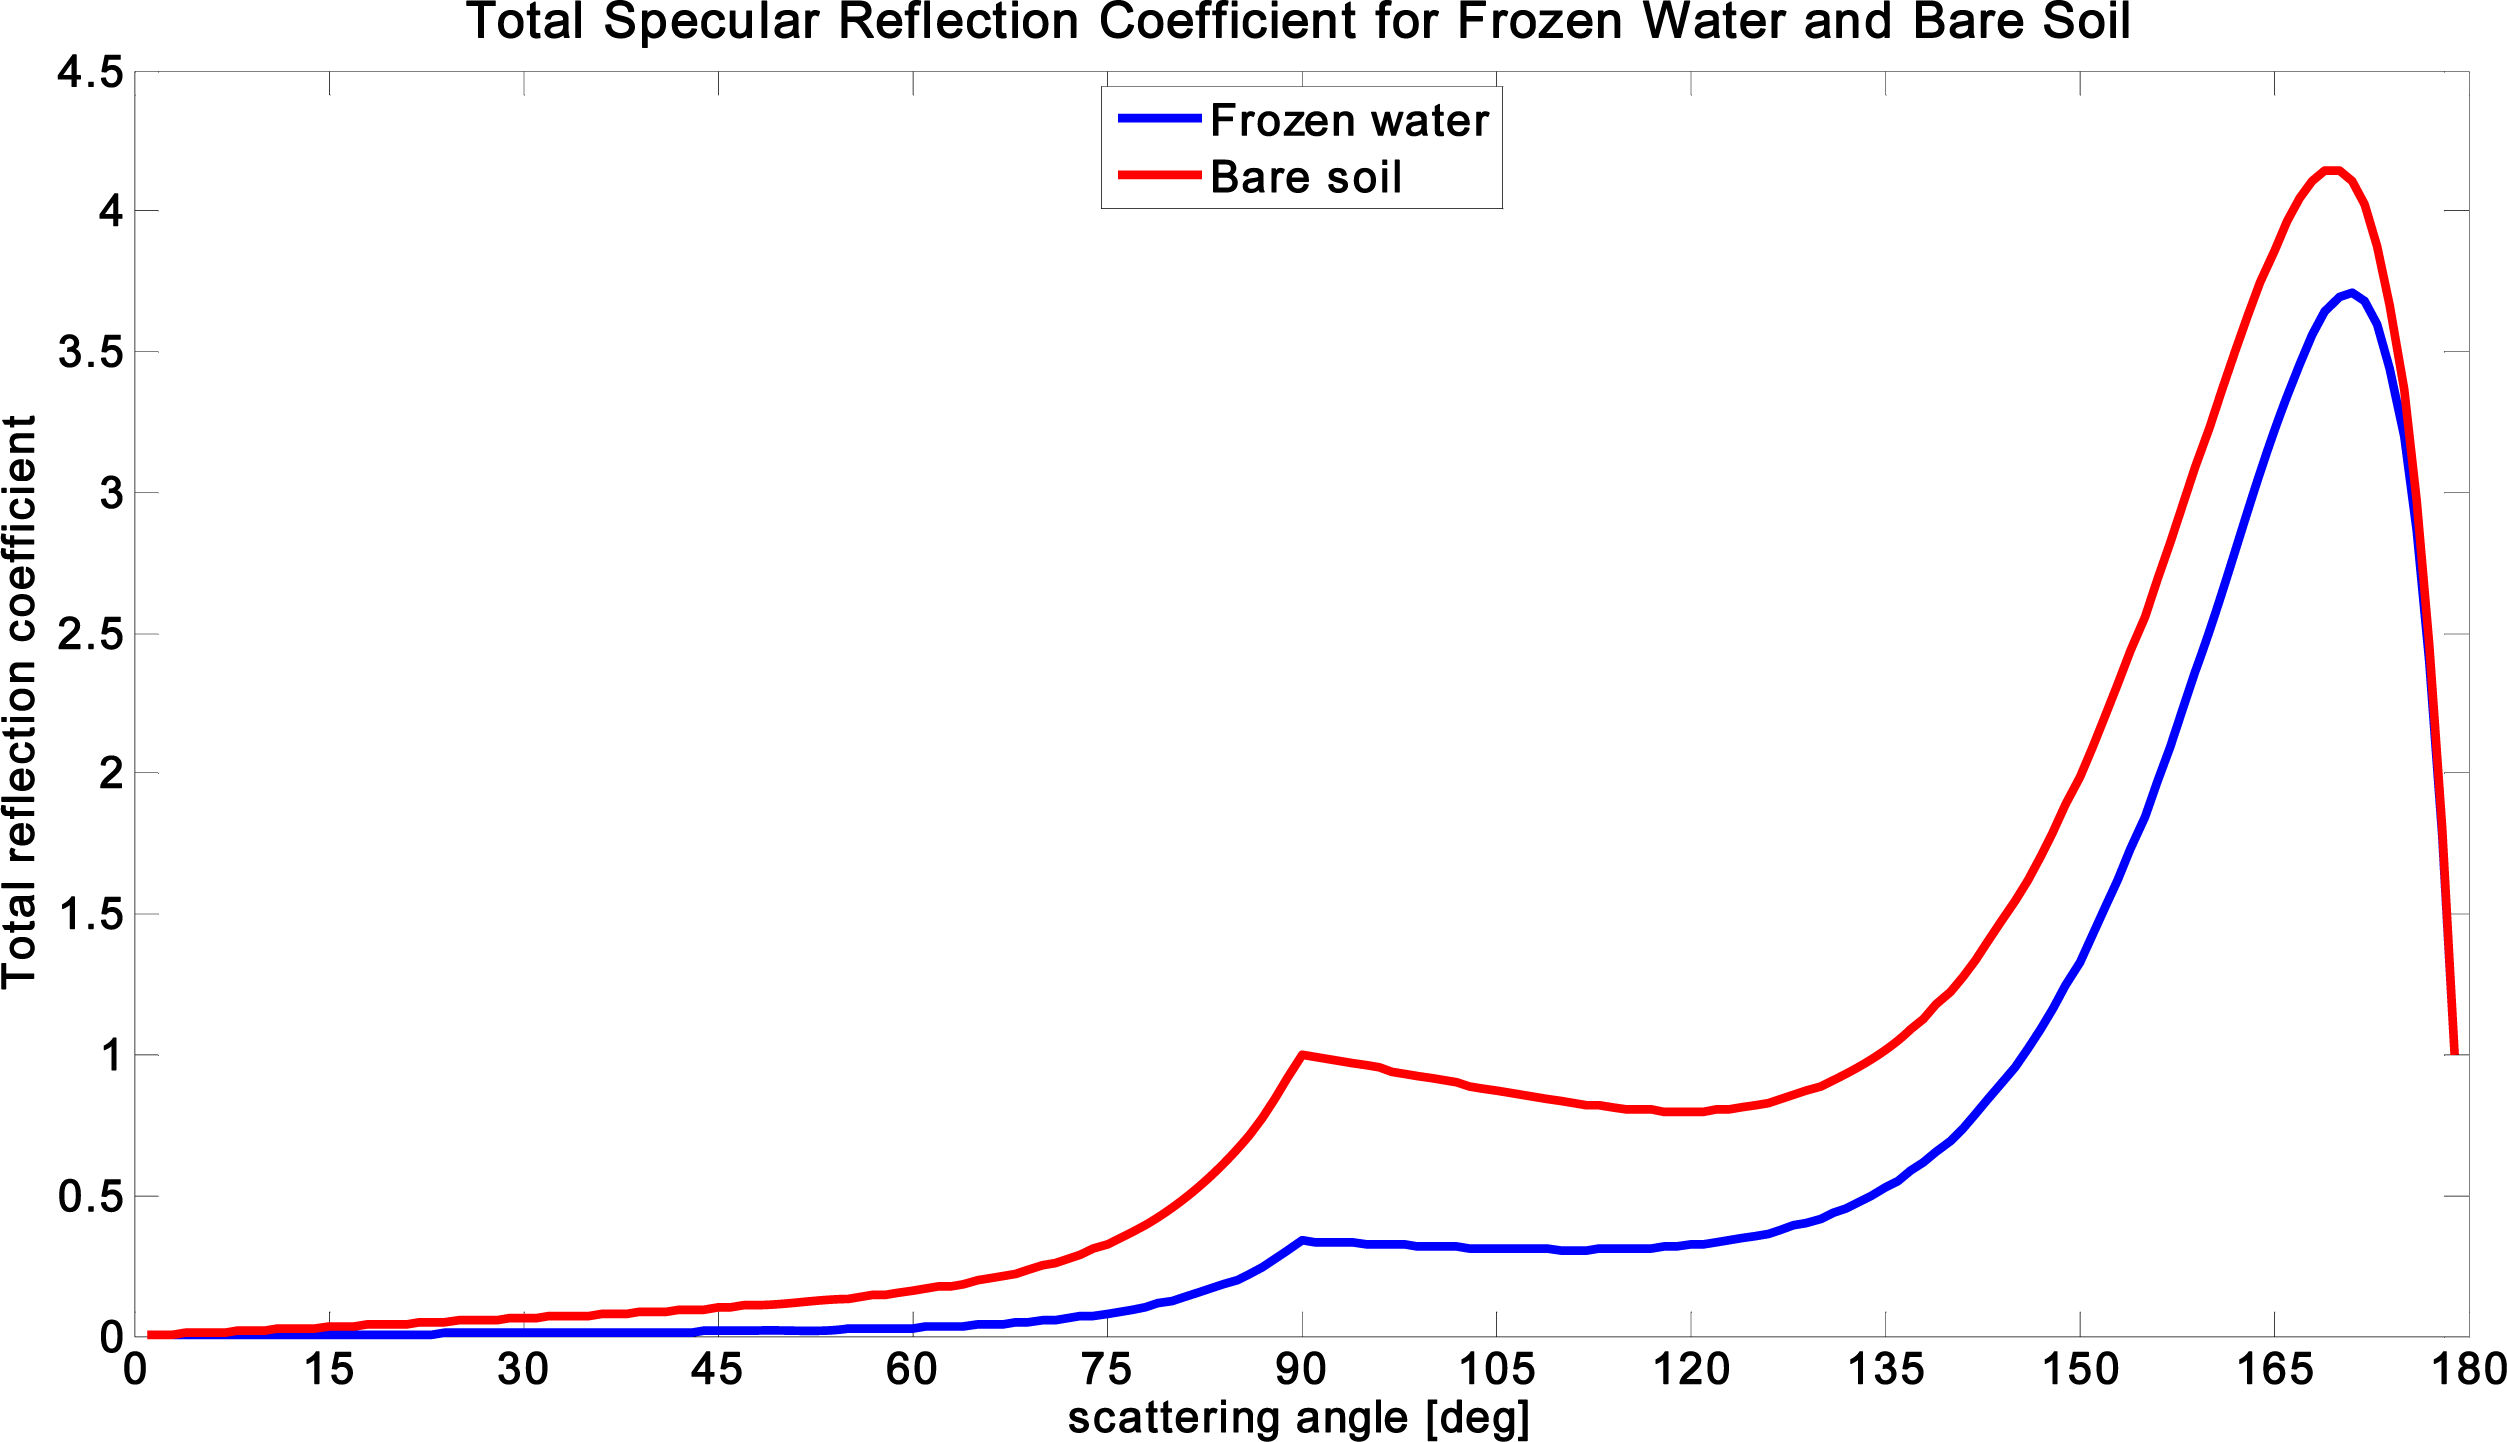
In order to understand the entire frozen water and soil surface interaction for scattered signals, the total reflection of both perpendicular and parallel specular reflection is proposed. The total surface reflectivity is computing the half plane scattered angles (
Figure 17), which shows a sudden phase change of 90° for the selected surfaces. This sudden phase change happens when the total specular reflection coefficients increase up to 4; while the scattering angle approaches 180°. The bare soil is reflecting the incident signals more than frozen water for the entire scattering angles. In other words, frozen water absorbs more scattered signals than bare soil.
The comparison between bare soil and frozen water in terms of specular reflection and total reflection coefficients (
Figures 16 and
17) shows that the frozen water’s reflection is approximately equal to half the bare soil’s reflection in interacting with incident signals for all scattered angles.
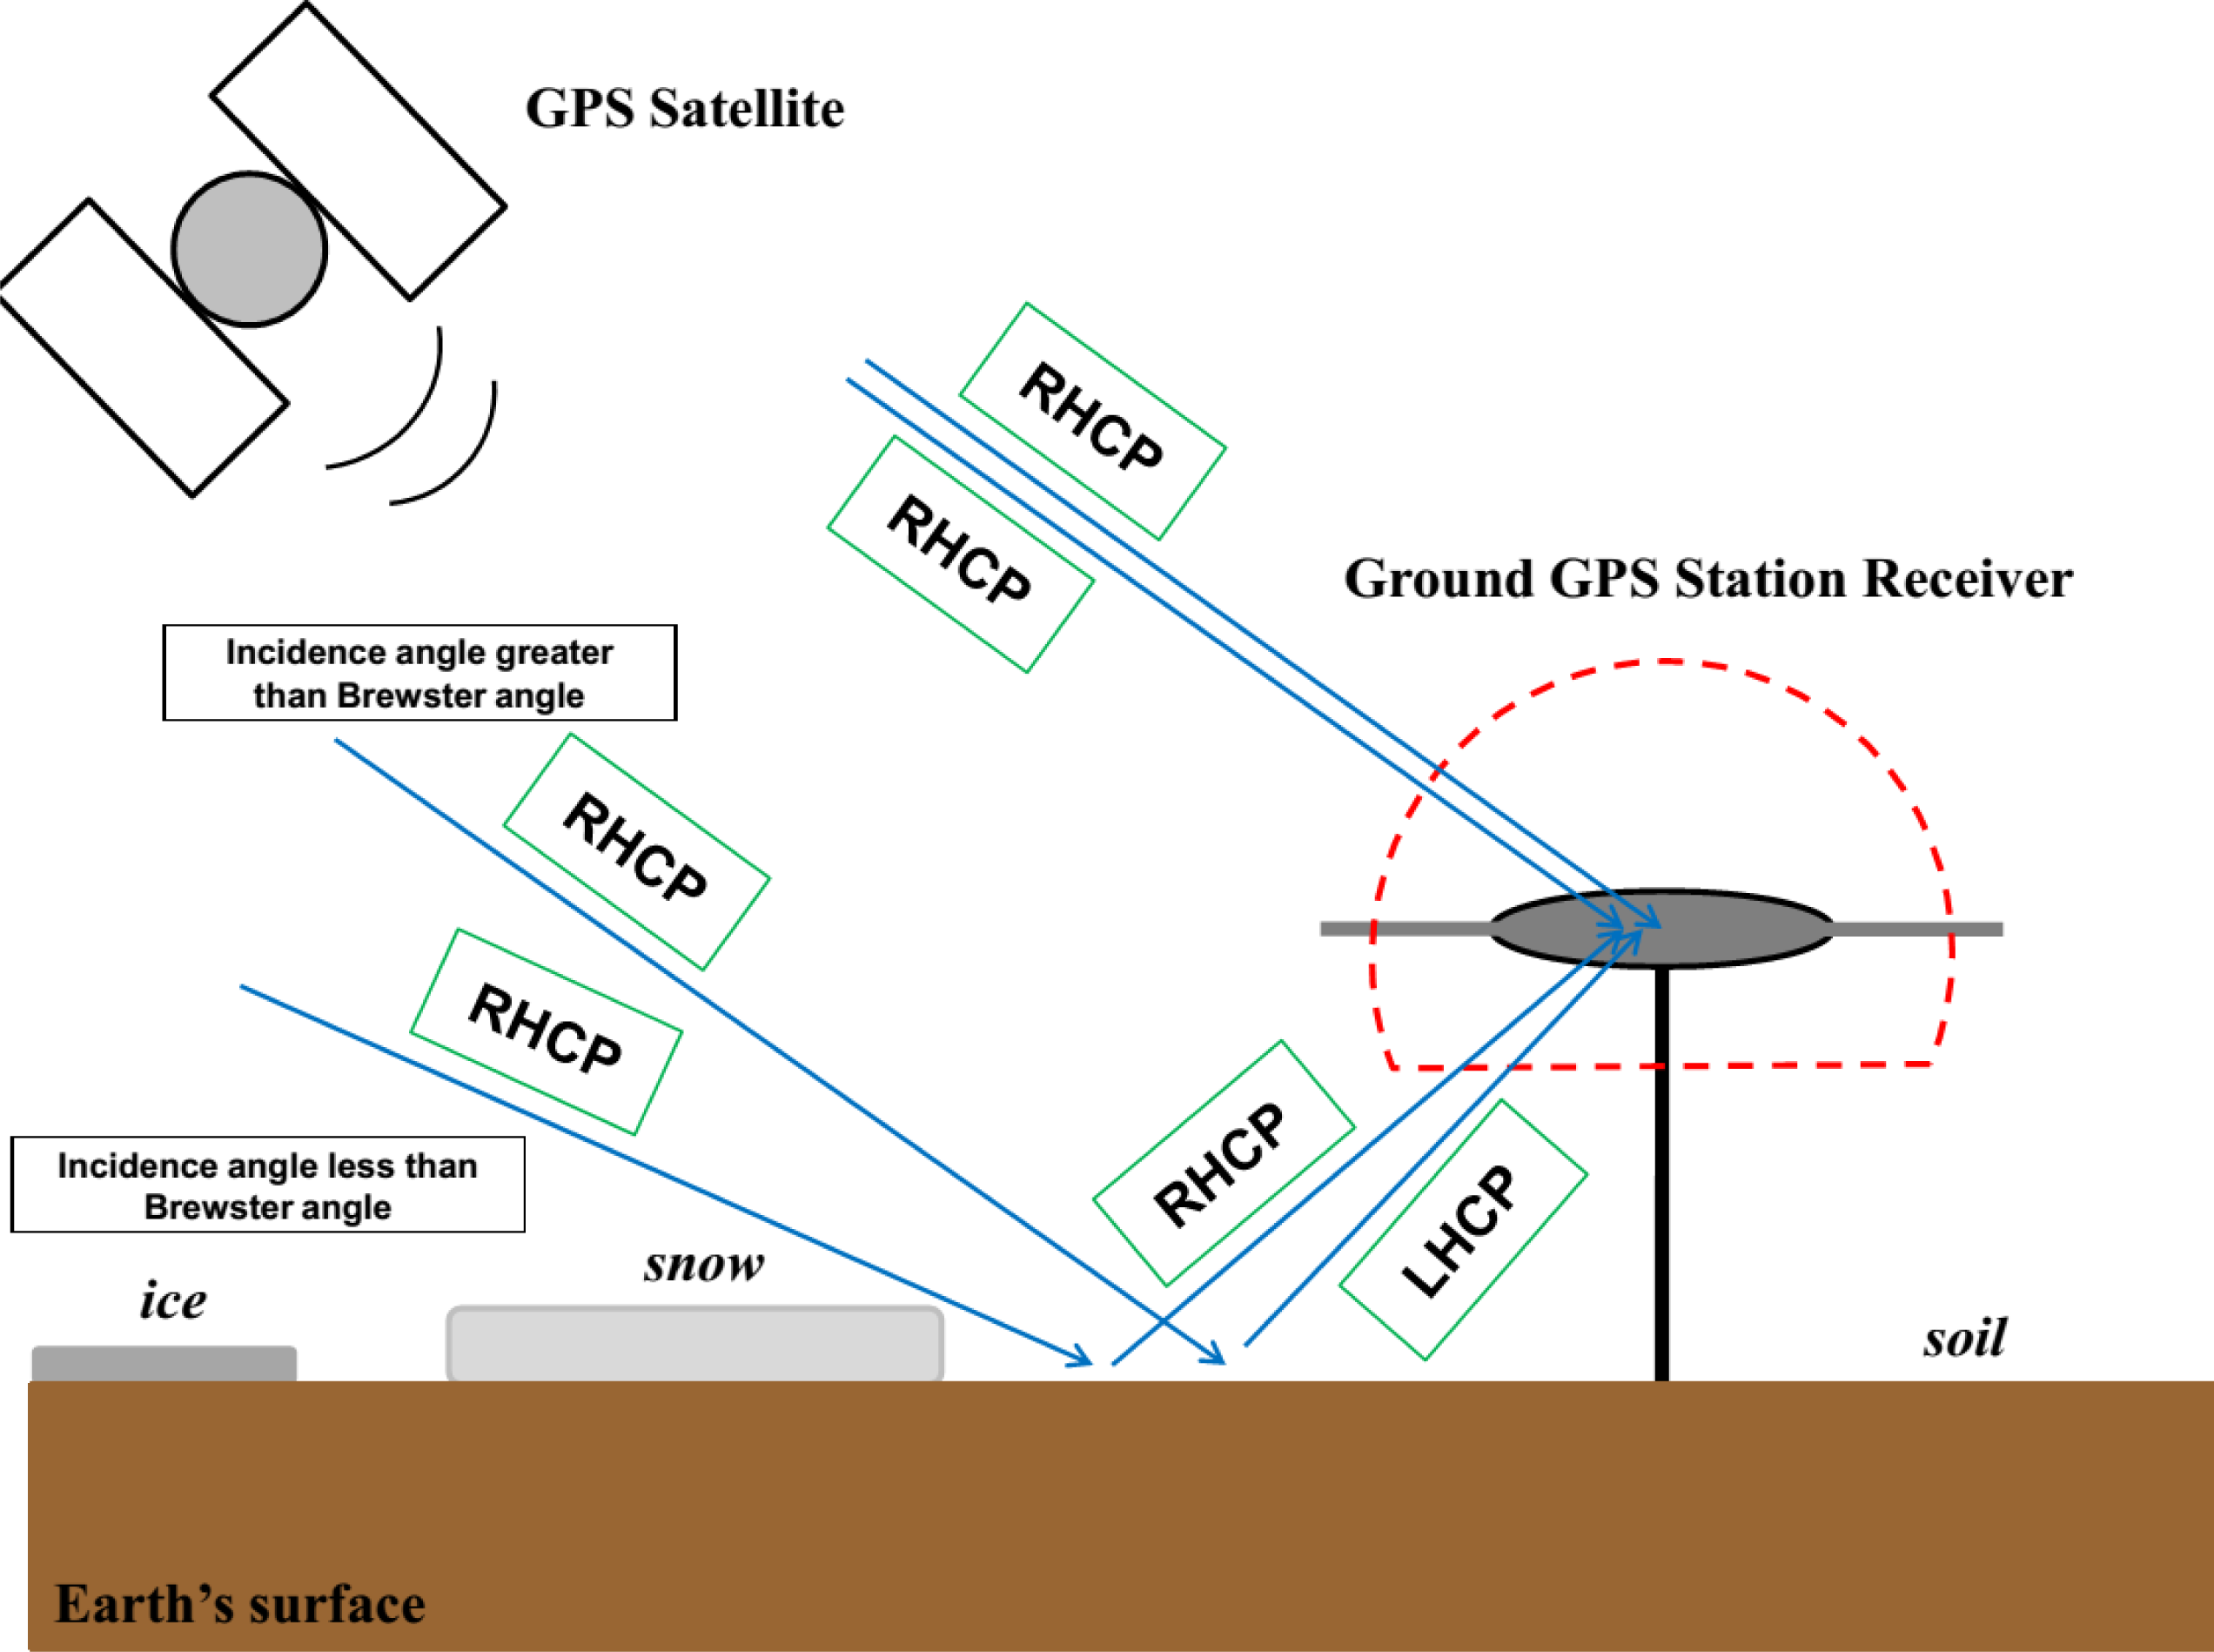
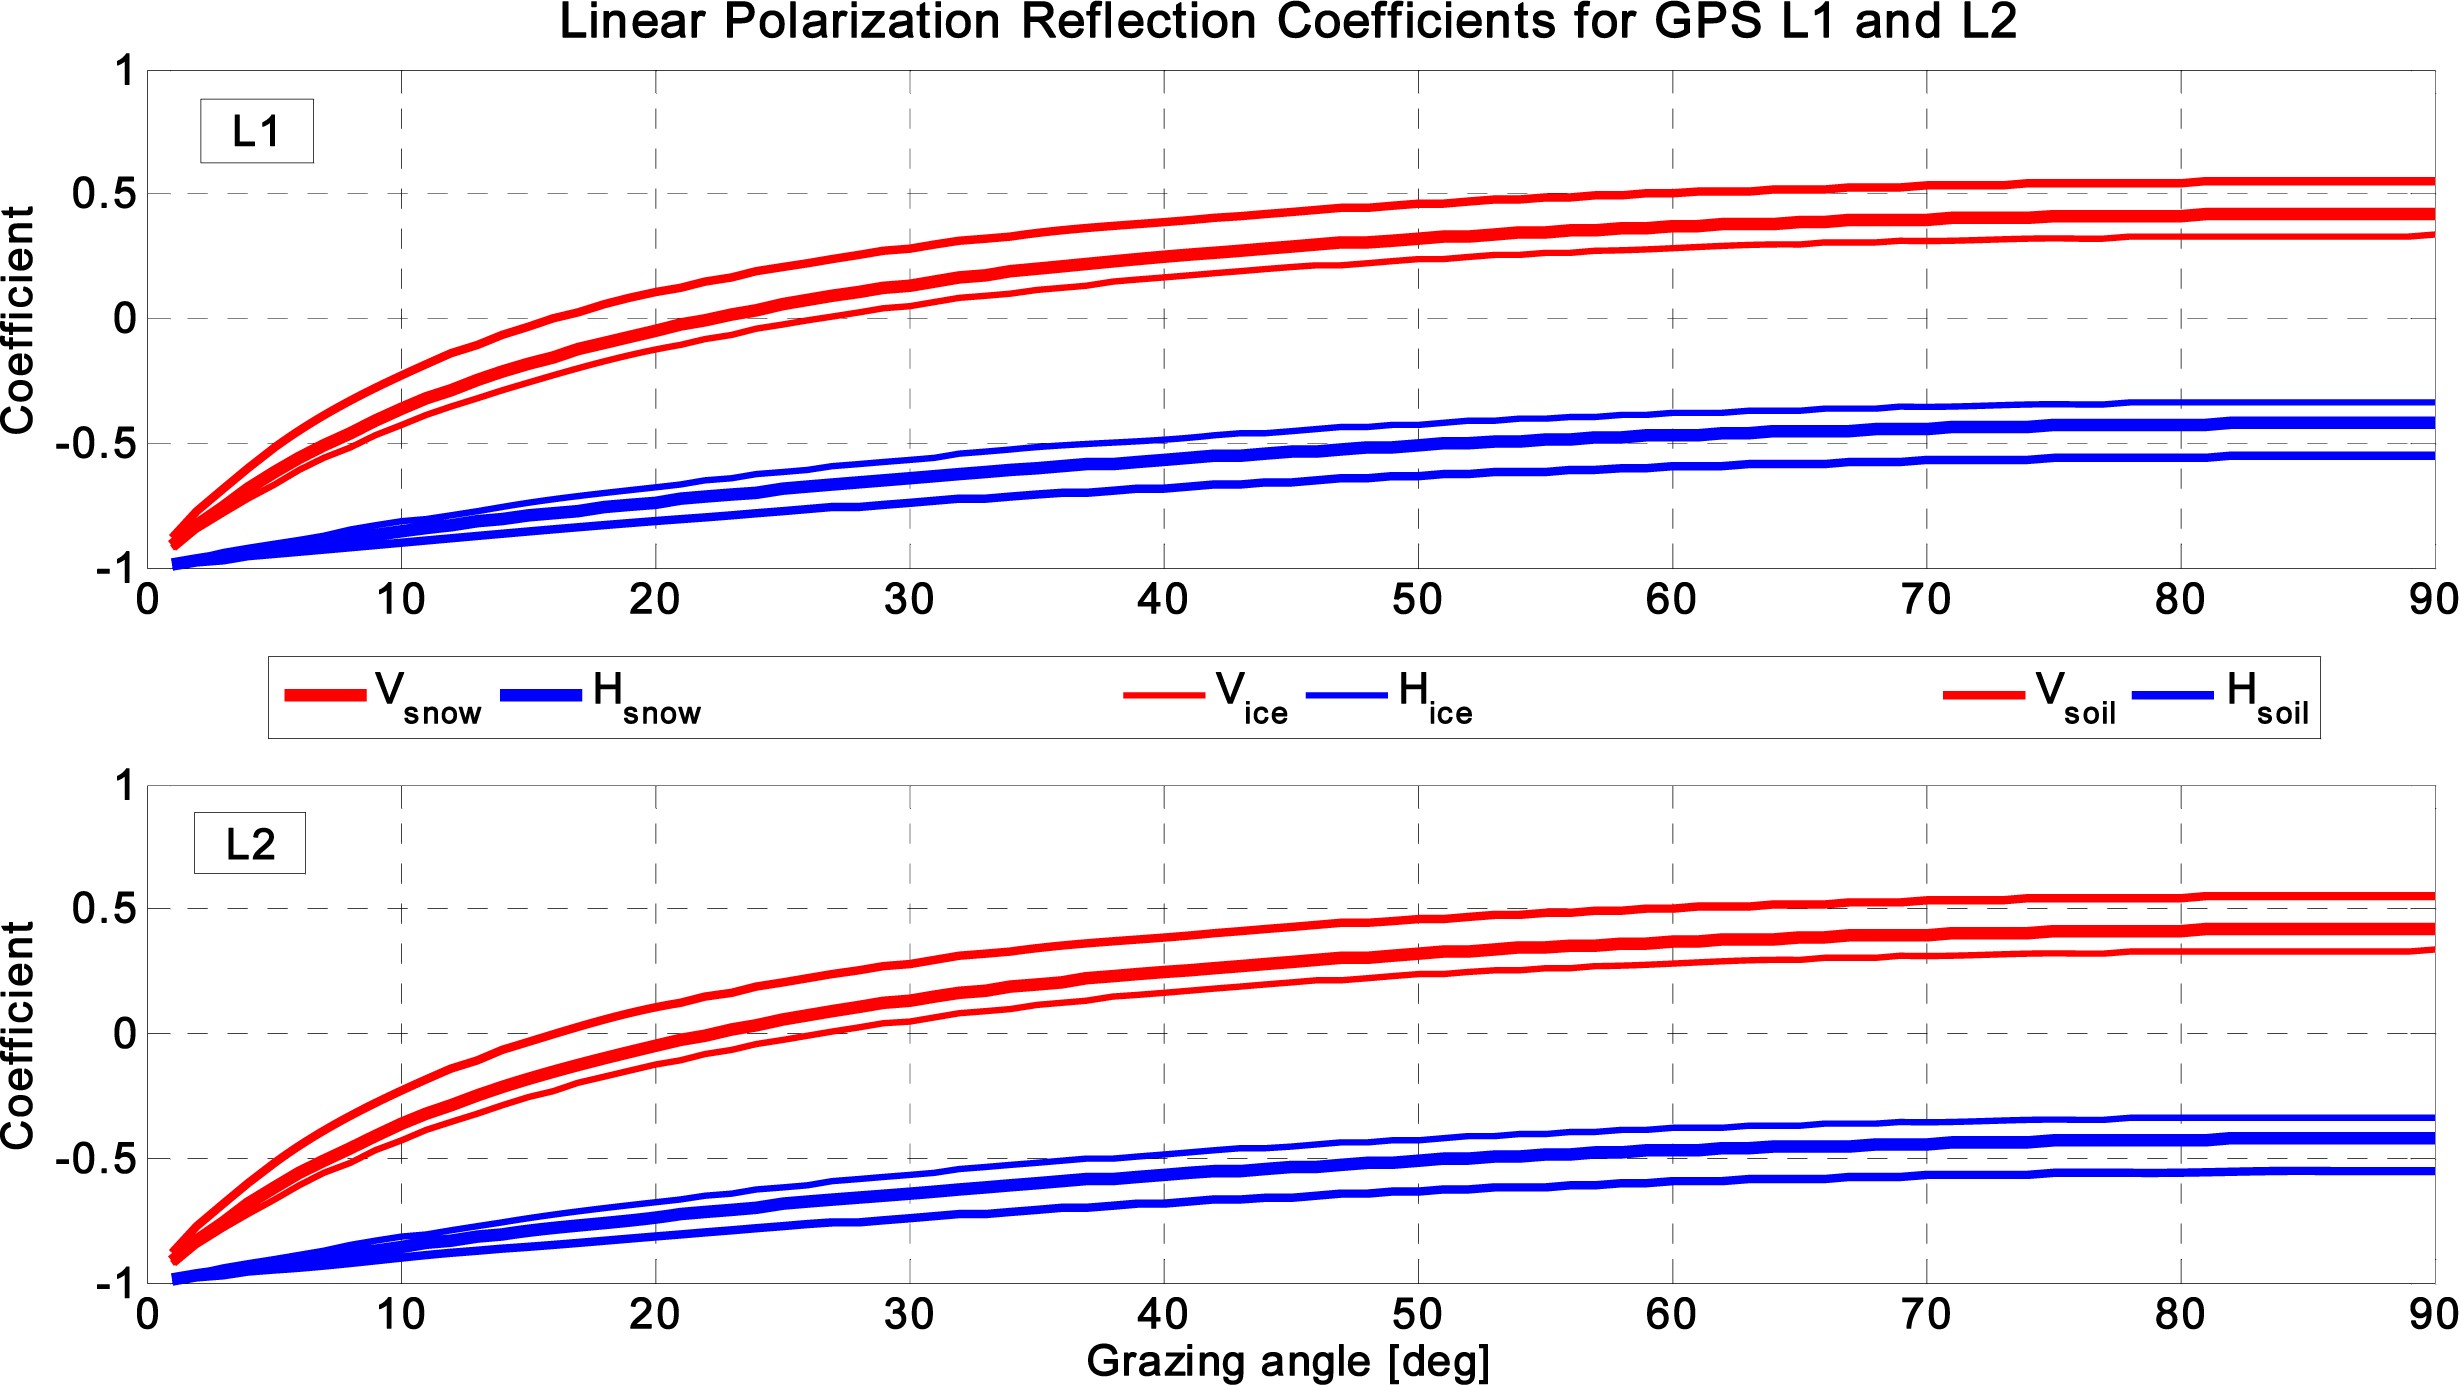
Originally, the GPS scattered signals are Right Handled Circulated Polarization (RHCP). The circular polarization occurred in the reflected surface is the vector sum of the linearly polarized waves (both in vertical and horizontal). Therefore, it is appropriate to consider the reflection coefficients for linear cases initially. In order to compute linear polarization reflection coefficients, the conductivity and relative permittivity values for selected surfaces including soil, snow and ice (as given in
Table 1) and the equations for reflection coefficients in horizontal and vertical polarization (
Equations (13) and
(14)) are used. The linear polarization reflection coefficients for GPS signals (L1 = 1.575 GHz,
λ1 = 19 cm and L2 = 1.227 GHz,
λ2 = 24.4 cm) are represented in
Figure 18.
From
Figure 18, it can be seen that the reflection coefficient values for each surface is varied and unique in comparison to the other surface. The vertical component (red colored plot) increases quickly compared to the horizontal one (blue colored plot) which increases gradually. Although the vertical reflection coefficient increases with approximate near zero slopes for the grazing angles that is greater than the Brewster angles, the linear polarization has a positive constant slope for the horizontal polarization.
In addition, the soil surface linear polarization coefficient for both GPS L1 and L2 signals has a maximum value in vertical polarization and the minimum value in horizontal polarization. Moreover, the ice surface linear polarization coefficient has a maximum value in horizontal polarization for both GPS signals. The snow surface has a lesser linear polarization value than soil in vertical polarization, but it has a greater value than soil in horizontal polarization when the incident signals are gradually getting linearly polarized by interacting with the surface.
Generally, for the angles less than the Brewster angles, the reflected signal, which is Right Hand Elliptically Polarized (RHEP), would become increasingly more elliptic as the Brewster angle is approaching [
7]. Though at the Brewster angle, the polarization approaches that absolute point, which is Left Hand Elliptically Polarized (LHEP), with an elliptical increase as grazing angles increase [
13].
Regarding the GPS multipath signatures and reflectance characteristics, the GPS receiver antenna only can receive RHCP signals (in fact those LHCP signals which can be received by GPS receiver antenna are at a lower level and negligible). Then, it is necessary to assess the circular polarization reflectance characteristics in the mentioned surfaces which the corresponding optical polarization approaches presented in
Equations (15) and
(16). The linear polarization is necessary to understand circular polarization as it is used in those related circular equations.
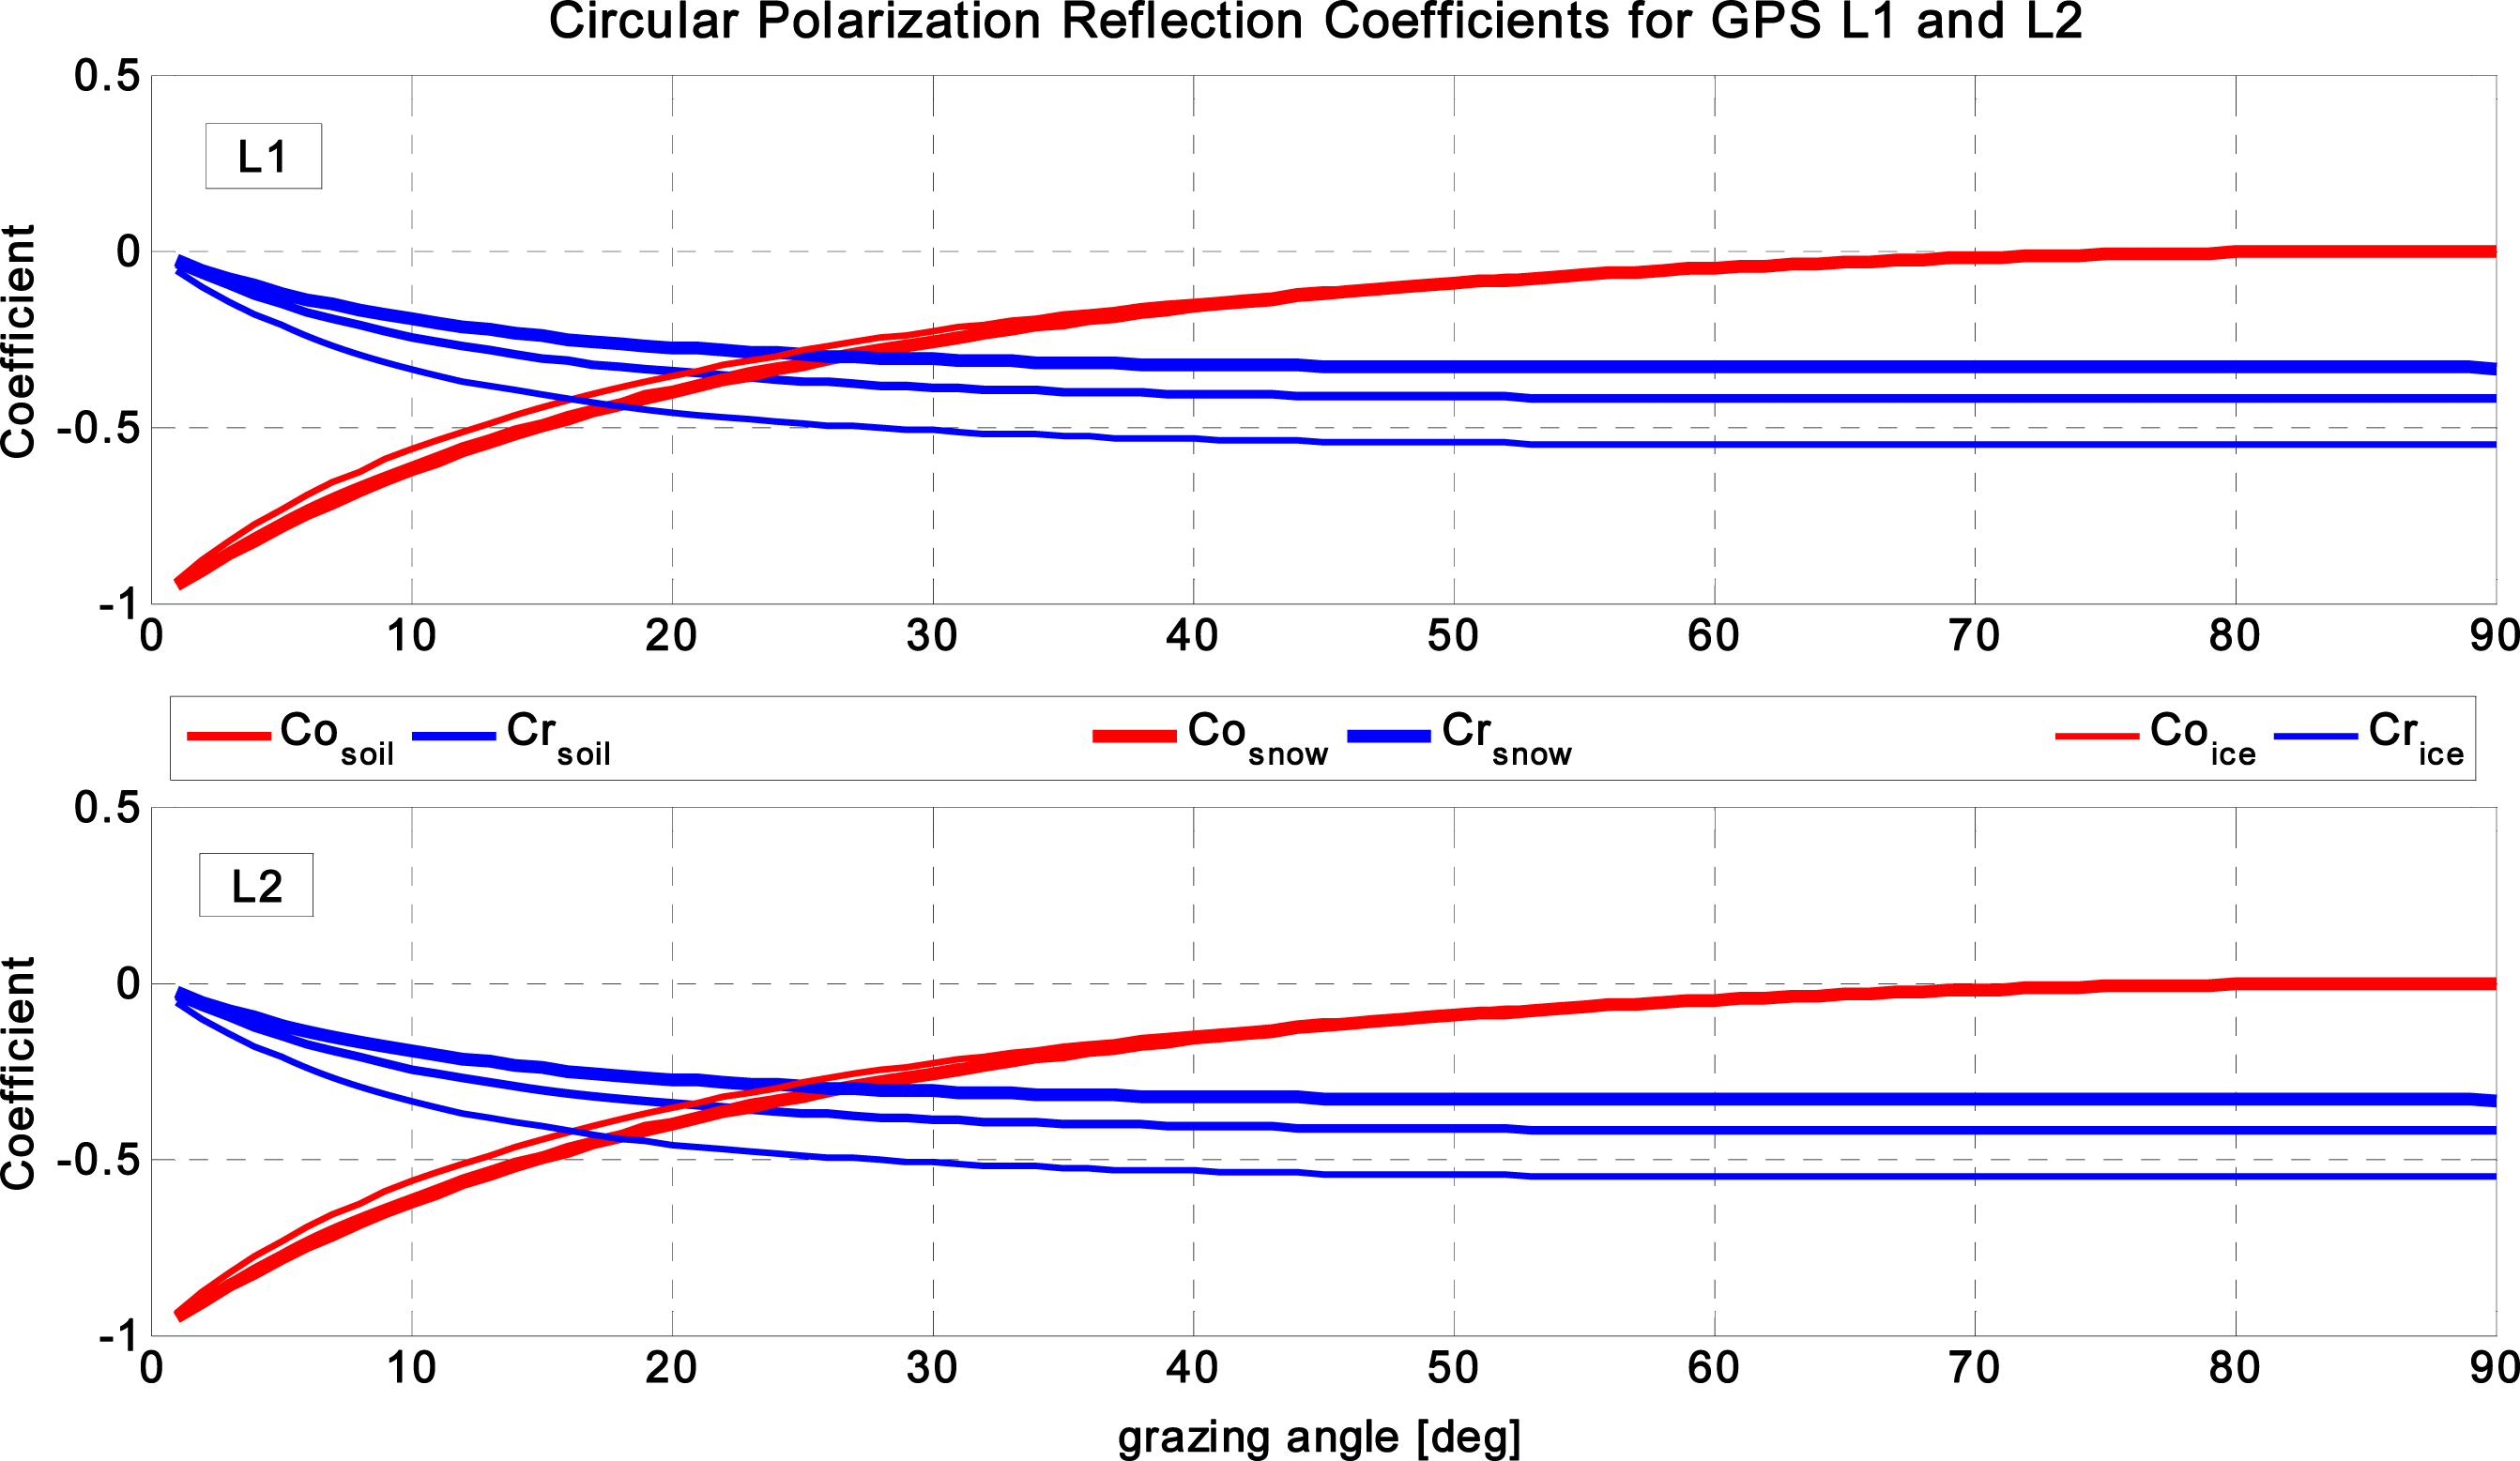
Referring to
Figure 19, the co-polarized and cross-polarized plots are approximately symmetrical. The Brewster angle in circular polarization occurs at the intersection point of co-polarization and cross-polarization plots (e.g., 27° for snow in GPS L1 signal).
Additionally, ice surface reflectance has a minimum Brewster angle, but snow surface has a maximum one. The soil surface’s Brewster angle is less than the snow’s one but larger than soil surface’s value. This can be attributed to the large difference between snow and ice surface in terms of characteristic reflectance discriminating in interactions with GPS signals in circular polarization.
To demonstrate this, by referring to
Figure 18 (linear polarization plots for GPS L1 and L2 signals) and
Equations (15) and
(16) that consist of linear polarization values, the difference between vertical and horizontal plots can be seen as the largest values in soil surface plots.
In order to observe the entire reflection from these surfaces (both of vertical and horizontal polarizations or both of co-polarization and cross-polarization reflections) the convolution functions have been proposed for soil, snow and ice surface in both linear (
Equation (17)) and circular (
Equation (18)) polarization, respectively(
Figures 20 and
21).
In
Figure 20, the minimum of each surface occurs at 90°. This is where the first derivative of the corresponding convolution function for the linear polarization can occur. This means the behavior of the convolution function is inverting suddenly after 90°. In other words, this sudden reversing is similar in order to replace the vertical linear polarization by a horizontal one after 90°. Furthermore, it can be concluded from each convolution values’ diagram that each selected surface has a majority of negative linear polarization values rather than positive ones.
Since it is presented in
Figure 20, the soil surface total reflection convolution values derived from linear polarization is located between ice and snow values. This is highly remarkable and can be strong evidence for discriminating snow and ice surfaces from each other through GPS reflected signals.
The comparison of linear polarization convolution values for GPS L1 and L2 signals (see
Figure 20) gives us the fact that the surface reflectance for GPS L2 signal is larger than L1; although the GPS L2’s wavelength is greater than L1.
Referring to
Figure 18 and linear polarization equations in GPS L1 and L2 signals for soil, the difference between vertical and horizontal (blue and red colored plots) is more than other surfaces. For example, in grazing angle of 30° for GPS L1 signal; the linear polarization reflection coefficient for soil, snow and ice surfaces in vertical and horizontal polarizations are as follows, respectively: 0.28, 0.21, 0.09 and −0.74, −0.62, −0.55 (see
Figure 18). The absolute difference between each pair value for soil, snow and ice surfaces will be equal to 1.02, 0.83 and 0.64. Therefore, the summation of soil surface reflection coefficients in vertical and horizontal directions computed by convolution function is displayed as more noteworthy.
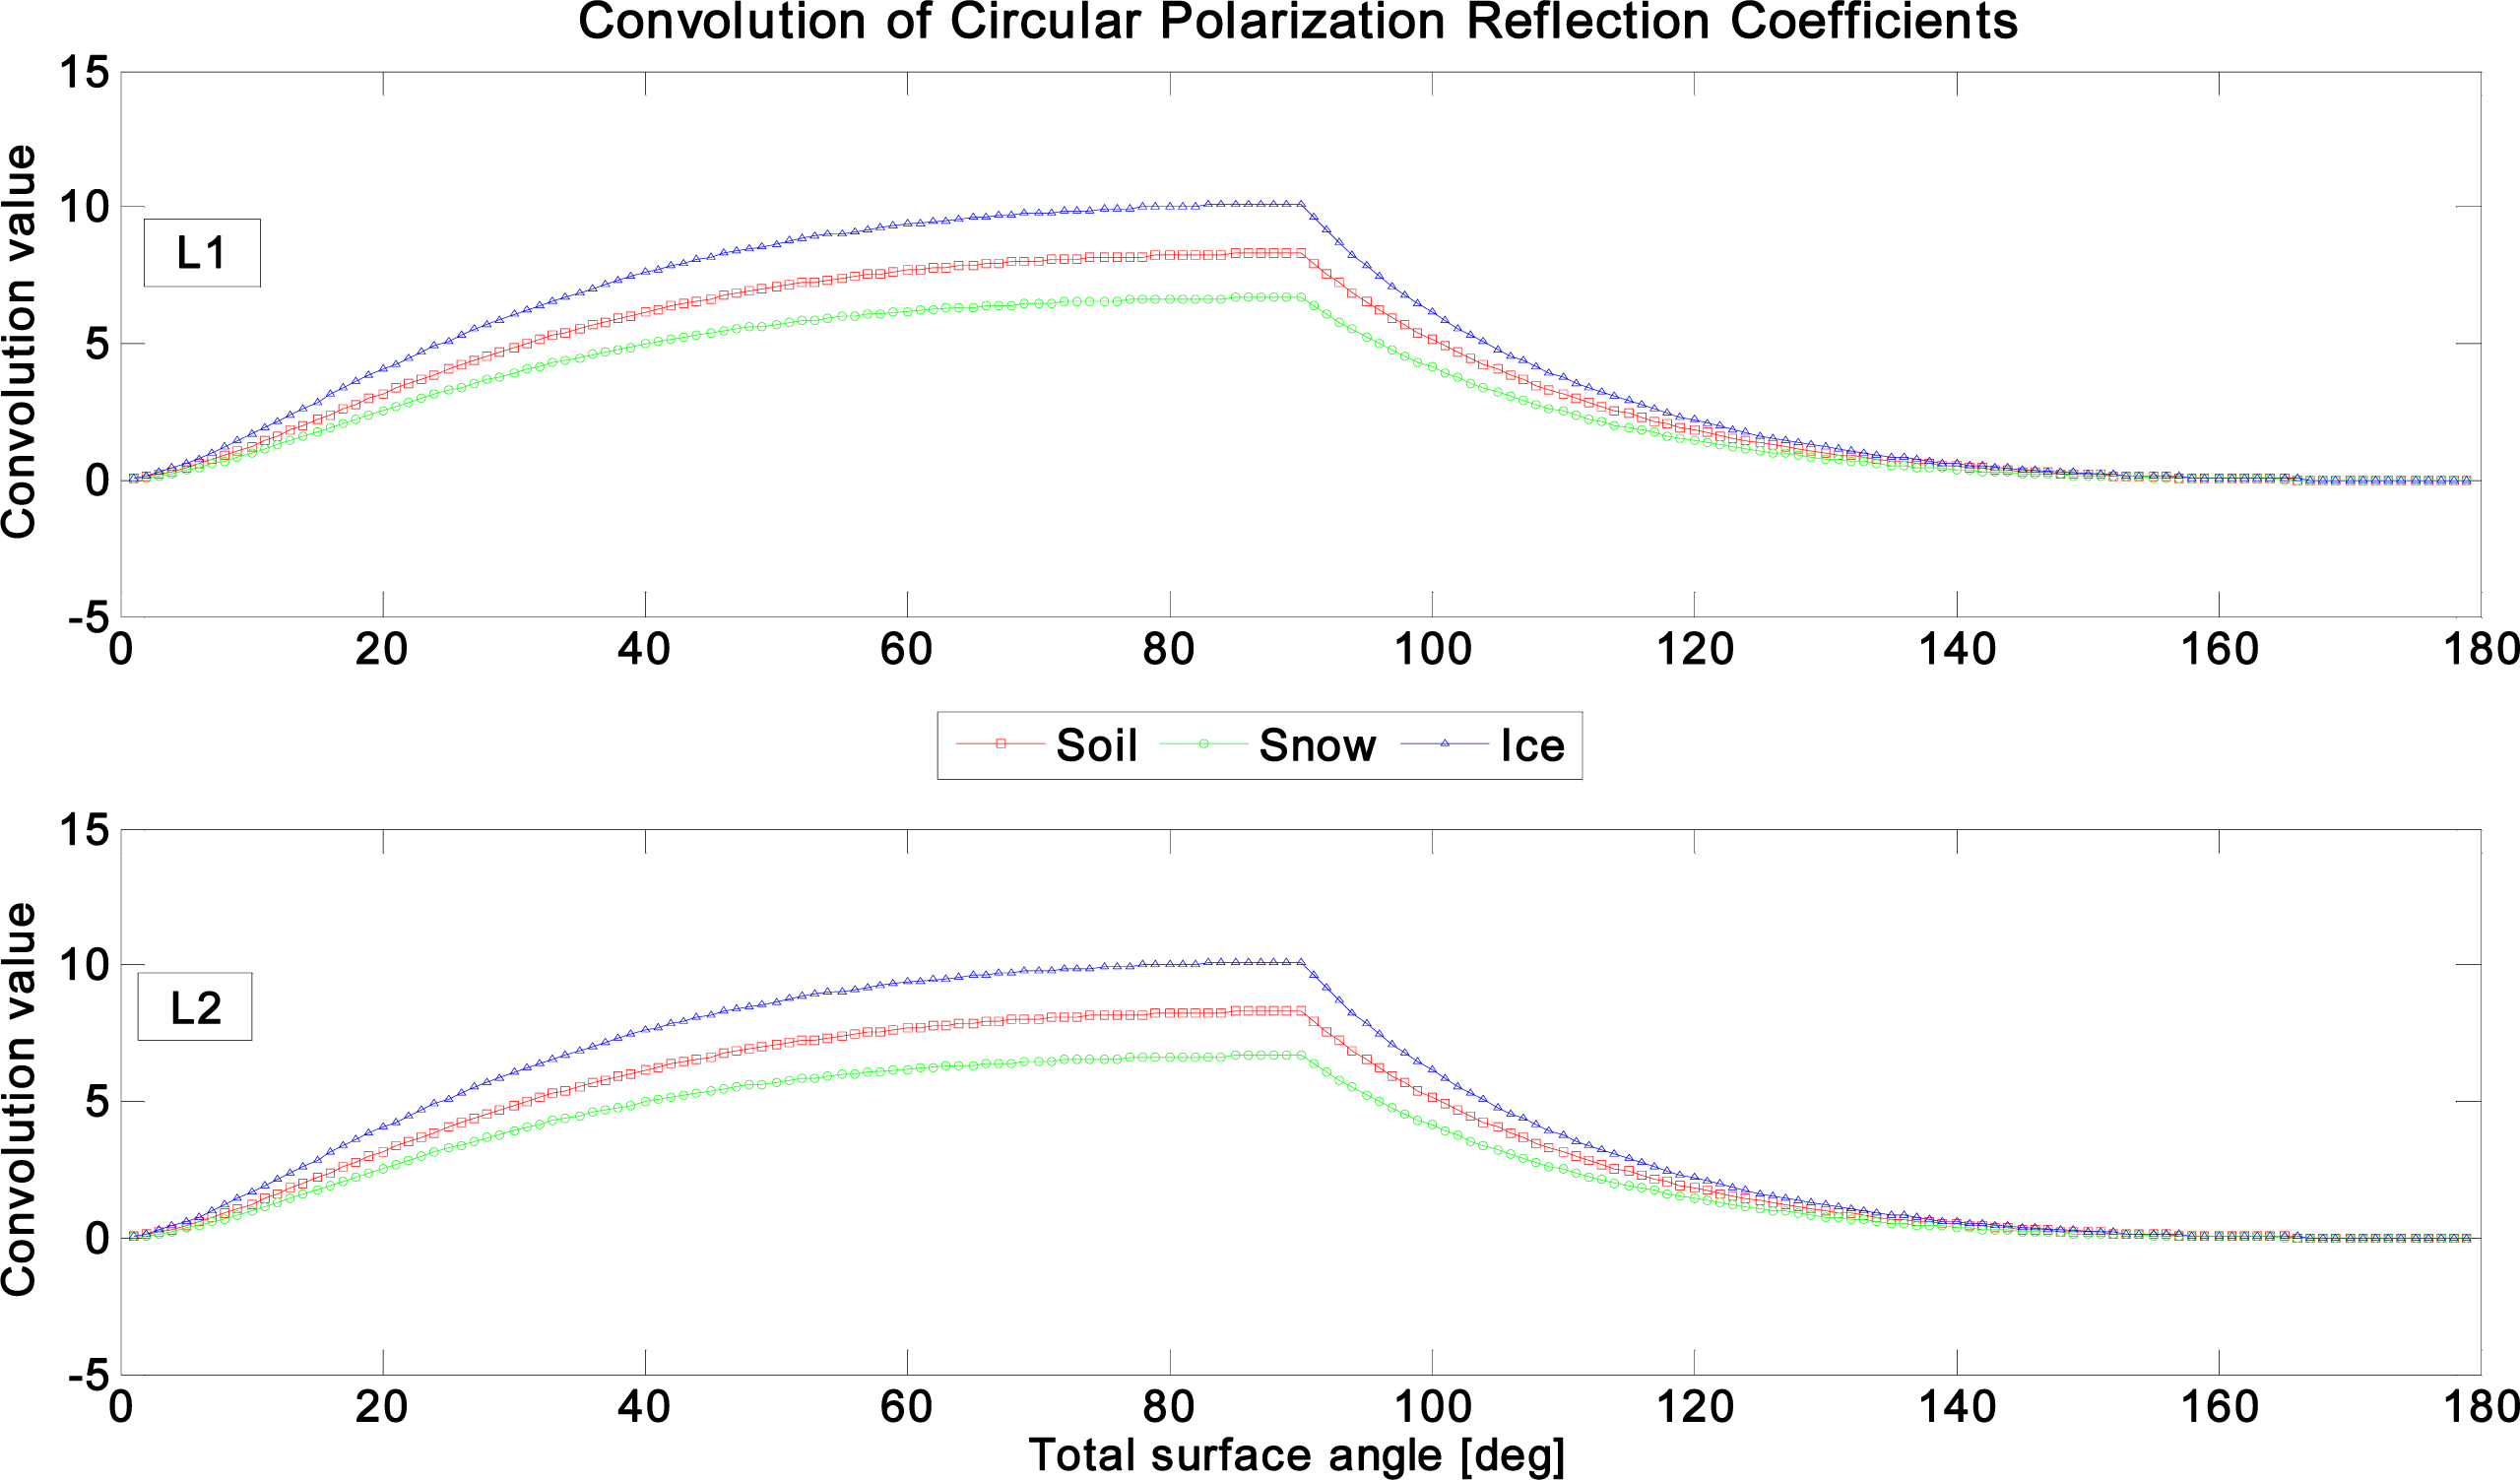
The co-polarized and cross-polarized coefficient values vary between 0 and −1 (see
Figure 19). In
Figure 21, the changing phase angle occurs at 90°. The circular convolution function trend before and after 90° is becoming completely shifted and mirrored with a 180° phase difference. Moreover, the point which
RCH and
RCV are equivalent to each other is occurring at 0° where the cross-polarization coefficient reflectance is equal to 0. In addition, the summation of
RCH and
RCV s equal to 0 where the co-polarization reflectance coefficient is equal to zero at 90°.
Additionally, the snow surface has the minimum circular reflection value in co-polarization and maximum one in cross-polarization. However, the ice surface has maximum circular reflection values in co-polarization and minimum values in cross-polarization. In fact, referring to
Equations (15) and
(16) and
Figures 19 and
21, the Brewster angle for snow surface is greater than soil surface in cross-polarized and co-polarized GPS L1 and L2 signals. Similarly, the Brewster angle for soil surface is larger than ice surface values.
To compare these two convolution functions for linear (
Figure 20) and circular polarization (
Figure 21), for both of them the sequence order for surface reflectance in GPS L1 and L2 signals is as follows: the total snow surface’s reflectance values are larger than both soil and ice surface’s reflectance values during linear polarization. In circular polarization, the total reflectance of cross-polarization and co-polarization for ice surface is greater than both soil and ice surface. For example, for GPS L1 signal in total surface angle at 40°, the linear polarization convolution and circular polarization convolution values for soil, snow and ice surfaces are respectively as follows: 4, 6, −2 and 6, 4, 8.5. The soil surface reflectance values in both linear and circular polarization convolution functions are located between ice and snow surface’s reflectance values, as shown in
Figures 20 and
21.


