Article

The Global Land Surface Satellite (GLASS) Remote Sensing Data Processing System and Products

1
College of Global Change and Earth System Science, Beijing Normal University, No. 19, XinJieKouWai St., HaiDian District, Beijing 100875, China
2
State Key Laboratory of Remote Sensing Science, Jointly Sponsored by Beijing Normal University and Institute of Remote Sensing Applications, Chinese Academy of Sciences, No. 19, XinJieKouWai St., HaiDian District, Beijing 100875, China
3
Department of Geographical Sciences, University of Maryland, 2181 Samuel J. LeFrak Hall, College Park, MD 20742, USA
4
School of Geography, Beijing Normal University, No. 19, XinJieKouWai St., HaiDian District, Beijing 100875, China
5
Institute of Electronics, Chinese Academy of Sciences, No. 19, North 4th Ring Road West, Haidian District, Beijing 100190, China
*
Author to whom correspondence should be addressed.
Remote Sens. 2013, 5(5), 2436-2450; https://doi.org/10.3390/rs5052436
Submission received: 24 March 2013 / Revised: 23 April 2013 / Accepted: 7 May 2013 / Published: 15 May 2013
(This article belongs to the Special Issue High Performance Computing in Remote Sensing)

Abstract

:
Using remotely sensed satellite products is the most efficient way to monitor global land, water, and forest resource changes, which are believed to be the main factors for understanding global climate change and its impacts. A reliable remotely sensed product should be retrieved quantitatively through models or statistical methods. However, producing global products requires a complex computing system and massive volumes of multi-sensor and multi-temporal remotely sensed data. This manuscript describes the ground Global LAnd Surface Satellite (GLASS) product generation system that can be used to generate long-sequence time series of global land surface data products based on various remotely sensed data. To ensure stabilization and efficiency in running the system, we used the methods of task management, parallelization, and multi I/O channels. An array of GLASS remote sensing products related to global land surface parameters are currently being produced and distributed by the Center for Global Change Data Processing and Analysis at Beijing Normal University in Beijing, China. These products include Leaf Area Index (LAI), land surface albedo, and broadband emissivity (BBE) from the years 1981 to 2010, downward shortwave radiation (DSR) and photosynthetically active radiation (PAR) from the years 2008 to 2010.

1. Introduction

Satellite remote sensing is the main method for measuring and monitoring changes in the earth’s surface and atmosphere. A series of operating satellites from different countries are producing tremendous volumes of data at significantly higher levels of measurement precision [1,2]. Along with the application of the Advanced Very High Resolution Radiometer (AVHRR) [3] and Moderate Resolution Imaging Spectroradiometer (MODIS) [4] data, time series remote sensing data are now available in several spatial and temporal resolutions and have been used for various purposes [510]. The effective utilization of time series of remote sensing data is an important area in current research, concurrent with the development of domestic and overseas satellite technology [1113]. There exist many satellite remote sensing standard data products [3,4,14,15] and distributed remote sensing data systems [16,17] that scientists have been using in their studies of atmosphere, biosphere, cryosphere, land surface and oceans. Remote sensing-based long-sequence time series data have become a powerful tool for researching long-term global changes [8,18,19].
Although some experimental high-level products are being generated, China has not developed a product generation system to generate and distribute long-sequence time series global land products from before the year 2009. To achieve this goal, China launched the 863 key project entitled “Generation and application of global products of essential land variables” in 2009. The project is one of the 863 programs funded and administered by the government of the People’s Republic of China intended to stimulate the development of advanced technologies in a wide range of fields. The central component of this project is developing the ground Global LAnd Surface Satellite (GLASS) product generation system. In order to process and release GLASS products, Beijing Normal University established the Center for Global Change Data Processing and Analysis, and built the GLASS system at there. The purpose of establishing the center is to manage, process, analyze and release Global Change Data. All GLASS products were processed and released by the center. The GLASS system can be used to generate five land surface remote sensing products: Leaf Area Index (LAI), shortwave broadband albedo, broadband emissivity (BBE), downwelling shortwave radiation (DSR), and photosynthetically active radiation (PAR). The newest algorithms that utilize multi-source remote sensing data, such as MODIS and AVHRR, to generate GLASS products are integrated into the system.
The GLASS product generation system was designed to implement high-performance computing (HPC) on a clustered environment. The system also has relatively high efficiencies for utilizing the distributed and parallel computing techniques. Five GLASS products have been generated with the system. The five products are eight-day LAI, albedo and BBE products with resolutions of 5 km and 1 km for the years before and after 2000, respectively, and three-hour DSR and PAR datasets with a 5-km resolution from the years 2008 to 2010.
The main objective of this manuscript was to describe the structure, configuration, performance and products of GLASS system. This following presentation is organized as follows. Section 2 describes the structure and performance of GLASS product generation system which involved HPC. Section 3 is focused on five GLASS products datasets, Sections 4 and 5 describe components of quality control and product service. Concluding remarks are briefly stated in Section 6.

2. Product Generation System

The GLASS product generation system, similar to the EOS Data Information System (EOSDIS) and MODIS data processing system [4,14,20], is designed to provide the computing and network facilities that are essential in supporting various research activities, including processing, distributing, and archiving data.

2.1. System Structure and Configuration

The system’s hardware primarily consists of processing, management, and database servers. The GLASS product generation system network structure can be observed in Figure 1.
The processing servers, comprising the high-performance computing (HPC) system, are used to obtain the preprocessing data (PRE), LAI, albedo, BBE, DSR and PAR data products. In this research, HPC refers to a computing environment with several computers in a cluster. The management and database servers provide the system operation management and data storage services, respectively. The system’s software generally comprises production task management, HPC distribution, data quality verification and system monitoring.

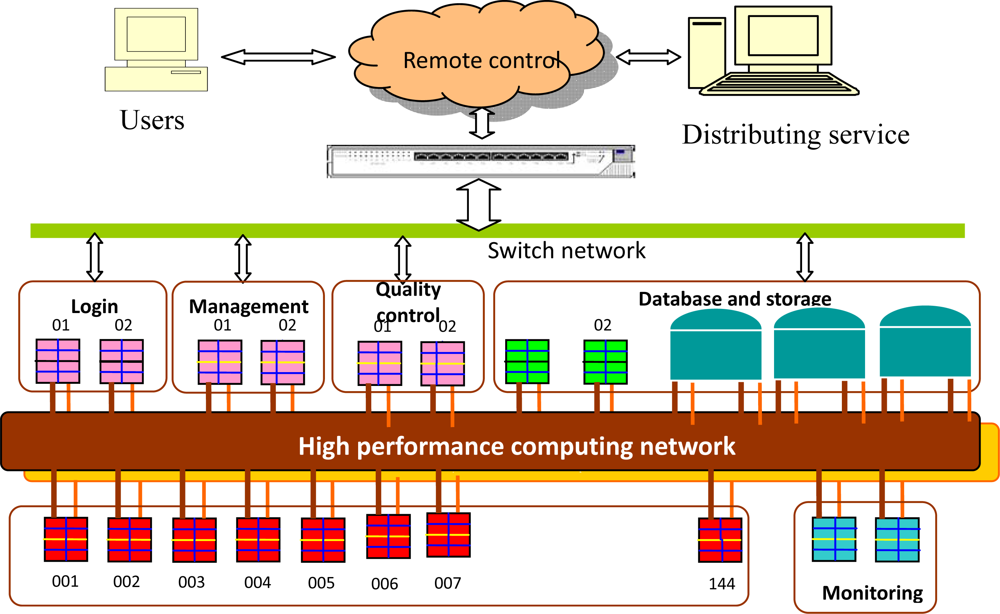
2.2. High-Performance Parallel Computing System

Due to their superiority at improving computation efficiency and increasing the computation scale, the parallel computing techniques associated with HPC are adopted for some retrieval algorithms when more computing time is needed. One of the most popular high-performance parallel computing schemes is the message passing interface (MPI). This interface exchanges work requests among the nodes via message passing and thus provides a simple method for work creation [21]. A typical scheduling map of high-performance parallel computing is shown in Figure 2. The thread0 is the main thread that is responsible for distributing, receiving and summarizing data, while other threads are concerned with computation.

2.3. Multitask Management and Operation

Due to the massive number of products and the limited number of computational nodes, a unified task management system is required to successfully create GLASS products in the GLASS system. Multitask management refers to task-based realization and management of the production of various product levels. A task refers to the production steps formulated according to specific needs, which mainly involve such requirements as production type, input data, time, and algorithm version. Typical product generation procedures on the GLASS system are as follows:
  • * A product generation job can be created in the user interface and be sent to a task server. A job is often more of an application-level term and simply refers to some script that is executed to do a specific set of tasks.
  • * A task server creates tasks, dispatches them to cluster nodes, and processes returned tasks. A task is often a part of a job and sometimes is the only part. The Simple Linux Utility for Resource Management (SLURM) Version 2.2 has been used as the cluster resource manager. SLURM is an open source, fault-tolerant, and highly scalable cluster management and job scheduling system for large and small Linux clusters [22]. It provides a framework for starting, executing, and monitoring work (normally a parallel job) on the set of allocated nodes.
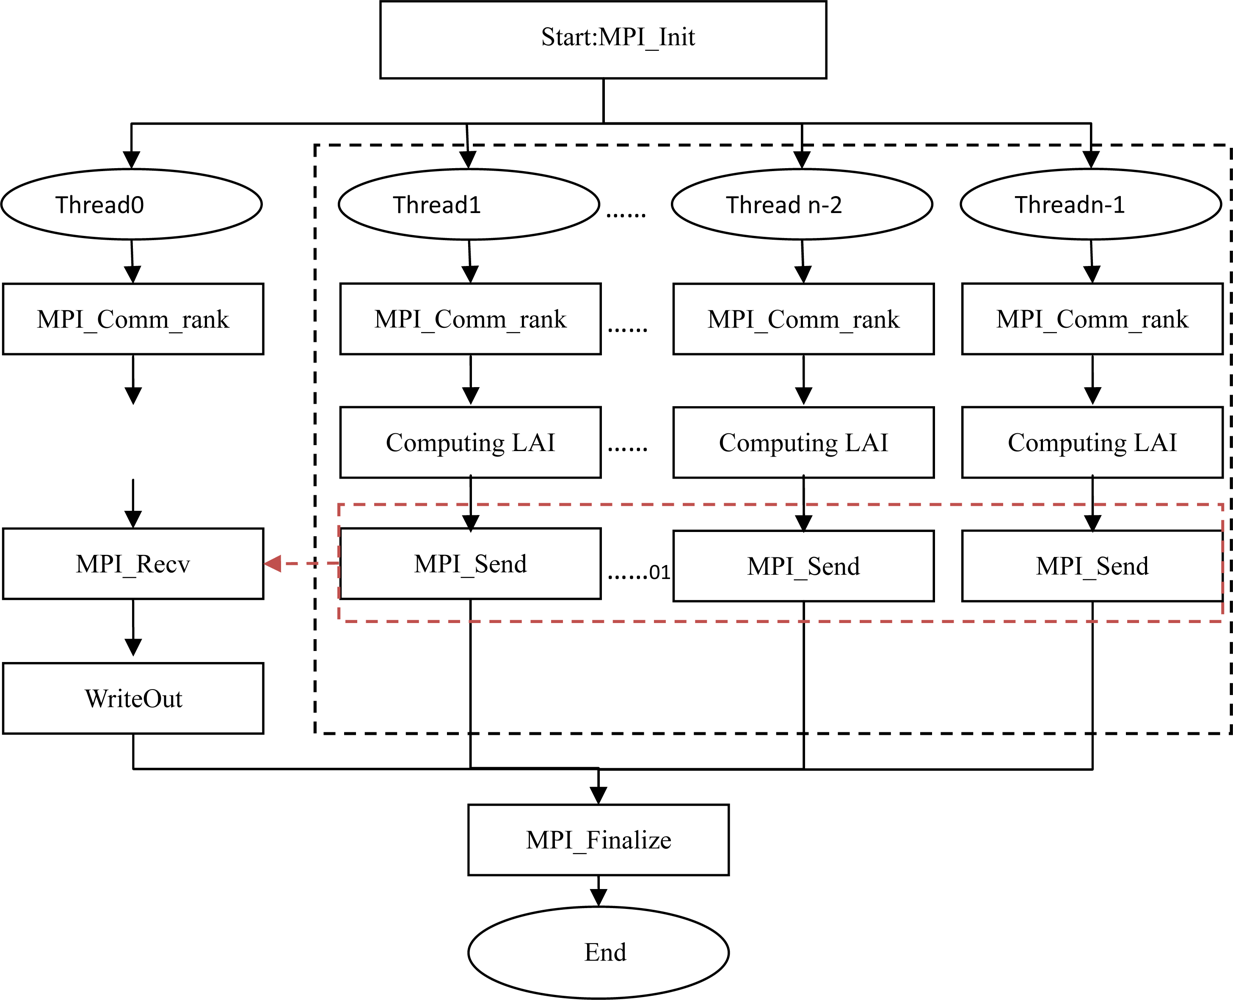
  • * Every task will run in its own thread. While the tasks within the parallel task are being run, the main thread will be blocked and will wait for all the child threads to be completed. In Figure 2, the thread0 is the main thread that is responsible for distributing, receiving and summarizing data, while the others are concerned with computation. All of these threads are optimized according to their computing time. That means if one task is finished, the thread can be reused.

3. GLASS System Performance and Products

3.1. Performance Measurements

The GLASS product generation system has relatively high efficiencies for utilizing the distributed and parallel computing techniques. High performance parallel computing is accomplished by splitting up large and complex tasks across multiple processors or cluster nodes. A job server, a task server and cluster nodes are organized together to fulfill the product generation. A job, for example, to generate one year of LAI products in 2008, can be created by the job server. As soon as the job is examined and verified, it will be sent to the task server. After that, the task server creates tasks, dispatches them to cluster nodes according to the tiles of MODIS data. Each node periodically communicates with the task server to report completed work and to get new work before all tasks are accomplished.
In order to compare the efficiency between parallel and nonparallel computing environments, we made performance measurements of the product generation using the GLASS system. All measurements were made with a Hewlett-Packard Cluster with the same configuration. Based on the features of the GLASS products’ retrieval algorithms [23], a high-efficiency parallel algorithm was established on the hardware platform of the existing high-performance parallel computer system with software support. As the distributed and parallel computing technology was used, the run time of the program decreased considerably. For example, it took 14.4 h to generate one year of LAI products from MODIS data in a nonparallel computing environment with 10 nodes, while it only took four hours when the cluster with 10 nodes was used in the parallel processing program. Thus the computation time can be reduced sharply. The speedups attained by using the cluster are shown in Table 1.

3.2. Product Format and Metadata

The current GLASS products are LAI, albedo, BBE, DSR and PAR. The file format of all GLASS products is HDF-EOS Version 2.16, which can obtain geometric information that relates data to specific earth locations. The HDF-EOS data format is extensively used in MODIS products [24], so we can use certain MODIS tools, such as MODIS Reprojection, to address the GLASS products. The GLASS product filenames follow a naming convention that provides useful information regarding the specific product. For example, the filename
GLASSXXNYY. VXX. AYYYYDDD.HRRVPP.YYYYDDD.hdf indicates the following:
GLASS stands for the Global LAnd Surface Satellite products
XX stands for the types of GLASS products, 01: LAI; 02: albedo; 03: BBE; 04: PAR; 05: DSR
N stands for spatial resolution, which is labeled A, B, and C
YY stands for codes for different types of GLASS products, which depend on the algorithm and data sources of the products
AYYYYDDD stands for the time of the products, YYYY is for year, and DDD is for Julian day
HRRVPP stands for tile ID (path/row number), HRR-row number, VPP-path number. HRRVPP is not validated when the product is processed by the AVHRR data
YYYYDDD stands for the process time of the products
hdf stands for the data format (HDF-EOS Version 2.16)
GLASS products have two sources of metadata: the embedded HDF metadata and the external metadata. The HDF metadata contains valuable information, including global attributes and data set-specific attributes pertaining to the granule. The xml file is the external metadata file which is delivered to the user along with the GLASS products.

3.3. Product Descriptions

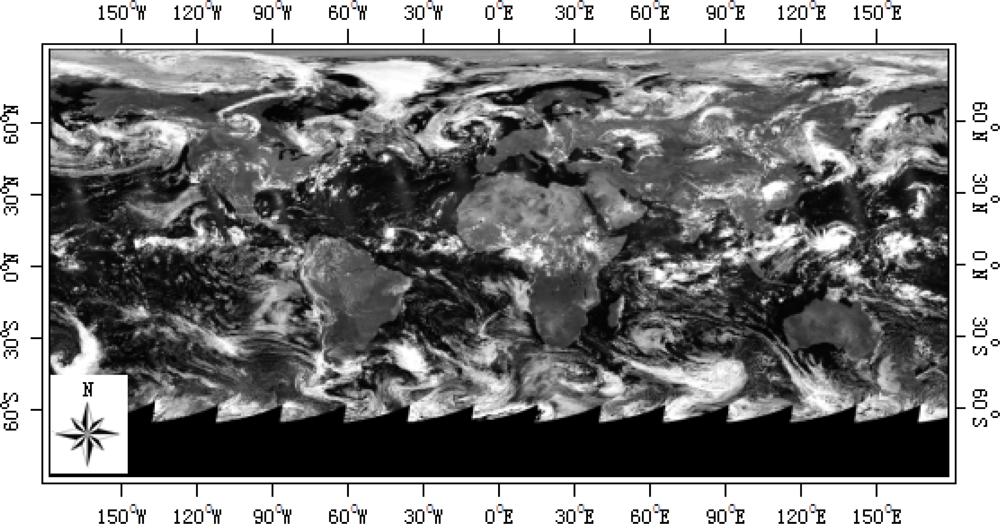
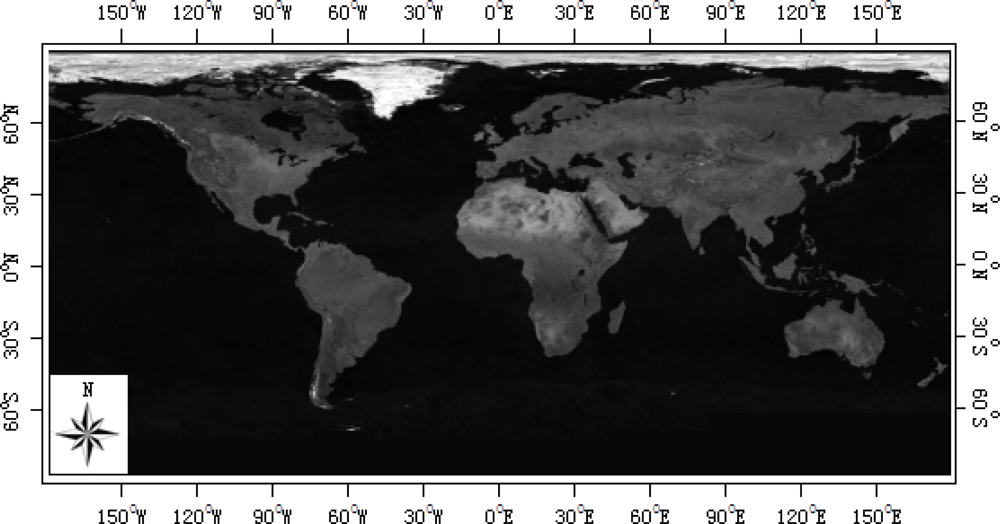
3.2.1. Preprocessed Data
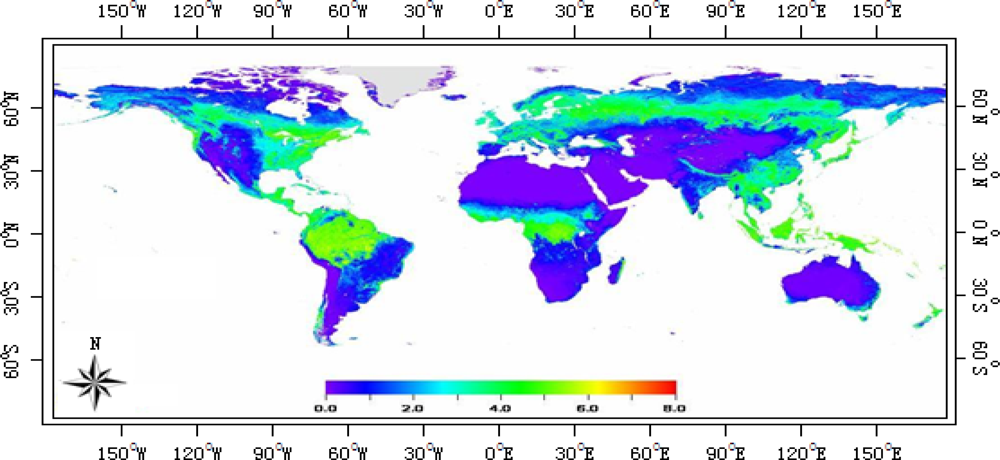
In the GLASS system, MODIS and AVHRR data were used as input data to generate GLASS products. The data quality of the MODIS and AVHRR images was greatly influenced by clouds, cloud shadows, snow, and other abnormal climate conditions, which hindered the surface reflectance inversion and further impacted the GLASS products’ quality. Some data, such as AVHRR, MOD09A1, MOD09GA, MCD43B3 and MOD02, were preprocessed before they were used to produce the GLASS products. To improve the data quality, the existing MODIS snow and cloud mask and the reflectance characteristics of the non-snow/cloud pixels were used in combination to identify pixels of snow, clouds and abnormal values. All of the identified values were filled by the clear pixel values over a long period of time to remove the effects of snow, clouds and cloud shadows. Figures 3 and 4 show an example of preprocessed results. Figure 3 is a raw AVHRR image, while Figure 4 is the preprocessed image.

3.2.2. LAI Products

LAI, which is defined as one-half the total green leaf area per unit of horizontal ground surface area [25], is an important property of vegetation and has the strongest effect on overall canopy reflectance. The LAI retrieval algorithm integrated into the GLASS system employs General Regression Neural Networks (GRNNs) to generate a long time series of global LAI data with spatial and temporal continuity from time series of remote sensing observations. The neural networks were trained by the fusion of the LAI from MODIS and CYCLOPES LAI products with the reprocessed land surface reflectance over the BELMANIP sites during the 2001–2003 period. Reprocessed MODIS and AVHRR land surface reflectance data of a whole year were input simultaneously, allowing a one-year LAI profile to be reconstructed by the GRNNs. The comparison between the GLASS LAI derived from AVHRR and MODIS surface reflectance data indicates a consistent LAI product from different sensor data. The inter-comparison of the GLASS LAI and other global LAI products show that the GLASS LAI is spatially complete and temporally continuous [23].
The GLASS system produces an eight-day LAI over a period of 30 years from MODIS and AVHRR data at different spatial resolutions. The spatial resolution of the product from 1981 to 2000 is 5 km, and that from 2000 to 2010 is 1 km. Figure 5 displays the GLASS LAI global product for Julian day 209 in 2008.

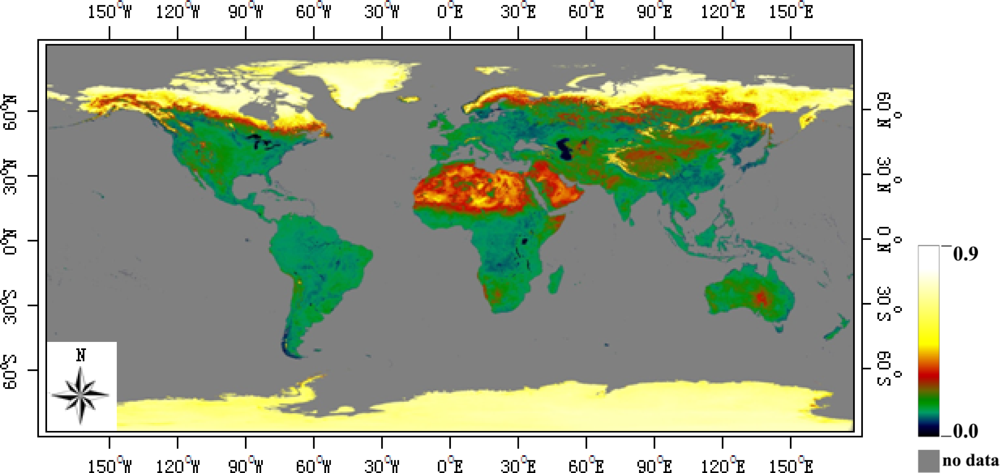
3.2.3. Albedo Products
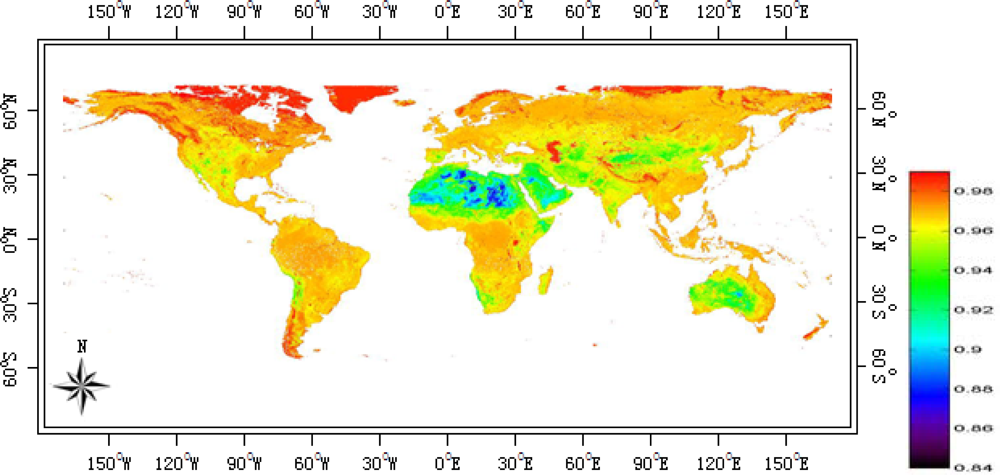
Land surface albedo, defined as the ratio of reflected solar shortwave radiation from a surface to that incident upon it [26], is one of the most important parameters affecting the radiative energy budget of the earth’s surface [27,28]. The daily albedo is retrieved by the Angular Bin algorithm (AB), which, through a simple linear equation directly calculates the broadband albedo from the multi-band surface directional reflectance or the TOA (top of the atmosphere) directional reflectance [29]. To correct for the solar/view angle dependence of surface or TOA reflectance, the AB algorithm divides the space of the solar/view geometry into small grids, which are called angular bins, and it derives different linear regression coefficients for each of the angular bins. As an empirical algorithm, the AB algorithm has the advantages of simplicity, speed and low input data requirements, while maintaining relatively good accuracy. The AB algorithm comprises two sub-algorithms, AB1 and AB2, which calculate the white sky shortwave (0.3–3 μm) albedo and the black sky shortwave albedo using the daily surface reflectance and the daily TOA reflectance, respectively. In the AB2 algorithm, the atmospheric correction for the input data is bypassed, thus avoiding errors introduced in the imperfect atmospheric correction.
The outputs of the AB algorithm are intermediate GLASS albedo products, which have a one-day temporal resolution. The GLASS final albedo product in eight-day steps is obtained by merging the results obtained from AB1 and AB2 in a 16-day time window after 2000 or in a 32-day time window before 2000 through a Statistics-Based Temporal Filtering (STF) algorithm [30]. The STF detects and eliminates the occasional abnormal values in the intermediate products, and it fills missing values through temporal filtering supported by a prior database. The GLASS final albedo product is gapless and continuous in the spatial and temporal domains.
The GLASS system produces an eight-day albedo over a period of 30 years from MODIS and AVHRR data at different spatial resolutions. Figure 6 presents an example of the GLASS final albedo product on Julian day 115 of 1985. The data source is the daily AVHRR surface reflectance product released by the Long-Term Land Data Record (LTDR) project of NASA [31]. The spatial distribution pattern of the global land surface albedo is satisfactorily captured by the GLASS product. For details of the accuracy of the GLASS albedo product, the user can refer to the reference [32].

3.2.4. BBE Products

The land surface BBE is an important parameter for studies of surface upward longwave radiation, which is an important component of the surface radiation budget and an important parameter for numerical weather prediction and hydrological models [33,34]. The GLASS emissivity is a BBE (8–13.5 μm) product that was derived from AVHRR and MODIS optical data with our newly developed algorithms [35,36]. GLASS BBE is composed of two parts: the first is the global eight-day 1-km land surface BBE retrieved from MODIS albedo ranging from 2000 to 2010; the second is the global eight-day 5-km land surface BBE retrieved from the AVHRR VNIR reflectance data of 1981–1999. In the algorithm used to generate the GLASS BBE, the land surface was classified into five types based on the Normalized Difference Vegetation Index (NDVI) threshold values: water, snow/ice, bare soils, vegetated areas, and transition zones. The BBE of water and snow/ice was assigned as 0.985 by combining the BBE calculated from the emissivity spectrum in the ASTER spectral library [37] and the MODIS UCSB spectral library [38], as well as that simulated by radiative transfer models [39]. The BBEs of bare soils, vegetated areas, and transition zones were formulated as the linear function of seven MODIS narrowband black-sky albedo and the nonlinear function of the AVHRR channel 1 and 2 reflectances, respectively. The BBE derived from the MODIS albedo was validated by field measurements conducted over deserts in United Sates and China, and the absolute difference was found to be 0.02. The BBE derived from the AVHRR was consistent with that derived from the MODIS data. The mean bias and RMSE of the difference between these two BBEs was on the order of 0.001 and 0.01, respectively [36].
The GLASS system generates eight-day surface 8–13.5 μm emissivity products for a 30-year period at different spatial resolutions. The spatial resolution of the product from 1981 to 2000 is 5 km, and that from 2000 to 2010 is 1 km. Figure 7 presents an example of the final GLASS BBE product, which is for Julian day 161 in 2008.

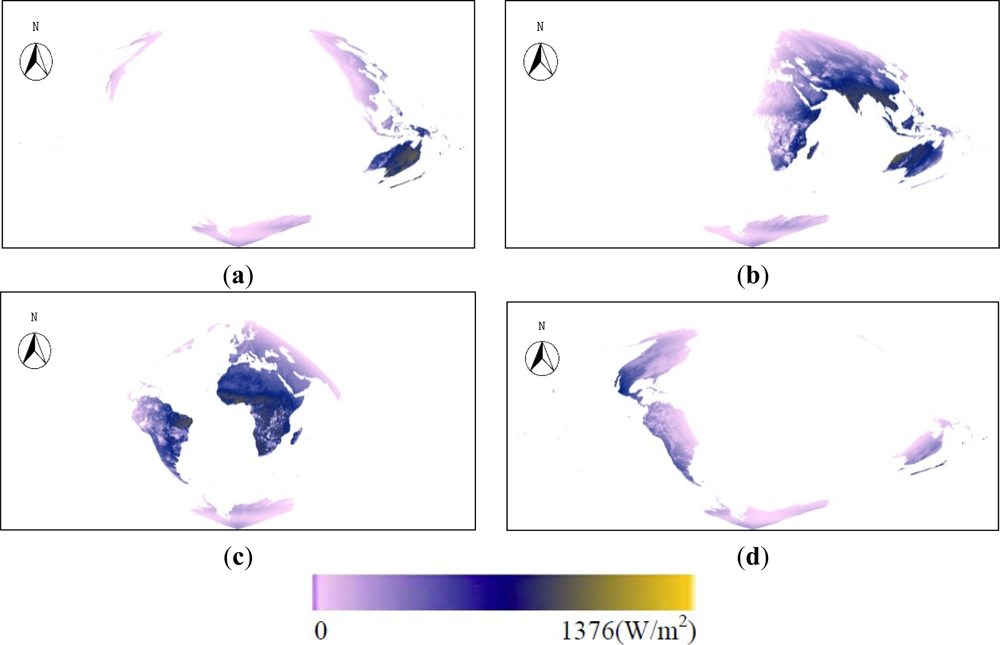
3.2.5. DSR and PAR Products

DSR, defined as the illuminated solar radiation from 300 to 2,500 nm, is an important parameter in the surface radiation budget [40,41]. PAR, known as solar radiation available for photosynthesis, is primarily in the visible part of the spectrum [42]. The two products are important physical and ecological parameters under the total energy exchange process between the atmosphere and the land surface [43,44]. In the GLASS system, the global DSR and PAR products were generated based on an improved look-up table method using both polar-orbiting and geostationary satellite data, including MODIS, Meteosat Second Generation (MSG) SEVIRI, the Multi-functional Transport Satellite (MTSAT)-1R, and the Geostationary Operational Environmental Satellite (GOES) Imager [45].
The basic procedure of the GLASS DSR and PAR products comprises three steps: (1) establish the look-up table at different atmospheric conditions and geometries for each satellite data under cloud and cloud-free conditions; (2) estimate the surface DSR and PAR from the surface reflectance and TOA radiance data for each satellite data; and (3) map the DSR and PAR globally by using the MODIS data to derive the solar radiation at surfaces greater than the 60° north and south latitudes, and calculate the radiation at the lower latitudes through a combination of polar-orbiting and geostationary satellite-derived radiation products.
The global fusion products of the DSR and PAR images are mapped in a sinusoidal projection at a 5-km spatial resolution and three-hour temporal resolution from 2008 to 2010. Figure 8 shows the global combined DSR product retrieved using data from multiple polar-orbiting and geostationary satellites on 12 November 2008.

4. Quality Control

The purpose of quality control for GLASS products is to ensure that users are provided with high-quality products after examination and assessment. Quality control consists of two components, namely, spatial quality checkup and numerical accuracy assessment. Spatial quality checkup involves screening for missing data or bands, mosaics, and any spatial discontinuity problems arising from the lack of raw data. Numerical accuracy assessment compares the product to the data measured on the ground to evaluate the product’s accuracy. All GLASS products have already been examined by spatial quality verification processes. More than 10 institutions or departments have contributed toward the accuracy assessments of all GLASS products.

5. GLASS Products Service

To provide GLASS products to users, the user services team monitors the integrity of the archive, and ensures that the GLASS products arriving from the production system are stored and properly inventoried. User services are responsible for maintaining the data search and order web interface [46], which is able to supply large amounts of data online to be downloaded by multiple users. The site serves as an interactive system that provides information on queried products. Additional questions can be addressed to: [email protected].

6. Summary

The newly developed GLASS system is capable of automatically generating remote sensing parameters based on processing global satellite data, remote sensing products, and ground observations. The GLASS data processing system is designed to provide the computing and network facilities that are essential in supporting various research activities, including processing, distributing, and archiving data. The parallel computing techniques of MPI associated with HPC are adopted for product retrieval algorithms.
An array of GLASS products related to global land surface parameters are currently produced with the GLASS system. These GLASS products include LAI, albedo, BBE, DSR and PAR. The first three products span from 1981 to 2010 at a spatial resolution of 1- to 5-km and eight-day resolutions. The last two products span from 2008 to 2010, and have high temporal resolution (three-hour) and spatial resolution (5-km). The first three products are mainly based on AVHRR and MODIS data, and two radiation products use the combined five geostationary satellites and MODIS data.

Acknowledgments

The authors acknowledge the GLASS Algorithm Team for providing the Science Algorithms, the System and Quality Control Team for producing the relevant GLASS products, and the Database and Products Service Team for making the GLASS products available to the user community. This work was supported by the Key Project of Earth Observation and Navigation Field of the State Programme for High-Tech Research and Development (863 Program) (2009AA122103). The authors wish to thank the anonymous reviewers for their valuable comments.

References

  1. Schowengerdt, R.A. Remote Sensing: Models and Methods for Image Processing, 3rd ed.; Academic Press: San Diego, CA, USA, 2007. [Google Scholar]
  2. Liang, S. Quantitative Remote Sensing of Land Surfaces; John Wiley and Sons Inc: Hoboken, NJ, USA, 2004. [Google Scholar]
  3. Gutman, G.G. Vegetation indices from AVHRR: An update and future prospects. Remote Sens. Environ 1991, 35, 121–136. [Google Scholar]
  4. Savtchenko, A.; Ouzounov, D.; Ahmad, S.; Acker, J.; Leptoukh, G.; Koziana, J.; Nickless, D. Terra and Aqua MODIS products available from NASA GES DAAC. Adv. Space Res 2004, 34, 710–714. [Google Scholar]
  5. Vicente-Serrano, S.M.; Pérez-Cabello, F.; Lasanta, T. Assessment of radiometric correction techniques in analyzing vegetation variability and change using time series of Landsat images. Remote Sens. Environ 2008, 112, 3916–3934. [Google Scholar]
  6. Martínez, B.; Gilabert, M.A. Vegetation dynamics from NDVI time series analysis using the wavelet transform. Remote Sens. Environ 2009, 113, 1823–1842. [Google Scholar]
  7. Kleynhans, W.; Olivier, J.C.; Wessels, K.J.; van den Bergh, F.; Salmon, B.P.; Steenkamp, K.C. Improving land cover class separation using an extended Kalman filter on MODIS NDVI time-series data. IEEE Geosci. Remote Sens. Lett 2010, 7, 381–385. [Google Scholar]
  8. Kleynhans, W.; Olivier, J.C.; Wessels, K.J.; Salmon, B.P.; van den Bergh, F.; Steenkamp, K. Detecting land cover change using an extended Kalman filter on MODIS NDVI time-series data. IEEE Geosci. Remote Sens. Lett 2011, 8, 507–511. [Google Scholar]
  9. Omuto, C.T. A new approach for using time-series remote-sensing images to detect changes in vegetation cover and composition in drylands: A case study of eastern Kenya. Int. J. Remote Sens 2011, 32, 6025–6045. [Google Scholar]
  10. Pan, Y.; Li, L.; Zhang, J.; Liang, S.; Zhu, X.; Sulla-Menashe, D. Winter wheat area estimation from MODIS-EVI time series data using the Crop Proportion Phenology Index. Remote Sens. Environ 2012, 119, 232–242. [Google Scholar]
  11. Spruce, J.P.; Sader, S.; Ryan, R.E.; Smoot, J.; Kuper, P.; Ross, K.; Prados, D.; Russell, J.; Gasser, G.; McKellip, R.; Hargrove, W. Assessment of MODIS NDVI time series data products for detecting forest defoliation by gypsy moth outbreaks. Remote Sens. Environ 2011, 115, 427–437. [Google Scholar]
  12. Redo, D.J.; Millington, A.C. A hybrid approach to mapping land-use modification and land-cover transition from MODIS time-series data: A case study from the Bolivian seasonal tropics. Remote Sens. Environ 2011, 115, 353–372. [Google Scholar]
  13. Sakamoto, T.; Wardlow, B.D.; Gitelson, A.A.; Verma, S.B.; Suyker, A.E.; Arkebauer, T.J. A two-step filtering approach for detecting maize and soybean phenology with time-series MODIS data. Remote Sens. Environ 2010, 114, 2146–2159. [Google Scholar]
  14. Justice, C.O.; Townshend, J.R.G.; Vermote, E.F.; Masuoka, E.; Wolfe, R.E.; Saleous, N.; Roy, D.P.; Morisette, J.T. An overview of MODIS Land data processing and product status. Remote Sens. Environ 2002, 83, 3–15. [Google Scholar]
  15. Justice, C.O.; Giglio, L.; Korontzi, S.; Owens, J.; Morisette, J.T.; Roy, D.; Descloitres, J.; Alleaume, S.; Petitcolin, F.; Kaufman, Y. The MODIS fire products. Remote Sens. Environ 2002, 83, 244–262. [Google Scholar]
  16. Zhang, W.; Wang, L.; Liu, D.; Song, W.; Ma, Y.; Liu, P.; Chen, D. Towards building a multi-datacenter infrastructure for massive remote sensing image processing. Concurr. Comp. Pract. E. 2012. [Google Scholar] [CrossRef]
  17. Ma, Y.; Wang, L.; Liu, D.; Yuan, T.; Liu, P.; Zhang, W. Distributed data structure templates for data-intensive remote sensing applications. Concurr. Comp. Pract. E. 2012. [Google Scholar] [CrossRef]
  18. Fensholt, R.; Proud, S.R. Evaluation of Earth Observation based global long term vegetation trends—Comparing GIMMS and MODIS global NDVI time series. Remote Sens. Environ 2012, 119, 131–147. [Google Scholar]
  19. Wang, K.; Dickinson, R.E.; Liang, S. Clear sky visibility has decreased over land globally from 1973 to 2007. Science 2009, 323, 1468–1470. [Google Scholar]
  20. Masuoka, E.; Tilmes, C.; Devine, N.; Gang, Y.; Tilmes, M. Evolution of the MODIS Science Data Processing System. In Proceedings of IEEE 2001 International Geoscience and Remote Sensing Symposium (IGARSS’01), Sydney, NSW, Australia, 9–13 July 2001; pp. 1454–1457.
  21. Pakin, S.; Lang, M.; Kerbyson, D.J. The reverse-acceleration model for programming petascale hybrid systems. IBM J. Res. Dev 2009, 53, 721–735. [Google Scholar]
  22. Jette, M.; Grondona, M. SLURM: Simple Linux Utility for Resource Management. In Proceedings of ClusterWorld Conference and Expo, San Jose, CA, USA, 23–26 June 2003; pp. 1–31.
  23. Xiao, Z.; Liang, S. Leaf area index retrieval from MODIS time series data using general regression neural networks. Int. J. Digit. Earth 2013. in review.. [Google Scholar]
  24. Barnes, W.L.; Pagano, T.S.; Salomonson, V.V. Prelaunch characteristics of the Moderate Resolution Imaging Spectroradiometer (MODIS) on EOS-AM1. IEEE Trans. Geosci. Remote Sens 1998, 36, 1088–1100. [Google Scholar]
  25. Chen, J.M.; Black, T.A. Defining leaf area index for non-flat leaves. Plant. Cell Environ 1992, 15, 421–429. [Google Scholar]
  26. Strugnell, N.C.; Lucht, W. An algorithm to infer continental-scale albedo from AVHRR data, land cover class, and field observations of typical BRDFs. J. Clim 2001, 14, 1360–1376. [Google Scholar]
  27. Dickinson, R.E. Land processes in climate models. Remote Sens. Environ 1995, 51, 27–38. [Google Scholar]
  28. Liang, S. Narrowband to broadband conversions of land surface albedo I: Algorithms. Remote Sens. Environ 2001, 76, 213–238. [Google Scholar]
  29. Qu, Y.; Liu, Q.; Liang, S.L.; Wang, L.Z.; Liu, N.F.; Liu, S.H. Direct-estimation algorithm for mapping daily land-surface broadband albedo from MODIS data. IEEE Trans. Geosci. Remote Sens. 2013, in press.. [Google Scholar]
  30. Liu, N.F.; Liu, Q.; Wang, L.Z.; Liang, S.L.; Wen, J.G.; Qu, Y.; Liu, S.H. Mapping spatially-temporally continuous shortwave albedo for global land surface from MODIS data. Hydrol. Earth Syst. Sci. Discuss 2012, 9, 1–22. [Google Scholar]
  31. Pedelty, J.A.; Devadiga, S.; Masuoka, E.J.; Brown, M.E.; Pinzon, J.E.; Tucker, C.J.; Roy, D.; Ju, J.; Vermote, E.F.; Prince, S.; et al. Generating a Long-Term Land Data Record from the AVHRR and MODIS Instruments. In Proceedings of IEEE 2007 International Geoscience and Remote Sensing Symposium (IGARSS 2007), Barcelona, Spain, 23–27 July 2007; pp. 1021–1025.
  32. Liu, Q.; Wang, L.; Qu, Y.; Liu, N.; Liu, S.; Tang, H.; Liang, S. Preliminary Evaluation of the Long-term GLASS albedo product. Int. J. Digit. Earth, 2013; in review. [Google Scholar]
  33. Cheng, J.; Liang, S.; Yao, Y.; Zhang, X. Estimating the optimal broadband emissivity spectral range for calculating surface longwave net radiation. IEEE Geosci. Remote Sens. Lett. 2012. [Google Scholar] [CrossRef]
  34. Ogawa, K.; Schmugge, T. Mapping surface broadband emissivity of the sahara desert using ASTER and MODIS data. Earth Interact 2004, 8, 1–14. [Google Scholar]
  35. Ren, H.; Liang, S.; Yan, G.; Cheng, J. Empirical algorithms to map global broadband emissivities over vegetated surfaces. IEEE Trans. Geosci. Remote Sens 2013, 51, 2619–2631. [Google Scholar]
  36. Cheng, J.; Liang, S. Estimating global land surface broadband thermal-infrared emissivity using advanced very high resolution radiometer optical data. Int. J. Digit. Earth, 2013; in press. [Google Scholar]
  37. Baldridge, A.M.; Hook, S.J.; Grove, C.I.; Rivera, G. The ASTER spectral library version 2.0. Remote Sens. Environ 2009, 113, 711–715. [Google Scholar]
  38. MODIS (Moderate Resolution Imaging Spectrometer) UCSB Emissivity Library. Available online: http://www.icess.ucsb.edu/modis/EMIS/html/em.html/ (accessed on 10 May 2013).
  39. Cheng, J.; Liang, S.; Weng, F.; Wang, J.; Li, X. Comparison of radiative transfer models for simulating snow surface thermal infrared emissivity. IEEE J. Sel. Top. Earth Obs. Remote Sens 2010, 3, 323–336. [Google Scholar]
  40. Pinker, R.T.; Laszlo, I. Modeling surface solar irradiance for satellite applications on a global scale. J. Appl. Meteorol 1992, 31, 194–211. [Google Scholar]
  41. Kim, H.-Y.; Liang, S. Development of a hybrid method for estimating land surface shortwave net radiation from MODIS data. Remote Sens. Environ 2010, 114, 2393–2402. [Google Scholar]
  42. Liang, S.; Zheng, T.; Liu, R.; Fang, H.; Tsay, S.-C.; Running, S. Estimation of incident photosynthetically active radiation from Moderate Resolution Imaging Spectrometer data. J. Geophys. Res 2006, 111, D15208. [Google Scholar]
  43. Li, Z.; Moreau, L.; Cihlar, J. Estimation of photosynthetically active radiation absorbed at the surface. J. Geophys. Res 1997, 102, 29717–29727. [Google Scholar]
  44. Lu, N.; Liu, R.; Liu, J.; Liang, S. An algorithm for estimating downward shortwave radiation from GMS 5 visible imagery and its evaluation over China. J. Geophys. Res 2010, 115, D18102. [Google Scholar]
  45. Zhang, X.; Liang, S.; Wu, H.; Zhou, G. Mapping global incident downward shortwave radiation and photosynthetically active radiation over land surfaces using multiple satellite data. J. Geophys. Res. 2013; in review. [Google Scholar]
  46. Distribution of Global Land Surface Remote Sensing Products Facilitating Application on Global Change Research. Available online: http://glass-product.bnu.edu.cn/en/ (accessed on 10 May 2013).
Figure 1. GLASS product generation system network structure.
Remotesensing 05 02436f1
Figure 2. Scheduling map of high-performance parallel computing.
Remotesensing 05 02436f2
Figure 3. Raw AVHRR image for Julian day 200 in 2003.
Remotesensing 05 02436f3
Figure 4. Preprocessed AVHRR image for Julian day 200 in 2003.
Remotesensing 05 02436f4
Figure 5. GLASS LAI map for Julian day 209 in 2008.
Remotesensing 05 02436f5
Figure 6. GLASS albedo map for Julian day 209 in 2008.
Remotesensing 05 02436f6
Figure 7. GLASS BBE map for Julian day 161 in 2008.
Remotesensing 05 02436f7
Figure 8. The global DSR products were retrieved using data from multiple polar-orbiting and geostationary satellites on 12 November 2008. (a) GMT 00:00; (b) GMT 06:00; (c) GMT 12:00; (d) GMT 18:00.
Remotesensing 05 02436f8
Table 1. GLASS system performance measurements.
Total Products in 2008Nonparallel (h)Parallel (h)
LAI14.44
Albedo19250
DSR85.111
BBE82

