Article

Land Use/Land Cover Change Analysis Using Object-Based Classification Approach in Munessa-Shashemene Landscape of the Ethiopian Highlands

1
Institute of Forest Management, Department of Ecology and Ecosystem Management, Center of Life and Food Sciences Weihenstephan, Technische Universität München, Hans-Carl-von-Carlowitz-Platz 2, D-85354 Freising, Germany
2
Department of Crop Science and Production, Botswana College of Agriculture, Private Bag 0027, Gaborone, Botswana
*
Author to whom correspondence should be addressed.
Remote Sens. 2013, 5(5), 2411-2435; https://doi.org/10.3390/rs5052411
Submission received: 22 March 2013 / Revised: 30 April 2013 / Accepted: 7 May 2013 / Published: 15 May 2013

Abstract

:
The objective of this study was to analyze land use/land cover (LULC) changes in the landscape of Munessa-Shashemene area of the Ethiopian highlands over a period of 39 years (1973–2012). Satellite images of Landsat MSS (1973), TM (1986), ETM+ (2000), and RapidEye (2012) were used. All images were classified using object-based image classification technique. Accuracy assessments were conducted for each reference year. Change analysis was carried out using post classification comparison in GIS. Nine LULCs were successfully captured with overall accuracies ranging from 85.7% to 93.2% and Kappa statistic of 0.822 to 0.924. The classification result revealed that grasslands (42.3%), natural forests (21%), and woodlands (11.4%) were dominant LULC types in 1973. In 2012, croplands (48.5%) were the major LULC types followed by others. The change result shows that a rapid reduction in woodland cover of 81.8%, 52.3%, and 36.1% occurred between the first (1973–1986), second (1986–2000), and third (2000–2012) study periods, respectively. Similarly, natural forests cover decreased by 26.1% during the first, 21.1% during the second, and 24.4% during the third periods. Grasslands also declined by 11.9, 17.5, and 21.1% during the three periods, respectively. On the contrary, croplands increased in all three periods by 131, 31.5, and 22.7%, respectively. Analysis of the 39-year change matrix revealed that about 60% of the land showed changes in LULC. Changes were also common along the slope gradient and agro-ecological zones with varying proportions. Further study is suggested to investigate detailed drivers and consequences of changes.

1. Introduction

Land use/land cover (LULC) changes influence climate and weather conditions from local to global scales [1]. They can have such impacts by affecting the composition of the atmosphere and the exchange of energy between continents and the atmosphere, which can lead to global warming [2]. Changes in LULC can also affect biological diversity, contribute to forest fragmentation, lead to soil erosion, alter ecosystem services, disrupt socio-cultural practices, and increase natural disasters, such as flooding [3,4]. This calls for global attention for continuous monitoring of the changes. Up-to-date datasets on LULC change provide critical inputs to evaluate complex causes and responses in order to project future trends better, ranging from local, regional, to global scales [5,6]. They are also prerequisites for making development plans [7,8]. However, the magnitude of LULC change differs with the time period being examined [9], geographical location [10], slope gradient, and elevation range [11,12].
With an area of 1,130,000 km2, and as one of the most populous countries in Africa, Ethiopia is experiencing huge LULC dynamics from natural vegetation to farming practices and human settlement [13,14]. The problem of land cover dynamics is more severe in the highlands, which account nearly 44% of the country’s landmass and have been cultivated for millennia [15,16]. Like other parts of the world, the use and management of natural resources, and returning the vast degraded landscapes to protective and/or productive systems, have substantial importance to attain the goal of sustainable development in Ethiopia [17]. This, in turn, requires an understanding of the dynamics in time and space of these resources. In this regard, the importance of spatial data monitoring and evaluation for proper management of natural resources is critical. Some studies have been conducted to estimate and monitor LULC changes in different parts of the Ethiopian highlands [1826]. These reports have shown heterogeneity in direction, pattern, type, and/or magnitude of LULC changes in the country. For instance, Zeleke and Hurni [21] reported a sharp decrease of forest cover while Bewket [22] found the opposite, i.e., an increasing trend. In terms of magnitude for changes, Zeleke and Hurni [21] reported an increase in cultivated lands by 38% in 38 years (1957–1995). On the other hand, Tegene [23] reported an increase in croplands only by 5.5% in 43 years (1957–2000). Consequently, making generalizations of results to other areas of the same physical setting might lead to erroneous conclusions. In addition, except the reports by Zeleke and Hurni [21] and Tegene [23] about changes in relation to slope gradient, no studies have been conducted in comprehensive approach to systematically analyze changes within the study area along slope gradient and agro-ecological zone, which is usually divided based on elevation range [27]. Therefore, it can be concluded that, until now, few studies have undertaken an integrated analyses on LULC change in the Ethiopian Highlands.
Results of various studies have demonstrated the need for a study focusing on location specific LULC dynamics for sustainable management and decision-making processes related to the use and conservation of natural resources [22,26,28,29]. Two ways of capturing LULC dynamics are available: conventional ground- and remote sensing-based methods. The ground method is labor intensive, time consuming, and difficult for capturing data from inaccessible areas with ragged topographies like the case of most Ethiopian landscape. On the contrary, remote sensing is considered the most efficient technology to handle these problems since it can explicitly reveal spatial patterns of land cover change over a large geographic area in a regular and consistent way [30,31]. Remote sensing data of the earth’s surface could be made readily available in digital format [32]. These advantages have attracted great interest in the scientific community. Moreover, the rich archive and spectral resolution of satellite images are the most important reasons for their use [30,33]. Thus, change detection has become a major application of remotely-sensed data because of repetitive coverage at short time intervals, which is useful for tracking changes in LULC over longer periods of time and at more varied temporal scales than what is typically done with field experiments or ground inventory [9,34]. Various techniques are available to extract meaningful information of LULCs from remotely captured datasets.
Recently, object-based image analysis has been applied more frequently for remote sensing image classification than pixel-based analysis [35,36]. Pixel-based methods classify individual pixels mainly using spectral patterns. The use of spatial or contextual information from neighborhood pixels remains a critical drawback to pixel-based image processing [37]. On the other hand, object-based methods allow integration of different object features, such as spectral values, shape, and texture [3840]. One of its strength is the ability to combine spectral information and spatial information for extracting target objects [36,38].
However, accuracies of object-based approach differ depending on the nature of landscape and type of images used for analysis [41]. The benefit of improving accuracies of image classifications using object-based approach is not tested up to now in the Ethiopian landscape during LULC change studies. Studies conducted so far in the country were pixel-based and their overall accuracies from recent reports were not more than 88% [25,26]. On the other hand, apart from the need for location specific LULC change study justified above in a landscape with diverse features like the Ethiopian highlands, the necessity for improved classification accuracies for LULC change studies in the country have been discussed by many researchers [23,25,26,42,43]. Thus, in this study, we classified the land use/land cover with the highest possible accuracy and evaluated changes over a period of 39 years (1973–2012) in a landscape of Munessa-Shashemene area, one of the typical highlands in Ethiopia. We also explored distribution and changes in LULC along the slope gradient and Agro-ecological zones of the study landscape.

2. Materials and Methods
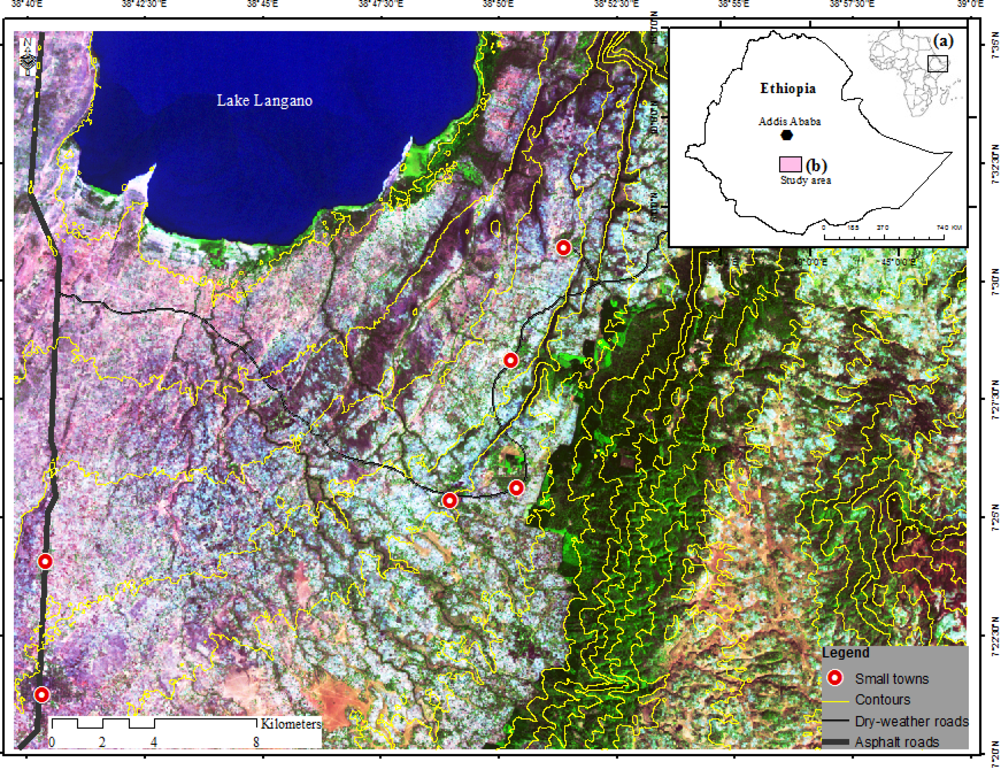
2.1. Study Area

The study was conducted in the landscape of Munessa-Shashemene area, which is a typical highland found in Munessa and Arsi-Negele Districts. The area lies within 7°20′01.23″ and 7°35′13.3″N, and 38°39′43.3″ and 38°59′57.31″E at about 200 km south of Addis Ababa (Figure 1). It covers about 1,091 km2 and lies between the altitudes of 1,500 m above sea level at the Central Rift Valley lakes and over 3,400 m at the Arsi-Bale massif. The rainfall has bimodal distribution. The short and main rainy seasons occur from March–May and July–September, respectively. Meteorological station records show that annual rainfall is about 1,200 mm at Degaga town (2,000 m), which is found in the study area. Mean annual temperature is 15 °C. The soils of the area are rich in clay and classified as Mazic Vertisol in the lower altitude (1,500 m) and Humic Umbrisol at about 3,000 m [44]. It is a diverse landscape with both flat and sloped areas. Crop cultivation is common in all altitudinal ranges with various proportions. Apart from croplands, the study landscape comprises mosaics of LULC types, mainly natural forests, plantation forests, woodlands, settlements and water bodies. The natural forest in the area belongs to a tropical dry Afromontane forest [45]. The plantation forests are composed of exotic species, mainly Cupresses lusitanica Miller, Pinus patula Schlechtendal & Chamisso and Eucalyptus spp. Woodlands are dominated by Acacia spp and found in the lower part of the study landscape.

2.2. Data Used

Datasets from various sources were used in this study (Table 1). Landsat and RapidEye imagery were the main data for classification and change analysis. The Landsat imagery data include Landsat MSS, Landsat Thematic Mapper (TM), and Enhanced Thematic Mapper (ETM+) scenes of the year 1973, 1986 and 2000, respectively. These datasets were acquired from the National Aeronautics and Space Administration (NASA) through their EOS Data Gateway Database. The RapidEye imagery data were used for the study year 2012. The images were obtained from RapidEye Science Archive (RESA) supported by German Aerospace Center (DLR). They were ortho-rectified level 3A and geometrically corrected. Both Landsat and RapidEye imageries were acquired in the same season. Images of the same season were selected to reduce the effect of seasonal discrepancies on the classification result [46].
A 30 m Digital Elevation Model (DEM), based on Aster imagery, was also employed in order to study the relationship between LULC types with that of the slope gradient and agro-ecological zones of the study landscape. In addition, ancillary data were also utilized during analysis, including topographic maps, field data, thematic layers (roads and towns), Kebele and Wereda boundaries. All data were projected to the Universal Transverse Mercator (UTM) projection system zone 37N and datum of World Geodetic System 84 (WGS84), ensuring consistency between datasets during analysis. The pre-processing was made using ArcGIS 10 software. Fieldwork was conducted between November 2011 and January 2012 using draft classified maps derived from satellite images with reference years, aerial photos and topographic maps as guides. GPS coordinates of target LULC types were collected, and information regarding each site was noted. Thematic layers of towns were used to facilitate the classification process. Roads with other datasets were utilized for the study site map preparation.

2.3. Methodology

2.3.1. Image Segmentation

Object-based image analysis requires the creation of objects or separated regions in an image. One established way to do so is image segmentation. Depending on its application, different approaches exist for image segmentation ranging from very simple to highly sophisticated algorithm [40]. We used the sophisticated segmentation algorithm, known as multi-resolution segmentation (MS), which is based on the Fractal Net Evolution Approach (FNEA) [38] and available in eCognition Developer 8.0 software. The MS algorithm is bottom-up region merging technique starting with a single image object of one pixel and repeatedly merges them in several loops in pairs to larger units. The MS algorithm is also an optimization procedure that minimizes the average heterogeneity for a given number of objects and maximizes their homogeneity based on defined parameters. These parameters, namely scale (Sc), shape (Sh), and compactness (Cm), are defined through trial and error to successfully segment objects in an image [40,4749]. We used scale parameters ranging from 8 to 500 with three different levels depending on the type of images used for the analysis (Table 2). The images were segmented in to three levels to facilitate the object-based classification depending on the nature of LULC classes to be detected. For instance, level 1 was to handle those big size classes like water bodies, whereas level 3 was for small size classes like tree patches. Segmentation outputs were visually checked in relation to target class (e.g., forest area or cropland) to evaluate which parameter combinations best captured the objects of interest.

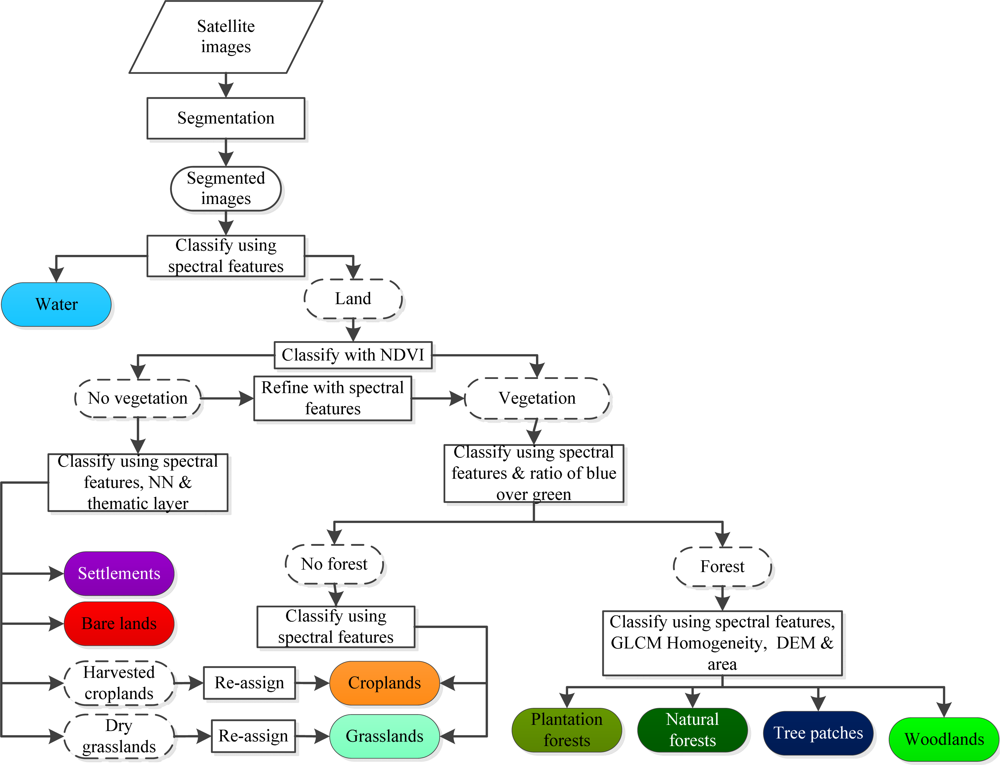
2.3.2. Object-Based Classification

We used various sources, including field survey, ancillary data and existing Afri-cover classification approaches to set and implement our object-based classification schemes. Nine LULC classes were considered for this purpose (Table 3). Considering the power of object-based methods, an attempt has been made to separate forest types, e.g., natural forests and woodlands, in our classification schemes. This is owing to their differences in providing services and goods, and the underlying pressures towards the resources. Classifying them separately can also facilitate conservation, utilization, and management approaches.
Using identified target LULC classes, object-based classification was applied to a segmented image in order to assign a class to each of the segments. Object-based image analysis attempts to assign objects that are generated through image segmentations into a specific class of interest. We used eCognition to perform an object-based image classification [40]. There are two approaches in eCognition to assign classes to segmented objects, which are fuzzy membership functions and the nearest neighbor (NN) classifier. The membership function classifier uses the user’s expert knowledge to define rules and constraints in the membership function to control the classification procedure. The membership function describes intervals of object features that determine whether the objects belong to a particular class or not. An object feature can be the spectral value, texture, size, shape, and context of that image object to surrounding image objects. On the other hand, NN classifier uses a defined feature space, e.g., using original bands or customized bands, and a set of samples that represent different classes in order to assign class values to segmented objects. The procedure consists of teaching the system by giving certain image objects as samples and classifying image objects in the image object domain based on their nearest sample neighbors. Employing NN classifier is advantageous when using spectrally similar classes that are not well separated using a few features or just one feature [40]. Whenever applicable, we used both approaches during the classification process.
A hierarchical scheme of three levels was implemented during object-based classification using eCognition 8.0 software. The classification was applied using a “top-down” approach. That is, the classification started from very general classes (level 1), which were further subdivided into more specific classes (level 2 and 3). We first broadly classified the whole study landscape into water and land classes by using the spectral features from the mean value of objects in near infrared band. The second and third levels were used to extract the remaining target LULC types from the class land (Figure 2).
The classification of target classes was achieved by using mainly thresholds of mean and/or standard deviation of spectral features (original bands of blue, green, red, red edge, and near infrared), customized bands (ratio of blue over green), thematic layers, DEM values, texture value of grey-level co-occurrence matrix (GLCM) homogeneity, and normalized difference vegetation index (NDVI). The NDVI was calculated using the following equation:
NDVI = NIR RED NIR + RED
where NIR and RED are reflectance in the near infrared and the red bands, respectively. The NDVI values have been typically used to map spatial distributions of vegetation [50].
In this study, NDVI values were also used to further classify the class land into vegetation and no-vegetation classes. As the images were taken during the dry season, some dried vegetation with low NDVI was classified as no-vegetation class. We used our expert knowledge and developed a rule set using red and red edge mean values to refine such classes from no-vegetation to vegetation classes. The vegetation class was again subdivided into forest and no-forest classes. The mean value of objects in red band and a value from blue over green ratio were used to differentiate these two categories, e.g., higher values are forests where as lower values are no-forest classes. The forest class was again classified to achieve the final target LULC types, namely plantation forests, tree patches, natural forests, and woodlands. The standard deviation value of objects in red band, texture value of GLCM homogeneity, DEM, and size (area) of the class objects were utilized to separate these four classes. The DEM was particularly used to separate woodlands from natural forests. Woodlands are usually found below 1,900 m [51]. Plantation forests have fine texture than natural forests. As a result, the texture values of GLCM homogeneity with other values were used to differentiate these two classes. On the other hand, the mean value of NIR was utilized to separate grasslands and croplands from the class no-forest. Based on the training samples, the NN classifier was also employed to further classify the no-vegetation class into settlements, bare lands, harvested croplands, and dry grasslands. Again, associated to the dry season images acquisition, there were areas that were signed as bare lands although they were dry grasslands and harvested croplands. To avoid such confusion, the two classes (harvested croplands and dry grasslands) were temporally created under no-vegetation class. Mean values of blue, red, and NIR bands were used to define the feature space during the classification process using NN classifier. Additionally, mean value of red and blue bands and other features, such as thematic layer of towns in the study landscape, were also used to define rules and constraints in the membership function to refine the classification process of these particular classes. At the end, the harvested croplands and dry grasslands were re-assigned to the class croplands and grasslands, respectively, using the ‘assign class’ function available in eCognition Developer 8.0 software.

2.3.3. Accuracy Assessment

A classification is not complete until its accuracy is assessed [30]. Accuracy assessment determines the quality of the map extracted from remotely sensed data [52,53]. An error matrix or confusion matrix is a common practice employed for assessment of classification accuracy. The matrix compares information obtained by reference sites to that provided by classified image for a number of sample areas. Accordingly, overall accuracy, producer’s and user’s accuracies, and Kappa statistic were calculated from the error matrix [53].
The accuracy assessments were performed for classified images of 1973, 1986, 2000, and 2012. A minimum of about 40 random points were generated per class using stratified random sampling approach for efficient accuracy assessment [53]. The corresponding reference class for each LULC type was collected from different data sources, including data from field visits, historical black and white aerial photos, topographic maps, and raw images. Raw images were used for those visually visible classes, e.g., forests and water bodies [53]. Historical black and white aerial photos (1973 and 1986) were utilized to collect reference samples for the 1973 and 1986 classified images while field visits data were mainly used for the 2012 classified image. Reference points for the 2000 classified image were collected through visual interpretation of the raw Landsat TM 2000 image. This was supplemented by field visits and discussion with elders in the study landscape that made it possible to establish reference points of confusing classes, e.g., croplands and grasslands.

2.3.4. Land Use/Land Cover Change Analysis

Change analysis was conducted using post-classification image comparison technique [54]. Post-classification change analysis was selected in order to minimize possible effects of atmospheric variations and sensor differences (Lu et al. [46]). Classification with high accuracy is a prerequisite for effective change detection using post-classification technique [55]. Images of different reference years were first independently classified. Classified images with highest accuracy were used in the change detection process.
The classified images were compared in three periods, i.e., 1973–1986, 1986–2000, and 2000–2012. Change statistics were computed by comparing image values of one data set with the corresponding value of the second data set in each period. This results in a summary table of the overall changes per class. The values were presented in terms of hectares and percentages. The percentage LULC changes were calculated using the following equation:
Percentage LULC change = ( Area final year Area initial year Area initial year ) × 100
where Area is extent of each LULC type. Positive values suggest an increase whereas negative values imply a decrease in extent. LULC conversion matrix between 1973 and 2012 was generated using ArcGIS 10 software and compiled in a matrix table, and the values were presented in terms of hectares.
Slope gradients and agro-ecological zones (AEZs) are conditional factors for LULC distributions and changes [27,56]. The slope gradient was calculated from Aster DEM in ArcGIS environment. It was reclassified into four slope categories, i.e., gentle slopes (0%–5%), moderate slopes (5%–15%), steep slopes (15%–30%), and very steep slopes (>30%) [57]. AEZs of the study landscape were developed using elevation range of Aster DEM, based on categories of Ministry of Agriculture (MOA, [58]) and Hurni [27]. The categories include sub-humid highlands (locally known as “Weyna Dega”) from 1,500 to 2,300 m, humid highlands (“Dega”) from 2,300 to 3,200 m and cold highlands “Wurch”) above 3,200 m. By overlaying the classified maps of each reference year (1973, 1986, 2000, and 2012) on to the slope and AEZ map, thematic information showing relationship between LULC distribution and changes in each category was extracted in ArcGIS.

3. Results and Discussion

3.1. Results

3.1.1. Classification Accuracy

The overall accuracies for the four reference years ranged from 85.7% to 93.2% with the Kappa statistic ranging from 0.822 to 0.924 (Table 4). The Kappa results show a high level of agreement for each of the four classified images. User’s and producer’s accuracies of individual classes of the four classified maps ranged from 72.1% (bare lands in 1973) to 100% (water in 2012), and 75.7% (grassland in 1973) to 100% (water in 2012), respectively. Our producer and user accuracies of the Landsat MSS classified image of 1973 for bare lands, croplands, grasslands, and settlements (user’s accuracy) were below 85%. There were samples, which were identified as bare lands that actually belonged to croplands, grasslands, and settlements (Table 4(a)). On the other hand, the natural forests, tree patches, woodlands, and water classes achieved producer and user accuracies of above 90%. Confusions in these classes were low. For instance, in the second column of Table 4(a), out of the total 61 randomly generated reference samples for natural forests, 59 were correctly classified as natural forests, while only one sample was excluded or misclassified as cropland and the other one sample as tree patch. Similarly, in the second row of Table 4(a), three samples of grasslands and two samples of tree patches were included or misclassified as natural forests. The individual accuracies of these classes were more than 93% except for tree patches (producer’s accuracy in 1986) for classified images of both 1986 and 2000. Again, the individual accuracies of these categories reached above 96% for 2012 classified image (Table 4(d)).

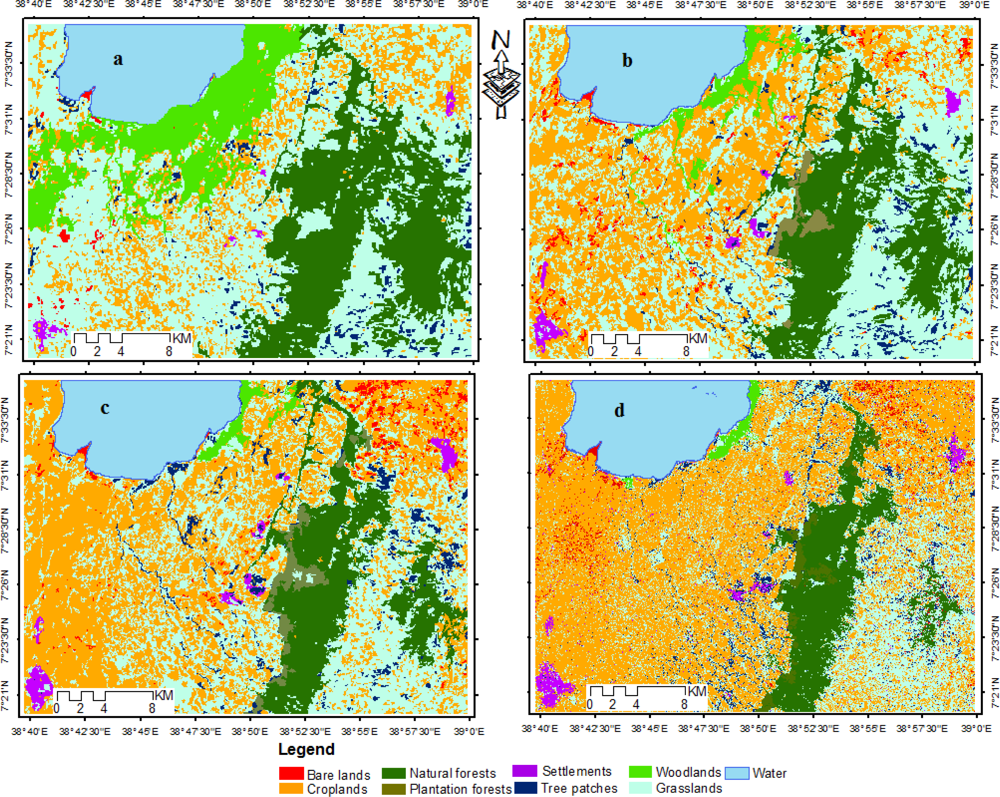
3.1.2. States of Land Use/Land Cover (LULC)

A total of nine LULC types were extracted in the study landscape with different reference years, i.e., 1973, 1986, 2000, and 2012 (Figure 3). At the beginning of the study period (1973) grasslands were the dominant LULC type, making up 42.3% of the study landscape followed by natural forests (21%), croplands (13%), woodlands (11.4%), and water (9.6%) (Table 5). Tree patches, settlements and bare lands shared small proportion of 1.9%, 0.4%, and 0.3%, respectively, of the entire landscape. In 1986, grasslands were also accounted for the largest part (37.2%) and croplands, natural forests, and water accounted 30%, 15.5% and 9.6%, respectively, of the study landscape. Woodlands, settlements, tree patches, and bare lands occupied the smallest portion of the area. In addition, plantation forests (1%) appeared during this particular reference year. In 2000, the overall situation was changed. Croplands occupied the largest portion (39.5%) of the study landscape, followed by grasslands (30.7%), natural forests (12.2%), and water (9.5%). The remaining portions were occupied by plantation forests, bare lands, settlements, and woodlands. Croplands continued to be the dominant LULC (48.5%) in 2012. Grasslands and natural forests were the second and third dominant LULC types covering 24.2% and 9.2%, respectively, of the study area. Others occupied the smallest portion of the area.

3.1.3. Land Use/Land Cover (LULC) Changes

The change results revealed a considerable reduction of woodlands, natural forests and grasslands over the first (1973–1986), second (1986–2000), and third (2000–2012) study periods. The total woodlands converted between the first study period amounts to 9,692 ha, which is about 82% of the cover that existed in 1973. The woodlands were further cleared by about 52% and 36% of the cover that existed in 1986 and 2000 during the second and third periods, respectively. Similarly, natural forests cover decreased by 26.1% during the first, 21.1% during the second, and 24.4% in the third periods. Grasslands also declined by 11.9%, 17.5% and 21.1% during the first, second, and third periods, respectively. On the contrary, croplands increased in all three periods by 131%, 31.5%, and 22.7% during the first, second and third periods. Similarly, bare lands increased by 326.2%, 9.3% and 10.5% in the three periods, respectively. Water showed a slight reduction during the whole study period (Table 6).
The change matrix analysis show that as a whole, about 61,848 ha (60%) of the land within the study landscape experienced LULC changes in one or another way in the 39 years (1973–2012) study period (Table 7). The level of changes differed among the LULC types. For instance, out of 11,832.4 ha woodlands in 1973, only 650.6 ha (5.4%) remained unchanged during the study period, implying that about 95% of the woodlands were converted to other LULCs. Of the 95% converted woodland areas, 66.2% were converted for crop production. During the same period, out of 21,723.3 ha in 1973, 8,922 ha (about 41%) remained unchanged. The remaining 59% of the 1973 natural forests were converted to other LULC types. For instance, of 1,280.4 ha total cover of planation forests in 2012, about 946 ha (73.9%) was converted from the area, which used to be part of the natural forests in 1973. The original extent of grasslands (about 43,809 ha) was reduced by 74.2% due to changes to other LULCs during the period analyzed, which includes about 63.6% that was converted to croplands.
Furthermore, about 939 ha (46.5%) of the land, which used to be covered by tree patches was also converted into croplands during the same period. Major opposite trends of LULC changes were found from the change matrix analysis for croplands and settlements. Croplands replaced about 36,708 ha the land that used to be covered by other LULC types. The major conversions were from natural forests (about 3,193 ha), grasslands (about 27,875 ha), and woodlands (about 7,828 ha). As a result, croplands gained an increase of 272% during the period analyzed. There were also conversions to settlements from other LULC classes, but the one from grasslands was the highest (Table 7). About 805 ha of the land used for settlements were grasslands during the initial period of the study. Consequently, the area of settlements has also shown 260% increase from its original size in 1973.

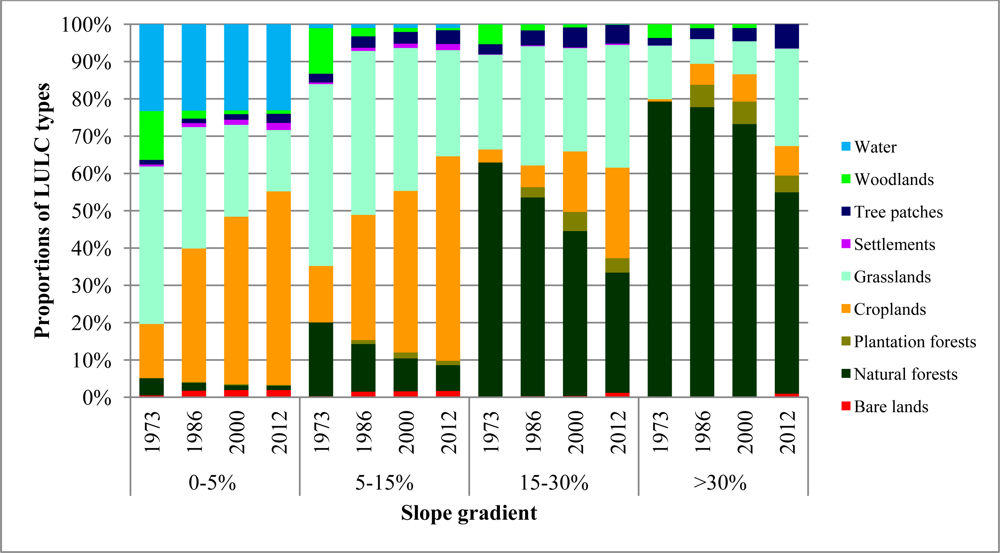
3.1.4. Land Use/Land Cover (LULC) Distributions and Changes along Slopes

Distribution and changes of LULC were remarkably different along the slope gradient (Figure 4). Almost all of the LULC types were found in the four slope gradients of the study landscape with different proportions. Croplands, grasslands and water were dominant LULC types in the gentle slope part. On moderate slopes, croplands, grasslands, and the natural forests were found as the dominant covers. However, the natural forest and grasslands dominated the steep and very steep slope parts of the study landscape. Other LULC types were restricted to certain slope gradients. For instance, water, settlements, and bare lands were mainly found in the gentle and moderate slope gradients. Plantation forests were limited to moderate and very steep slope parts of the study landscape.
Similar to distribution of LULC, percentages of changes were different along the slope gradient. The most significant overall trend was the shift of LULC proportions from gentle slopes (0%–5%) to very steep slopes (>30%). On steep slopes, the natural forest declined by half from about 63% in 1973 to 32% in 2012. On very steep slopes, it declined from about 79% to 54%. Woodlands also declined from about 13% to 1% on gentle slopes, 12% to 0.6% on moderate slopes, and 5% to 0.1% on steep slopes during the same study period. The area of grasslands also showed a decline from about 42% to 17% on gentle slopes, from 49% to 29% on moderate slopes and an increase from 25% to 33% on steep slopes as well as from 14% to 26% on very steep slopes. On the contrary, the area covered by croplands increased continuously from 15% to 52%, 16% to 55%, 4% to 24%, 0.6% to 8% on gentle, moderate, steep, and very steep slopes, respectively. The area covered by settlements also exhibited a triple increase on both gentle and moderate slopes of the study landscape during the same study period.

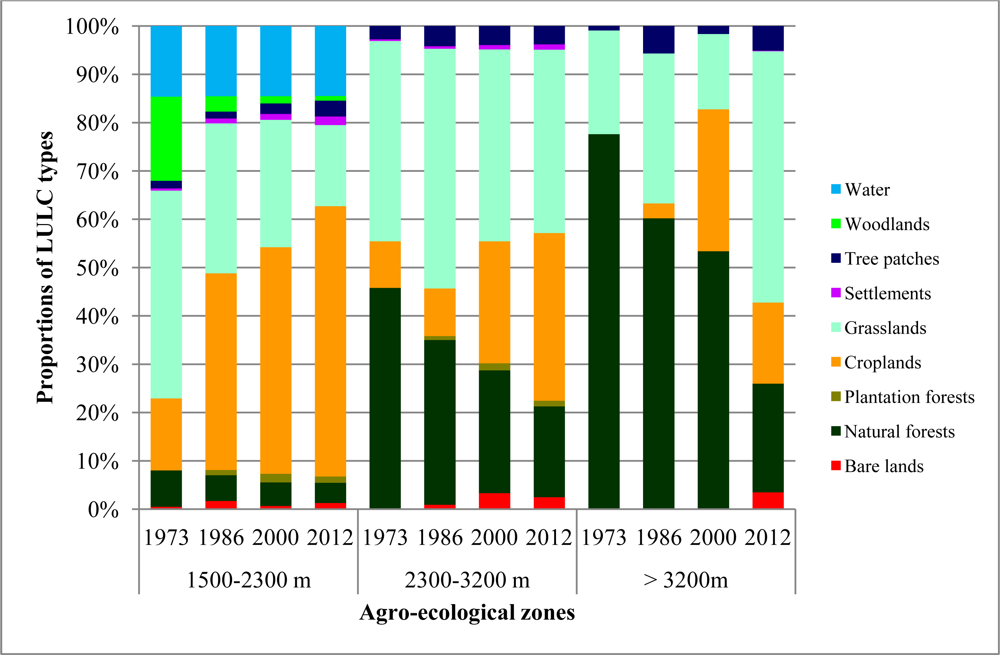
3.1.5. Land Use/Land Cover (LULC) Distributions and Changes along Agro-ecological Zones

There was a distinct relationship between land use and agro ecological zones during the study period (Figure 5). In the sub-humid highland zone (locally known as “Weyna Dega”, 1,500–2,300 m), diverse LULC types were observed. All the classes of LULC types were found in this zone. Grasslands (43%), woodlands (17%), water (15%), and natural forests (8%) were the dominant LULC types at the beginning of the study period. In 2012, the dominant LULC types were croplands (56%), grasslands (17%), water (15%), and the natural forests (4%). Woodlands occupied only 1% in 2012. The numbers of LULC types were reduced in the humid highland zone (“Dega”, 2,500–3,200 m). In this zone, the dominant LULC types were grasslands (42%), natural forests (46%), and croplands (10%) at the beginning of the study period. However, in 2012, the dominant LULC types were croplands (35%), grasslands (38%), and natural forests (19%). In the cold highland zone (“Wurch”, >3,200 m), the natural forests (78%), grasslands (22%), and tree patches (1%) were major LULC types in 1973, and grasslands (52%), natural forests (23%), croplands (17%), and tree patches (5%) were the major LULC types in 2012.
The changes observed over the study period also differed notably along the agro-ecological zone associated with the elevation range in the study landscape. In the sub-humid highland zone, grassland showed the highest conversion from about 43% in 1973 to 17% in 2012 followed by woodlands from 17% to 1%, and natural forests from about 8% to 4%. The area covered by croplands increased from 15% to 56% during the same study period. The remaining LULC types also showed increase of cover with different magnitudes. In the humid highland zone, high conversion was observed in the natural forests followed by grasslands from about 46% to 19%, and 42% to 38%, respectively. The area of croplands was increased from 10% to 35% in this zone. In the cold highland zone, the area covered by the natural forest declined from about 78% to 23% while those of grasslands and croplands increased from about 21% to 52%, and from zero to 17%, respectively. An increase of area coverage from zero to 4% and 0.3% was also found in bare lands and settlements, respectively, in this particular zone.

3.2. Discussion

Remote sensing data, by employing object-based image analysis, was used to provide useful information to describe LULC dynamics in the highlands of Ethiopia, particularly focusing on the Munessa-Shashemene landscape. Spatial distribution and changes of LULC over time were extracted. The overall accuracies obtained in this study were more than 91% except for Landsat MSS 1973. There were confusions among LULC types during classification of this particular image. Such confusions were associated with the lower spatial resolution and few bands available in Landsat MSS image [30,42]. However, our overall accuracies obtained from all types of images were higher than the 85% minimum threshold, set by Anderson et al. [59] and Thomlinson et al. [60] for effective LULC change analysis. Such overall classification accuracies, above the minimum threshold from the low-resolution image, were achieved by using the advantage of applying object-based classification techniques. We were able to utilize spatial relations, object features, and shapes during classification [38,40]. The overall accuracy of our object-based approach was better than other local studies with similar geographical settings, LULC types and satellite imageries. For instance, Dessie and Kleman [42] achieved 87% accuracy using Landsat TM, Wondie et al. [26] reported 88% accuracy using Landsat ETM+, and Shiferaw [25] achieved 86.1% using Landsat ETM+. We found above 91% over all accuracies using the same satellite imageries.
The quantitative results of change analysis of 39 years with three time periods (1973–1986, 1986–2000 and 2000–2012) and a change matrix from 1973 to 2012 revealed the extent of changes that occurred in different LULC classes throughout the four decades. In general, the area of natural forests, woodlands, grasslands and water bodies consistently decreased with varied proportions over the study periods. The reductions of these LULC types were mainly attributed to the conversion of the areas to croplands. The conversion of grasslands, natural forests, and woodlands to croplands was quite intense and common in the study landscape. Findings from elsewhere also showed that such changes are common in other areas with similar settings. For instance, after studying the LULC dynamics in the Dembecha area of northwestern Ethiopia, Zeleke and Hurni [21] stated that 99% of the forest cover in a 271 km2 area was converted to agricultural land between 1957 and 1995. Dessie and Kleman [42] also reported conversion of more than 82% of high forests in the south-central Rift Valley of Ethiopia in about 28 years (1972–2000). A recent study on the land use and land cover dynamics in South Wollo highlands of Ethiopia [25] also revealed dramatic expansion of agricultural land and reduction of forestland, between 1972 and 2003. Knoke et al. [61] argued a similar increasing trend of agricultural production in order to fulfill growing food demand. Another study on land use change from 1984 to 2002 in southern Burkina Faso also revealed expansion of croplands at the expense of forest resource conversions [62]. Other local LULC studies [20,23] also indicated a similar trend. Contrary to these and our findings, increase of forest cover was observed by Bewket [22] in Chemoga watershed within the Blue Nile, which was attributed to community afforestation programs.
Our change analysis also revealed that planation forests were created at the expense of the remaining natural forest, which belongs to tropical dry Afromontane forests [45]. Cyranoski [63] reported similar conversion of natural forests to planation forests in Indonesia. Such conversion is detrimental to biodiversity conservation, unless deforestation is unavoidable and plantation forestry is a “lesser evil” [64]. An evolution of tree patches across the landscape is also linked to extensive forest fragmentation. Changes were not limited to the forest resources, but also to the grasslands and water body of the study landscape. Similar trend was also reported by Assen [65] in the East Hararghe Ethiopian Highlands.
Changes in relation to gradients of slopes show expansion of croplands from gentle and moderate slopes to steep and very steep slopes. A similar trend was also observed by Zeleke and Hurni [21] in which cultivation expanded to marginal areas as steep as >30% slope. Change analysis across agro-ecological zones also revealed that croplands largely occupied the sub-humid highland zone of the study landscape, which is the best zone for growing diverse agricultural crops [21,27]. LULC changes from natural forest to croplands in cold-highland zone were not as severe as in the sub-humid highlands since the landscape has harsh environment for diverse crop production similar to the lower agro-ecological zone [27]. Although such environment receives less pressure on the natural forest for crop production, an increase of grasslands cover was observed, which might be linked to conversion in search of additional land for grazing [66].
The continuing LULC changes in the Munessa-Shashemene landscape have different implications. As shown in the result, expansions of croplands have been met at the expense of woodlands, natural forests, and grasslands. Such kind of drastic change in land-cover can negatively alter the potential use of an area and may ultimately lead to loss of productivity [23]. Previous assessment on soil chemical and physical properties following clearing of a tropical dry Afromontane natural forest and subsequent cultivation by small holder farmers in our study landscape revealed the overall declining trends of almost all soil quality attributes in the long perspective [67]. This could, in turn, affect the local people, e.g., the 363,241 rural inhabitants [14], by reducing the means of livelihood of those who depend on land. Other implication associated with the increasing loss of the forest resource is the decline of biodiversity. According to Tesfaye et al. [68] the remaining dry Afromontane forests of the study landscape are dominated by indigenous trees species among which some require high conservation priority. The same authors suggested in situ conservation efforts for those priority species including strict protection of the remaining mother trees. The ongoing forest conversion in our study area could indirectly contribute to the loss of those high conservation priority species. A substantial loss in grassland cover in our study landscape might also lead the local people to put additional pressure on the remaining forest area for grazing their animals that have influential factor in hindering natural regeneration [6870]. Furthermore, the ongoing pressure supports expectations of Ciais et al. [71] who predicted that the African forest carbon stocks would remain vulnerable. Such dynamics could change the carbon stocks and release substantial amount of carbon from the forest to the atmosphere [2].
Land cover is also one of the governing factors that determine the rate of soil loss due to erosion [22,72]. Changes in LULC could affect soil health (soil quality) or soil intactness (the ability of soils to stay in place) and increase the risk of erosion and flooding [25]. In our study landscape, Fritzsche et al. [44] observed the influence of erosion with minor effects under natural vegetation. Considering the LULC status of the present study area, croplands, settlements, and bare lands could be more vulnerable to soil erosion. Furthermore, the shifting of the LULC types in steep and very steep slope could worsen the situation. There is also a direct interaction between LULC changes and the hydrological process as well as the water ecology and quality of a given area [65,7375]. Lake Alemaya, located in the lower plateau of the East Hararghe Ethiopian highland, had disappeared due to siltation as well as sediment accumulation, which is a result of deforestation [65,76]. Although not drastically altered, the water body (Lake Langano), located in the lower part of our study landscape, was consistently declining throughout the study time period. Unless appropriate measures are taken urgently, the tragic loss similar to Lake Alemaya could happen.
Topographic conditions (slope gradient and AEZs) also provide both opportunities and constraints for any use of land as found in our study landscape. A steep slope will cause more runoff and will enhance the soil erosion in the absence of vegetation cover [21]. The expansion of croplands towards marginal lands at steep slopes of our study area threatened the remaining forests, which might lead to erosion and decreasing water supplies and an overall change in the people’s livelihoods. The limited number of LULC types in the very humid AEZs suggested the opportunities of not having severe conversion similar to the lower highlands. Such change analysis along slope gradient and AEZs entails to reconsider the massive program of natural resource conservation to reduce environmental degradation and poverty as well as increase agricultural productivity and food security over the last three decades undertaken by the government of Ethiopia and a consortium of donors [77], and revert the ongoing situation by devising site specific and more effective landscape management strategies.

4. Conclusions

In the landscape of Munessa-Shashemene area of the Ethiopian highlands, LULC changes have occurred in the last four decades. This was examined by object-based classification of multi-temporal remotely sensed data (Landsat and RapidEye) from four reference years followed by post classification comparisons using recent advancements of remote sensing and GIS technologies. Our approach in object-based methods increased the classification accuracy, as observed in previous studies [36]. This is new for the case of Ethiopian landscapes having diverse features and ragged topographies. The approach has the potential to be extended across other parts of the country for improved classification results. Our results from the 1973 classified image (initial period of study) revealed grasslands, woodlands and natural forests as the dominant LULC types. In 2012, croplands were the dominant LULC types followed by others in various proportions.
In this study, we were able to depict the relationship among LULC types in different time periods. A continuous increase of croplands was observed at the expense of decreasing natural forests, grasslands and woodlands. This implies that the increase of other LULC types in the area is the result of deforestation and grassland conversion. In addition, increases in tree patches along the study landscape illustrate the rapid forest fragmentation over the last four decades and the huge transformation in to monoculture agricultural systems. Such kind of agricultural landscape may lead to environmental and ecological problems. The situations were clear in our analysis of the 39-year change matrix, which revealed that about 60% of the land had experienced changes in LULC. Specifically, about 75% of the existing planation forests were established at the expense of conversion of the natural forest, which is one of the remnant tropical dry Afromontane forests in the country. Geographically, there are clear spatial patterns between the natural forest and other LULC types, whereby the natural forests dominated the steep and very steep slope parts of the study landscape. However, changes in relation to slope gradients showed expansion of croplands from gentle and moderate slopes to steep and very steep slopes. This change is perilous since it might lead to severe erosion. Agro-ecologically, croplands largely occupied the sub-humid highland zone of the study landscape. With these variations in changes along the slope gradient and agro-ecological zones, we recommend a strategic land use planning if the observed harmful trends are to be reversed.
Our findings provided up-to-date dynamics of LULC datasets. The datasets will be inputs for spatial database that can be used as a model for monitoring of future changes, informed decision making during policy formulation or land use planning process or other similar studies in the Ethiopian highlands. Furthermore, they can provide information as indicators of the direction of change in the study landscape over the given period. In this regard, our study is also in line with other conclusions about the use of remote sensing-based analysis to be a vital tool for continuous monitoring of LULC changes at varied spatial and temporal scales, which are otherwise not possible to simply attempt through ground based inventory, e.g., [25,31,34]. However, remotely sensed data help to extract information mainly on the extent of LULC changes but do not provide explanations about the reasons and drivers responsible for the changes observed. Further investigations of these remote sensing-based findings with datasets from primary or secondary sources would be helpful in finding driving forces of changes and their detailed consequences as well as looking for alternative solutions for conservation and management problems and designing future development strategies. It is important to prevent or take urgent action against further expansion of croplands to very steep slopes and harsh environment, which might have negative impacts on the remaining natural forest.

Acknowledgments

We would like to thank German Academic Exchange Service (DAAD) for the financial support. We also gratefully acknowledge the RapidEye Science Archive (RESA) of German Aerospace Center (DLR) for providing RapidEye image for this research and the TUM Graduate School/Faculty Graduate Center Weihenstephan at Technische Universität München for covering local field expenses during data collection. Special thanks also to the Forestry Research Center of the Ethiopian Institute of Agricultural Research for providing us a field car, Temesgen Yohannes for assisting during data collection, and farmers for their help in the field.
  • Conflict of InterestThe authors declare no conflict of interest.

References

  1. Pielke, R.A.; Marland, G.; Betts, R.A.; Chase, T.N.; Eastman, J.L.; Niles, J.O.; Niyogi, D.S.; Running, S.W. The influence of land-use change and landscape dynamics on the climate system: Relevance to climate-change policy beyond the radiative effect of greenhouse gases. Phil. Trans. R. Soc 2002, 360, 1705–1719. [Google Scholar]
  2. Intergovernmental Panel on Climate Change (IPCC). Land Use, Land-Use Change, and Forestry: A Special Report of the Intergovernmental Panel on Climate Change; Cambridge University Press: Cambridge, UK/New York, NY, USA, 2000. [Google Scholar]
  3. Vitousek, P.M.; Mooney, H.A.; Lubchenco, J.; Melillo, J.M. Human domination of Earth’s ecosystems. Science 1997, 277, 494–499. [Google Scholar]
  4. Mas, J.-F.; Velázquez, A.; Díaz-Gallegos, J.R.; Mayorga-Saucedo, R.; Alcántara, C.; Bocco, G.; Castro, R.; Fernández, T.; Pérez-Vega, A. Assessing land use/cover changes: A nationwide multidate spatial database for Mexico. Int. J. Appl. Earth Obs. Geoinf 2004, 5, 249–261. [Google Scholar]
  5. Prenzel, B. Remote sensing-based quantification of land-cover and land-use change for planning. Progr. Plan 2004, 61, 281–299. [Google Scholar]
  6. Giri, C.; Zhu, Z.; Reed, B. A comparative analysis of the global land cover 2000 and MODIS land cover data sets. Remote Sens. Environ 2005, 94, 123–132. [Google Scholar]
  7. Gautam, N.; Chennaiah, G. Land-use and land-cover mapping and change detection in Tripura using satellite LANDSAT data. Int. J. Remote Sens 1985, 6, 517–528. [Google Scholar]
  8. Dhinwa, P.S.; Pathan, S.K.; Sastry, S.V.C.; Rao, M.; Majumder, K.L.; Chotani, M.L.; Singh, J.P.; Sinha, R.L.P. Land use change analysis of Bharatpur district using GIS. J. Indian Soc. Remote Sens 1992, 20, 237–250. [Google Scholar]
  9. Weng, Q. Land use change analysis in the Zhujiang Delta of China using satellite remote sensing, GIS and stochastic modelling. J. Environ. Manage 2002, 64, 273–284. [Google Scholar]
  10. Rindfuss, R.R.; Walsh, S.J.; Turner, B.L.; Fox, J.; Mishra, V. Developing a science of land change: Challenges and methodological issues. Proc. Natl. Acad. Sci. USA 2004, 101, 13976–13981. [Google Scholar]
  11. Nelson, G.C.; Geoghegan, J. Deforestation and land use change: Sparse data environments. Agr. Econ 2002, 27, 201–216. [Google Scholar]
  12. Poyatos, R.; Latron, J.; Llorens, P. Land use and land cover change after agricultural abandonment. Mt. Res. Dev 2003, 23, 362–368. [Google Scholar]
  13. Kidanu, S. Using Eucalyptus for Soil & Water Conservation on the Highland Vertisols of Ethiopia. Wageningen University and Research Centre, Wageningen, The Netherlands, 2004. [Google Scholar]
  14. Central Statistical Authority (CSA). Summary and Statistical Report of the 2007 Population and Housing Census; CSA: Addis Ababa, Ethiopia, 2007. [Google Scholar]
  15. Eshetu, Z.; Högberg, P. Reconstruction of forest site history in Ethiopian highlands based on C13 natural abundance of soils. Ambio 2000, 29, 83–89. [Google Scholar]
  16. Hurni, H.; Tato, K.; Zeleke, G. The implications of changes in population, land use, and land management for surface runoff in the Upper Nile Basin Area of Ethiopia. Mt. Res. Dev 2005, 25, 147–154. [Google Scholar]
  17. Lemenih, M.; Teketay, D. Potentials of plantation forests in fostering the restoration of native flora and fauna at degraded sites in Ethiopia: A review. Ethiop. J. Biol. Soc 2004, 3, 81–111. [Google Scholar]
  18. Abate, S. Land Use Dynamics, Soil Degradation, and Potential for Sustainable Use in Metu Area, Illubabor Region, Ethiopia. University of Berne, Berne, Switzerland, 1994. [Google Scholar]
  19. Rembold, F.; Carnicelli, S.; Nori, M.; Ferrari, G.A. Use of aerial photographs, Landsat TM imagery and multidisciplinary field survey for land-cover change analysis in the lakes region (Ethiopia). Int. J. Appl. Earth Obs. Geoinf 2000, 2, 181–189. [Google Scholar]
  20. Tekle, K.; Hedlund, L. Land cover changes between 1958 and 1986 in Kalu District, Southern Wello, Ethiopia. Mt. Res. Dev 2000, 20, 42–51. [Google Scholar]
  21. Zeleke, G.; Hurni, H. Implications of land use and land cover dynamics for mountain resource degradation in the northwestern Ethiopian Highlands. Mt. Res. Dev 2001, 21, 184–191. [Google Scholar]
  22. Bewket, W. Land cover dynamics since the 1950s in Chemoga Watershed, Blue Nile Basin, Ethiopia. Mt. Res. Dev 2002, 22, 263–269. [Google Scholar]
  23. Tegene, B. Land-cover/land-use changes in the derekolli catchment of the South Welo Zone of Amhara Region, Ethiopia. East. Afr. Soc. Sci. Res. Rev 2002, 18, 1–20. [Google Scholar]
  24. Dwivedi, R.S.; Sreenivas, K.; Ramana, K.V. Cover: Land-use/land -cover change analysis in part of Ethiopia using Landsat Thematic Mapper data. Int. J. Remote Sens 2005, 26, 1285–1287. [Google Scholar]
  25. Shiferaw, A. Evaluating the land use and land cover dynamics in Borena Wereda of South Wollo Highlands, Ethiopia. J. Sustain. Dev. Africa 2011, 13, 87–107. [Google Scholar]
  26. Wondie, M.; Schneider, W.; Melesse, A.M.; Teketay, D. Spatial and temporal land cover changes in the simen mountains national park, a world heritage site in Northwestern Ethiopia. Remote Sens 2011, 3, 752–766. [Google Scholar]
  27. Hurni, H. Agroecological Belts of Ethiopia: Explanatory Notes on Three Maps at a Scale of 1:1,000,000: Addis Ababa; Soil Conservation Research Program Research Report; Center for Development and Environment (CDE): Addis Ababa/Berne, Switzerland, 1998. [Google Scholar]
  28. Lunetta, R.S.; Knight, J.F.; Ediriwickrema, J.; Lyon, J.G.; Worthy, L.D. Land-cover change detection using multi-temporal MODIS NDVI data. Remote Sens. Environ 2006, 105, 142–154. [Google Scholar]
  29. Wu, X.; Cai, Y.; Zhou, T. Effects of land use/land cover changes on rocky desertification-a case study of a small Karst catchment in Southwestern China. Energy Procedia 2011, 5, 1–5. [Google Scholar]
  30. Lillesand, T.M.; Kiefer, R.W. Remote Sensing and Image Interpretation, 4th ed.; John Wiley & Sons: New York, NY, USA, 2000. [Google Scholar]
  31. Singh, P.; Thakur, J.K.; Kumar, S.; Singh, U.C. Assessment of Land Use/Land Cover Using Geospatial Techniques in a Semi-arid Region of Madhya Pradesh, India. In Geospatial Techniques for Managing Environmental Resources; Thakur, J.K., Ed.; Springer: Dordrecht, the Netherland/New York, NY, USA, 2012; pp. 152–163. [Google Scholar]
  32. Richards, J.A.; Jia, X. Remote Sensing Digital Image Analysis: An Introduction, 3rd ed.; Springer-Verlag: Berlin, Germany/New York, NY, USA, 1999. [Google Scholar]
  33. Gillanders, S.N.; Coops, N.C.; Wulder, M.A.; Gergel, S.E.; Nelson, T. Multitemporal remote sensing of landscape dynamics and pattern change: Describing natural and anthropogenic trends. Progr. Phys. Geogr 2008, 32, 503–528. [Google Scholar]
  34. Fan, F.; Weng, Q.; Wang, Y. Land use and land cover change in Guangzhou, China, from 1998 to 2003, based on Landsat TM /ETM+ Imagery. Sensors 2007, 7, 1323–1342. [Google Scholar]
  35. Blaschke, T. Object based image analysis for remote sensing. ISPRS J. Photogramm 2010, 65, 2–16. [Google Scholar]
  36. Whiteside, T.G.; Boggs, G.S.; Maier, S.W. Comparing object-based and pixel-based classifications for mapping savannas. Int. J. Appl. Earth Obs. Geoinf 2011, 13, 884–893. [Google Scholar]
  37. Luo, L.; Mountrakis, G. Converting local spectral and spatial information from a priori classifiers into contextual knowledge for impervious surface classification. ISPRS J. Photogramm 2011, 66, 579–587. [Google Scholar]
  38. Baatz, M.; Schäpe, A. Multiresolution Segmentation: An Optimization Approach for High Quality Multi-scale Image. In Angewandte Geographische Informationsverarbeitung XII: Beiträge zum AGIT-Symposium Salzburg 2000; Blaschke, T., Griesebner, G., Strobl, J., Eds.; Herbert Wichmann Verlag: Heidelberg, Germany, 2000; pp. 12–23. [Google Scholar]
  39. Manakos, I.; Schneider, T.; Ammer, U. A Comparison between the ISODATA and the eCognition Classification Methods on Basis of Field Data. In Proceedings of the XIXth ISPRS Congress, Amsterdam, The Netherlands, 16–23 July 2000.
  40. Definiens. eCognition Developer 8 Reference Book User Guide; Definiens: Munich, Germany, 2009. [Google Scholar]
  41. Dronova, I.; Gong, P.; Wang, L. Object-based analysis and change detection of major wetland cover types and their classification uncertainty during the low water period at Poyang Lake, China. Remote Sens. Environ 2011, 115, 3220–3236. [Google Scholar]
  42. Dessie, G.; Kleman, J. Pattern and magnitude of deforestation in the South Central Rift Valley Region of Ethiopia. Mt. Res. Dev 2007, 27, 162–168. [Google Scholar]
  43. Garedew, E.; Sandewall, M.; Söderberg, U.; Campbell, B.M. Land-use and land-cover dynamics in the Central Rift Valley of Ethiopia. Environ. Manage 2009, 44, 683–694. [Google Scholar]
  44. Fritzsche, F.; Zech, W.; Guggenberger, G. Soils of the Main Ethiopian Rift Valley escarpment: A transect study. Catena 2007, 70, 209–219. [Google Scholar]
  45. Teketay, D.; Granström, A. Soil seed banks in dry Afromontane forests of Ethiopia. J. Veg. Sci. 1995, 777–786. [Google Scholar]
  46. Lu, D.; Mausel, P.; Brondízio, E.; Moran, E. Change detection techniques. Int. J. Remote Sens 2004, 25, 2365–2401. [Google Scholar]
  47. Yan, G.; Mas, J.-F.; Maathuis, B.H.P.; Xiangmin, Z.; van Dijk, P.M. Comparison of pixel-based and object-oriented image classification approaches—A case study in a coal fire area, Wuda, Inner Mongolia, China. Int. J. Remote Sens 2006, 27, 4039–4055. [Google Scholar]
  48. Tian, J.; Chen, D. Optimization in multi-scale segmentation of high -resolution satellite images for artificial feature recognition. Int. J. Remote Sens 2007, 28, 4625–4644. [Google Scholar]
  49. Flanders, D.; Hall-Beyer, M.; Pereverzoff, J. Preliminary evaluation of eCognition object-based software for cut block delineation and feature extraction. Can. J. Remote Sens 2003, 29, 441–452. [Google Scholar]
  50. Reed, B.C.; Brown, J.F.; VanderZee, D.; Loveland, T.R.; Merchant, J.W.; Ohlen, D.O. Measuring phenological variability from satellite imagery. J. Veg. Sci 1994, 5, 703–714. [Google Scholar]
  51. Teketay, D. Vegetation Types and Forest Fire Management in Ethiopia. In In Proceedings of the Round Table Conference on Integrated Forest Fire Management in Ethiopia, Addis Ababa, Ethiopia,19–20 September 2000; Ministry of Agriculture (MOA)/Deutsche Gesellschaft für Technische Zusammenarbeit (GTZ): Addis Ababa, Ethiopia, 2001; pp. 1–35. [Google Scholar]
  52. Foody, G.M. Status of land cover classification accuracy assessment. Remote Sens. Environ 2002, 80, 185–201. [Google Scholar]
  53. Congalton, R.G.; Green, K. Assessing the Accuracy of Remotely Sensed Data: Principles and Practices, 2nd ed.; CRC Press/Taylor & Francis: Boca Raton, FL, USA, 2009. [Google Scholar]
  54. Singh, A. Review Article Digital change detection techniques using remotely-sensed data. Int. J. Remote Sens 1989, 10, 989–1003. [Google Scholar]
  55. Foody, G.M. Monitoring the magnitude of land-cover change around the southern limits of the Sahara. Photogramm. Eng. Remote Sensing 2001, 67, 841–847. [Google Scholar]
  56. Hietel, E.; Waldhardt, R.; Otte, A. Analysing land-cover changes in relation to environmental variables in Hesse, Germany. Landscape Ecol 2004, 19, 473–489. [Google Scholar]
  57. Food and Agriculture Organization (FAO). Guidelines for Soil Description; FAO: Rome, Italy, 1990. [Google Scholar]
  58. Ministry of Agriculture (MOA). Agro-Ecological Zones of Ethiopia; MoA: Addis Ababa, Ethiopia, 2000. [Google Scholar]
  59. Anderson, J.R.; Hardy, E.E.; Roach, J.T.; Witmer, R.E. A Land Use and Land Cover Classification System for Use with Remote Sensor Data; US Geological Survey Professional Paper No. 964; USGS: Reston, WV, USA, 1976; p. 28. [Google Scholar]
  60. Thomlinson, J.R.; Bolstad, P.V.; Cohen, W.B. Coordinating methodologies for scaling land cover classifications from site-specific to global. Remote Sen. Environ 1999, 70, 16–28. [Google Scholar]
  61. Knoke, T.; Román-Cuesta, R.M.; Weber, M.; Haber, W. How can climate policy benefit from comprehensive land-use approaches? Front. Ecol. Environ 2012, 10, 438–445. [Google Scholar]
  62. Paré, S.; Söderberg, U.; Sandewall, M.; Ouadba, J.M. Land use analysis from spatial and field data capture in southern Burkina Faso, West Africa. Agr. Ecosyst. Environ 2008, 127, 277–285. [Google Scholar]
  63. Cyranoski, D. Biodiversity: Logging: The new conservation. Nature 2007, 446, 608–610. [Google Scholar]
  64. Brockerhoff, E.G.; Jactel, H.; Parrotta, J.A.; Quine, C.P.; Sayer, J. Plantation forests and biodiversity: Oxymoron or opportunity? Biodivers. Conserv 2008, 17, 925–951. [Google Scholar]
  65. Assen, M. Land use/cover dynamics and its implications in the dried Lake Alemaya watershed, eastern Ethiopia. J. Sustain. Dev. Africa 2011, 13, 267–284. [Google Scholar]
  66. Bishaw, B. Deforestation and land degradation in the Ethiopian Highlands: A strategy for physical recovery. Ethiop. E-J. Res. Innov. Foresight 2009, 1, 5–18. [Google Scholar]
  67. Lemenih, M.; Karltun, E.; Olsson, M. Assessing soil chemical and physical property responses to deforestation and subsequent cultivation in smallholders farming system in Ethiopia. Agr. Ecosyst. Environ 2005, 105, 373–386. [Google Scholar]
  68. Tesfaye, G.; Teketay, D.; Fetene, M.; Beck, E. Regeneration of seven indigenous tree species in a dry Afromontane forest, southern Ethiopia. Flora Mor. Dist. Fun. Ecol. Plants 2010, 205, 135–143. [Google Scholar]
  69. Gebremedhin, B.; Pender, J.; Tesfay, G. Collective Action for Grazing Land Management in Mixed Crop-Livestock Systems in the Highlands of Northern Ethiopia; International Livestock Research Institute: Nairobi, Kenya, 2002. [Google Scholar]
  70. Teketay, D.; Lemenih, M.; Bekele, T.; Yemshaw, Y.; Feleke, S.; Tadesse, W.; Moges, Y.; Hunde, T.; Nigussie, D. Forest Resources and Challenges of Sustainable Forest Management and Conservation in Ethiopia. In Degraded Forests in Eastern Africa: Management and Restoration; Bongers, F., Tennigkeit, T., Eds.; Earthscan: London, UK/Washington, DC, USA, 2010; pp. 19–64. [Google Scholar]
  71. Ciais, P.; Piao, S.-L.; Cadule, P.; Friedlingstein, P.; Chédin, A. Variability and recent trends in the African terrestrial carbon balance. Biogeosciences 2009, 6, 1935–1948. [Google Scholar]
  72. Reusing, M.; Schneider, T.; Ammer, U. Modelling soil loss rates in the Ethiopian Highlands by integration of high resolution MOMS-02/D2-stereo-data in a GIS. Int. J. Remote Sens 2000, 21, 1885–1896. [Google Scholar]
  73. Baron, J.S.; Hartman, M.D.; Kittel, T.G.F.; Band, L.E.; Ojima, D.S.; Lammers, R.B. Effects of land cover, water redistribution, and temperature on ecosystem processes in the South Platte Basin. Econ. Appl 1998, 8, 1037–1051. [Google Scholar]
  74. Arora, V. Modeling vegetation as a dynamic component in soil-vegetation-atmosphere transfer schemes and hydrological models. Rev. Geophys 2002, 40, 1–25. [Google Scholar]
  75. Beniston, M. Climate change in mountain regions: A review of possible impacts. Clim. Change 2003, 59, 5–31. [Google Scholar]
  76. Alemayehu, T.; Furi, W.; Legesse, D. Impact of water overexploitation on highland lakes of eastern Ethiopia. Environ. Geol 2007, 52, 147–154. [Google Scholar]
  77. Kassie, M.; Zikhali, P.; Pender, J.; Köhlin, G. The economics of sustainable land management practices in the Ethiopian Highlands. J. Agr. Econ 2010, 61, 605–627. [Google Scholar]
Figure 1. Location of the study area: (a) African context, (b) landscape level study location in reference to Ethiopia. Background is Landsat 7 Enhanced Thematic Mapper (ETM+) image of the year 2000 with RGB (Red, Green, Blue): Band 5, band 4 and 3. Topographic counters with 100 m were developed from Aster Digital Elevation Model (DEM).
Remotesensing 05 02411f1
Figure 2. Classification scheme used in eCognition for LULC classification in the study landscape. Dash line boxes are intermediate/temporal classes and colored boxes are final LULC classes.
Remotesensing 05 02411f2
Figure 3. Land use/land cover (LULC) map of the study landscape (a) 1973, (b) 1986, (c) 2000 and (d) 2012.
Remotesensing 05 02411f3
Figure 4. Proportion of LULC types in reference years along slope gradient: gentle slopes (0%–5%), moderate slopes (5%–15%), steep slopes (15%–30%), and very steep slopes (>30%). Four columns in each slope range stand for the data of 1973, 1986, 2000, and 2012 from left to right.
Remotesensing 05 02411f4
Figure 5. Proportion of LULC types in reference years along Agro-ecological zone: 1,500–2,300 m = sub-humid highlands (“Weyna Dega”), 2,300–3,200 m = humid highlands (“Dega”) and above 3,200 m = cold highlands (“Wurch”). Four columns in each zone stand for the data of 1973, 1986, 2000, and 2012 from left to right.
Remotesensing 05 02411f5
Table 1. Summary of spatial datasets used in this study.
Dataset TypeAcquisition Date (s)Pixel Resolution/Scale
Satellite data
  Landsat MSS30.1.197360 m
  Landsat TM 521.1.198630 m
  Landsat ETM+5.2.200030 m
  RapidEye1.2.20125 m
  Aster DEM30 m

Aerial photo

  Black and white1.2.19721:50000
  Black and white1.2.19861:20000

Ancillary data

  Topo map1:50000
  Field dataNovember 2011–January 2012
  Roads and towns
  Kebele boundary
  Wereda boundary
Table 2. Parameters used for different images in each segmentation level.
Data TypeResolutionParameters Used in Different Segmentation Levels

Parameters for Level 1Parameters for Level 2Parameters for Level 3


ScaShbCmcScShCmScShCm
Landsat MSS60 m400.20.8150.20.880.20.8
Landsat TM 530 m500.10.5200.10.5100.10.5
Landsat ETM+30 m500.10.5200.10.5100.10.5
RapidEye5 m5000.20.72000.20.7500.20.7
aScale (Sc) parameter identifies the highest heterogeneity allowed for the objects;
bShape (Sh) parameter balances spectral homogeneity versus shape of objects on segmentation outcome;
cCompactness (Cm) parameter determines image objects based on their relative shape.
Table 3. Description of land use/land covers classes used for change study from 1973 to 2012.
LULC TypesGeneral Description
Bare landsAreas of land that already gets bad either due to erosion or misuses especially over grazing and crop cultivation.
GrasslandsAll areas covered with natural grass and small shrubs dominated by grass.
WaterPermanent lakes and other intermittent ponds.
SettlementsBuild-ups (houses) in both urban and rural parts.
CroplandsAreas of land prepared for growing agricultural crops. This category includes areas currently under crop, and land under preparation.
Tree patchesAreas covered with scattered trees, bushes and shrubs along the study landscape. Small patches of forests (<0.5 ha) are also included in this category.
Plantation forestsAreas covered by man-made trees with minimum size of 0.5 ha.
Natural forestsAreas dominated by natural high forests, which are coniferous or deciduous.
WoodlandsForests found below 1900 m a.s.l. [51]. Mainly dominated by Acacia spp.
Table 4. Error matrix of classification accuracies for (a) 1973, (b) 1986, (c) 2000 and (d) 2012.
(a) Reference Data

Classified DataBare LandsNatural ForestsCrop LandsGrass LandsSettlementsTree PatchesWood LandsWaterTotalUA (%)
Bare lands3108220004372.1
Natural forests0590302006492.2
Croplands0152501406382.5
Grasslands5025612206882.4
Settlements1054393005275.0
Tree patches0101153205891.4
Woodlands0002035616290.3
Water0001002576095.0
Total3761677443646658470
PA(%)83.896.777.675.790.782.884.898.3

Overall accuracy = 85.7%; Kappa statistic = 0.822.
Table 4. Error matrix of classification accuracies for (a) 1973, (b) 1986, (c) 2000 and (d) 2012.
(b) Reference Data
Classified DataBare LandsNatural ForestsPlantation ForestsCrop LandsGrass LandsSettlementsTree PatchesWood LandsWaterTotalUA (%)
Bare lands42006300005182.4
Natural forests05930000006295.2
Plantation forests02520000005496.3
Croplands50054330006583.1
Grasslands11015712106489.1
Settlements00004474005585.5
Tree patches00004057006193.4
Woodlands00012004805194.1
Water00001000535498.1
Total486255627451634953517
PA(%)87.595.294.587.17792.290.598100

Overall accuracy = 90.7%; Kappa statistic = 0.895.
Table 4. Error matrix of classification accuracies for (a) 1973, (b) 1986, (c) 2000 and (d) 2012.
(c) Reference Data
Classified DataBare LandsNatural ForestsPlantation ForestsCrop LandsGrass LandsSettlementsTree PatchesWood LandsWaterTotalUA (%)
Bare lands43006510005578.2
Natural forests05720000005996.6
Plantation forests0155000005698.2
Croplands30059420006886.8
Grasslands20025411106188.5
Settlements00013493005687.5
Tree patches00002258006293.5
Woodlands00012004504893.8
Water00001000515298.1
Total485857697155624651517
PA(%)90.498.396.590.876.189.193.597.8100

Overall accuracy = 91.9; Kappa statistic = 0.908.
Table 4. Error matrix of classification accuracies for (a) 1973, (b) 1986, (c) 2000 and (d) 2012.
(d) Reference Data
Classified DataBare LandsNatural ForestsPlantation ForestsCrop LandsGrass LandsSettlementsTree PatchesWood LandsWaterTotalUA (%)
Bare lands45008030005680.4
Natural forests05620000005896.6
Plantation forests01540000005598.2
Croplands20062500006989.9
Grasslands00035502106190.2
Settlements30030510005789.5
Tree patches00001062006398.4
Woodlands00001004604797.9
Water000000005151100.0
Total505756766254644751517
PA(%)9098.296.481.688.794.496.997.9100

Overall accuracy = 93.2%; Kappa statistic = 0.924.
where UA = user’s accuracy and PA = producer’s accuracy. The columns represent actual location of samples on the ground, while rows display classified data showing location of samples in the classified images. Diagonal numbers showed in bold are the correct classifications. The off-diagonal numbers in rows and columns are misclassifications or errors.
Table 5. Summaries of area of classified land use/land covers in the study area for the different reference years.
LULC Types1973198620002012

Area (ha)(%)Area (ha)%Area (ha)(%)Area (ha)%
Bare lands3430.31,4621.41,5981.51,7651.7
Natural forests21,7262116,06515.512,68012.29,5889.2
Plantation forests--1,02211,7071.61,2841.2
Croplands13,4981331,1783040,99739.550,31748.5
Grasslands43,83042.338,60637.231,85330.725,13924.2
Settlements4390.48670.81,1391.11,5861.5
Tree patches2,0211.92,4882.42,8702.83,6063.5
Woodlands11,84211.42,1502.11,02616560.6
Water9,9769.69,9209.69,8909.59,8719.5
Table 6. Results of LULC changes from 1973 to 1986, 1986 to 2000, 2000 to 2012 and 1973 to 2012 time periods showing area changed for each classes in hectare (ha) and percentage LULC changes between periods in percentage (%).
LULC TypesChange in Land Use/Land Cover between Periods
1973–19861986–20002000–2012

Area (ha)(%)Area (ha)(%)Area (ha)(%)
Bare lands1,119326.21369.316710.5
Natural forests−5,661−26.1−3,385−21.1−3,092−24.4
Plantation forests1,02210068567−423−24.8
Croplands17,6801319,81931.59,32022.7
Grassland−5,224−11.9−6,753−17.5−6,714−21.1
Settlements42897.527231.444739.2
Tree patches46723.138215.473625.6
Woodlands−9,692−81.8−1,124−52.3−370−36.1
Water−56−0.6−30−0.3−19−0.2
Table 7. Summary of LULC change matrix in ha from 1973 to 2012.
FromBare LandsNatural ForestsPlantation ForestsCrop LandsGrass LandsSettlementsTree PatchesWoodlandsWaterTotal (2012)b
To
Bare lands79238.60310.9922.31.316.1187.951,761.1
Natural forests08,921.7020.0623.8014.6009580
Plantation forest0945.706.5326.401.9001,280.4
Croplands227.33,192.5010,072.327,874.647.8938.67,827.914.150,195.2
Grasslands20.57,225.902407.711,755.754889.82,646.475.425,075.4
Settlements13.8450335.3805.329412.969.681,584
Tree patches0.911540329.41,491.642.3146425.09.53,598.7
Woodlands0005.10.100650.60.1655.9
Water1.1000.29.500.625.19,834.19,870.5
Total (1973)a342.521,723.313,487.343,809.3439.52,020.611,832.49,946.2103,601.2
aRow total sums the amount of land for each LULC types of the initial study year (1973);
bcolumn total sums the amount of land that was converted to each LULC types of the year 2012. The values in each of the cells represent the amount of land that was converted from one land cover type to another. For instance, the value of 45 in the second column (natural forests) of the six row (settlements) means that 45 hectares of natural forests were converted to settlements from 1973 to 2012. The bold diagonal values represent the area of each class that remains unchanged while the off diagonal values represent the change area.

