On the Variation of NDVI with the Principal Climatic Elements in the Tibetan Plateau

1
Key Laboratory of Mountain Surface Process and Ecological Regulation, Institute of Mountain Hazard and Environment, Chinese Academy of Sciences, No.9, Block 4, Renminnanlu Road, Chengdu 610041, China
2
College of Resources and Environment, University of Chinese Academy of Sciences, No.19 A, Yuquanlu Road, Beijing 100049, China
3
Land and Resource College, China West Normal University, No.1, Shidalu Road, Nanchong 637002, China
*
Author to whom correspondence should be addressed.
Remote Sens. 2013, 5(4), 1894-1911; https://doi.org/10.3390/rs5041894
Submission received: 8 April 2013
/
Accepted: 9 April 2013
/
Published: 16 April 2013
Abstract
:Temperature and precipitation have been separately reported to be the main factors affecting the Normalized Difference Vegetation Index (NDVI) in the Tibetan Plateau. The effects of the main climatic factors on the yearly maximum NDVI (MNDVI) in the Tibetan Plateau were examined on different scales. The result underscored the observation that both precipitation and temperature affect MNDVI based on weather stations or physico-geographical regions. Precipitation is the main climatic factor that affects the vegetation cover in the entire Tibetan Plateau. Both annual mean precipitation and annual mean precipitation of the growing period are related with MNDVI, and the positive correlations are manifested in a linear manner. By comparison, the weakly correlated current between MNDVI and all the temperature indexes is observed in the study area.
1. Introduction
In many regions all over the world, the global climate change significantly influences the natural environment [1]. Climate in the Tibetan Plateau is characterized by a long period of frost and a relatively short growing season [2]. Furthermore, the ecological environment of the plateau has been detrimentally affected by frequent and excessive land utilization, overgrazing, and the collection of Chinese herbal medicines [3]. Consequently, both climate change and human activities severely affect the vegetation cover in this region, which is regarded as a key part in the ecological security of China [4].
The relationship between climate and plant cover pattern depends on the restricted availability of accurate long-term data, which are used to monitor the vegetation cover [5] and abundance of species [6] at the spatial and temporal scales with the advent of remote sensing. Onboard the National Oceanic and Atmospheric Administration (NOAA) satellites, the Advanced Very High Resolution Radiometer (AVHRR) is used for the research of vegetation variation on account of its global spatial scope and long-term temporal coverage. The Normalized Difference Vegetation Index (NDVI) of the AVHRR has been demonstrated as an effective indicator of plant dynamics in studying the relationships between climatic elements and vegetation activity [7].
NDVI is correlated with climatic factors in a wide region, as proven by several studies [5]. Pettorelli [8] considered that the impact of environmental degradation on plant status increases the importance of better predictions for climate change. Milich and Weiss [9] investigated the relationships between NDVI and climatic elements in Sahel, reporting that rainfall is a critical factor that influences vegetation during the growing period. Moreover, the principal component analysis was adopted to manage the connections of plant coverage with climatic variability, which showed that the annual difference of vegetation coverage is largely modulated by the prevailing climatic conditions in Brazilian territory [5].
A recent report on the degraded index tendency found severe degradation in the Northern Tibet grassland. From 1981 to 2004, grassland recovery and protection were promoted by the variation in precipitation, but exacerbated by the differences in temperature and solar radiation. During this period, the regional temperature induced a detrimental effect on the grassland degradation index [10]. However, by analyzing the relationship of climatic factors with the NDVI at the center of the Tibetan Plateau, Chu [11] inferred that NDVI was more sensitive to rainfall in the semiarid zone compared with temperature. In addition, NDVI in the temporal series demonstrated a positive trend from 1985 to 1999, which was closely associated with the increasing rainfall and temperature from the mid-1980s to 1990s. Piao [12] suggested that an overall increasing tendency could be observed in the vegetation growth in most arid and semiarid areas of western China over the past two decades.
Despite the growing number of studies on NDVI in the Tibetan Plateau, several questions remain unanswered. The climatic factor that plays a crucial role in NDVI of the Tibetan Plateau needs to be determined. Therefore, the impact of the current climate change on vegetation coverage is censored by measuring the changed trend of yearly maximum NDVI (MNDVI). This study aims to explore the long-term changes (1980–2006) of MNDVI and its correlation with the main climatic indicators. In particular, we seek to address the following goals: (1) To identify and estimate the spatial and temporal patterns of MNDVI variability; and (2) to diagnose the vital climatic elements related to MNDVI.
2. Materials and Methods
2.1. Study Area
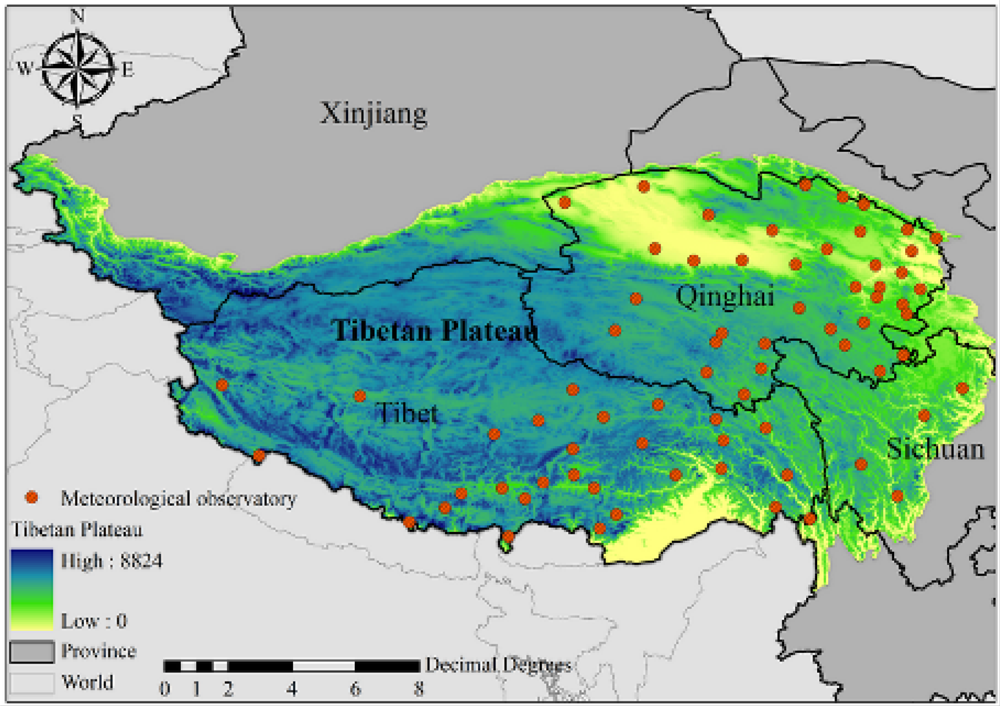
The study area (80°–105°E, 27°–37°N) is located at the southwestern part of China and is approximately over 4,000 m above sea level (Figure 1). The Tibetan Plateau, which borders the north and the northeast of the Kunlun and the Qilian Range, is the source of three major rivers (Yangtze, Salween, and Mekong Rivers). The high altitude and arid steppe is interspersed with mountain ranges and large lakes. The alpine steppe and meadow are the most important ecosystems within this region [13]. Influenced by atmospheric circulation and topography, precipitation and temperature generally decreases from southeast to northwest [14]. Permafrost is present over extensive districts proceeding to the North and Northwest. During winter, the Tibetan Plateau climate, which is controlled by the Siberian and Mongolian high, is considerably cold and arid with very little rain and stronger winds. During summer, the warm and moist climate is controlled by the Indian low [15,16].
2.2. Climatic Data
Climatic data were collected from the Meteorology Information Center of the Chinese National Bureau of Meteorology [16]. The main climatic factors of 72 nationally standard meteorology observatories (1960–2002) are included in the document, and specific information is explained in Table 1. The trends of variations are analyzed based on the data.
The patterns of the mean values of annual mean temperature (AMT), annual maximum temperature (AMXT), annual minimum temperature (AMNT), annual mean temperature during growing season (AMTS), annual accumulated temperature (AAT), annual mean precipitation (AMP), annual maximum precipitation (AMXP), and (annual mean precipitation during growing season (AMPS) (Table 1) are analyzed to examine the variations of climatic factors. In general, the values of meteorological factors are calculated on different scales in accordance with the following formulas:
where:
- Ȳi is the average value of a variable (one of the meteorological factors) in the Tibetan Plateau in a certain year from 1960 to 2002;
- Vj is the value of a variable in the corresponding weather station;
- X̄ is the average value of variables in all stations during this period;
- m is the total number of weather stations; and
- n is the total number of years.
The coefficients between time series numbers (1, 2, 3, …, n) and climatic factors (mean values of AMT, AMXT, AMNT, AMTS, AAT, AMP, AMXP, and AMPS) of linear trends are used to identify the change of climatic factors from 1960 to 2002:
where:
- n is the annual sequence number;
- xi is the value of climatic factor in i year;
- x̄ is the annual mean value of climatic factors; and
- represents a linear ascending or descending trend of climatic factors during a given time when the value is positive or negative.
2.3. Remote Data
NDVI data were downloaded from the Western Data Center [17]. The spatial resolution is 8 km × 8 km, and the temporal resolution is 16 days. Improved results are obtained by eliminating the effect of geometry, volcanic aerosols and other factors on the actual vegetation changes [18]. This study adopted images from January 1982 to December 2006. The common maximum NDVI value composite (MVC) method is used to compile the monthly NDVI dataset. The MVC could minimize the impacts of atmosphere scan angle, cloud contamination, and solar zenith angle [19]. MNDVI is calculated through the semi-monthly NDVI dataset. The remote datasets are unified with the following parameters. Projection: Albers Equal Area Conic; and Datum: D_WGS_1984. MNDVI is computed based on the following formula [20]:
where:
- NDVIij is the semi-monthly value in i year;
- MNDVIi is the annual maximum NDVI.
The linear trend coefficient is used to identify the changed tendencies of MNDVI from 1982 to 2006 [21].
where:
- n is the natural temporal sequence number 1, 2, 3,…, n year;
- MNDVIi is the value of MNDVI in i year.
A linear ascending or descending trend of vegetation index from 1982 to 2006 is represented when the SLOPE value is positive or negative, respectively.
Percentage variation is used to identify the amplitude of the changed vegetation index [21,22].
where:
- PERCENTAGE is the percentage changes, n is the annual sequence number;
- RANGE is the amplitude of the changed vegetation index from 1982 to 2006.
The patterns of climatic factors and MNDVI were analyzed using documents from 1960 to 2002 and from 1982 to 2006. Then, the corresponding documents from 1982 to 2002 were used to calculate the correlation coefficients of MNDVI with climatic factors.
2.4. Analysis Tools
This study used ArcGIS 9.3 (ESRI, Inc., Redlands, CA, USA) and SigmaPlot for Windows version 10.0 (Systat Software, Inc., Chicago, IL, USA) for analysis.
3. Results and Discussion
3.1. The Changed Trends of Climatic Factors on Observatory Stations
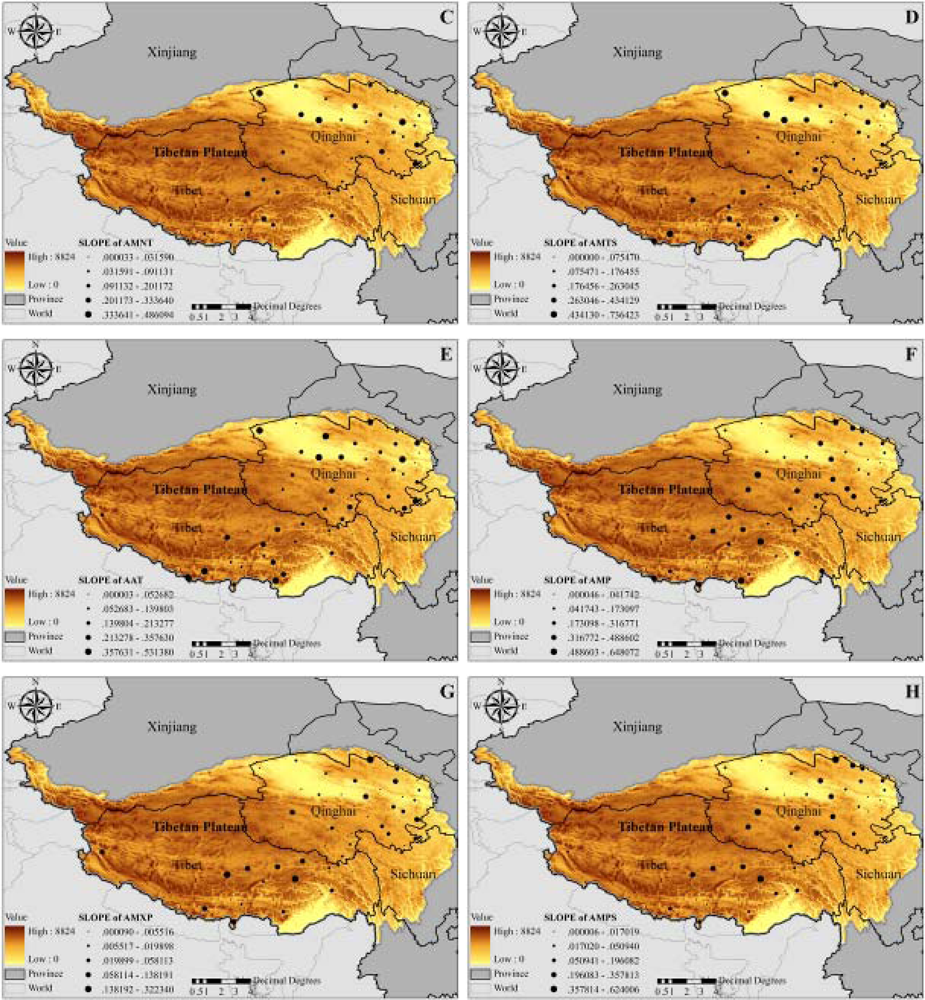
The trend slopes of AMT, AMXT, AMNT, AMTS, AAT, AMP, AMXP, and AMPS are shown in Figure 2(A–H), respectively. Significant increasing AMT trends were detected in the northwestern and southern Tibet Plateau stations. The maximum value was detected in the Xiaozhaohuo station of Qinghai County, with SLOPE = 0.933. Observatory stations in the Changtang alpine steppe region presented no significant trends. The minimum value was detected in the Lhari station, with SLOPE = 0.002 (Figure 2(A)). AMXT (Figure 2(B)) for most stations in the southern Tibetan Plateau showed significant positive trends. However, observatory stations in the Changtang alpine steppe region and the Qaidam mountain desert region presented no significant trends, except for Mangya, Zaduo, Qingshuihe, Qiaboqia, and Mengyuan, which indicated increasing trends. Significant increasing AMNT trends were detected (Figure 2(C)) in stations at the East Qinghai and Qilian mountain steppe regions and the Qaidam mountain desert region, whereas those in the Tibetan Plateau presented no significant trends. AMTS (Figure 2(D)) and AAT (Figure 2(E)) of the observatory stations presented the same trends as AMT. In Figure 2(F), increasing AMP trends were observed from 1960 to 2002 for most of these stations, except those in the Qaidam mountain desert region. The maximum value was observed in the Wudaoliang station of Qinghai County, with SLOPE = 0.648. AMXP (Figure 2(G)) of stations showed increasing trends in the East Qinghai and Qilian mountain steppe regions, South Tibet mountain shrub steppe region, and the Changtang alpine steppe region. AMPS (Figure 2(H)) of the observatory stations presented the same trends as AMP.
3.2. The Changed Trends of Climatic Factors in Entire Region
Based on the 1960–2002 observatory documents, Figure 3 shows the altered trends of AMT (A), AMXT (B), AMNT (C), AMTS (D), AAT (E), AMP (F), AMXP (G), and AMPS (H). In this figure, an important phenomenon is noted, which is the significantly increasing trends in AMT, AMXT, AMP, and AMPS with SLOPES = 0.4949, 0.3187, 0.6395, and 0.4346, respectively. Per 10 yr, the increasing velocity of AMT was 0.45 °C, AMXT was 0.75 °C, AMP was 43.20 mm, and AMPS was 27.12 mm. In addition, a slight change was observed in the trends of AMNT, AMTS, AAT, and AMXP. Zhang et al.[23] explained that the velocities of annual temperature and precipitation were increasing from 1982 to 2006 in the Tibetan Plateau. In 1994, the mean annual ground temperatures are usually warmer than −3.5 °C; temperatures at the 20 m depth have increased by an average of 0.2 °C to 0.3 °C during the past 15 years [24]. Zhao et al.[25] reported the most significant climate warming that occurred in northeastern Tibetan Plateau, in which the warming trend was greater in the cold season than that in the warm season. Moreover, annual precipitation increased in the northwestern, inland, and southeastern regions of the Tibetan Plateau. The variation corresponded with the global warming trend. Such changes are natural, but evidence showed that in recent years, part of the current warming might be attributed to human activities [26]. Human influence on climate has been detected in surface air temperature and in precipitation trends [27].
3.3. The Changed Trends of MNDVI on Weather Stations
We explored the variation of the inter-annual MNDVI to estimate the vegetation cover. Figure 4(A) shows the spatial distribution of MNDVI’s slope for all observatory stations in the Tibetan Plateau from 1982 to 2006. Figure 4(B) shows the percentage of MNDVI change scope to the average MNDVI. The amplitude of MNDVI slope rank was from −0.004 to 0.007, and increasing trends were observed in all stations at the East Qinghai and Qilian mountain steppe regions, South Tibet mountain shrub steppe region, and Changtang alpine steppe region. The higher value appeared in the East Qinghai and Qilian mountain steppe regions and the South Tibet mountain shrub steppe region, specifically at the Chaka, Gangcha, Lhatze, Jiangze, and Shigatse stations. The percentage of MNDVI change scope ranged from −39.6% to 69.94%. All observatory stations presented the same trends as in Figure 4(A). Table 2 indicates the classified result of the MNDVI trend changes simulated from 1982 to 2006. The trend slopes and percentage of MNDVI change scope of the entire region would be analyzed and discussed in the latter parts of the paper.
3.4. The Changed Trend of MNDVI in the Entire Region
The trend of the entire plateau is analyzed in Figure 4 to address the more detailed characteristics of MNDVI. Since 1982, the tendency of MNDVI was unremarkable, with SLOPE = 0.009. An increase in NDVI during the growing season resulted from both the advanced growing season and accelerated vegetation activity. Yang et al.[28] likewise observed that from 1982 to 1999, NDVI significantly increased by a ratio of 0.41% a−1 and a magnitude of 0.001 a−1 on the grasslands of the Tibetan Plateau during the growing season. In addition, based on Figure 4(A) and Table 2 (revised from Ma’s report [20]), significant degradation occurred in the eastern and southern Tibetan Plateau. The program of restoring grazing areas to grasslands led to significant recovery in the center of the plateau, but most of the other areas were unchanged. In Figure 4(B), the MNDVI percentage varied from −40% to 10% in most areas of the plateau. The amplification of 10% to 40% was observed at the core of the plateau and at the mountainous shrub steppe in Southern Tibet, with its seldom intensely-changed regions. The results indicated that the global climate change contributed to the vegetation cover in the Tibetan Plateau [29]. However, the MNDVI trend was unremarkable in the total region. This observation may be attributed to the balance between the area of significantly degraded regions and that of significantly recovered regions. Chu [11] suggested insignificant inter-annual variation of NDVI by analyzing the sensitivity of NDVI in the Lhasa Area. Our findings strongly supported this conclusion. Nevertheless, another result led to a contrasting conclusion. Zhang [27] demonstrated a remarkable inter-annual variation of NDVI. Moreover, Xu [29] believed that the vegetation cover followed the increasing trend in the Tibetan Plateau from the early 1980s to 2000. The results of several research studies [30] were in line with our discoveries in the Changthang alpine steppe region. We found that a remarkable increase (decrease) of MNDVI occurred at the central-eastern (eastern) sector, whereas little change was observed in the western and northwestern sectors of the northern Tibetan Plateau over the last two decades of the 20th century.
3.5. The MNDVI Response to Climatic Factors at the Observatory Stations
The correlation coefficients for AMT, AMXT, AMNT, AMTS, AAT, AMP, AMXP, and AMPS are mapped as charts in Figure 5 to reveal the spatial pattern of the relative importance of these climatic factors on MNDVI variation. In the northeastern plateau, the climatic factors of AMT, AMXT, and AMNT produced a greater effect on MNDVI compared with other climatic factors. AMP, AMXP, and AMPS played a more important role in the Changtang alpine steppe region, South Qinghai alpine meadow steppe region, as well as the East Qinghai and Qilian mountain steppe regions. Peng et al.[31] similarly analyzed the climate–growth relationships of the Qilian juniper at the Anyemaqen mountain on the northeastern Tibetan Plateau. They indicate that compared with temperature, precipitation has a more important role in tree growth. In addition, temperature is a critical factor in controlling the MNDVI in southern Tibet. Ding et al.[32] reported that the correlation between MNDVI and annual effective precipitation was rather strong in the west high-cold shrub-meadow zone, east of the southern Qinghai high-cold meadow steppe zone, and west of the eastern Qinghai-Qilian montane steppe zone. Apparently, the maximum correlation coefficients for AMP, AMXP, and AMPS were observed at the Xianza, Bango, Shigatse, Jiuzhi, Yushu, Guizhou, Xining, and Qilian stations. Generally, the coefficients of correlations between MNDVI and climatic factors were lower based on each station, and the value varied from 0.00002 to 0.369.
3.6. The MNDVI Response to Climatic Factors in the Physico-Geographical Region
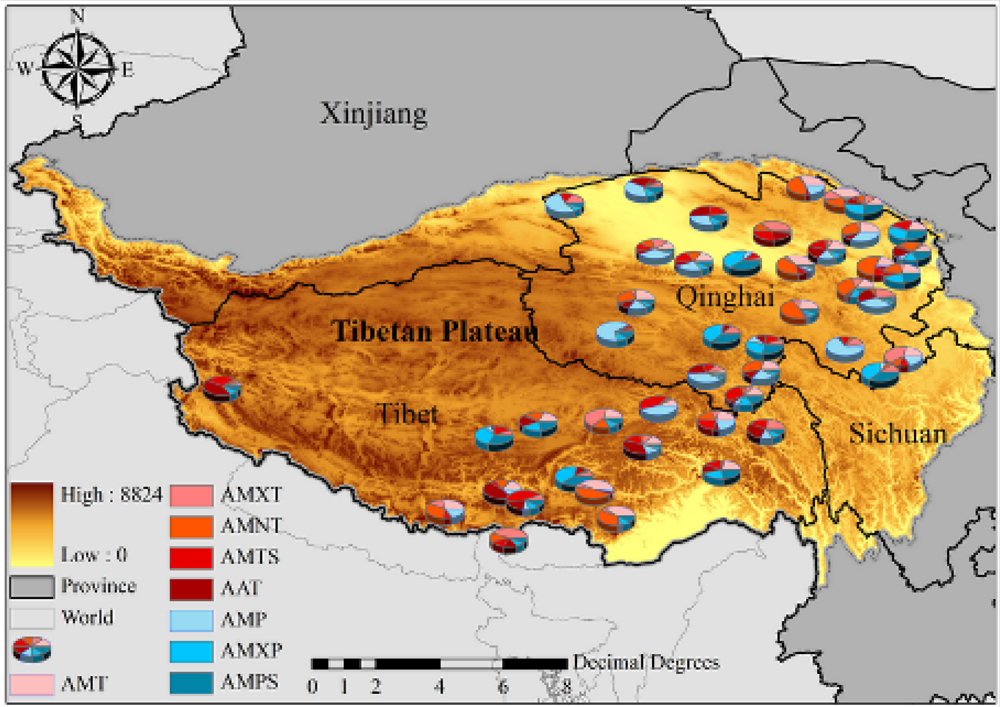
Given that the Tibetan Plateau covers a wide geographical area, the local natural and environmental conditions are quite variable. With regard to the spatial scale dependence, the relationship between climatic factors and MNDVI was analyzed based on the physico-geographical region [33]. The locations of these regions are mapped as graphs in Figure 6, and the specific introduction of regionalism is shown in Table 3.
Table 3 shows the coefficients of correlations between MNDVI and climatic factors based on the different physico-geographical regions of Tibet Plateau. The coefficients were missed in regions HID1, HIID2, and V A6 because the meteorological data was not collected. Apparently, AMT, AMP, AMXP, and AMPS induced greater effects in the Qaidam mountain desert region with the R2 of 0.3399, 0.5415, 0.428, and 0.5445, respectively. AMT and AMP played an important role in the Ali desert and semi-desert region with the R2 of 0.4288 and 0.3691, respectively, and in the Changtang alpine steppe region, where AMXT, AMTS, AAT, AMP, and AMPS produced higher influence. Good relationships of NDVI with precipitation and temperature were observed in the alpine steppe-meadow zone (HIC2) and the desert area. In the Ali desert and semi-desert region (HIID3), as well as the Qaidam mountain desert region (HIID1), both AMT and AMP were the important factors that affect the vegetation index. Precipitation could be a limiting factor for the growth of the desert grassland [34]. However, Zhang et al.[23] and Ding et al.[32] determined that rainfall had a significant influence on NDVI in the alpine meadow and steppe (HIC2), and that precipitation had little effect on vegetation in the forest and desert areas. In the East Qinghai and Qilian Mountain steppe regions (HIIC1), temperature (AMXT) and precipitation (AMP) were the important factors that affected the vegetation. Temperature was a constraint for the growth of grass in the alpine meadow [34]. In the South Qinghai alpine meadow steppe region (HIC1) and Golog-Nagchu alpine scrub meadow regions (HIB1), climatic factors produced minor impact on vegetation. The correlation of NDVI to temperature and precipitation at HIC1 was more widespread than that in the HIB1. Chen [35] observed the same phenomenon. Both precipitation and temperature have little influence on the West Sichuan and the East Tibet coniferous forest mountain regions (HIIAB1). However, Zhu et al.[36] reported different results in the Linzhi area. Thus, we hold that the different scales result in different conclusions.
3.7. The MNDVI Response to Climatic Factors in the Entire Region
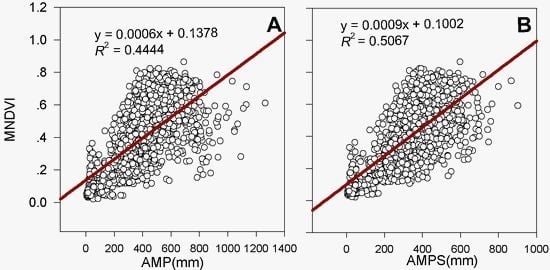
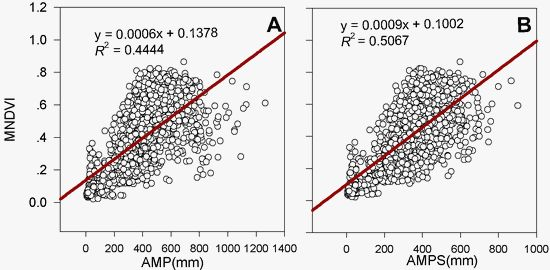
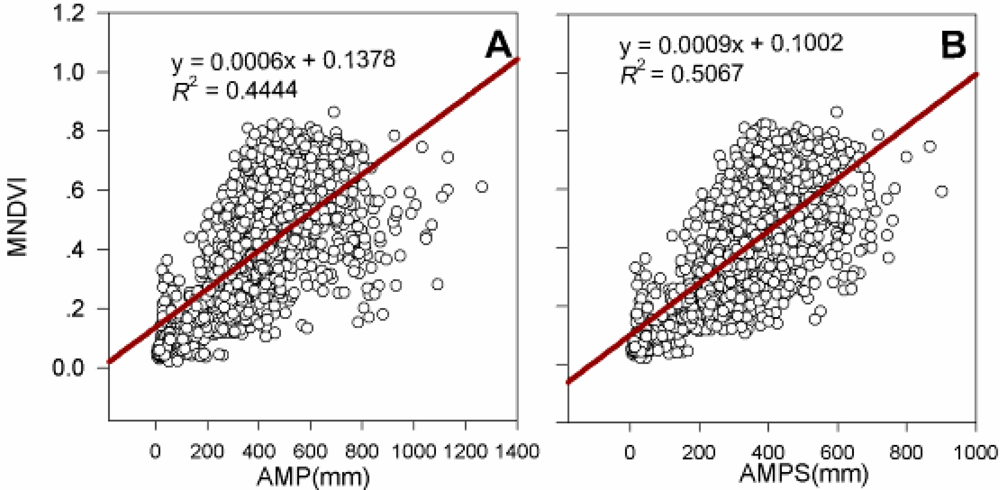
Apparently positive correlations are observed between MNDVI and AMP, AMXP, or AMPS (Figure 7(A,B)). We ascertained that the entire vegetation activity is dependent on precipitation. The indexes of AMP and AMPS were related to MNDVI in a linear manner with 0.4444 (P < 0.0001) and 0.5067 (P < 0.0001) of R2 in sequence, respectively. By contrast, weakly correlated trends were observed between NDVI and temperature in the Tibetan Plateau from 1982 to 2002. The relationship between MNDVI and temperature was insignificant. Compared with other climatic conditions, the AMPS produced the largest influence on the MNDVI.
Correlation analysis between MNDVI and climatic variables is a powerful tool in probing the response of ecosystem functions to global climate change [37]. We determined that precipitation, as one of the major climatic conditions, affected the vegetation cover in the Tibetan Plateau [38]. MNDVI positively correlated with AMP and AMPS in a linear manner. Xu likewise revealed these relationships [29]. By contrast, vegetation growth was limited by temperature, which was previously regarded as the primary factor. Negative trends were observed between MNDVI and all climatic factors of temperature in the total region. Precipitation was a critical factor in controlling the primary productivity in most alpine steppes [39–41], and was strongly influenced by water availability [42]. Our results are consistent with those of previous studies, which showed that aboveground net primary production in alpine steppes positively related to the mean annual precipitation [43,44]. In Yang’s studies [45], aboveground biomass in alpine grasslands increased with growing season precipitation, but temperature played a minor role in shaping the spatial patterns of aboveground biomass. They concluded that higher temperature caused an increased evaporation, and thus, a lower plant production [42]. Mao [46] analyzed the relationships between NDVI and the climatic factors in Northern Tibet, and demonstrated that the most important climatic factor affecting the interannual changes of NDVI was potential evapotranspiration. Yu [38] claimed that air temperature and precipitation, as two important climatic elements, influenced vegetation at the Lake Yamzho Yumco basin during summer. In other words, the different responses of vegetation NDVI to temperature and precipitation may be attributed to the differences between the temporal and spatial scales [47]. The MNDVI, an indicator of general vegetation condition, is jointly governed by precipitation and temperature; thus, its spatial variation is the combination of those of the two climate elements [48]. In fact, a single set of environmental variables cannot explain the spatial patterns of vegetation condition, and the combined effects of the meteorological, topographic, and soil factors were considered for further exploration [49]. The study on the relationship between climate change and vegetation dynamic in the Tibetan Plateau can provide a scientific basis for ecosystem management.
4. Conclusions
Based on the weather stations, the climatic factor of temperature produced a greater effect on MNDVI compared with other climatic factors in the northeastern plateau. AMP, AMXP, and AMPS produced a more important role in the Changtang alpine steppe region, South Qinghai alpine meadow steppe region, and East Qinghai and Qilian mountain steppe region. Vegetation water requirements have also been known to increase with temperature and expanding vegetation cover. The program of restoring grazing areas to grasslands was implemented. However, climate warming has continued in recent years. Temperature is not the limiting climatic factor for plant growth in the alpine grassland region, as well as in most of the alpine grassland in the arid or semi-arid region; thus, precipitation serves a more important role in these regions. However, the reason for the temperature control of MNDVI in the northeastern plateau must be explored in subsequent studies. On the physic-geographical region scaling, precipitation is an important factor that affects the vegetation index in the Ali desert and semi-desert region and Qaidam mountain desert region. Precipitation could be a limiting factor for the growth of desert grassland. In the East Qinghai and Qilian Mountain steppe regions, temperature and precipitation were determined as the important factors affecting vegetation. The combined effect of precipitation and temperature could induce a suitable environmental condition for plant growth. Precipitation variation promoted the vegetation cover in the entire region, whereas temperature variation adversely affected the Tibetan Plateau from 1980 to 2002. Therefore, we conclude that higher temperature causes an increased evaporation, and consequently, a lower plant production. Precipitation was a critical factor in controlling the primary productivity in most alpine grassland, and was strongly influenced by water availability. Thus, precipitation could be a limiting factor for vegetation growth, especially for the desert grassland. Meanwhile, several scholars demonstrated that climate change likewise caused a longer vegetation growth period and a higher vegetation cover ratio in the humid southern regions of the plateau, and that the vegetation required more water (similar to the water needs of the arid northern plateau). Therefore, a positive correlation exists between precipitation and the total vegetation cover at the Qinghai-Tibet Plateau due to increasing temperatures [29].
In this study, the considerable viewpoints on the climatic variations and vegetation activity in the Tibetan Plateau are highlighted. The complex characteristics of meteorological and biotic elements were caused by the complicated landforms and geomorphologic features, even within a small district. Our ability to realize such uncertainties could be enhanced by promoting the accuracy of remote sensing images and increasing the number of weather stations.
Acknowledgments
We thank the China Meteorological Data Sharing Service System and Western Data Center for providing meteorological data and AVHRR GIMMS NDVI dataset, respectively. This study was funded by the National Natural Science Foundation of China (31070405) and the Knowledge Innovation Program of the Chinese Academy of Sciences (KZCX2-XB3-08).
References
- Wang, G.X.; Bai, W.; Li, N.; Hu, H.C. Climate changes and its impact on tundra ecosystem in Qinghai-Tibet Plateau, China. Clim. Change 2011, 106, 463–482. [Google Scholar]
- Yu, H.Y.; Luedeling, E.; Xu, J.C. Winter and spring warming result in delayed spring phenology on the Tibetan Plateau. Proc. Natl. Acad. Sci. USA 2010, 107, 22151–22156. [Google Scholar]
- Wang, G.X.; Cheng, G.D. Eco-environmental changes and causative analysis in the source regions of the Yangtze and Yellow Rivers, China. Environmentalist 2000, 20, 221–232. [Google Scholar]
- Fan, J.W.; Shao, Q.Q.; Liu, J.Y.; Wang, J.B.; Harris, W.; Chen, Z.Q.; Zhong, H.P.; Xu, X.L.; Liu, G.R. Assessment of effects of climate change and grazing activity on grassland yield in the Three Rivers Headwaters Region of Qinghai–Tibet Plateau, China. Environ. Monit. Assess 2010, 170, 571–584. [Google Scholar]
- Gurgel, H.C.; Ferreira, N.J. Annual and interannual variability of NDVI in Brazil and its connections with climate. Int. J. Remote Sens 2003, 24, 3595–3609. [Google Scholar]
- Scharlemann, J.P.W.; Benz, D.; Hay, S.I.; Purse, B.V.; Tatem, A.J. Global data for ecology and epidemiology: A novel algorithm for temporal fourier processing MODIS data. PLoS ONE 2008, 3. [Google Scholar] [CrossRef]
- Wang, J.; Meng, J.J.; Cai, Y.L. Assessing vegetation dynamics impacted by climate change in the southwestern karst region of China with AVHRR NDVI and AVHRR NPP time-series. Environ. Geol 2008, 54, 1185–1195. [Google Scholar]
- Pettorelli, N.; Vik, J.O.; Mysterud, A.; Gaillard, J.M.; Tucker, C.J.; Stenseth, N.C. Using the satellite-derived NDVI to assess ecological responses to environmental change. Trends Ecol. Evol 2005, 20, 503–510. [Google Scholar]
- Milich, L.; Weiss, E. GAC NDVI images: Relationship to rainfall and potential evaporation in the grazing lands of the Gourma (northern Sahel) and in the croplands of the Niger-Nigeria border (southern Sahel). Int. J. Remote Sens 2000, 21, 261–280. [Google Scholar]
- Gao, Q.Z.; Wan, Y.F.; Xu, H.M.; Li, Y.; Jiangcun, W.Z.; Borjigid, A. Alpine grassland degradation index and its response to recent climate variability in Northern Tibet, China. Quat. Int 2010, 226, 143–150. [Google Scholar]
- Chu, D.; Lu, L.X.; Zhang, T.G. Sensitivity of Normalized Difference Vegetation Index (NDVI) to seasonal and inter-annual climate conditions in the Lhasa area, Tibetan Plateau, China. Arct. Antarct. Alp. Res 2007, 39, 635–641. [Google Scholar]
- Piao, S.L.; Fang, J.Y.; Liu, H.; Zhu, B. NDVI-indicated decline in desertification in China in the past two decades. Geophys. Res. Lett 2005, 32, L06402. [Google Scholar]
- Wang, X.D.; Li, M.H.; Liu, S.Z.; Liu, G.C. Fractal characteristics of soils under different land-use patterns in the arid and semiarid regions of the Tibetan Plateau, China. Geoderma 2006, 134, 56–61. [Google Scholar]
- Sun, H.L. The National Physical Atlas of China (in Chinese); Cartographic Publishing House: Beijing, China, 1999. [Google Scholar]
- Zhao, J. Physical Geography of China (in Chinese); Higher Education Press: Beijing, China, 1998. [Google Scholar]
- China Meteorological Data Sharing Service. Available online: http://cdc.cma.gov.cn/ (accessed on 11 May 2012).
- Environment and Ecological Science Data Center for West China. Available online: http://westdc.westgis.ac.cn/ (accessed on 21 May 2012).
- Tucker, C.J.; Pinzon, J.E.; Brown, M.E. Global Inventory Modeling and Mapping Studies; NA94apr15b.n11-VIg, 2.0, Global Land Cover Facility (04/15/1994); University of Maryland: College Park, MD, USA, 2004. [Google Scholar]
- Holben, B.N. Characteristics of maximum value composite images from temporal AVHRR dada. Int. J. Remote Sens 1986, 7, 1417–1434. [Google Scholar]
- Ma, M.G.; Dong, L.X.; Wang, X.M. Study on the dynamically monitoring and simulating the vegetation cover in Northwest China in the past 21 years. J. Glaciol. Geocryol 2003, 25, 232–236. [Google Scholar]
- Song, Y.; Ma, M.G. Study on the vegetation cover change in Northwest China based on SPOT VEGETATION data. J. Desert Res 2007, 27, 89–93. [Google Scholar]
- Yan, F.L.; Li, Z.; Shao, Y.; Lu, H.F.; Fan, X.T.; Ren, X. Monitoring of changes in land vegetation covers using NOAA / AVHRR NDVI datasets. J. Lanzhou Univ. (Nat. Sci.) 2003, 39, 90–94. [Google Scholar]
- Zhang, G.L.; Ouyang, H.; Zhang, X.Z.; Zhou, C.P.; Xu, X.L. Vegetation change and its responses to climatic variation based on eco-geographical regions of Tibetan Plateau. Geogr. Res 2010, 29, 2010–2016. [Google Scholar]
- Wang, B.L.; French, H.M. Climate controls and high-altitude permafrost, Qinghai-Xizang (Tibet) Plateau, China. Permafrost Periglac 1994, 5, 87–100. [Google Scholar]
- Zhao, L.; Ping, C.L.; Yang, D.Q.; Cheng, G.D.; Ding, Y.L.; Liu, S.Y. Changes of climate and seasonally frozen ground over the past 30 years in Qinghai–Xizang (Tibetan) Plateau, China. Glob. Planet. Change 2004, 43, 19–31. [Google Scholar]
- Tett, S.F.B.; Stott, P.A.; Allen, M.R. Causes of twentieth-century temperature change near the earth’s surface. Nature 1999, 399, 569–572. [Google Scholar]
- Zhang, J.H.; Yao, F.M.; Zheng, L.Y.; Yang, L.M. Evaluation of grassland dynamics in the Northern-Tibet Plateau of China using remote sensing and climate data. Sensors 2007, 7, 3312–3328. [Google Scholar]
- Yang, Y.H.; Piao, S.L. Variations in grassland vegetation cover in relation to climatic factors on the Tibetan Plateau. J. Plant Ecol 2006, 30, 1–8. [Google Scholar]
- Xu, X.K.; Chen, H.; Klevy, J. Spatiotemporal vegetation cover variations in the Qinghai-Tibet Plateau under global climate change. Chin. Sci. Bull 2008, 53, 915–922. [Google Scholar]
- Li, L.; Yang, S.; Wang, Z.Y.; Zhu, X.D.; Tang, H.Y. Evidence of warming and wetting climate over the Qinghai-Tibet Plateau. Arct. Antarct. Alp. Res 2010, 42, 449–457. [Google Scholar]
- Peng, J.F.; Gou, X.H.; Chen, F.H.; Fang, K.Y. Climate–growth relationships of Qilian juniper Sabina przewalskii in the Anyemaqen mountains, Tibet. Clim. Res 2010, 41, 31–40. [Google Scholar]
- Ding, M.J.; Zhang, Y.L.; Liu, L.S.; Zhang, W.; Wang, Z.F.; Bai, W.Q. The relationship between NDVI and precipitation on the Tibetan Plateau. J. Geogr. Sci 2007, 17, 259–268. [Google Scholar]
- Zheng, D. The system of physico-geographical regions of the Qinghai-Xizang (Tibet) Plateau. Sci. China D 1996, 39, 410–417. [Google Scholar]
- Dai, S.P.; Zhang, B.; Wang, Q.; Ma, Z.H.; Zou, Y.; Zhang, Y.N. Variation in grassland vegetation NDVI and its ten-day response to temperature and precipitation in the Qilian Mountains. Resour. Sci 2010, 32, 1769–1776. [Google Scholar]
- Chen, Q.; Zhou, Q.; Zhang, H.F.; Liu, F.G. Spatial disparity of NDVI response in vegetation growing season to climate change in the Three-River Headwaters region. Ecol. Environ. Sci 2010, 19, 1284–1289. [Google Scholar]
- Zhu, Y.; Peng, G.X.; Wang, Z.; Wang, J.S.; Li, D. The trend of NDVI during the past 30 years in Linzhi Area, Tibet Autonomous Region. J. Northwest For. Univ 2011, 26, 69–74. [Google Scholar]
- Potter, C.S.; Brooks, V. Global analysis of empirical relations between annual climate and seasonality of NDVI. Int. J. Remote Sens 1998, 19, 2921–2948. [Google Scholar]
- Yu, S.M.; Liu, J.S.; Yuan, J.G. Vegetation change of Yamzho Yumco Basin in Southern Tibet based on SPOT-VGT NDVI. Spectrosc. Spect. Anal 2010, 30, 1570–1574. [Google Scholar]
- Hu, Z.M.; Yu, G.R.; Fan, J.W.; Zhong, H.P.; Wang, S.Q.; Li, S.G. Precipitation-use efficiency along a 4,500-km grassland transect. Global Ecol. Biogeogr 2010, 19, 842–851. [Google Scholar]
- Huxman, T.E.; Smith, M.D.; Fay, P.A.; Knapp, A.K.; Shaw, M.R.; Loik, M.E.; Smith, S.D.; Tissue, D.T.; Zak, J.C.; Weltzin, J.F.; et al. Convergence across biomes to a common rain-use efficiency. Nature 2004, 429, 651–654. [Google Scholar]
- O’Connor, T.G.; Haines, L.M.; Snyman, H.A. Influence of precipitation and species composition on phytomass of a semi-arid African grassland. J. Ecol 2001, 89, 850–860. [Google Scholar]
- Epstein, H.E.; Lauenroth, W.K.; Burke, I.C. Effect of temperature and soil texture on ANPP in the US Great Plains. Ecology 1997, 78, 2628–2631. [Google Scholar]
- Xu, B.C.; Gichuki, P.; Shan, L.; Li, F.M. Aboveground biomass production and soil water dynamics of fourleguminous forages in semiarid region, Northwest China. S. Afr. J. Bot 2006, 72, 507–516. [Google Scholar]
- Bai, Y.F.; Li, L.H.; Wang, Q.B.; Zhang, L.X.; Zhang, Y.; Chen, Z.Z. Changes in plant species diversity and productivity along gradients of precipitation in the Xilin river basin, Inner Mongolia. Acta Phytoecologica Sin 2000, 24, 667–673. [Google Scholar]
- Yang, Y.H.; Fang, J.Y.; Pan, Y.D. Aboveground biomass in Tibetan grasslands. J. Arid Environ 2009, 73, 91–95. [Google Scholar]
- Mao, F.; Lu, Z.G.; Zhang, J.H.; Hou, Y.Y. Relations between AVHRR NDVI and climate factors in Northern Tibet in recent 10 years. Acta Ecol. Sin 2007, 27, 3198–3205. [Google Scholar]
- Cui, L.L.; Shi, J. Temporal and spatial response of vegetation NDVI to temperature and precipitation in eastern China. J. Geogr. Sci 2010, 20, 163–176. [Google Scholar]
- Zhang, W.J.; Gao, Z.Q. Spatial variation of water/ thermal elements and NDVI with altitudes in central and eastern Tibetan Plateau. Geogr. Res 2006, 25, 878–886. [Google Scholar]
- Sun, J.; Cheng, G.W.; Li, W.P. Meta-analysis of relationships between environmental factors and aboveground biomass in the alpine grassland on the Tibetan Plateau. Biogeosciences 2013, 10, 1707–1715. [Google Scholar]
Figure 1.
Location of the Tibetan plateau in southwestern China and the spatial distribution of meteorological stations across the plateau. Climatic documents from the 1950s were used for the analysis in this study.
Figure 1.
Location of the Tibetan plateau in southwestern China and the spatial distribution of meteorological stations across the plateau. Climatic documents from the 1950s were used for the analysis in this study.

Figure 2.
Annual trend slopes of (A) AMT, (B) AMXT, (C) AMNT, (D) AMTS, (E) AAT, (F) AMP, (G) AMXP, and (H) AMPS from 1960 to 2002. Black solid circles represent the slopes of all observatory stations.
Figure 2.
Annual trend slopes of (A) AMT, (B) AMXT, (C) AMNT, (D) AMTS, (E) AAT, (F) AMP, (G) AMXP, and (H) AMPS from 1960 to 2002. Black solid circles represent the slopes of all observatory stations.
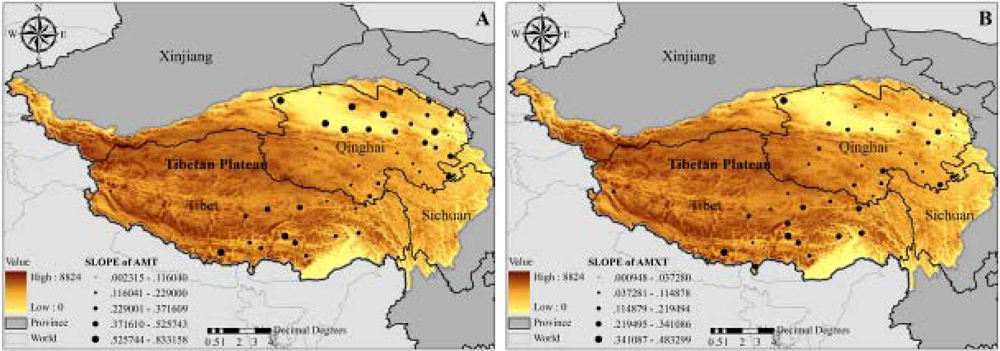

Figure 3.
Variations of (A) AMT, (B) AMXT, (C) AMNT, (D) AMTS, (E) AAT, (F) AMP, (G) AMXP, and (H) AMPS from 1960 to 2002. The mean values of these factors from all observatory stations were used to measure the changed trends. The straight solid lines indicate the trendline of climatic factors.
Figure 3.
Variations of (A) AMT, (B) AMXT, (C) AMNT, (D) AMTS, (E) AAT, (F) AMP, (G) AMXP, and (H) AMPS from 1960 to 2002. The mean values of these factors from all observatory stations were used to measure the changed trends. The straight solid lines indicate the trendline of climatic factors.
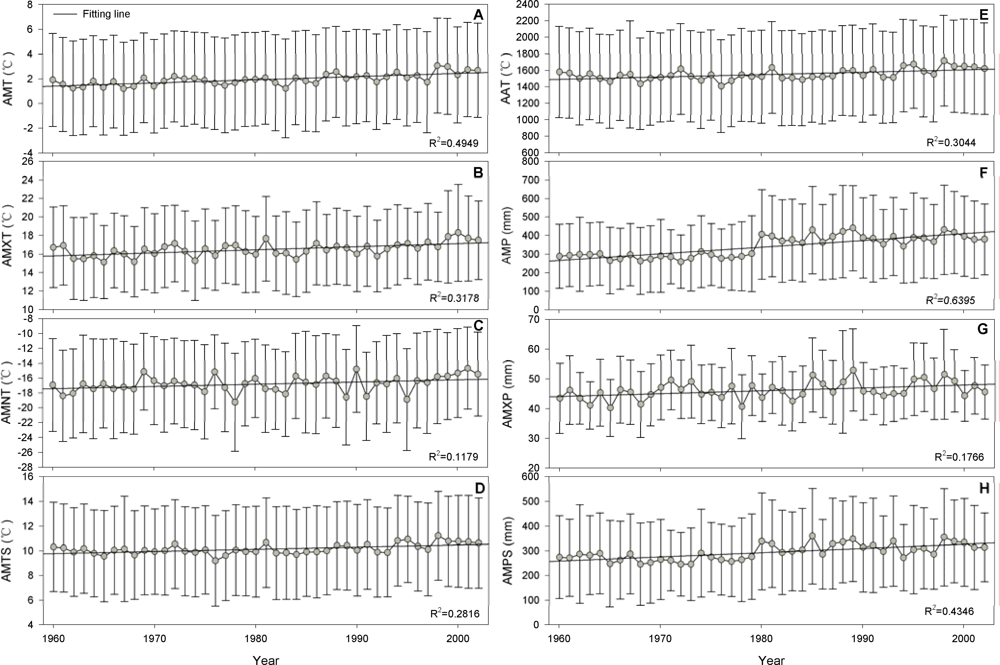
Figure 4.
The simulated trend of (A) MNDVI and its changed scope of percentage in comparison with (B) the average MNDVI in the Tibetan Plateau from 1982 to 2006. The black solid circles denote the variations of A and B from 72 observatory stations.
Figure 4.
The simulated trend of (A) MNDVI and its changed scope of percentage in comparison with (B) the average MNDVI in the Tibetan Plateau from 1982 to 2006. The black solid circles denote the variations of A and B from 72 observatory stations.
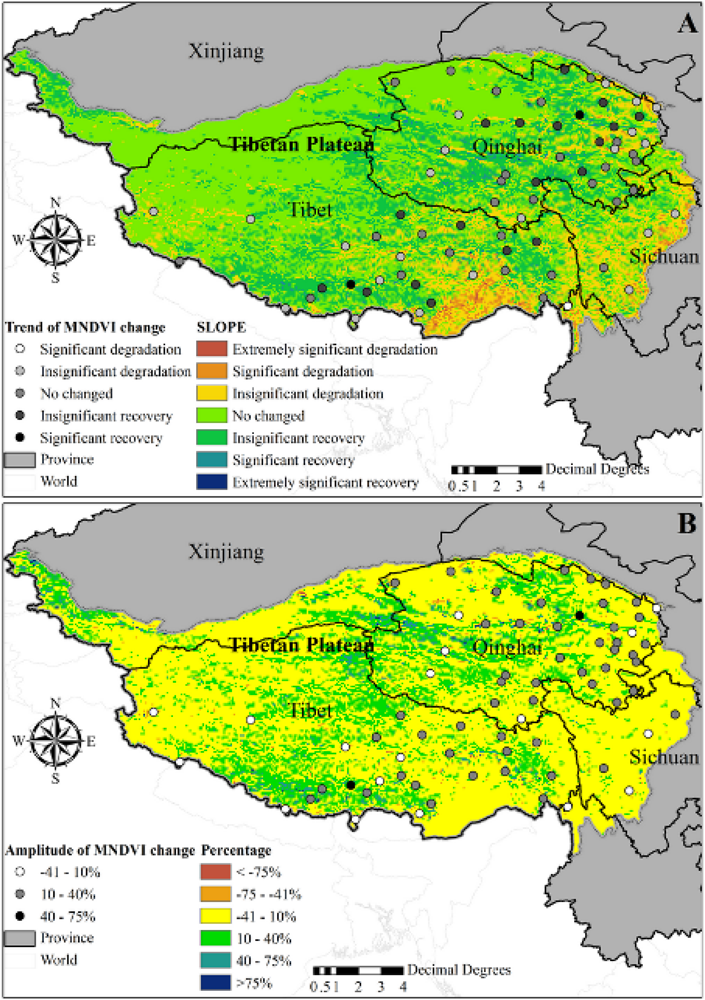
Figure 5.
Percentage of coefficients between MNDVI and climatic factors based on each observatory station in Tibet Plateau from 1982 to 2002.
Figure 5.
Percentage of coefficients between MNDVI and climatic factors based on each observatory station in Tibet Plateau from 1982 to 2002.

Figure 6.
Spatial distributions of physico-geographical regions.
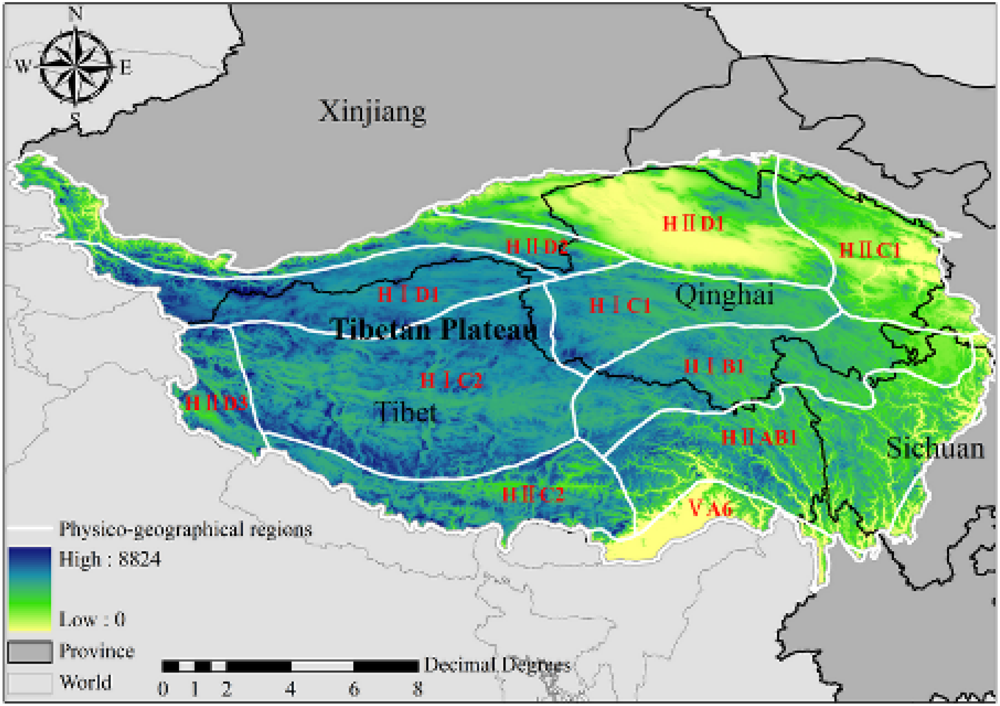
Figure 7.
Correlation coefficients between MNDVI and climatic factors in the entire region (all the observatory stations) in the Tibetan Plateau from 1982 to 2002. (A) and (B) represent the relationship of MNDVI with AMP and AMPS, respectively. The dark red solid line denotes the fitting curve.
Figure 7.
Correlation coefficients between MNDVI and climatic factors in the entire region (all the observatory stations) in the Tibetan Plateau from 1982 to 2002. (A) and (B) represent the relationship of MNDVI with AMP and AMPS, respectively. The dark red solid line denotes the fitting curve.


| Items | Abbreviation | In Detail |
|---|---|---|
| Category | AMT | Annual mean temperature |
| AMXT | Annual maximum temperature | |
| AMNT | Annual minimum temperature | |
| AMTS | Annual mean temperature during growing season | |
| AAT | Annual accumulated temperature | |
| AMP | Annual mean precipitation | |
| AMXP | Annual maximum precipitation | |
| AMPS | Annual mean precipitation during growing season |
Table 2.
Classified result of maximum Normalized Difference Vegetation Index (MNDVI) change simulated from 1982 to 2006.
| Items | The Trend of MNDVI Change | Status |
|---|---|---|
| Category | Slope ≤ −0.0091 | Extremely significant degradation |
| −0.0091 ≤ Slope ≤ −0.0046 | Significant degradation | |
| −0.0045 ≤ Slope ≤ −0.0010 | Insignificant degradation | |
| −0.0009 ≤ Slope ≤ 0.0009 | No changed | |
| 0.0010 ≤ Slope ≤ 0.0045 | Insignificant recovery | |
| 0.0046 ≤ Slope ≤ 0.0090 | Significant recovery | |
| Slope ≥ 0.0090 | Extremely significant recovery |
Table 3.
Correlation coefficients of MNDVI with climatic factors at the physico-geographical regions of the Tibetan Plateau.
| Code | Physico-Geographical Region | AMT | AMXT | AMNT | AMTS | AAT | AMP | AMXP | AMPS |
|---|---|---|---|---|---|---|---|---|---|
| HID1 | North Slope of Kunlun Mountain desert region | ★ | ★ | ★ | ★ | ★ | ★ | ★ | ★ |
| HIID2 | Kunlun alpine desert region | ★ | ★ | ★ | ★ | ★ | ★ | ★ | ★ |
| HIID1 | Qaidam mountain desert region | 0.3399 | 0.0044 | 0.1868 | 0.0836 | 0.0834 | 0.5415 | 0.428 | 0.5445 |
| HIID3 | Ali desert and semi-desert region | 0.4288 | 0.1698 | 0.2234 | 0.1586 | 0.1579 | 0.3691 | 0.2324 | 0.0539 |
| HIC2 | Changtang alpine steppe region | 0.0771 | 0.4628 | 0.0744 | 0.5047 | 0.5057 | 0.3451 | 0.0607 | 0.345 |
| HIC1 | South Qinghai alpine meadow steppe region | 0.1231 | 0.0476 | 0.0127 | 0.0786 | 0.0789 | 0.1542 | 0.0053 | 0.0906 |
| HIIC1 | East Qinghai and Qilian mountain steppe region | 0.1244 | 0.2219 | 0.1154 | 0.1713 | 0.1715 | 0.2229 | 0.0142 | 0.1911 |
| HIB1 | Golog-Nagchu alpine scrub meadow region | 0.0009 | 0.0051 | 0.0034 | 0.0091 | 0.0091 | 0.0662 | 0.0046 | 0.036 |
| HIIC2 | South Tibet mountain shrub steppe region | 0.0019 | 0.0049 | 0.1677 | 0.1308 | 0.1308 | 0.2303 | 0.0217 | 0.187 |
| HIIAB1 | West Sichuan and East Tibet coniferous forest mountain region | 0.0009 | 0.0000 | 0.0068 | 0.0018 | 0.002 | 0.0011 | 0.0056 | 0.0244 |
| VA6 | South slope of the eastern Himalayas evergreen broad-leafed forest region | ★ | ★ | ★ | ★ | ★ | ★ | ★ | ★ |
Note: The star “★” represents the missing value and the bold numbers represent the higher value of coefficients.
Share and Cite
MDPI and ACS Style
Sun, J.; Cheng, G.; Li, W.; Sha, Y.; Yang, Y. On the Variation of NDVI with the Principal Climatic Elements in the Tibetan Plateau. Remote Sens. 2013, 5, 1894-1911. https://doi.org/10.3390/rs5041894
AMA Style
Sun J, Cheng G, Li W, Sha Y, Yang Y. On the Variation of NDVI with the Principal Climatic Elements in the Tibetan Plateau. Remote Sensing. 2013; 5(4):1894-1911. https://doi.org/10.3390/rs5041894
Chicago/Turabian StyleSun, Jian, Genwei Cheng, Weipeng Li, Yukun Sha, and Yunchuan Yang. 2013. "On the Variation of NDVI with the Principal Climatic Elements in the Tibetan Plateau" Remote Sensing 5, no. 4: 1894-1911. https://doi.org/10.3390/rs5041894