Article

A Sample-Based Forest Monitoring Strategy Using Landsat, AVHRR and MODIS Data to Estimate Gross Forest Cover Loss in Malaysia between 1990 and 2005

1
Geographic Information Science Center of Excellence, South Dakota State University, 1021 Medary Ave., Wecota Hall, Box 506B, Brookings, SD 57007, USA
2
SUNY College of Environmental Science and Forestry, 1 Forestry Drive, Syracuse, NY 13210, USA
3
Department of Geographical Sciences, University of Maryland, College Park, MD 20742, USA
*
Author to whom correspondence should be addressed.
Remote Sens. 2013, 5(4), 1842-1855; https://doi.org/10.3390/rs5041842
Submission received: 1 December 2012 / Revised: 1 April 2013 / Accepted: 9 April 2013 / Published: 15 April 2013
(This article belongs to the Special Issue Advances in Remote Sensing of Forestry)

Abstract

:
Insular Southeast Asia is a hotspot of humid tropical forest cover loss. A sample-based monitoring approach quantifying forest cover loss from Landsat imagery was implemented to estimate gross forest cover loss for two eras, 1990–2000 and 2000–2005. For each time interval, a probability sample of 18.5 km × 18.5 km blocks was selected, and pairs of Landsat images acquired per sample block were interpreted to quantify forest cover area and gross forest cover loss. Stratified random sampling was implemented for 2000–2005 with MODIS-derived forest cover loss used to define the strata. A probability proportional to x (πpx) design was implemented for 1990–2000 with AVHRR-derived forest cover loss used as the x variable to increase the likelihood of including forest loss area in the sample. The estimated annual gross forest cover loss for Malaysia was 0.43 Mha/yr (SE = 0.04) during 1990–2000 and 0.64 Mha/yr (SE = 0.055) during 2000–2005. Our use of the πpx sampling design represents a first practical trial of this design for sampling satellite imagery. Although the design performed adequately in this study, a thorough comparative investigation of the πpx design relative to other sampling strategies is needed before general design recommendations can be put forth.

1. Introduction

Humid tropical forests are mostly found in Brazil, Congo, Indonesia and Malaysia [1]. Although humid tropic forests cover less than ten percent of the earth’s land area, they contain some of the most bio-diverse terrestrial ecosystems [13]. Deforestation is a major concern for many developing countries [4,5]. A large amount of humid tropical forest in South Asia has been lost due to one of the world’s highest rates of deforestation since the 1980s including Malaysia and Indonesia [6]. Land use changes through agriculture expansion, commercial logging, plantation development, mining and road building are among many factors in causing the loss of valuable tropical forest cover [7]. Malaysia encompasses 32.9 million ha of land area and in 2005 had a population of about 25 million [8,9]. Malaysia has one of the richest humid tropical forests in the world, containing around 10% of all known plant species [10]. The rich flora of Malaysia harbors a variety of animal species, including the extremely rare Sumatran rhinoceros [9,11]. The states of Sabah and Sarawak in the island of Borneo have the majority of the country’s forest [9].
Accurate estimates of forest cover extent and loss are important to assess environmental sustainability [2], and satellite data offer a viable option for monitoring forest cover dynamics over time. Several studies have demonstrated the utility of remote sensing technology for mapping forest cover loss [1,2,7,1217]. Options for estimating forest cover change include wall-to-wall mapping and sampling. Achard et al. [18] was a groundbreaking effort demonstrating the efficacy of estimating forest cover change using sampling of satellite imagery. Subsequently, several sampling-based assessments of forest change have been completed [1,13,15,16,1923]. The sampling method implemented for Malaysia builds on previous studies in Indonesia [15] and in Brazil [24] by using national-scale forest cover loss maps to increase the probability of including areas of forest cover loss in the sample. By targeting forest loss directly in the allocation of sample units to strata, the method follows new fronts of forest disturbance, ensuring that displacement, or leakage, can be accounted for in an efficient and accurate manner in the forest cover loss estimates.
The objective of this study is to quantify gross forest cover loss in Malaysia from 1990 to 2000 and 2000 to 2005. A decadal time step was used for 1990 to 2000 due to limited data acquisitions of Landsat 5 during this period. Beginning in 1999, Landsat 7 data have featured a systematic acquisition strategy, ensuring regular coverage of the terrestrial land surface. This improved data availability allows for more frequent updates and the ability to quantify change over the 2000 to 2005 period. For this analysis, forest is defined as >25% canopy cover of trees and tree height ≥ 5 m which includes intact forest plantations, and forest regrowth [1,25]. Gross forest cover loss is defined as a conversion from forest cover to non-forest cover during the time interval studied. Landsat imagery has the capacity to provide a strong, quantifiable signal of both forest cover and its loss via stand-replacement disturbance. We did not attempt to quantify forest cover gain because this process is more gradual and would require different methods. Consequently, our forest change results represent only one component of the forest change dynamic, that being gross forest cover loss.

2. Methods

Malaysia was partitioned into 958 non-overlapping 18.5-km × 18.5-km blocks to create the sampling frame and sampling units for this study (Figure 1). A block was required to have at least 50% of its area covered by land or inland water to be included in the population. The same partition of blocks was used for both the 1990–2000 and 2000–2005 time periods, but the samples for the two periods were selected independently (see Section 2.2).

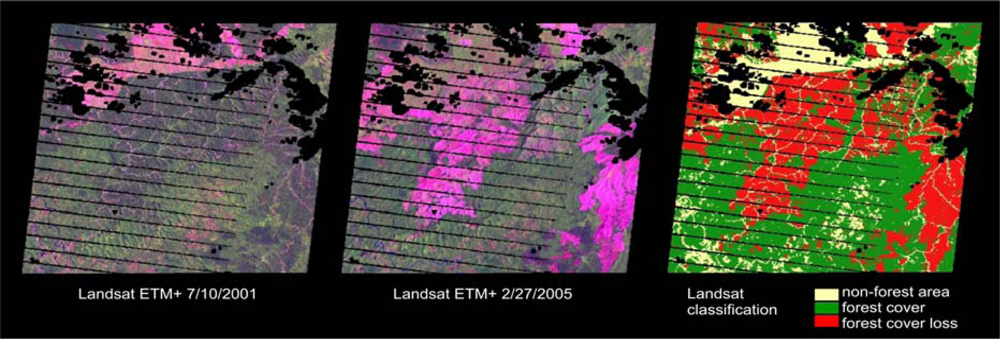
2.1. Data and Forest Loss Characterization

Three satellite sensors were employed in this study, the Advanced Very High Resolution Radiometer (AVHRR), the Moderate Resolution Imaging Spectroradiometer (MODIS), and Landsat. The AVHRR and MODIS data were used as ancillary data at the sample selection stage. The MODIS data were used to define strata for the 2000–2005 stratified random sampling design and the AVHRR data were used to determine the probability of inclusion of each block in the 1990–2000 sampling design. The Landsat imagery was used to quantify forest cover and gross forest cover loss for each sample block during each time period. Thus, Landsat is the basis for the measurement of forest cover and forest cover loss for both time periods.
AVHRR and MODIS forest cover loss indicator maps for 1990–2000 and 2000–2005, respectively, were used to identify locations of likely forest cover loss in Malaysia. The AVHRR forest loss indicator maps for 1990–2000 were created using 8-km vegetation continuous field (VCF) tree cover data [26]. An image differencing approach was used to estimate VCF percent tree cover change between 1990 and 2000. MODIS bands 1 and 2 at 250 m, band 7 at 500 m and Land Surface Temperature (LST) at 1 km were used as inputs to create the 2000–2005 forest loss indicator maps. Supervised mapping methods using a decision tree algorithm were applied to MODIS data for 2000–2005 to produce per pixel MODIS forest loss indicator maps for Malaysia. For each time period, the per pixel forest loss map data were then aggregated to the block level to obtain percent area of forest cover loss for each of the 958 blocks for each of the two time periods. The AVHRR and MODIS forest cover loss maps were used to enhance the efficiency of the sampling designs. The more accurate these indicator maps are, the greater the potential for reducing the standard error of the gross forest cover loss estimates based on the Landsat data. However, it is important to recognize that the AVHRR and MODIS maps are not intended as end products, but rather as contributors to the effectiveness of sample-based estimation of gross forest cover loss.
The measurements of forest cover and gross forest cover loss for each sample block were derived from Landsat. Landsat images from the Global Land Survey data set [27] were obtained from the USGS website ( http://glovis.usgs.gov/). For each sample block a pair of Landsat images corresponding to the start date and end date of each time period was obtained. Forest cover and gross forest cover loss for each sample block were quantified using a supervised decision tree classifier [28] following the protocol established by Hansen et al. [1,15]. Specifically, for each Landsat image, clouds and shadow cover were removed and the cloud free data were then interpreted in the delineation of training data. An example block is shown in Figure 2. For each era (1990–2000 and 2000–2005), training data were used to classify the time 1 reference image into forest and non-forest. Using the time 1 forest extent map, training data were delineated and used to classify forest cover loss. In this manner, per block forest cover extent was mapped independently for the 1990 and 2000 time 1 reference images. Multi-date inputs were used to directly map forest cover loss between 1990 and 2000 and 2000 and 2005.
Each sample block was characterized by two interpreters, and manual editing performed where required. The same analysts were used for all block characterizations with N. Giree performing the baseline work and P. Potapov quality assessment and corrections where deemed necessary. The quantities obtained for each sample block included the area under cloud cover, area of useable data for the classification (i.e., difference between block area and cloud area), non-forest area, forest area, and area of gross forest cover loss. Percent forest area and percent gross forest cover loss were calculated relative to the area of useable data for the block (×100%). It was assumed that areas for which the Landsat imagery were not useable were “missing at random” (i.e., missing areas were not disproportionately associated with forest cover or gross forest cover loss) so that the percent forest area and percent gross forest cover loss computed from the useable Landsat data could be extrapolated to the whole sample block. Hansen et al. [1] evaluated this “missing at random assumption” for the humid tropics as a whole and found this assumption to be plausible. For the 25 sample blocks in 1990–2000, the median percent useable data was 88% (minimum of 61%) and for the 35 sample blocks in 2000–2005, the median percent useable data was 80% (minimum 25%).

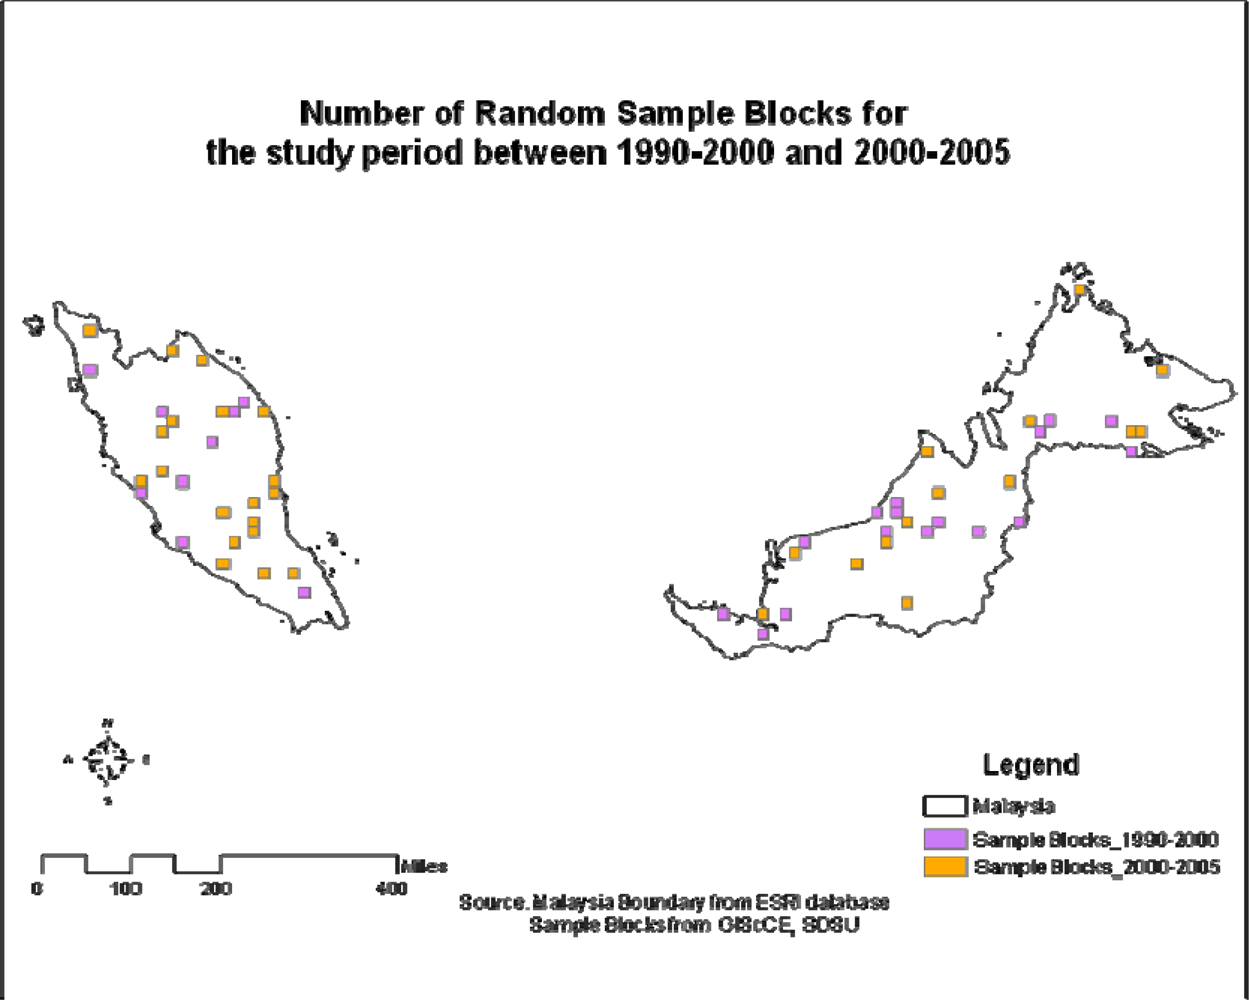
2.2. Sampling Design

A stratified random sample was selected for the 2000–2005 time period. This sampling design was chosen because an existing sample of 15 blocks had previously been obtained by Hansen et al. [1] as part of a global humid tropical forest biome study. Because of the considerable effort required to obtain the Landsat-derived forest cover area and gross forest cover loss per sample block, it was decided to retain this existing sample of 15 blocks and to augment it by an additional 20 sample blocks from Malaysia selected by a stratified protocol described by Stehman et al. [29]. The strata for the 2000–2005 design were defined by Hansen et al. [1] and were based on MODIS-derived percent area of forest cover loss, as well as data from the Intact Forest Landscapes project (IFL, defined as an unfragmented area of at least 500 km2 of forest minimally influenced by human economic activity) [30] and the VCF tree cover map [26]. Each of the 958 blocks was assigned to one of the following five non-overlapping strata: (1) 0% MODIS forest cover loss but with greater than 25% IFL or less than 20% VCF tree cover (these were blocks expected to show virtually no change); (2) MODIS forest cover loss of 0–2% but not already assigned to stratum 1; (3) MODIS forest cover loss of 3–9%; (4) MODIS forest cover loss of >9%; and (5) the two highest MODIS change blocks (a “certainty” stratum). The augmented sample of 20 additional blocks was chosen to increase the sample sizes in strata 2, 3, and 4 to create the final Malaysia sample of 35 blocks for 2000–2005.
The 1990–2000 sampling design was not constrained to take advantage of an existing sample. The thought process we applied leading to the choice of a design for the 1990–2000 Malaysia sample illustrates some of the issues that must typically be considered when making a sampling design decision. For a single purpose (i.e., one country, one time period) sampling design for estimating forest change, a desirable design criterion is to increase the probability of including forest loss areas in the sample. Stratified sampling is often used to achieve this criterion (see [31] for a review of applications). However, this criterion can also be achieved by an “inclusion probability proportional to x” (πpx) design in which the inclusion probabilities (πu) are proportional to an auxiliary variable (typically denoted as x). An “inclusion probability” is defined as the probability of including a particular block in the sample [32]. In general, an auxiliary variable is a variable that is not of interest for estimation, but may contribute to reducing the standard error for estimates of the target variables that are of interest.
In our application, the target variable is gross forest cover loss as determined from Landsat imagery, and the auxiliary variable for 1990–2000 is forest cover loss derived from AVHRR. By making the inclusion probabilities related to AVHRR-based forest cover loss, the sample targets areas in which loss is anticipated and therefore increases the likelihood that areas of forest loss will be included in the sample. To our knowledge, this is the first application of a πpx sampling design (where x is a measure of forest cover loss) to satellite-based forest monitoring [31].
A second major consideration in the choice of sampling design is to assess how amenable the resulting sample would be for “model-assisted estimation”, where a common example of a model-assisted estimator is a regression estimator [33,34]. A survey sampling regression estimator can be used to reduce the standard error of an estimate by taking advantage of an auxiliary variable and a model associating that variable to the target variable. The previous work of Hansen et al. [1,15,16] and Potapov et al. [23] used regression estimators to advantage within a stratified sampling design. However, the regression estimator requires a sample size of 25 to 30 per stratum to ensure that the estimator is not biased [32]. Because cost and practical limitations were expected to limit the sample size for Malaysia for 1990–2000, a disadvantage of implementing a stratified design was that this small sample size would yield only a small number of sample blocks per stratum. Consequently, we chose not to use a stratified design but instead opted for the πpx design, which allowed for increasing the probability of including high forest loss blocks without having to constrain the sample selection to strata. The stratified design implemented for 2000–2005 suffers from the problem that sample size per stratum is too small to safely support use of a regression estimator, but the choice of the stratified design for 2000–2005 was strongly motivated by the cost-savings gained by using the existing 15 sample blocks from the previous Hansen et al. [1] study.
To implement the πpx design in Malaysia for 1990–2000, each block was assigned an inclusion probability proportional to the square root of AVHRR-derived forest cover loss. The inclusion probability of each block was chosen to be proportional to the square root of AVHRR loss instead of proportional to AVHRR loss because the former reduces the variation of the inclusion probabilities over the set of all blocks and this generally decreases standard errors of the estimates. Because some blocks had AVHRR forest loss of 0, these blocks were assigned an arbitrarily low value of loss of 0.25 to give these blocks a small, but non-zero probability of being included in the sample. To summarize the data obtained using AVHRR, if zu = percent AVHRR forest cover loss for block u, then
x u = { z u if z u 0 0.25 i f z u = 0
The randomized systematic selection Procedure 2 of Brewer and Hanif [35] was implemented to select the sample such that the inclusion probability for block u (πu) was proportional to xu. Given the realized sample size of n = 25 blocks, the inclusion probability for block u was
π u = 25 x u / T x
where Tx is the sum of xu for all 958 blocks in Malaysia.

2.3. Estimation

The formulas for estimating gross forest cover loss depend on the sampling design. For either sampling design, define yu as the target variable expressed as a percent of sample block u (i.e., yu could be percent area of forest cover or percent area of gross forest cover loss derived from Landsat). For the πpx design used for 1990–2000, the per-block mean percent of yu is estimated by a ratio estimator
R ^ = Y ^ / N ^
where
Y ^ = sample w u y u
is the estimated total of the yu for the population,
N ^ = sample w u
is the estimated total number of blocks, wu = 1/πu (see Equation (2)), and the summation is over all sampled blocks. The unequal inclusion probabilities induced by the πpx design are accounted for by the weights wu = 1/πu used in Equations (4) and (5). The estimated variance of the ratio estimator (Equation (3)) for the πpx design is
V ^ ( R ^ ) = 1 N ^ 2 j s j 1 i s ( π i + π j 2 ) 2 ( n 1 ) ( y i R ^ ) π i ( y j R ^ ) π i
and the standard error is the square root of the estimated variance. This variance estimator uses an approximation to the pairwise inclusion probabilities for the randomized systematic implementation of the πpx sampling design [36], where a pairwise inclusion probability is defined as the probability that a particular pair of blocks would be jointly included in the sample.
For the stratified sampling design implemented for 2000–2005, the mean percent area of forest cover or gross forest cover loss is estimated by
Y ¯ ^ = ( 1 / N ) h N h y ¯ h
where Nh is the number of blocks in stratum h, h is the sample mean for stratum h, N = 958 is the total number of blocks in Malaysia, and the summation is over all strata. The variance of Y ¯ ^is estimated by
V ^ ( Y ¯ ^ ) = ( 1 / N 2 ) h N h 2 ( 1 n h / N h ) s h 2 / n h ,
where s h 2 is the sample variance of yu for stratum h and nh is the sample size for stratum h. The standard error is the square root of the estimated variance.
For both designs, the estimated mean per block can be converted to an estimate of area by multiplying the estimated mean (Equation (3) or Equation (7)) by the land area of Malaysia, which is 32.9 Mha. The standard error of the estimated area is the standard error of the estimated mean multiplied by the land area of Malaysia. The standard errors in all cases are defined in the context of design-based inference [32] meaning that the standard errors quantify the variation over all possible samples that might have been selected by the design used. Variation in the Landsat-derived quantification of gross forest cover loss is not taken into account in these standard error formulas (i.e., if the measurement protocol were to be repeated for each sample block, the fact that the same quantity may not be reproduced each time is not taken into account in the standard error estimates).
The estimates for the two time periods are comparable because a common measurement protocol was uniformly applied to the sample blocks from both eras to quantify gross forest cover loss from Landsat. The population parameters of interest (i.e., annual rate of gross forest cover loss) are determined by the measurement protocol, not the sampling design. The estimators used for both sampling designs are consistent estimators of the population parameter, where a “consistent” estimator may be thought of as an estimator that does in fact estimate the target parameter of interest (see [32] for a formal, rigorous definition). As noted by [37] the Horvitz-Thompson estimator (of which Equation (7) is a special case) and continuous functions of Horvitz-Thompson estimators (of which Equation (3) is a special case) are consistent estimators. Consequently, the comparison of the gross forest cover loss area estimates for the two time periods is justified by the fact that consistent estimators are being used to estimate parameters that are defined by the common Landsat-based measurement protocol applied to both eras. The fact that different sampling designs were used in the two eras would lead to different standard errors for the estimated areas, but the estimated annual rates are still comparable.

3. Results and Discussion

The estimated annual mean rate of gross forest cover loss for Malaysia in 2000–2005 of 0.64 Mha/yr in 2000–2005 was higher than the estimated annual loss of 0.42 Mha/yr for 1990–2000 (Table 1). The 95% confidence interval for the mean annual loss during 1990–2000 was 0.26–0.58 Mha/yr whereas the 95% confidence interval for 2000–2005 was 0.42–0.86 Mha/yr. Although the estimates suggest an increase in the annual rate of loss during 2000–2005 relative to 1990–2000, the overlap of these confidence intervals indicates that the annual rates are not distinguishable from sampling variation (i.e., not statistically separable).
The results for Malaysia can be used to compare the relative standard errors of the estimates obtained from the two sampling designs, where relative standard error is defined as the standard error of the estimated annual rate of forest loss divided by the estimated annual rate of loss. The relative standard error was 0.18 for the πpx design implemented for 1990–2000 and 0.17 for the stratified design for 2000–2005. Therefore, the relative standard error of the πpx design was similar to that of the stratified design even though the sample size of the stratified design was larger (n = 35) than that of the πpx design (n = 25).

3.1. Discussion of Trends in Forest Cover Loss between Malaysia and Indonesia

The forest monitoring strategy implemented for Malaysia employed the same Landsat-based measurement protocol used by [15] to quantify gross forest cover loss for Indonesia. Consequently, the estimates for Malaysia can be compared to those for Indonesia to provide a regional comparison of forest cover dynamics of these two countries within the humid tropics of Southeast Asia. This comparison demonstrates an important feature of an effective monitoring strategy, the ability to readily compare different regions over multiple time periods. Indonesia has experienced a high rate of deforestation, with intensive exploitation beginning in the 1970s [7,18,38]. According to [39], forest clearing rates in Indonesia during the 1990s were among the highest, where it ranked second to Brazil in terms of forest cover loss [15]. From [15], the estimated annual gross forest cover loss for Indonesia was 0.71 Mha/yr during 2000–2005, an annual rate similar to that estimated for Malaysia during the same time period (Table 2). However, the 1990–2000 estimated annual loss of 1.78 Mha/yr for Indonesia was much higher than the 1990–2000 annual rate for Malaysia, and the difference between Indonesia and Malaysia exceeded the variation attributable to sampling (Table 2). Thus while the annual rate of forest cover loss in Malaysia remained relatively stable for the two time periods, the annual rate of loss for Indonesia declined dramatically in 2000–2005 relative to 1990–2000.

3.2. Discussion of Sampling Design

Two sampling designs were used in the assessment of Malaysia. The stratified random design implemented for 2000–2005 added 20 sample blocks to an existing sample of 15 blocks in Malaysia. Stratified random sampling is often implemented in practice when satellite imagery is used as the basis of a land-cover monitoring strategy [31] and the ability to augment an existing global stratified sample to increase the sample size within a country is an attractive feature of stratified sampling [29]. However, the stratified design for Malaysia turned out to be ineffective relative to simple random sampling. Based on the data from the stratified design, it is possible to estimate the standard error that would have resulted from simple random sampling [40]. The standard error for simple random sampling would have been 80% of the magnitude of the standard error of the stratified design indicating that the choice of strata or the sample size allocation to strata was not effective. This is not necessarily a surprising result given that the strata and sample size allocation used for Malaysia were constrained to align with the stratified design implemented to estimate global humid tropical forest cover loss [1].
Within Malaysia, the area of forest cover loss detected by Landsat was much higher than what was detected by the MODIS forest cover loss map used to create the strata (Table 3). In particular, considerable forest cover loss was detected by Landsat in the first two strata which, according to the MODIS-based stratification, should have contained very little loss. These results suggest that Malaysia had a pervasive dynamic of small forest clearings that were not detected at the coarse-scale change threshold specified for the MODIS stratification variable, but were detectable by Landsat. Further, the strata defined for the humid tropical forest biome [1] resulted in nearly 68% of the 958 Malaysia blocks falling within stratum 2. Given that the large number of blocks (Nh) and high standard deviation of Landsat-derived forest loss (Table 3) in stratum 2 resulted in nearly 94% of the variance for the estimated total forest loss being attributable to stratum 2, the preferred design would have been to allocate all of the augmented sample to stratum 2. Of course, good estimates of the stratum-specific standard deviations of Landsat-derived forest loss were not available at the time the augmented sample size allocation decision was made. The general practice employed by Hansen et al. [1,15,16] of using a regression estimator within each stratum to reduce the stratum-specific contributions to variance was not available for Malaysia because of the concern of bias when the sample size in a stratum is small (sample size of 10 for stratum 2). The sampling strategy used by Hansen et al. [16] in biomes subsequent to the humid tropics applied a more “liberal” MODIS forest loss threshold to define strata so that MODIS omission error of forest loss was reduced in low change strata.
Recall that by using existing sample blocks from a previous study [1] we were able to increase the sample size for 2000–2005 in Malaysia by 15 blocks at no cost, and it was this cost savings that was the primary motivation for choosing the stratified design. If we compare the standard error for the stratified estimate for Malaysia to the standard error of a simple random sample of 20 blocks (the number of new blocks added to the sample), the standard error for the simple random sample would have been 6% higher than the stratified standard error. Thus, the decision to augment the existing stratified sample of 15 blocks to create a stratified sample of 35 blocks was slightly more effective than starting all over with a simple random sample of only 20 blocks.
The πpx design implemented for 1990–2000 represents an alternative to stratified sampling when a desirable design criterion is to increase the probability of sampling locations with high forest cover loss. The lack of existing sample blocks for 1990–2000 afforded a good opportunity to test the πpx sampling design in practice, and the relative standard error of the πpx design was comparable to that of the stratified design for 2000–2005. This comparison is confounded by differences in sample size (n = 25 for the 1990–2000 πpx design compared to n = 35 for the 2000–2005 stratified design) and differences in the auxiliary information used for the sampling design (AVHRR for 1990–2000 and MODIS for 2000–2005). These results for Malaysia provide only an anecdotal, case study comparison of the two sampling designs. A thorough analysis covering a broad range of conditions representing different rates of forest cover loss and different strengths of association between forest cover loss (yu) and the auxiliary variable used to construct the sampling design (xu) is needed to reach more definitive conclusions on the relative precision of these two sampling designs.
The potential disadvantages of the πpx design need to be recognized. Similar to any sampling design that depends on an auxiliary variable to improve precision, if the auxiliary variable (e.g., forest cover loss derived from AVHRR) is not strongly associated with the target variable (e.g., forest cover loss derived from Landsat), the πpx design will not yield a substantially smaller standard error relative to an equal probability sampling design. The πpx design is more complex to implement and to analyze than the stratified design, and it would be much more difficult to augment the πpx design after the initial sample had been selected, whereas the stratified random sample is easy to augment [29]. The difficulty to augment the πpx design would suggest that it is best applied to a single purpose use as was the case for Malaysia in 1990–2000 rather than as the base design for a large-area (e.g., global) forest monitoring strategy.

4. Conclusions

The objectives of this research were to quantify gross forest cover loss in Malaysia over the period of 1990 to 2005 and to compare the estimates for the two eras 1990–2000 and 2000–2005. For both eras, gross forest cover loss was estimated using a probability sample of Landsat imagery, and the two sampling designs used for the different eras each incorporated complete coverage forest loss information derived from lower resolution imagery (AVHRR in 1990–2000 and MODIS in 2000–2005). The sample-based estimates of gross forest cover loss for Malaysia add to the growing body of knowledge of forest cover change dynamics produced by other sample-based forest cover monitoring studies using satellite data [1,13,15,16,1823,4143]. The application of the πpx design provided the first practical experience using this alternative to stratified sampling and thus introduces another potential sampling design option that takes advantage of complete coverage, low resolution satellite imagery to enhance precision of estimates based on Landsat-derived forest cover change. However, additional research comparing the precision of the πpx design to other alternatives is needed before general recommendations can be stated regarding when one design is preferred over another. The ability to produce temporal and regional comparisons of forest loss dynamics, as illustrated by the comparisons between eras within Malaysia (Table 1) and the comparisons between the neighboring Southeast Asia countries of Indonesia and Malaysia (Table 2), demonstrates the advantages of applying a consistent gross forest cover loss measurement protocol (in this case based on Landsat imagery) as part of an effective forest monitoring strategy.

References

  1. Hansen, M.C.; Stehman, S.V.; Potapov, P.V.; Loveland, T.R.; Townshend, J.R.G.; de Fries, R.S.; Pittman, K.W.; Arunarwati, B.; Stolle, F.; Steininger, M.K.; et al. Humid tropical forest clearing from 2000 to 2005 quantified by using multitemporal and multiresolution remotely sensed data. Proc. Natl. Acad. Sci. USA 2008, 105, 9439–9444. [Google Scholar]
  2. Grainger, A. Rates of deforestation in the humid Tropics: Estimates and measurements. Geogr. J 1993, 159, 33–44. [Google Scholar]
  3. Tucker, C.J.; Townshend, J.R.G. Strategies for monitoring tropical deforestation using satellite data. Int. J. Remote Sens 2000, 21, 1461–1471. [Google Scholar]
  4. Allen, J.C.; Barnes, D.F. The causes of deforestation in developing countries. Ann. Assoc. Am. Geogr 1985, 75, 163–184. [Google Scholar]
  5. Achard, F.; Eva, H; Mayaux, P. Tropical forest mapping from coarse spatial resolution satellite data. Int. J. Remote Sens 2001, 22, 2741–2762. [Google Scholar]
  6. Dauvergne, P. Loggers and Degradation in Asia-Pacific; Cambridge University Press: Cambridge, UK, 2001. [Google Scholar]
  7. Mayaux, P.; Holmgren, P.; Achard, F.; Eva, H.; Stibig, H.-J.; Branthomme, A. Tropical forest cover change in the 1990s and options for future monitoring. Phil. Trans. Biol. Sci 2005, 360, 373–384. [Google Scholar]
  8. Salahuddin, J.S. Asia-Pacific Forestry Sector Outlook Study Working Paper Series. Working Paper No: APFSOS/WP/07. Country Report-Malaysia. Available online: ftp://ftp.fao.org/docrep/fao/003/W7701E/W7701E00.pdf (accessed on 1 December 2012).
  9. ITTO. Status of Tropical Forest Management 2005: Country Profile Malaysia. Available online: http://www.itto.int/sfm_detail/id=12410000 (accessed on 1 December 2012).
  10. McMorrow, J.; Talip, M.A. Decline of forest area in Sabah, Malaysia: Relationship to state policies, land code and land capability. Glob. Environ. Chang 2001, 11, 217–230. [Google Scholar]
  11. Aiken, R.S.; Leigh, C.H. On the declining fauna of Peninsular Malaysia in the post colonial period. R. Swed. Acad. Sci 1985, 14, 15–22. [Google Scholar]
  12. Eva, H.D.; Belward, A.S.; de Miranda, E.E.; di Bella, C.M.; Gond, V.; Huber, O.; Jones, S.; Sgrenzaroli, M.; Fritz, S. A land cover map of South America. Glob. Chang. Biol 2004, 10, 731–744. [Google Scholar]
  13. FAO. Global Forest Resources Assessment 2010. Available online: http://www.fao.org/docrep/013/i1757e/i1757e.pdf (accessed on 1 December 2012).
  14. Friedl, M.A.; McIver, D.K.; Hodges, J.C.F.; Zhang, X.Y.; Muchoney, D.; Strahler, A.H.; Woodcock, C.E.; Gopal, S.; Schneider, A.; Cooper, A.; et al. Global land cover mapping from MODIS: Algorithms and early results. Remote Sens. Environ 2002, 83, 287–302. [Google Scholar]
  15. Hansen, M.C.; Stehman, S.V.; Potapov, P.V.; Arunarwati, B.; Stolle, F.; Pittman, K. Quantifying changes in the rates of forest clearing in Indonesia from 1990 to 2005 using remotely sensed data sets. Environ. Resour. Lett. 2009. [Google Scholar] [CrossRef]
  16. Hansen, M.C.; Stehman, S.V.; Potapov, P.V. Quantification of global gross forest cover loss. Proc. Natl. Acad. Sci. USA 2010, 107, 8650–8655. [Google Scholar]
  17. Innes, J.L.; Koch, B. Forest biodiversity and its assessment by remote sensing. Glob. Ecol. Biogeogr. Lett 1998, 7, 397–419. [Google Scholar]
  18. Achard, F.; Eva, H.D.; Stibig, H.-J.; Mayaux, P.; Gallego, J.; Richards, T.; Malingreau, J.-P. Determination of deforestation rates of the world’s humid tropical forests. Science 2002, 297, 999–1002. [Google Scholar]
  19. FAO. Forest Resources Assessment 1990: Survey of Tropical Forest Cover and Study of Change Processes; FAO Forestry Paper 130; Food and Agriculture Organization of the United Nations: Rome, Italy, 1996. [Google Scholar]
  20. FAO. The 2010 Global Forest Resources Assessment Remote Sensing Survey: An Outline of Objectives, Data, Methods, and Approach; Forest Resources Assessment Working Paper 155; Food and Agriculture Organization of the United Nations: Rome, Italy, 2009. [Google Scholar]
  21. Richards, T.; Gallego, J.; Achard, F. Sampling for forest cover change assessment at the pan-tropical scale. Int. J. Remote Sens 2000, 21, 1473–1490. [Google Scholar]
  22. Duveiller, G.; Defourny, P.; Desclée, B.; Mayaux, P. Deforestation in Central Africa: Estimates at regional, national and landscape levels by advanced processing of systematically-distributed Landsat extracts. Remote Sens. Environ 2008, 112, 1969–1981. [Google Scholar]
  23. Potapov, P.; Hansen, M.C.; Stehman, S.V.; Loveland, T.R.; Pittman, K. Combining MODIS and Landsat imagery to estimate and map boreal forest cover loss. Remote Sens. Environ 2008, 112, 3708–3719. [Google Scholar]
  24. Broich, M.; Stehman, S.V.; Hansen, M.C.; Potapov, P.; Shimabukuro, Y.E. A comparison of sampling designs for estimating deforestation from Landsat imagery: A case study of the Brazilian Legal Amazon. Remote Sens. Environ 2009, 113, 2448–2454. [Google Scholar]
  25. Broich, M.; Hansen, M.C.; Stolle, F.; Potapov, P.; Arunarwati Margono, B.; Adusei, B. Remotely sensed forest cover loss shows high spatial and temporal variation across Sumatra and Kalimantan, Indonesia 2000–2008. Environ. Res. Lett. 2011. [Google Scholar] [CrossRef]
  26. Hansen, M.C.; de Fries, R.S. Detecting long term global forest change using continuous fields of tree cover maps from 8 km AVHRR data for the years 1982–1999. Ecosystems 2004, 7, 695–716. [Google Scholar]
  27. Gutman, G.; Byrnes, R.; Masek, J.; Covington, S.; Justice, C.; Franks, S.; Headley, R. Towards monitoring land cover and land-use changes at a global scale: The Global Land Survey 2005. Photogramm. Eng. Remote Sensing 2008, 74, 6–10. [Google Scholar]
  28. Breiman, L.; Friedman, J.H.; Olshen, R.A.; Stone, C.J. Classification and Regression Trees; Wadsworth and Brooks/Cole: Monterey, CA, USA, 1984. [Google Scholar]
  29. Stehman, S.V.; Hansen, M.C.; Broich, M.; Potapov, P.V. Adapting a global stratified random sample for regional estimation of forest cover change derived from satellite imagery. Remote Sens. Environ 2011, 115, 650–658. [Google Scholar]
  30. Greenpeace International. Roadmap to Recovery: The World’s Last Intact Forest Landscapes; Greenpeace International: Amsterdam, The Netherlands, 2006. [Google Scholar]
  31. Stehman, S.V. Sampling Strategies for Forest Monitoring from Global to National Levels. In Global Forest Monitoring from Earth Observation; Achard, F., Hansen, M.C., Eds.; Chapter 5; Taylor & Francis: New York, NY, 2012; pp. 79–106. [Google Scholar]
  32. Särndal, C.-E.; Swensson, B.; Wretman, J. Model-Assisted Survey Sampling; Springer-Verlag: New York, NY, USA, 1992. [Google Scholar]
  33. Lohr, S.L. Sampling: Design and Analysis, 2nd ed.; Brooks/Cole: Boston, MA, USA, 2010. [Google Scholar]
  34. Stehman, S.V.; Sohl, T.L.; Loveland, T.R. An evaluation of sampling strategies to improve precision of estimates of gross change in land use and land cover. Int. J. Remote Sens 2005, 26, 4941–4957. [Google Scholar]
  35. Brewer, K.R.W.; Hanif, M. Sampling with Unequal Probabilities; Springer-Verlag: New York, NY, USA, 1983. [Google Scholar]
  36. Stehman, S.V.; Overton, W.S. Comparison of variance estimators of the Horvitz-Thompson estimator for randomized variable probability systematic sampling. J. Am. Stat. Assoc 1994, 89, 30–43. [Google Scholar]
  37. Overton, W.S.; Stehman, S.V. The Horvitz-Thompson theorem as a unifying perspective for probability sampling: With examples from natural resource sampling. Am. Stat 1995, 49, 261–268. [Google Scholar]
  38. FWI/GFW. The State of the Forest: Indonesia; Forest Watch Indonesia: Bogor, Indonesia, Global Forest Watch: Washington, DC, USA; 2002. [Google Scholar]
  39. FAO. Global Forest Resources Assessment 2000; FAO Forestry Paper No. 140; Food and Agriculture Organization of the United Nations: Rome, Italy, 2001. [Google Scholar]
  40. Cochran, W.G. Sampling Techniques, 3rd ed.; John Wiley & Sons: New York, NY, USA, 1977. [Google Scholar]
  41. Achard, F.; Stibig, H.-J.; Eva, H.; Mayaux, P. Tropical forest cover monitoring in the humid tropics—TREES project. Int. Soc. Trop. Ecol 2002, 43, 9–20. [Google Scholar]
  42. Achard, F.; de Fries, R.; Eva, H.; Hansen, M.C.; Mayaux, P.; Stibig, H.-J. Pan tropical monitoring of deforestation. Environ. Res. Lett 2007, 4, 1–11. [Google Scholar]
  43. Eva, H.D.; Achard, F.; Beuchle, R.; de Miranda, E.; Carboni, S.; Seliger, R.; Vollmar, M.; Holler, W.A.; Oshiro, O.T.; Arroyo, V.B.; et al. Forest cover changes in tropical South and Central America from 1990–2005 and related carbon emissions and removals. Remote Sens 2012, 4, 1369–1391. [Google Scholar]
Figure 1. Locations of the sample blocks for 1990–2000 and 2000–2005.
Remotesensing 05 01842f1
Figure 2. Example block for the 2000 to 2005 epoch, centered at 3.08 degrees North, 113.58 degrees East, Sarawak state, Malaysia.
Remotesensing 05 01842f2
Table 1. Gross forest cover loss estimates for Malaysia: 1990–2000 and 2000–2005.
PeriodnPercent Area of Forest Cover (SE)Percent of Land Area Cleared (SE)Total Area (Mha) of Gross Forest Cover Loss (SE)Annual Mean (Mha/yr) Gross Forest Cover Loss (SE)
1990–20002581.0 (3.9)13.0 (2.4)4.25 (0.78)0.42 (0.08)
2000–20053572.8 (4.3)9.8 (1.7)3.20 (0.55)0.64 (0.11)
Table 2. Comparison of annual gross forest cover loss estimates for Malaysia and Indonesia.
PeriodEstimated Annual Mean Gross Forest Cover Loss (Mha/yr) (SE in Parentheses)
MalaysiaIndonesia *
1990–20000.42 (0.08)1.78 (0.14)
2000–20050.64 (0.11)0.71 (0.09)
*From [15], based on a stratified random sample of 75 blocks for 1990–2000 and 79 blocks for 2000–2005.
Table 3. Gross forest cover loss by stratum for Malaysia 2000–2005.
StratumNhnhMean Forest Cover Loss as % of Land Area (Standard Deviation)
Percent Contribution to Estimated Variance
MODISLandsat
19520.00 (0.00)2.78 (2.98)1.5
2649100.37 (0.66)9.39 (7.76)94.0
3165134.50 (2.07)12.41 (7.15)3.7
447816.02 (5.55)19.40 (9.33)0.7
52247.00 (1.41)33.55 (12.09)0.0

