Automatic Storm Damage Detection in Forests Using High‑Altitude Photogrammetric Imagery

Abstract
: Climate change has increased the occurrence of heavy storms that cause damage to forests. After a storm, it is necessary to obtain knowledge about the injured trees quickly in order to detect and aid in collecting the fallen trees and estimate the total damage. The objective in this study was to develop an automatic method for storm damage detection based on comparisons of digital surface models (DSMs), where the after-storm DSM was derived by automatic image matching using high-altitude photogrammetric imagery. This DSM was compared to a before-storm DSM, which was computed using national airborne laser scanning (ALS) data. The developed method was tested using imagery collected in extreme illumination conditions after winter storms on 8 January 2012 in Finland. The image matching yielded a high-quality surface model of the forest areas, which were mainly coniferous and mixed forests. The entire set of major damage forest test areas was correctly classified using the method. Our results showed that airborne, high-altitude photogrammetry is a promising tool for automating the detection of forest storm damage. With modern photogrammetric cameras, large areas can be collected efficiently, and the imagery also provides visual, stereoscopic support for various forest storm damage management tasks. Developing methods that work in different seasons are becoming more important, due to the increase in the number of natural disasters.1. Introduction
The risks of storms that cause damage in forests are increasing, due to climate change. Quickly detecting fallen trees, assessing the amount of fallen trees and efficiently collecting them are of great importance for economic and environmental reasons. Visually detecting and delineating storm damage is a laborious and error-prone process; thus, it is important to develop cost-efficient and highly automated methods.
Forest damage detection methods are typically either based on comparisons of before and after storm data or on knowledge of how different scenes in the field are represented in the data. The former method needs compatible data taken before and after the storm. For the latter method, an extensive field reference is needed to model the system response for different field cases, which can be difficult to automate.
Optical airborne and spaceborne imagery is the conventional data used for storm damage detection. Frolkin et al. have summarized how spaceborne data is used in forest disturbance detection [1]. According to their study, it is possible to detect a small-scale disturbance with high-resolution satellite data, although it may not be possible to acquire the data at an optimal time. Large-scale changes to the forest can be observed by comparing the areal mean values of before-damage and after-damage data for a particular area. The main difficulty with optical spaceborne data has to do with clouds. For the radar frequencies, regression equations are used to relate the back-scattered microwave radiation to the biomass, and thus, the role of field reference data for modeling work is essential. However, not all of the trees in the damaged area may be dead, and therefore, the change in the radar-observed biomass does not necessarily describe the damage to the forest’s economic value.
High-resolution aerial CIR (color infrared) images were used by Pellikka et al.[2] to model forest ice storm damage. The images were bidirectional reflectance distribution function (BRDF) corrected in order to avoid view/illumination-related disturbances in the interpretation. The authors used the image’s spectral, textural and shadow fraction information and field-measured health information in a multi-variable regression model; the inclusion of multiple variables provided additional information compared to just using single spectral variable models. With this method, the role of field reference is paramount, since the brightness of the images depends on the density and species distribution of the forest, as well as many other factors.
Currently, airborne laser scanning (ALS) is widely considered to be the most promising method for various forest inventory and management tasks, because it provides accurate information about the canopy height, structure and the underlying terrain [3,4]. Rahman used the ALS canopy height model before and after storm disturbance [5]; he delineated the individual trees in the before-storm data and used the height differences (between before- and after-storm DSMs) in the delineated tree locations to determine if there was damage. The reported accuracy in damage assessment and quantification was 90%. Vastaranta et al. developed a method for detecting snow damage in forests by using bi-temporal, dense laser scanning data [6]. For their study, they used field reference measurements and the changes in the height distribution of the ALS points in 5 m × 5 m grid cells. They detected the damaged cells with an overall accuracy of 78.6%. However, the affordability of the method is questionable, since both field work and laser scanning are costly. Dolan et al. used ICESAT GLAS spaceborne laser altimeter data (50–55 m footprint diameter) to compute the mean canopy height before and after hurricane-induced disturbance [7]. They found out that damage was dependent on the wind speed during the hurricane and caused a loss of mean canopy height from 0.5 m to 4 m.
One characteristic of the storm damage detection process is that storms can occur at any season, which also influences the properties and quality of the data used in remote sensing tasks. For instance, in Finland, the four seasons all provide data of different qualities (Table 1). The variation in a forest may be vast, due to seasonal changes, especially in deciduous canopies, and due to lighting and view-angle-related factors. Typically, photogrammetric mapping projects are carried out either in springtime, when the trees do not have leaves, or in summertime at full-leaf season, while there may be a need for storm damage mapping during any season.
Many algorithms and methods exist for image change detection [8]. The common strategies for measuring changes between images have a feature extraction step and a decision step [9]. In image change detection, the underlying assumption is that the data from two timestamps are of the same type. In the case where the observations from different times come from different sensors, different measures represent the same target, and the changes between the data are due to both changes in the observed measures and changes in the target. In the storm damage detection task, the before- and after-storm data are often from different seasons and sensors, which complicates image change detection.
The change detection methods that are the least sensitive to the natural variations of object and remote sensing method are expected to have the highest automation potential. Methods that are based on comparisons of digital surface models (DSMs) collected at two points in time (bi-temporal) could be efficient for automating storm damage detection. Laser scanning [3,4], radargrammetry using SAR images [10] and the automatic matching of images [11–14] are promising methods for automatic DSM generation.
A general method for storm damage detection based on digital surface data is as follows:
Obtain before-storm DSM;
Obtain after-storm DSM;
Register two DSMs together;
Calculate the difference between the two DSMs;
Detect areas where changes have taken place in the forest areas.
The objective of this investigation was to develop and assess an automatic method for storm damage detection that utilizes stereoscopic airborne image block data and novel dense matching techniques. Many recent studies have shown that these methods perform well when measuring canopy surface information [11–14]. The most challenging conditions for matching forest surfaces occur during the seasons when the deciduous trees do not have leaves, which can lead to a decrease in the matching quality [12]. Also, low solar altitudes during autumn and winter seasons can be challenging, especially due to shadows, which can deteriorate the quality of image matching [15].
Serious winter storms took place in Finland on 26 and 27 December 2011. Airborne photogrammetric image flights were carried out on 8 January 2012 right after the first snow had fallen. Our objective was to investigate the potential of the novel storm damage detection method in a real operational situation, in extreme illumination conditions using this data. In Section 2, we describe the method in more detail and the data used. The results are given in Section 3 and discussed in Section 4.
2. Empirical Investigation
2.1. Test Area
Winter storms right after Christmas on 26 and 27 December 2011, caused serious windfall in Finland. Airborne image data was collected for a 1,620 km2 area in southwestern Finland, with center coordinates 61°4′33″N, 22°52′3″E. Based on the Corine Land Cover 2006, coniferous forest is the dominant forest type in the area, but there is also a substantial amount of mixed forests and transitional woodland/shrub. Broad-leaved forests are a minority. The area has a flat topography with a terrain height range of approximately 50 to 100 m. Right before the data collection, the first snow had fallen, so that there was approximately 10–20 cm snow cover on ground. It is likely that there was also some snow on trees, but visual evaluation on images indicated that it was not significant (there is no ground truth data about this).
2.2. Before-Storm ALS DSM
National ALS data was used as the before-storm information. It was obtained from the National Land Survey (NLS), and it is available for public use according to the open data politics of the NLS. The major specifications for the data collections include a flying altitude of 2,000 m, a maximum scan angle of ±20° and a footprint of 50 cm; the data should preferably be collected during a bare-ground season or during spring time, when the trees have small leaves. These specifications are used to obtain as good a penetration to the forest floor as possible. The minimum point density of the NLS ALS data is half a point per square meter, and the elevation accuracy of the points in well-defined surfaces is 15 cm; the horizontal accuracy is 60 cm. The point cloud has automatic ground classification. The ALS data used in this study was collected in 2008 during the spring. LasTools software [16] was used to merge the map sheets of NLS laser data that covered the area and to make a DSM of the point cloud with a 1 m grid spacing. The first and only pulses were used.
2.3. After-Storm Image Materials and Photogrammetric Processing
The after-storm images were collected using a Microsoft UltraCamXp [17], large-format mapping camera by Blom Kartta Oy© (Helsinki, Finland) on 8 January 2012. The average flying height was 5,370 m above ground level (AGL), which provided a ground sample distance (GSD) of 32 cm. The images were collected in a block structure, with 16 image strips and approximately 30 images per strip; the forward overlaps were 65%, and the side overlaps were 30%; the distances of the image strips were approximately 3,900 m. The atmosphere was clear, and the solar elevation was as low as 5°–7°. The data was collected between 11:56 am and 14:11 pm local time (UTC +2). These were very unusual and extreme conditions for a photogrammetric mapping project.
The UltraCamXp is a so-called multi-head camera, where the panchromatic images are formed from nine individual CCD arrays collected using four separate cameras; the high-resolution multispectral images in blue, green, red and near-infrared wavelength regions are provided by pansharpening lower resolution multispectral data [17]. The pixel size is 6 μm, the image size is 11,310 by 17,310 pixels and the principal distance is 10.05 cm. The UltraCamXp provides a field of view of ±18.7° in the flying direction and ±27.3° in the cross-flight direction. Thus, in the cross-flight direction, the largest observation angle is ±20° if the extreme strip overlap areas are not used. The sensor provides imagery of a high geometric and radiometric quality, and it is also expected to perform acceptably in poor illumination conditions.
The original georeferencing of the images was carried out by Blom Kartta Oy using Inpho Match-AT automatic orientation software. The orientation was carried out in a GNSS/IMU-supported mode, with a few ground control points (GCPs). Self-calibration was used for the calculations; the parameters included 44 parameters for the image distortions and stripwise shift parameters for the GNSS/IMU observations of the perspective centers.
The following processing steps were carried out at the Finnish Geodetic Institute (FGI). We used the panchromatic images having a pixel depth of 16 bits. Only panchromatic images were used, because it was expected that they provide better geometric performance than the pansharpened or lower resolution multispectral images. Evaluation of the grey value histograms showed that the pixel values were on the range of 2,022 to 49,919, and the 99% efficiency of the histogram was 20,230 (0.5% of upper and lower histogram tails were ignored). These values indicated good image quality. Our visual evaluation also indicated that the image quality was good, even in shadowed regions. This high radiometric image quality is based on radiometrically sensitive imaging sensor and successful exposure settings [15].
New aerial triangulation was carried out at the FGI in order to evaluate various processing options. The photogrammetric processing was carried out using BAE Systems SOCET SET Version 5.5.0.201101. The orientations determined by Blom Kartta Oy were used as observations, with standard deviations of 1 m for the perspective centers and 0.05° for the rotations. An automatic tie point measurement was carried out using, on average, 121 tie points per image. Five neighboring flying strips were chosen out of a total of sixteen flying strips for the detailed analysis. Twenty six (26) regularly distributed 3D GCPs, mainly on road crossings, were manually measured from a laser intensity image and laser surface model combination using ERDAS IMAGINE 2011 software. The snowy landscape and the visual difference between the aerial imagery and the laser data caused difficulties for the visual measurements.
Four different georeferencing solutions were generated by changing the GCP configurations to investigate the ALS and image data integration process. A block with all 26 ALS GCPs was used as the reference calculation; for this calculation, block-wise shift parameters in the X, Y and Z directions were estimated. The other evaluations included: (1) a block without GCPs, that is, only the orientation parameters provided by the Blom Kartta Oy and the tie points measured at the FGI were used (no GCP); (2) in addition to 1, five GCPs from the laser data were used, and block-wise shift parameters in the X, Y and Z directions were estimated (5 GCPs); (3) in addition to 2, the principal point of autocollimation and three radial distortion parameters were estimated to study whether or not they could explain some remaining distortions (5 GCPs, interior orientations (IORI)) (the UltraCamXp is a multi-head sensor, so single-head parameters are not optimal for the camera [18]; here, IORI indicates determination of camera interior orientation parameters by self-calibrating bundle block adjustment). In cases 1–3, the reference points that were not used as GCPs were used as independent checkpoints to evaluate the performance. We give details on our self-calibrating bundle block adjustment approach in [18].
SOCET SET Next Generation Automatic Terrain Extraction software (NGATE) [19,20] was used to generate DSMs. The matching strategy employs the edge and correlation matching methods and applies image pyramids and back matching. Different predefined and self-tuned strategies were tested. Finally, one of the default NGATE strategies, “ngate_urban_canyon.strategy,” was selected as the method to be used in this investigation, because it appeared to provide the highest success rates in matching in forest areas. The strategy used 7 pyramid layers with a reduction factor of two between the layers; the final matching was carried out using the full resolution images. The most important parameter in this method is the correlation window size in the area based matching, which were constant 13 × 13 pixels in each pyramid layer. DSMs were generated in an irregular point-network (TIN) format of the NGATE software, with a point interval of 1 m and with a no-thinning option; this format attempts to provide terrain height data with an approximately regular 1 m point interval, but does not interpolate points in cases of failures. The LasTools blast2dem [16] function was used to make a grid DSM of the point cloud with a 1 m grid spacing. To evaluate the success rate of matching, we measured an additional DSM with the same strategy, but in a regular grid format, where each point had a figure of merit value (FOM) indicating the quality of matching. The FOM values lower than 40 indicate different exceptional situations and values 40–100 indicate successful correlation; these large FOMs are proportional to correlation coefficient—the larger the number, the better the measurement [20].
2.4. A Method for Storm Damage Detection
A method for forest storm damage detection, based on comparisons of before- and after-storm surfaces, was developed. A subset of the data approximately of the size 5.5 km × 2.3 km was used to develop a method that classifies the individual pixels, so that the areas of significant changes can be observed more easily (Figure 1).
The DSM difference image in Figure 1 can be used for visual storm damage detection as such. The red and yellow colors indicate areas of potential tree loss. The blue colors indicate areas where the photogrammetric DSM was above the ALS DSM; the major cause for the largest differences of up to 30 m was the different characteristics of the DSMs generated by the different methods; growth of trees between the ALS and image data acquisitions caused smaller differences (expected to be on average less than 1 m) (see Section 3.2). The areas with large changes (several fallen trees that were next to each other) can easily be observed. There are damage areas that are not easy to observe, especially when large areas are viewed. Typically, logging has taken place in these areas, and tall trees were left to provide seed; the falling of these trees is seen as a sparse change on the difference image. In order to take a step towards automatic storm damage detection, we developed a simple method to produce a classification map of the changes, with larger areas that can be delineated and stored in a vector format.
The statistics for the height change in the boxes marked in Figure 1 were studied in order to classify the pixels into areas of change, sparse change and no change. The main findings in the statistics were that the photogrammetric DSM was always above the ALS DSM in the non-disturbed forest area, whereas the photogrammetric DSM was below the ALS surface in the change area.
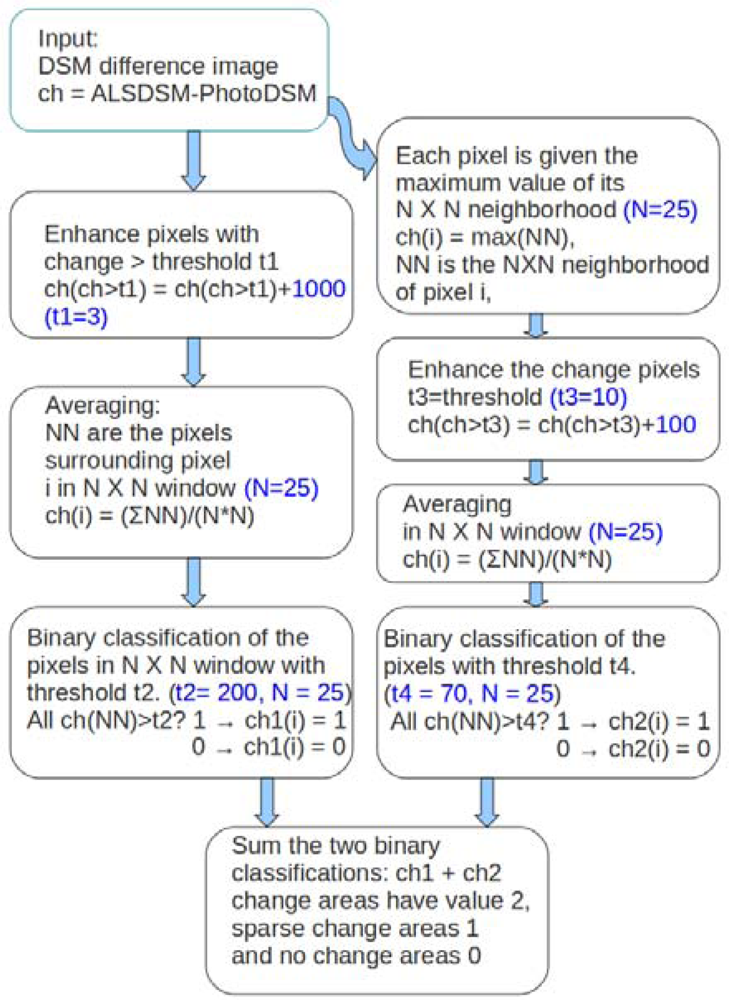
For the classification process, we first identified the areas of change. In the changed areas, the objective was to merge small patches of change into larger areas with relatively smooth edges. The basic steps in the process involved enhancing the changes, using low-pass filtering to eliminate the smallest changes and finally, classifying the changes. The process was carried out in two steps to detect areas with large changes and areas with sparse changes, as shown in Figure 2.
The process for detecting large changes was as follows. First, the pixels where the ALS DSM were above the photogrammetric DSM more than threshold, t1, were enhanced using an additive enhancing factor. The change pixels were enhanced to ensure that the areas of interest with change above the selected height were not mixed with other areas during the further processing steps. Second, a neighborhood averaging 25 m × 25 window was applied to filter out insignificant changes and to merge the areas. Third, a threshold value of t2 was used to classify pixels into two classes (no change and change).
In this study, a threshold value of t1 = 3 m was used to represent potential change in a particular forest. The additive enhance factor (enh) to be added to pixels exceeding the height threshold and threshold, t2, were selected using the following criterion. The averages were taken for all pixels in the training-area, height-difference image using the selected neighborhood window. The maximum, max(avg_train), and minimum, min(avg_train), of these averages were used as an extreme scenario. The average of the window needed to be above the threshold, t2, and the max(avg_train) when the proportion, p, of the pixels was enhanced. The approximate relationship in the extreme case is:
In the test model, max(avg_train) was 15.6 m and min(avg_train) was −23.1 m. We selected an additive enhancing factor of 1,000 and threshold t2 = 200, and then, the 25 m × 25 m windows with approximately more than 140 m2 (22%) of height differences greater than 3 m were identified as changed areas.
This first-phase classification eliminated nearly all of the sparse forest change areas. To identify large areas with sparse changes, a slightly different approach was used. First, the pixel values in the 25 m × 25 m windows were replaced with the neighborhood maximum. Then, an enhancing factor was applied to all pixels with differences larger than the threshold (t3). This spread the maximum value into the neighborhood, and the areas of sparse change could be found. Second, an average filtering was carried out in a 25 m × 25 m window. Third, a binary classification was carried out using the threshold, t4. In this case, changes that were larger than t3 = 10 m were considered to be significant changes for this type of an area. The change in a single pixel greater than 10 m will spread over 625 (25 × 25) pixels after the maximum and enhancing operations.
The final classification combines the two branches in Figure 2. The classification is still on a pixel level, but since the areas within a class are smooth and there are only three classes, the contours or edge detection of the classification, for example, could provide the change areas in a vector format. The window size and the variability in the height difference affect the numerical values in the above equation. Effectively, the same results could be achieved using different window sizes during the averaging and classification steps with a different threshold. Also, the averaging could be replaced with another suitable smoothing function.
3. Results
3.1. Registering the Photogrammetric and ALS Data
Table 2 shows the results of registering the photogrammetric and ALS data for four different GCP configurations. When we used all of the GCPs, the global shift parameters between the photogrammetric block and ALS data were −0.28, 0.77 and 0.73 m in X, Y and Z, respectively. For the calculation without GCPs, the root mean square error (RMSE) at 26 checkpoints was less than 1.4 m in all of the coordinates. When we used five GCPs and estimated a global shift between the imagery and the ALS data, the RMSE at the checkpoints was on the level of 1 m or less; the global shift values were similar to the case with 26 GCPs. The use of additional camera self-calibration parameters improved the RMSEs only slightly in comparison to the case without these parameters. The comparisons of different solutions by using tie points from the solution with 26 GCPs as the reference indicated that the solution without GCPs was slightly systematically shifted and that the use of ALS GCPs was advantageous. In the DSM generation, the orientation parameters from the block with all 26 GCPs and no self-calibration was used. The major factors causing the differences between the photogrammetric and ALS data include the point determination (intersection) error of the stereoscopic images, the systematic and random error of the photogrammetric block, the systematic and random error of the ALS data and the interpolation error of the ALS height data. Furthermore, the snow could cause some difference in height direction (10–20 cm). The results indicated a good fit for the data sets, and the registration errors are not expected to cause problems when comparing photogrammetric and ALS DSMs.
3.2. Photogrammetric DSM
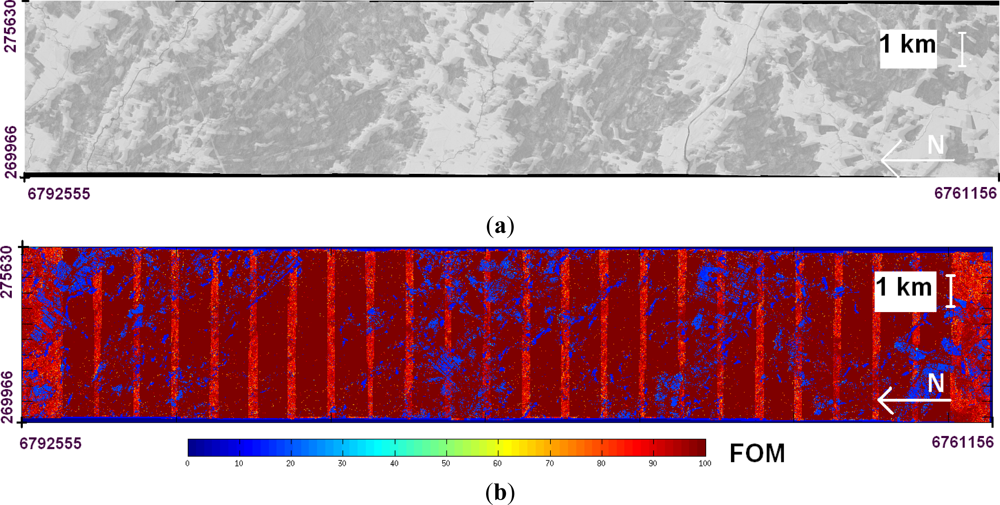
The DSM generation by the NGATE software was successful in the wintry images. The FOM values indicated that the overall success rate of image matching was 87% (Figure 3). Larger areas with matching failures appeared on homogeneous field surfaces covered by snow; in forests, there were no significant matching failures. One reason for poor performance in field areas was that the matching strategy was not optimized for matching in homogeneous surfaces. The striping in the FOM map was due to the varying number of overlapping images and this was caused by the block overlaps.
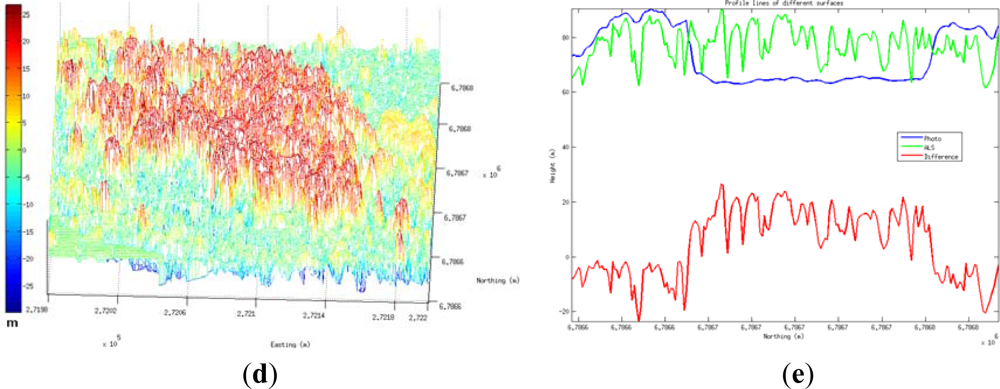
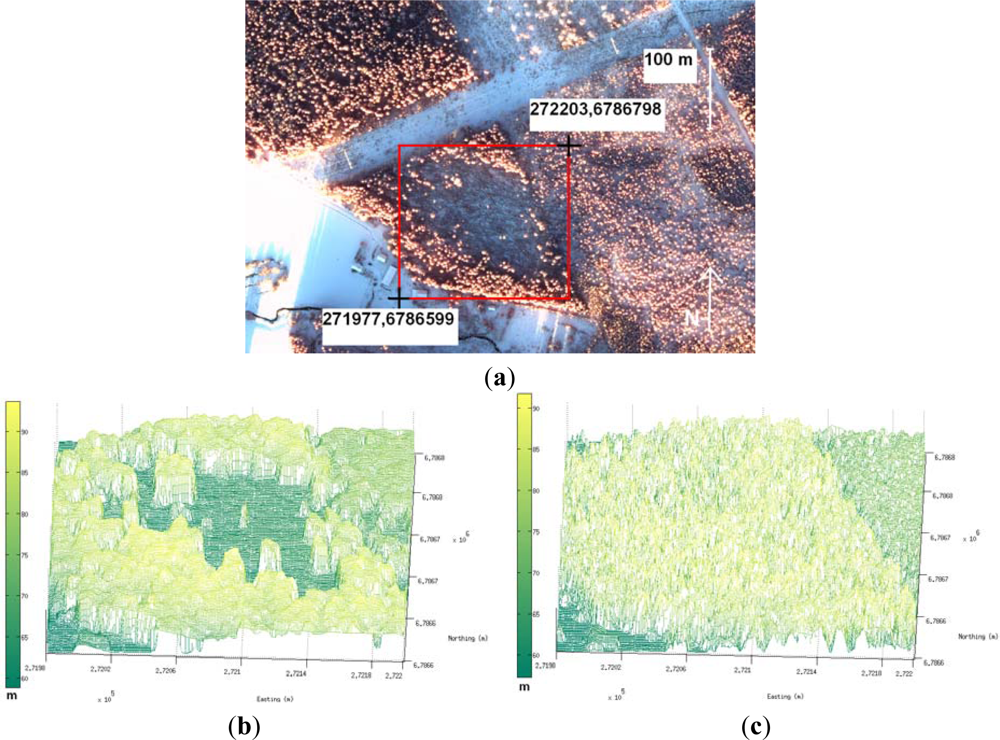
The software measured the surface models for the tree crowns well and provided a smooth surface carpet that did not penetrate to the forest floor in dense forests; in sparse forests, the forest floor was successfully measured. The visual evaluation also indicated that the photogrammetric DSM penetrated well to the ground in areas with fallen trees. In the case of stereoscopic image measurement, the same object area has to be observable at least in two images, and this results in that the penetration to the forest floor is dependent on several factors, especially the GSD of images, image overlaps (intersection angle) and density of the forest. The comparison of the ALS and photogrammetric DSMs indicated that the photogrammetric method provided smoother surface and did not penetrate to the forest floor in the same way as the ALS DSM. These performances were expected and caused by the measurement principles of the two methods. Examples of image and ALS DSMs and their difference for a storm damage area are shown in Figure 4. The different characteristic of two surfaces is best seen in the profile representation in Figure 4(e).
3.3. Detecting Storm Damage
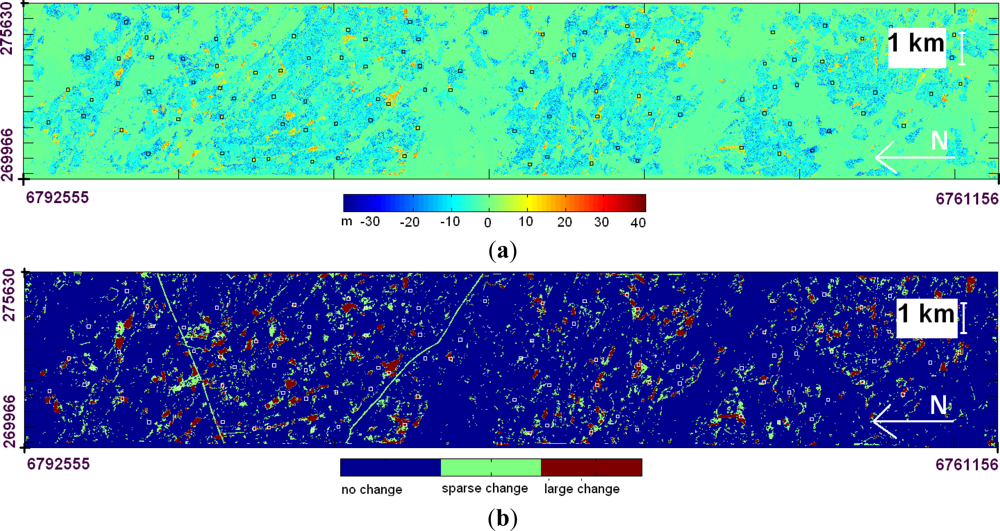
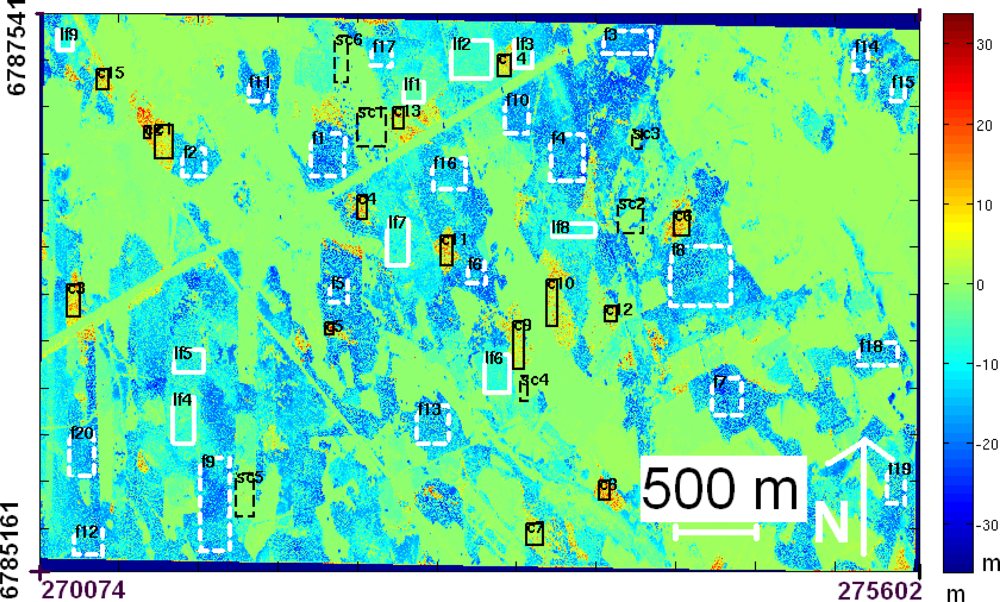
We applied the classification method described in Section 2.4 to generate a damage classification map of an image strip with an approximate length of 31 km and a width of 5.5 km (southwest corner 60°53′48″N, 22°45′27″E ; northeast corner 61°13′34″N, 22°49′7″E). The area used in training of the classification method is included in the area of the image strip. We computed the difference surface and classification using Matlab software. The results show that the changed forest areas were relatively small in size and were distributed throughout the image strip (Figure 5). The largest potential uniform damage areas were 0.19 km2 in size, and the average size of large change areas was 0.0042 km2. Magnifications of different storm damage areas are shown in Figure 6.
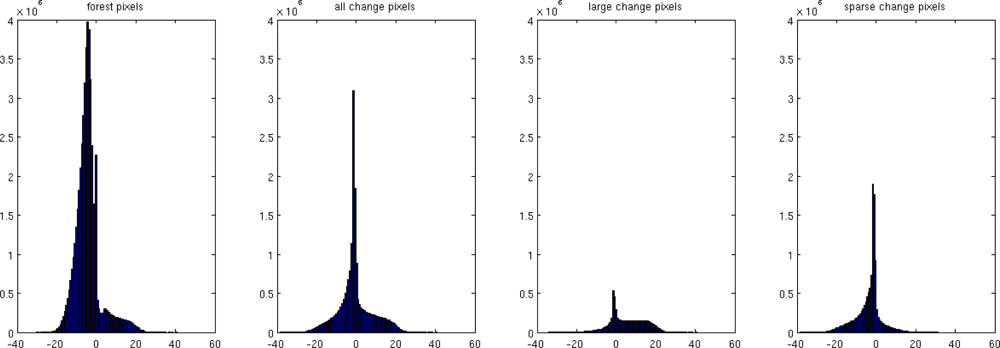
Histograms of the height differences are shown in Figure 7. The fallen trees caused a large number of differences between 0 and 20 m, and they appeared mostly in the large change class. In general, there were a lot of differences between −20 and 0 m; these differences were due to the fact that the photogrammetric DSM in the forest area is mostly above the ALS surface and is a smooth surface and, in general, not penetrating to forest floor (Section 3.2, Figure 4(e)).
3.4. Classification Accuracy
We evaluated the classification accuracy by checking 100 square areas at a size of 100 m × 100 m. We interactively selected the areas from the DSM difference image (Figure 5(a)) to obtain good distribution of areas appearing as disturbed and non-disturbed. We scrolled the image into a 1,000 m × 1,000 m window and placed a 100 m × 100 m square inside the window and gave it an interactive class. In this way, we altogether selected 49 no change and 51 change squares, which covered the area of interest quite regularly. We determined an accurate damage classification for these areas visually by evaluating airborne images. We used the following classes for damages: no damage, minor damage (1–5 fallen trees), low damage (5–10 fallen trees), significant damage (>10 fallen trees) and logging operations (suspected operations between the ALS data collection and the storm).
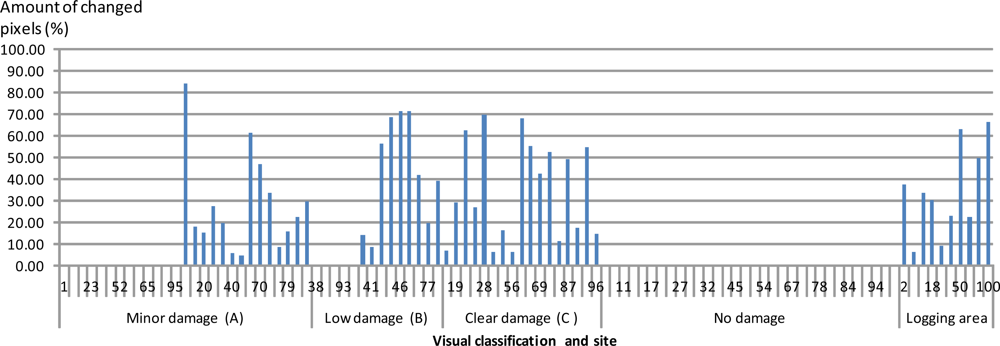
In the classification map (Figure 5(b)), we considered the test square as changed when >10% of its area could be assigned to the large change or sparse change classes. The automatic classifier detected all areas with clear damage, but less of the areas with minor or low damage (Table 3). We further analyzed the amount of pixels exceeding a difference of 3 m in height in these squares (Figure 8). In the clear damage class (C), a large number of the pixels exceeded the limit for each square. In the minor and low damage classes, there were several squares with a very small number of crossings, but also several squares with a large number of pixels exceeding the limit. During visual inspection, we identified all of these latter areas as potential areas with previous logging operations (but it is also possible that the fallen trees had already been collected and that the marks were not identified in the area). This means that most of what we identified as change in classes A and B was due to the fact that the before-storm data was not up-to-date.
Finally, we evaluated the total area of damage. The area covered by the image strip was 177.9 km2, and the forest area was 49.1 km2 (27.6%). The total area classified as changed was 19.0 km2; 12.6 km2 belonged to the sparse change class and 6.4 km2 to the large change class. These change estimates could be considered as the estimates for the total area of forest damage. However, these estimates include other forest management operations (logging, thinning), which have to be obtained from other sources. Not all of the areas classified as changed were in the forest; they included areas of low vegetation and, for example, power lines in the sparse change class. If the data collection had been carried out close enough to the time of the storm, we would have still been able to identify the trunks in the image data, and we could have used this as reliable proof of storm damage.
4. Discussion
We developed a novel method for forest storm damage detection that utilizes high-altitude, large-format photogrammetric imagery. The method is based on comparing DSMs that are collected before and after a storm. We investigated its performance using photogrammetric imagery that was collected of a storm damage area in extreme illumination conditions in winter time, with low solar elevation angles of 5°–7°.
The results showed that the approach was highly automatic and reliable. The new classification method was sensitive enough to detect all significant damage (more than 10 fallen trees in a 1 ha area) with 100% accuracy.
Storm damage detection is one part of the storm damage management process that is used in Finland. These results indicate that the method could substitute for the interactive storm damage detection phase. In this detection process, a commonly used practice of forest professionals in Finland to classify storm damages is as follows:
No damage;
Minor damage: a group of trees with less than 20 damaged trunks;
Great damage, but with less than half of the trunks damaged;
Complete destruction, in which more than half of the trunks are damaged.
The novel method could be used to detect all damage belonging to classes 3 and 4 and the most serious damage pertaining to class 2 (more than ten fallen trees within 1 ha). The method might be too sensitive to detect small damage, but that is less serious than if serious damage cannot be reliably detected. If for some reason matching fails in a particular forest, the method can also be used to detect such situations, and if necessary, interactive control can be carried out. In all cases, the developed method will significantly limit the area that needs to be interactively considered during the analysis process when deciding on the appropriate forest management operations after the storm. For example, in the evaluated storm data set, the damages were scattered in a wide area and individual damage areas were small in size, which made it necessary for a human operator to decide the appropriate actions to take.
Our results also prove that state-of-the-art airborne data collection and processing methods are efficient and accurate, and this provides a reliable basis for automating a storm damage detection process.
In general, the photogrammetric data preprocessing and georeferencing processes are highly efficient and mature technologies. In our study, the registration quality between the national ALS data and photogrammetric data was very good. However, it was difficult to visually measure the tie points between the photogrammetric data and ALS data, due to the different nature of the data sets; more automatic methods should be developed for the operational process, for example, methods that are based on matching the surface models [21].
The quality of surface model is the critical factor in the method. The matching method should be able to measure the crown surfaces with a high success rate and also the ground surface between the trees. However, the storm damage detection process does not require penetration to the ground in dense forest, but it should be able to measure the ground (find gaps in forest) in areas with significant disturbances. There exist numerous factors that influence on the quality or usability of a DSM measured by automatic image matching; these include the image collection parameters, imaging conditions and object characteristics [11,12,15]. Fundamental image collection parameters include the GSD of images and the overlaps in image block. Relevant parameters related to the imaging conditions include the solar elevation, shadows, atmospheric conditions and season; imaging conditions are a pertinent issue, because we expect that damage can appear at any season, and these factors could influence the overall performance of the image matching. Significant object characteristics include the topography, forest type and size of damage that should be detected.
The NGATE software performed well for the wintry images of coniferous forests in flat terrain, and we expect similar results for other matching methods involving area-based matching and advanced matching strategies. In this study, the GSD was 32 cm and forward overlap of images was 65%, which resulted in a smooth DSM surface that did not penetrate to the forest floor in dense forest, but provided excellent results in detection of storm damages. Based on our results and other published results [11–13,15], our recommendations for appropriate flight parameters are the forward overlap of 80%, the side overlap of 30%–60% and the GSD of 30–50 cm. The results showed that extreme shadows and wintry conditions did not significantly disturb the analysis process. On the contrary, the snow increased the amount of scattered light and might have improved the results in the areas with the deepest shadows. It is anticipated that the automatic image matching will be successful also with steeper topography, where one of the most serious additional complications is the decrease of illumination in shadowed areas; however, the requirement is that the illumination and sensitivity of sensor are sufficient to produce enough image details for matching. We expect that these results are valid also in broad-leaved forests when leaves are on trees [12]. In further studies, the performance in broad-leaved forests should be evaluated especially when there are no leaves on trees. It will also be important to investigate the performance of other terrain extraction algorithms, in particular semi-global matching [13], but also the performance of high-altitude ALS and radargrammetry.
The ALS DSM collected almost four years earlier was excellent reference data for storm damage detection. In the future, national laser scanning will provide high-quality, before-storm surface information in many countries, including Finland, but that the data up-to-date is one of the potential challenges if the update interval is not high enough. The reliability of reference data is strongly dependent on its age and the forest growth rate. In many countries, up-to-date national airborne photogrammetric imagery could be more cost-efficient approach to provide before-storm DSMs than ALS, and this approach should be investigated further. The surface data could be updated using forest growth models to some extent. The impact of the aging of the reference data should be considered in further studies. Also, high-resolution stereoscopic satellite imagery could be used to provide either before or after storm data [12,13]. Globally, there are vast forest areas that are not mapped with high resolution methods; in these areas, the spaceborne techniques are expected to be the cost-efficient approach [1,7]. In urgent situations, in particular in regions with high probability of clouds, airborne data collection is more flexible and operational than optical spaceborne data collection, because airborne data collection can be carried out (with increased cost of data collection), also below clouds.
The classification method used in this study is not optimal. The method was developed to demonstrate that it is possible to easily adopt a method that merges the change areas and also finds spots that are not easy to detect visually. We determined the threshold parameters of the method interactively. By considering the types of surfaces, changes and forests, the parameters can be tuned to different situations. Assessment of the sensitivity of the method and automating the parameter selection process are important further research topics in order to improve the level of automation. The method might be further improved by utilizing the radiometric information from the image data. Also, many other classification approaches are expected to be functional.
Estimating the amount of fallen trees will constitute the next important improvement to the analysis process, so that it will be possible for a forest owner to obtain information about whether it is necessary to collect trees. The latest results indicate the excellent performance potential of photogrammetric DSMs based on the image matching in these processes [14]. It is also important to know about previous cuttings, so that the planned forest operations can be separated from the damage. Based on the photogrammetric images, it might be possible to identify the planned tree loss and storm damage, especially if the trunks are still lying on the ground. A usability analysis for the operational processes should be carried out in order to tune the analysis method, so that it will ideally serve the practical processes.
5. Conclusions
The major contribution of our investigation is the development and demonstration of an efficient and highly automated method for forest storm damage detection. The damage detection is one of the critical steps in the entire storm damage management process. The new method is based on comparisons of digital surface models (DSMs), where the after-storm DSM is derived by automatic image matching using high-altitude photogrammetric imagery. We validated the performance of the method with wintry airborne images collected in Finland in January 2012 after winter storms; the flying altitude was 5,500 m, and the ground sampling distance was 32 cm. We used national, open access airborne laser scanning (ALS) data collected four years earlier, as the before-storm information. The method was sensitive enough to detect all significant damage (more than 10 fallen trees in 100 ha area) with 100% accuracy.
Our results give new empirical knowledge about the performance and automation potential of passive remote sensing in disaster management operations. We showed that novel dense image matching and automation of forest change detection are possible when using high-altitude, passive photogrammetric imagery collected in wintry conditions (with snow cover) and with very low (5°–7°) solar elevation angles. This is a significant new outcome, because conventional photogrammetric applications use images collected with high, typically >30°, solar elevation and without snow cover. Our process emphasized that a further advantage of using imagery is that the images will support analysis and visual interpretation processes of various stakeholders; these are often needed in disaster management processes after the damage areas are identified. Results suggested that the two week time gap between the storm and data acquisition increased the uncertainty of the image support. According to our knowledge, the presented investigation is the first one to show the high level of performance of automated storm damage detection, utilizing wintry airborne images and laser scanning as the before-storm information. The ability to demonstrate the performance of the method with realistic test data was the unique opportunity in our study.
Our results show that appropriate a priori information is valuable in order to efficiently perform storm damage management process. We promote the advantages of open access DSM data: accurate height data about before-disaster situation in a usable format is prerequisite for efficient change detection process. Also, information about cuttings in forests during the time interval between collection of before-storm DSM and disaster would be valuable in further interpreting whether the detected tree loss is due to storm or other reasons.
Our investigation point out many topics for further research. Improving the automation level of the method and comparing different classification methods will be an important further step in our studies. In general, more investigation is required to understand comprehensively the performance of different surface extraction methods (photogrammetry, image matching algorithms, laser scanning, radargrammetry, influence of flying altitudes) in different objects (terrain steepness, broad-leaved canopies during leaf-off season, influence of forest density, different types of forest disturbance). This knowledge will be the basis for the development and selection of optimal remote sensing method for each disaster situation.
Based on our results and general knowledge of airborne photogrammetry, we can conclude the following. The use of airborne imaging provides several advantages in the storm damage detection process. Airborne imaging is a flexible and, in general, cost-efficient method for mapping wide areas. Processing of large-format airborne imagery is mature, and efficient technology and quality of image data is high, even in poor illumination conditions. DSMs have a high potential for change detection in urgent disaster management tasks that can rise at any season. This is because DSMs are less influenced by seasonal changes in objects and properties of sensors than optical images. The DSM measurement by image matching is already functional technology and is being developed further. As a result, DSM generation and storm damage classification can be realized efficiently, so that the results will be available soon after the data is acquired. Our empirical results are of great relevance, because in the future, there will be an increasing need to identify storm damage resulting from climate change, which is responsible for increasingly severe storms.
Acknowledgments
The authors are grateful to Blom Kartta Oy for their support in providing the image materials for this study and to the National Land Survey for the laser scanning data. Yrjö Niskanen from Metsäkeskus is gratefully acknowledged for providing us with the background information about the current practices used in storm damage detection. The research carried out in this study was funded by the Academy of Finland (Project No. 134181) and the Finnish Ministry of Agriculture and Forestry (DNro. 350/311/2012). We acknowledge the anonymous reviewers for their valuable comments.
References
- Frolking, S.; Palace, M.W.; Clark, D.B.; Chambers, J.Q.; Shugart, H.H.; Hurtt, G.C. Forest disturbance and recovery: A general review in the context of spaceborne remote sensing of impacts on aboveground biomass and canopy structure. J. Geophys. Res. 2009, 114, G00E02–G00E06. [Google Scholar]
- Pellikka, P.; Seeded, E.D.; King, D.J. Modelling deciduous forest ice storm damage using aerial CIR imagery and hemispheric photography. Can. J. Remote Sens 2000, 26, 394–405. [Google Scholar]
- Hyyppä, J.; Yu, X.; Hyyppä, H.; Vastaranta, M.; Holopainen, M.; Kukko, A.; Kaartinen, H.; Jaakkola, A.; Vaaja, M.; Koskinen, J.; et al. Advances in forest inventory using airborne laser scanning. Remote Sens 2012, 4, 1190–1207. [Google Scholar]
- Hyyppä, J.; Holopainen, M.; Olsson, H. Laser scanning in forests. Remote Sens 2012, 4, 2919–2922. [Google Scholar]
- Rahman, M. Integration of Remote Sensing and GIS for Tree Damage Estimation from Natural Disasters. Proceedings of 34th International Symposium on Remote Sensing of Environment, The GEOSS Era: Towards Operational Environmental Monitoring, Sydney, NSW, Australia, 10–15 April 2011.
- Vastaranta, M.; Korpela, I.; Uotila, A.; Hovi, A.; Holopainen, M. Area-Based Snow Damage Classification of Forest Canopies Using Bi-Temporal Lidar Data. Proceedings of the ISPRS Workshop on Laser Scanning, Calgary, AB, Canada, 29–31 August 2011.
- Dolan, K.A.; Hurtt, G.C.; Chambers, J.Q.; Dubayah, R.O.; Frolking, S.; Masek, J.G. Using ICESat’s Geoscience Laser Altimeter System (GLAS) to assess large-scale forest disturbance caused by hurricane Katrina. Remote Sens. Environ 2011, 115, 86–96. [Google Scholar]
- Radke, R.J.; Andra, S.; Al-Kofahi, O.; Roysam, B. Image change detection algorithms: A systematic survey. IEEE Trans. Image Proc 2005, 14, 294–307. [Google Scholar]
- Mercier, G.; Derrode, S.; Trouvé, E.; Bombrun, L. Change Detection in Remote Sensing Observations. In Multivariate Image Processing: Methods and Applications; Collet, C., Chanussot, J., Chehdi, K., Eds.; ISTE Ltd.: Birmingham, UK; Wiley & Sons: New York, NY, USA, 2010; pp. 95–142. [Google Scholar]
- Karjalainen, M.; Kankare, V.; Vastaranta, M.; Holopainen, M.; Hyyppä, J. Prediction of plot-level forest variables using TerraSAR-X stereo SAR data. Remote Sens. Environ 2012, 117, 338–347. [Google Scholar]
- Leberl, F.; Irschara, A.; Pock, T.; Meixner, P.; Gruber, M.; Scholz, S.; Wiechert, A. Point clouds: Lidar versus 3D vision. Photogramm. Eng. Remote Sensing 2010, 76, 1123–1134. [Google Scholar]
- Baltsavias, E.; Gruen, A.; Zhang, L.; Waser, L.T. High-quality image matching and automated generation of 3D tree models. Int. J. Remote Sens 2008, 29, 1243–1259. [Google Scholar]
- Hirshmüller, H. Semi-Global Matching: Motivation, Development and Applications. In Photogrammetric Week; Fritsch, D., Ed.; Wichmann Verlag: Heidelberg, Germany, 2011; pp. 173–184. [Google Scholar]
- Järnstedt, J.; Pekkarinen, A.; Tuominen, S.; Ginzler, C.; Holopainen, M.; Viitala, R. Forest variable estimation using a high-resolution digital surface model. ISPRS J. Photogramm 2012, 74, 78–84. [Google Scholar]
- Honkavaara, E.; Markelin, L.; Rosnell, T.; Nurminen, K. Influence of solar elevation in radiometric and geometric performance of multispectral photogrammetry. ISPRS J. Photogramm 2012, 67, 13–26. [Google Scholar]
- Isenburg, M. LAStools—Efficient Tools for LiDAR Processing; Version 120628. Available online: http://lastools.org (accessed on 5 March 2013).
- Microsoft UltraCAM. Available online: http://www.microsoft.com/ultracam/en-us/default.aspx (accessed on 5 March 2013).
- Honkavaara, E. Calibrating Digital Photogrammetric Airborne Imaging Systems Using a Test Field; Ph.D. Thesis, Helsinki University of Technology, Espoo, Finland; 2008. [Google Scholar]
- DeVenecia, K.; Walker, S.; Zhang, B. New Approaches to Generating and Processing High Resolution Elevation Data with Imagery. In Photogrammetric Week’07; Fritch, D., Ed.; Wichmann Verlag: Heidelberg, Germany, 2007; pp. 297–308. [Google Scholar]
- SOCET, SET User’s Manual; Version 5.5; BAE Systems: San Diego, CA, USA; April; 2009.
- Rönnholm, P. Registration Quality—Towards Integration of Laser Scanning and Photogrammetry; No 59.; EuroSDR Official Publication: Frankfurt, Germany, 2011. [Google Scholar]


| Mapping | Forest | Influences of Imaging Season | ||||
|---|---|---|---|---|---|---|
| Winter | Spring | Summer | Autumn | |||
| Season (month) | 4–6 | 6–8 | 1–3 | 4–5 | 6–9 | 10–12 |
| Trees (leaves) | No | Full | No | No | Full | No/Fall colors |
| Terrain/vegetation | No | Yes | Snow | No | Yes | Yes |
| Clouds | 0% | 0% | 0%–100% | 0%–100% | 0%–100% | 0%–100% |
| Visibility | >15 km | - | - | - | - | |
| Solar elevation (°) | >25 | >25 | 7–26* | 38–48* | 31–52* | 5–20* |
Trees (broad-leaved forests): no leaves, full leaf, fall colors. Terrain/vegetation: no: no vegetation; yes: vegetation cover. Snow: snow cover.*Maximal solar elevations in southern Finland (61°29′60″N, 23°42′50″E).
| Block | RMSE Checkpoints (m) | RMSE Tie Points (m) | Average Difference in Tie Points (m) | Global Shift (m) | |||||||||||
|---|---|---|---|---|---|---|---|---|---|---|---|---|---|---|---|
| X | Y | Z | X | Y | Z | X | Y | Z | X | Y | Z | σX | σY | σZ | |
| 26 GCP | - | - | - | - | - | - | - | - | - | −0.28 | 0.77 | 0.73 | 0.24 | 0.23 | 0.24 |
| No GCP | 0.89 | 1.34 | 1.37 | 0.34 | 0.87 | 0.56 | 0.21 | −0.75 | −0.50 | - | - | - | - | - | - |
| 5 GCP | 0.79 | 0.76 | 1.12 | 0.24 | 0.21 | 0.29 | −0.21 | 0.05 | 0.25 | −0.43 | 0.81 | 0.88 | 0.50 | 0.49 | 0.59 |
| 5 GCP, IORI | 0.77 | 0.66 | 1.06 | 0.21 | 0.13 | 0.12 | −0.20 | 0.06 | 0.04 | −0.42 | 0.82 | 0.67 | 0.50 | 0.49 | 0.59 |
| Damage Class | Number of | Number of | Classification Result (%) | |
|---|---|---|---|---|
| Fallen Trees/ha | Test Squares | Change | No Change | |
| No damage | 0 | 32 | 0 | 100 |
| Minor damage (A) | 1–5 | 27 | 52 | 48 |
| Low damage (B) | 6–10 | 14 | 36 | 64 |
| Clear damage (C) | >10 | 17 | 100 | 0 |
| Logging operations | - | 10 | 100 | 0 |
Share and Cite
Honkavaara, E.; Litkey, P.; Nurminen, K. Automatic Storm Damage Detection in Forests Using High‑Altitude Photogrammetric Imagery. Remote Sens. 2013, 5, 1405-1424. https://doi.org/10.3390/rs5031405
Honkavaara E, Litkey P, Nurminen K. Automatic Storm Damage Detection in Forests Using High‑Altitude Photogrammetric Imagery. Remote Sensing. 2013; 5(3):1405-1424. https://doi.org/10.3390/rs5031405
Chicago/Turabian StyleHonkavaara, Eija, Paula Litkey, and Kimmo Nurminen. 2013. "Automatic Storm Damage Detection in Forests Using High‑Altitude Photogrammetric Imagery" Remote Sensing 5, no. 3: 1405-1424. https://doi.org/10.3390/rs5031405
APA StyleHonkavaara, E., Litkey, P., & Nurminen, K. (2013). Automatic Storm Damage Detection in Forests Using High‑Altitude Photogrammetric Imagery. Remote Sensing, 5(3), 1405-1424. https://doi.org/10.3390/rs5031405