Estimation of Tree Cover in an Agricultural Parkland of Senegal Using Rule-Based Regression Tree Modeling

Abstract
:1. Introduction
1.1. Importance of Tree Cover in West African Dryland Farming Systems
1.2. Role of Sub-Pixel Remote Sensing for Assessing Tree Cover
1.3. Objectives
2. Data and Methods
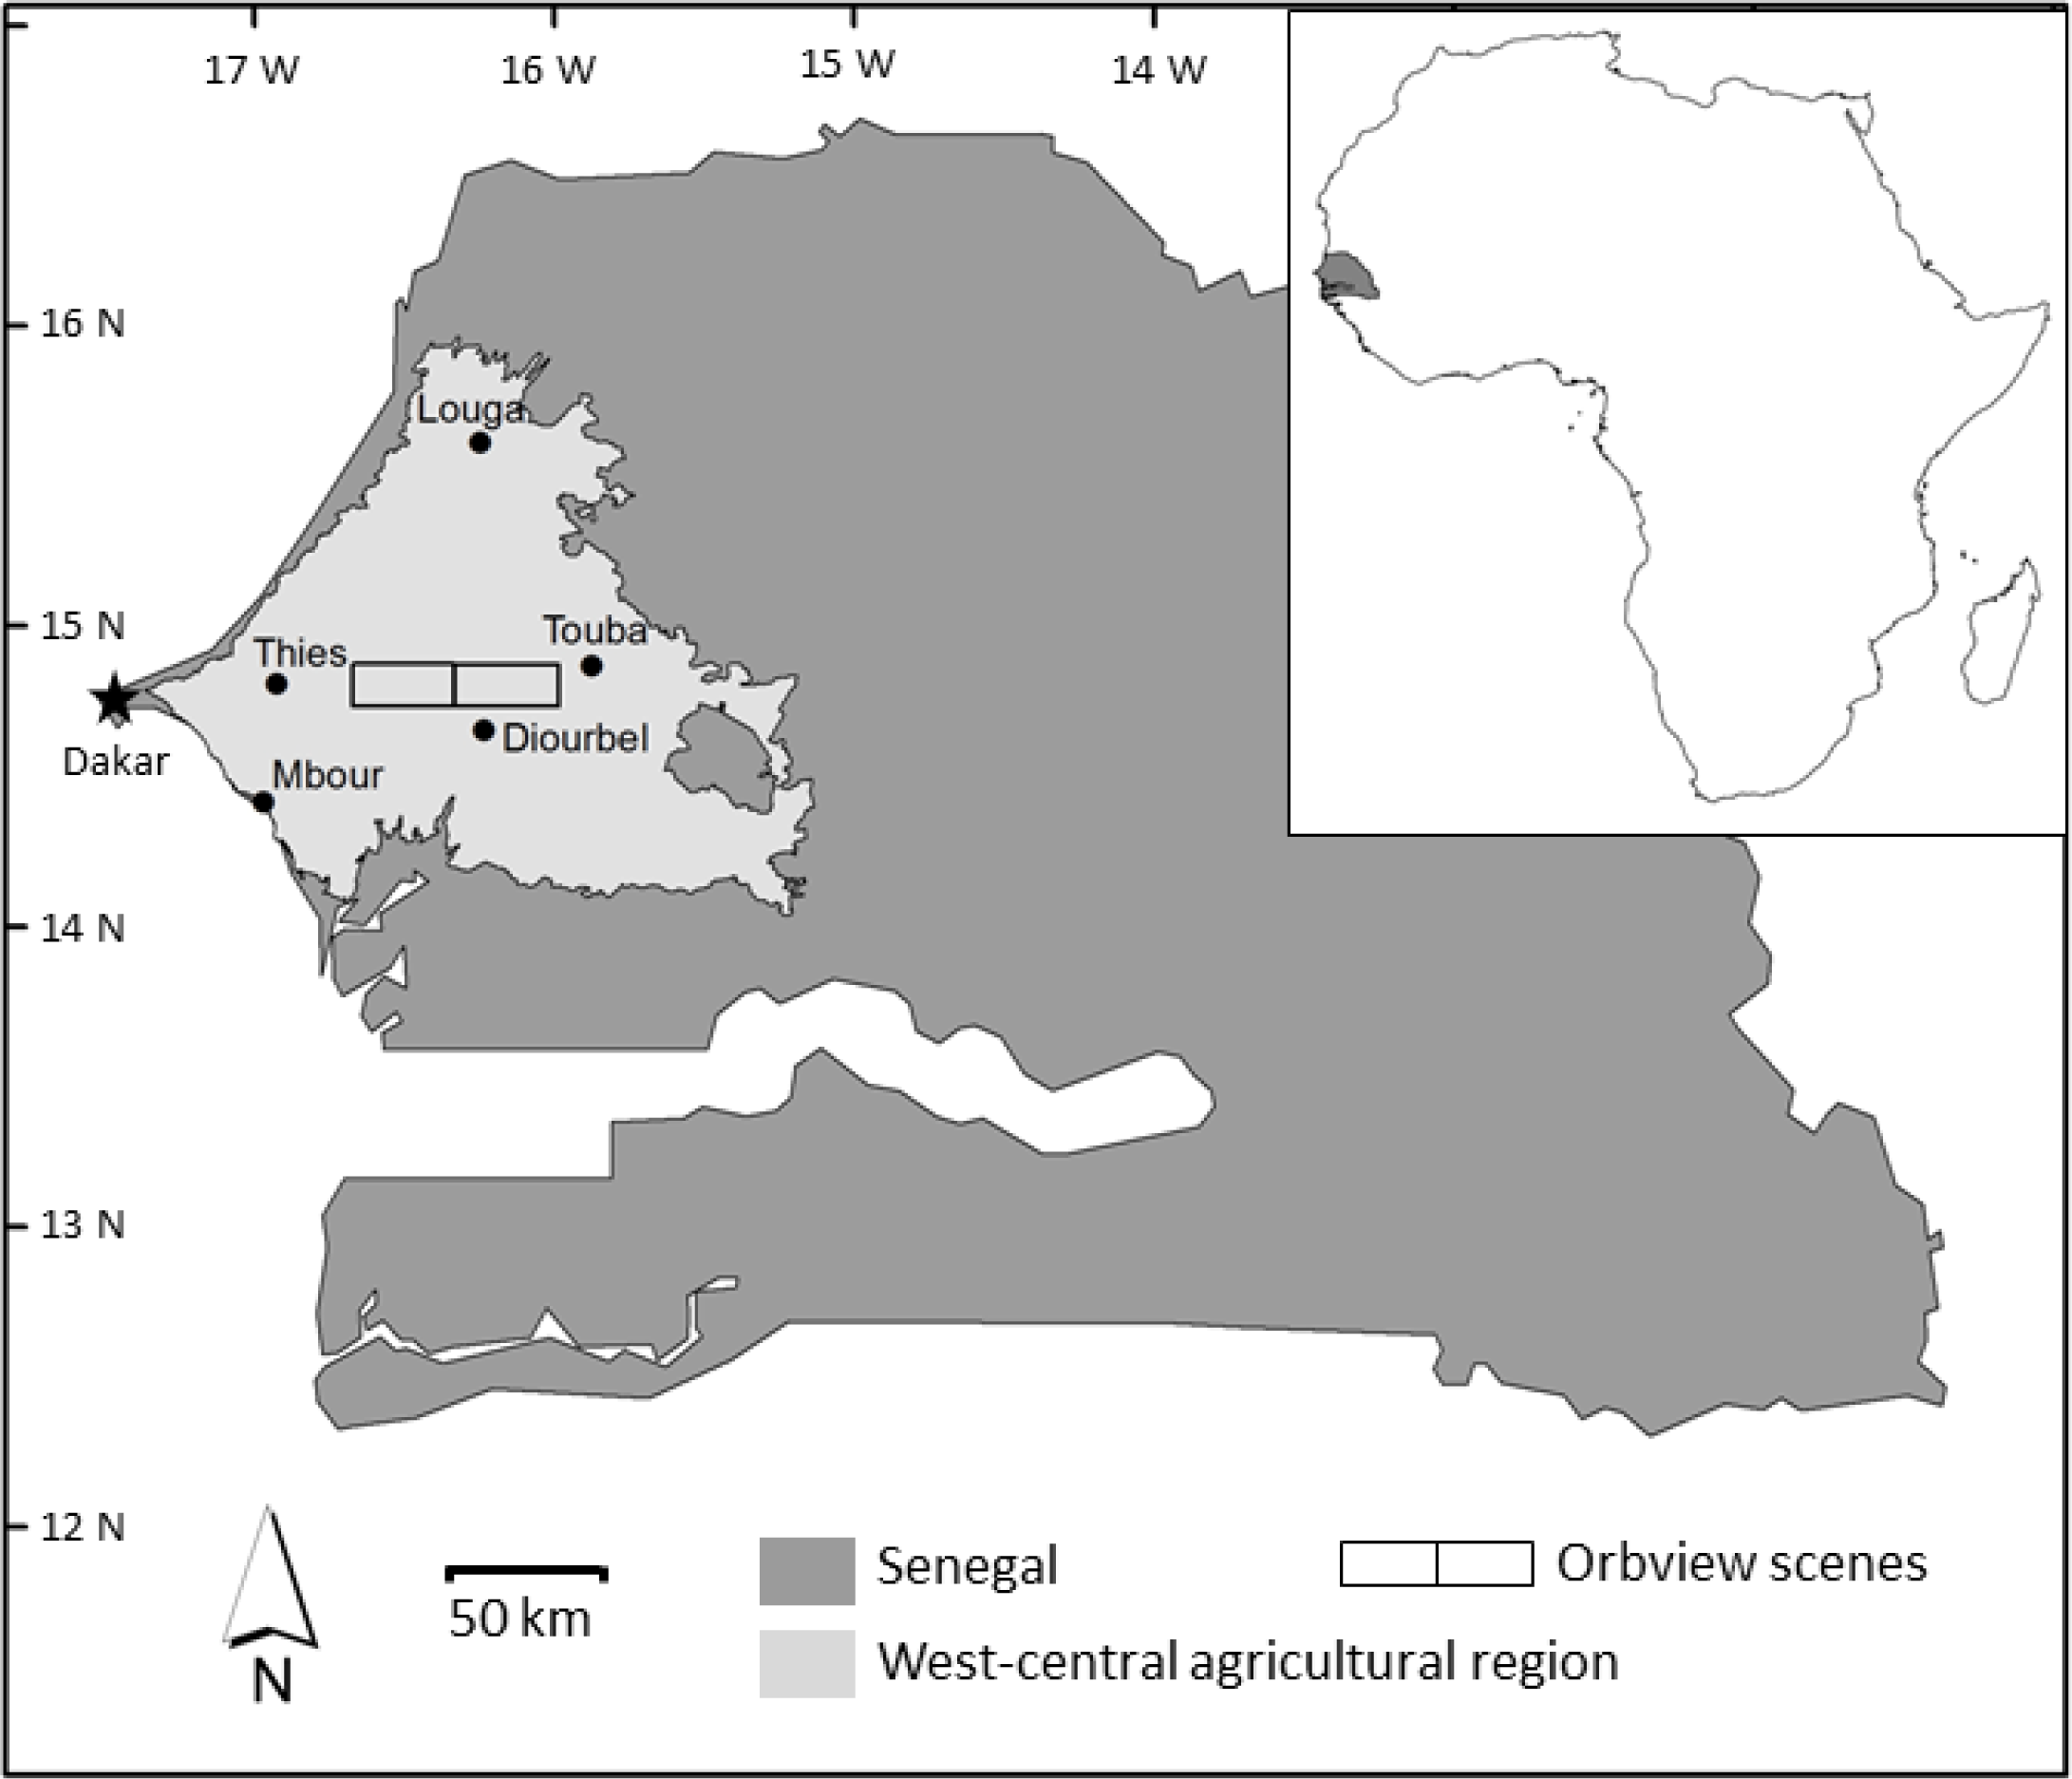
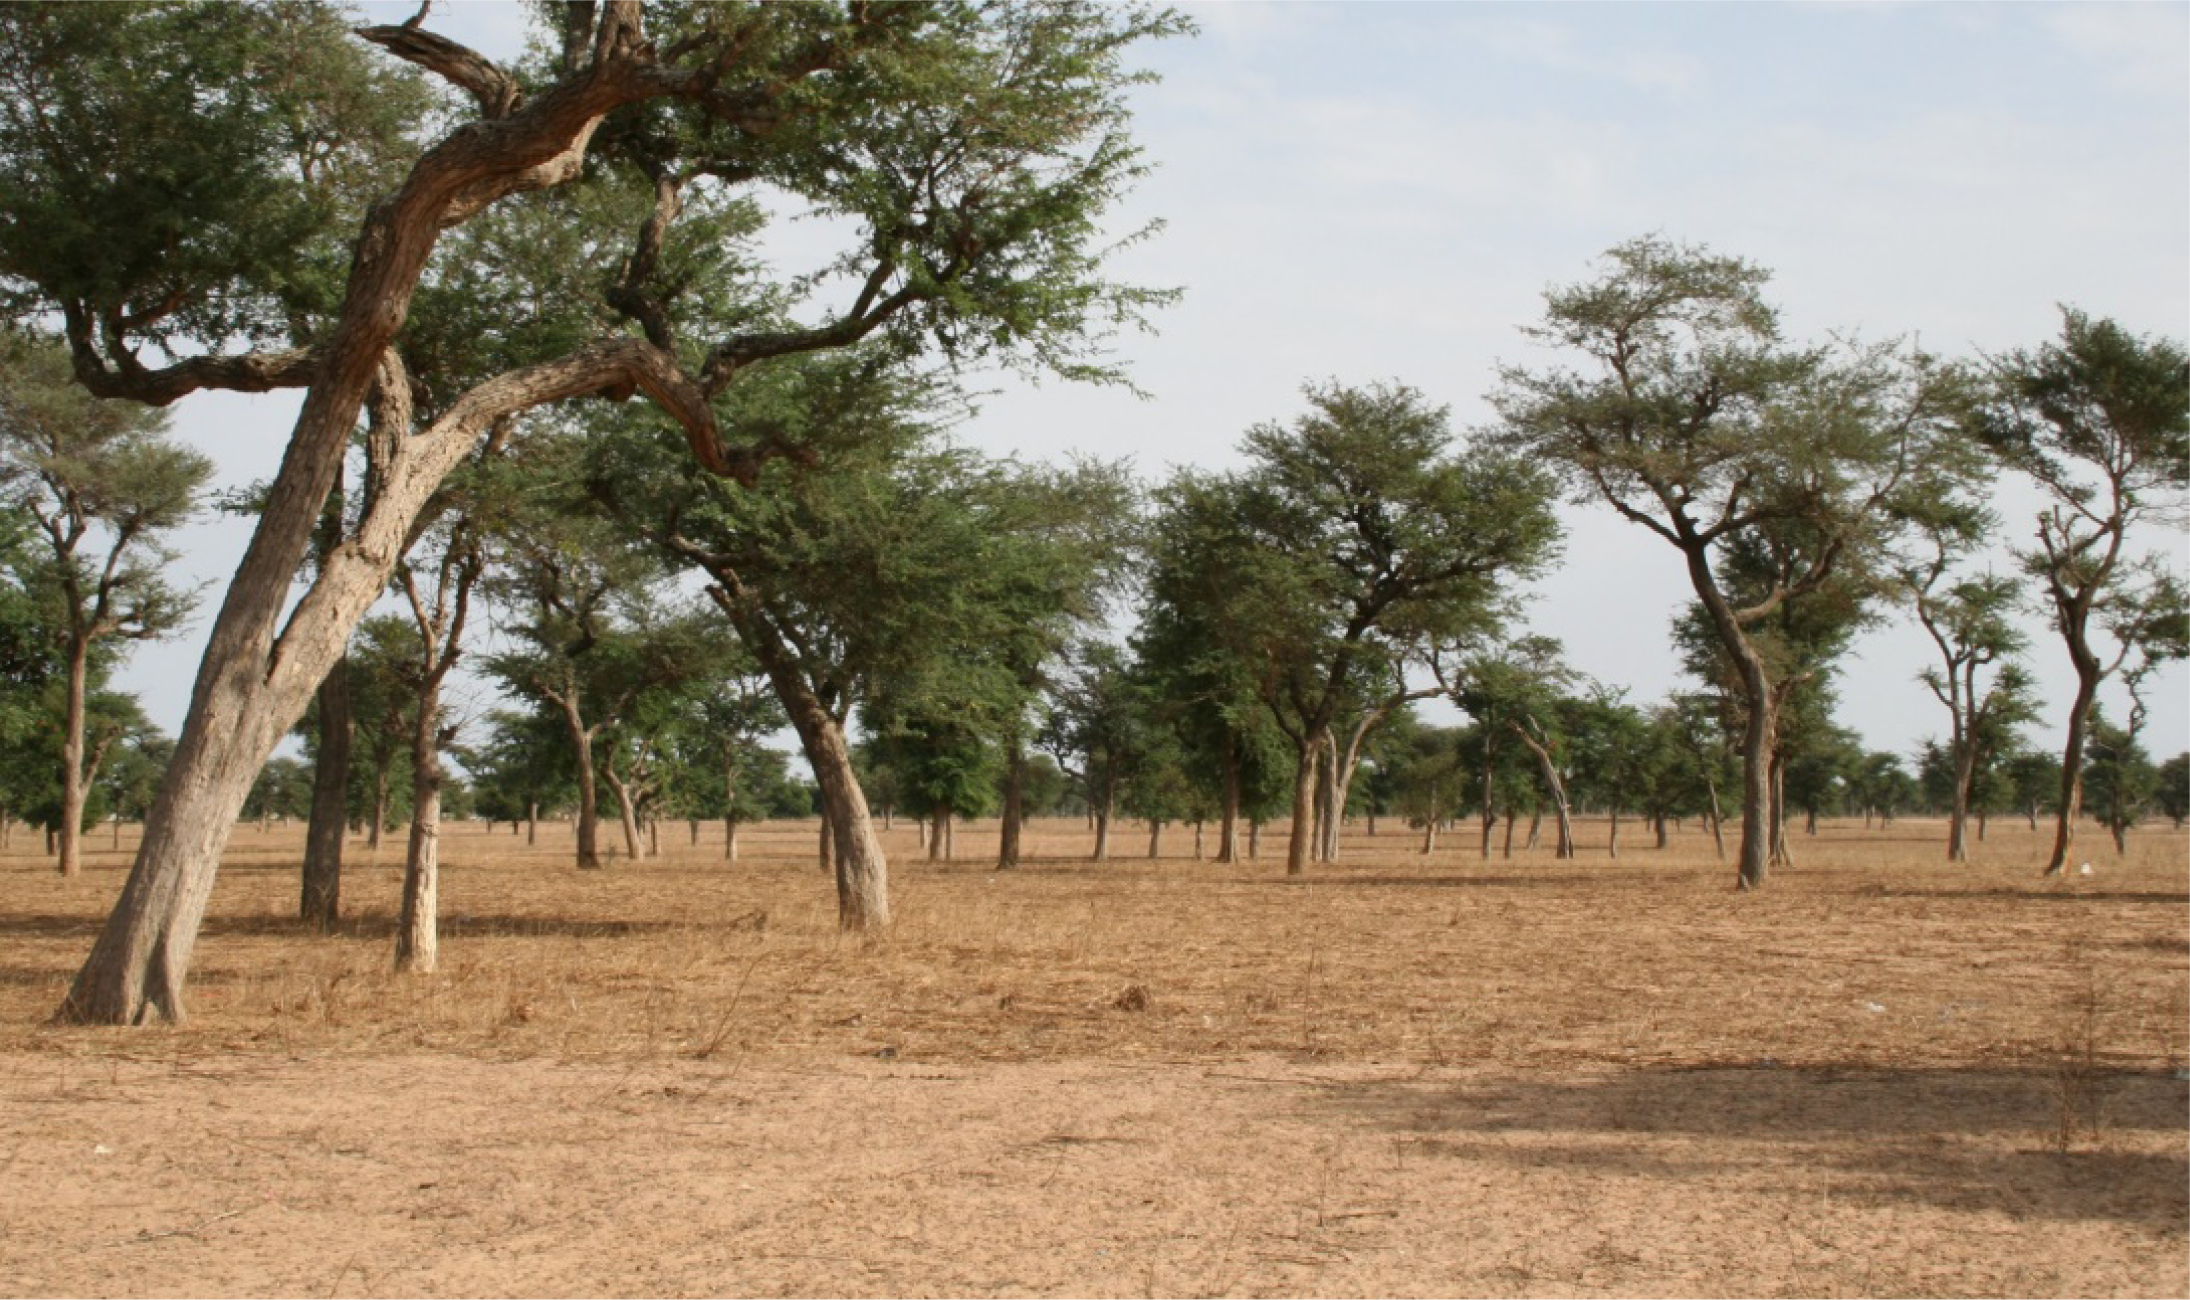
2.1. Study Area
2.2. Data
2.2.1. High Spatial Resolution Data: Orbview
2.2.2. High Temporal Resolution Data: MODIS
2.2.3. Historical Space Photography: Corona
2.3. Data Preparation
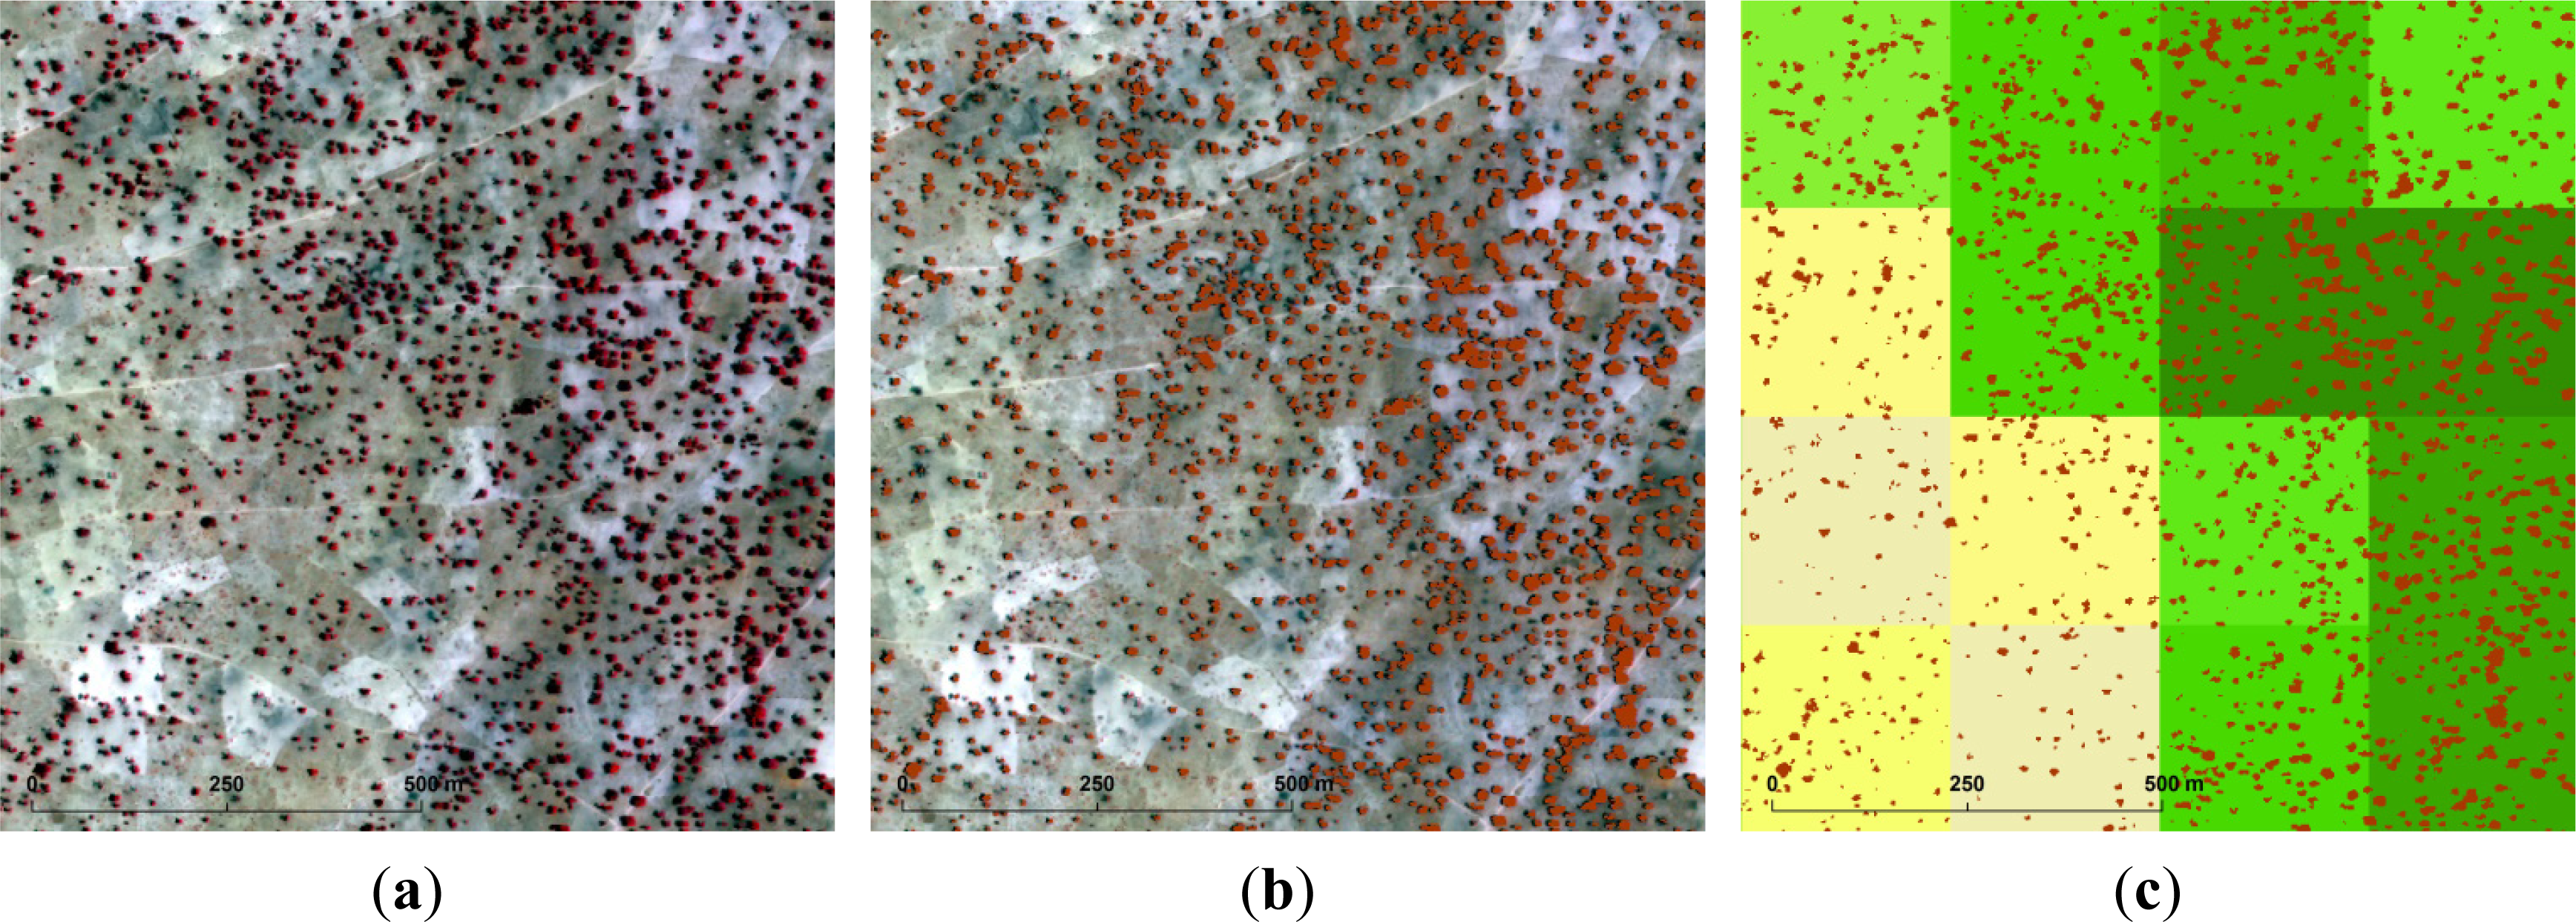
2.3.1. Orbview-Derived Reference Map
2.3.2. MODIS-Derived Input Variables
2.3.3. Georectification of Corona Image
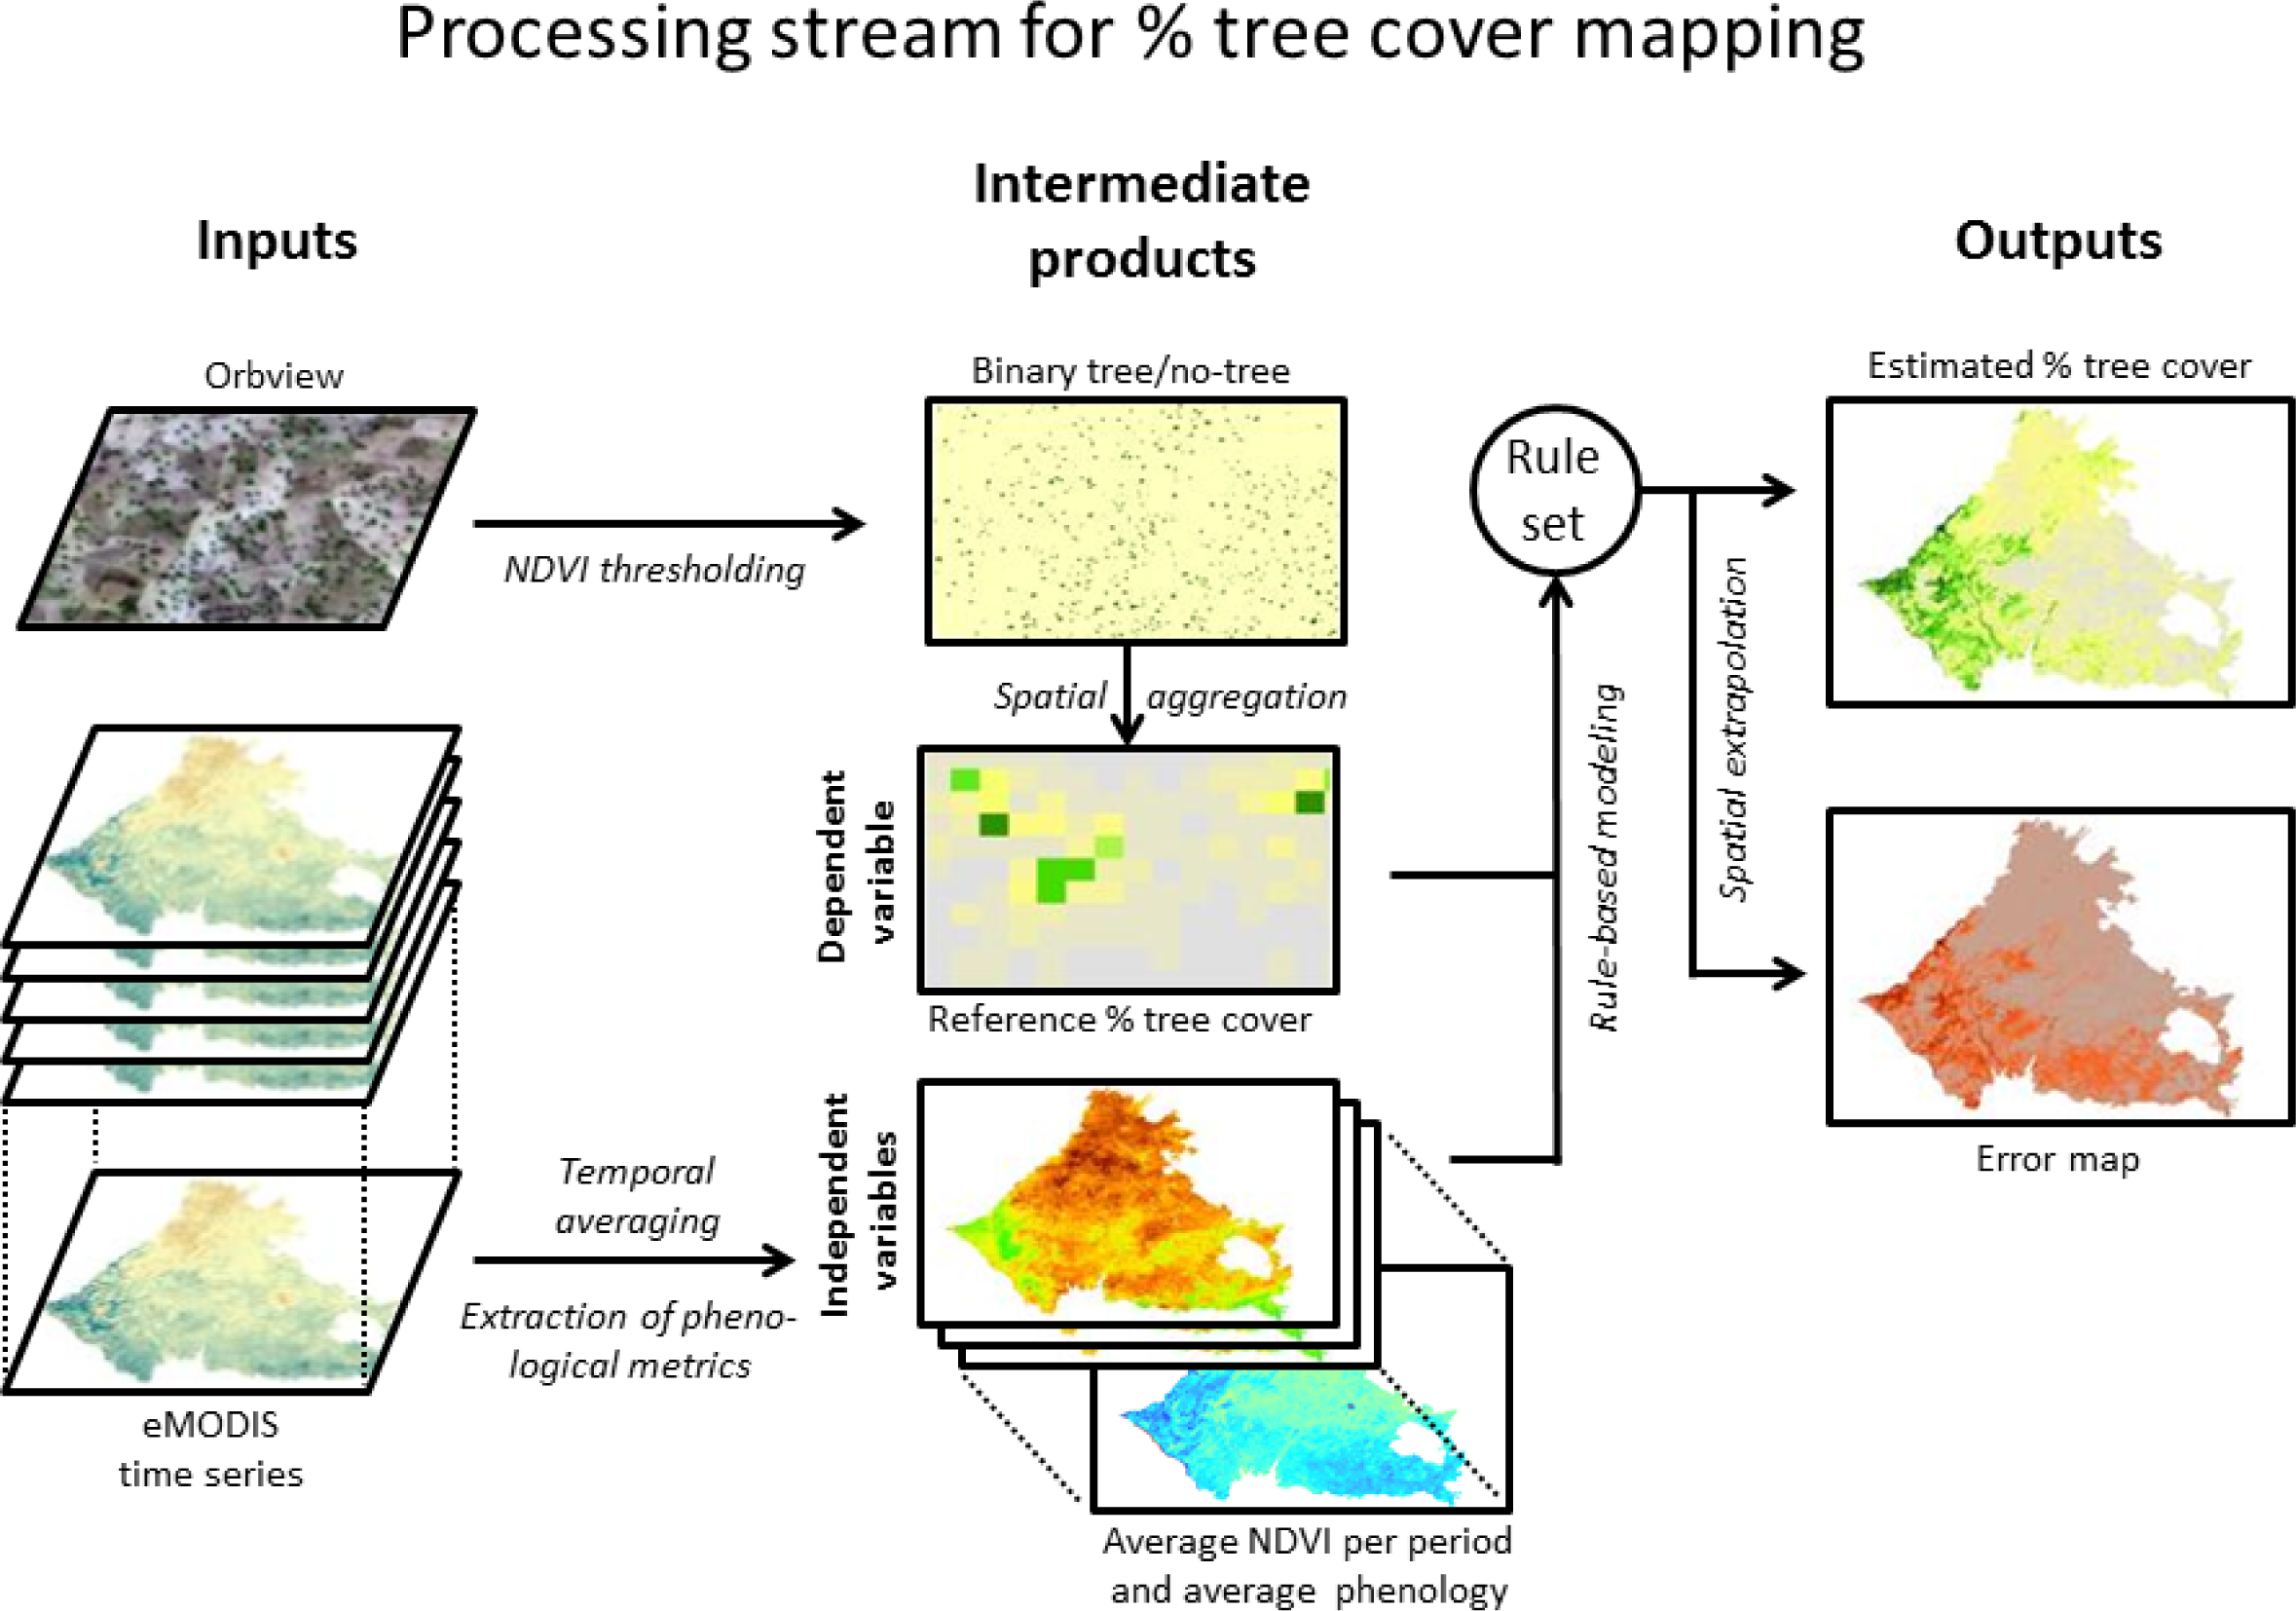
2.4. Rule-Based Modeling and Spatial Application
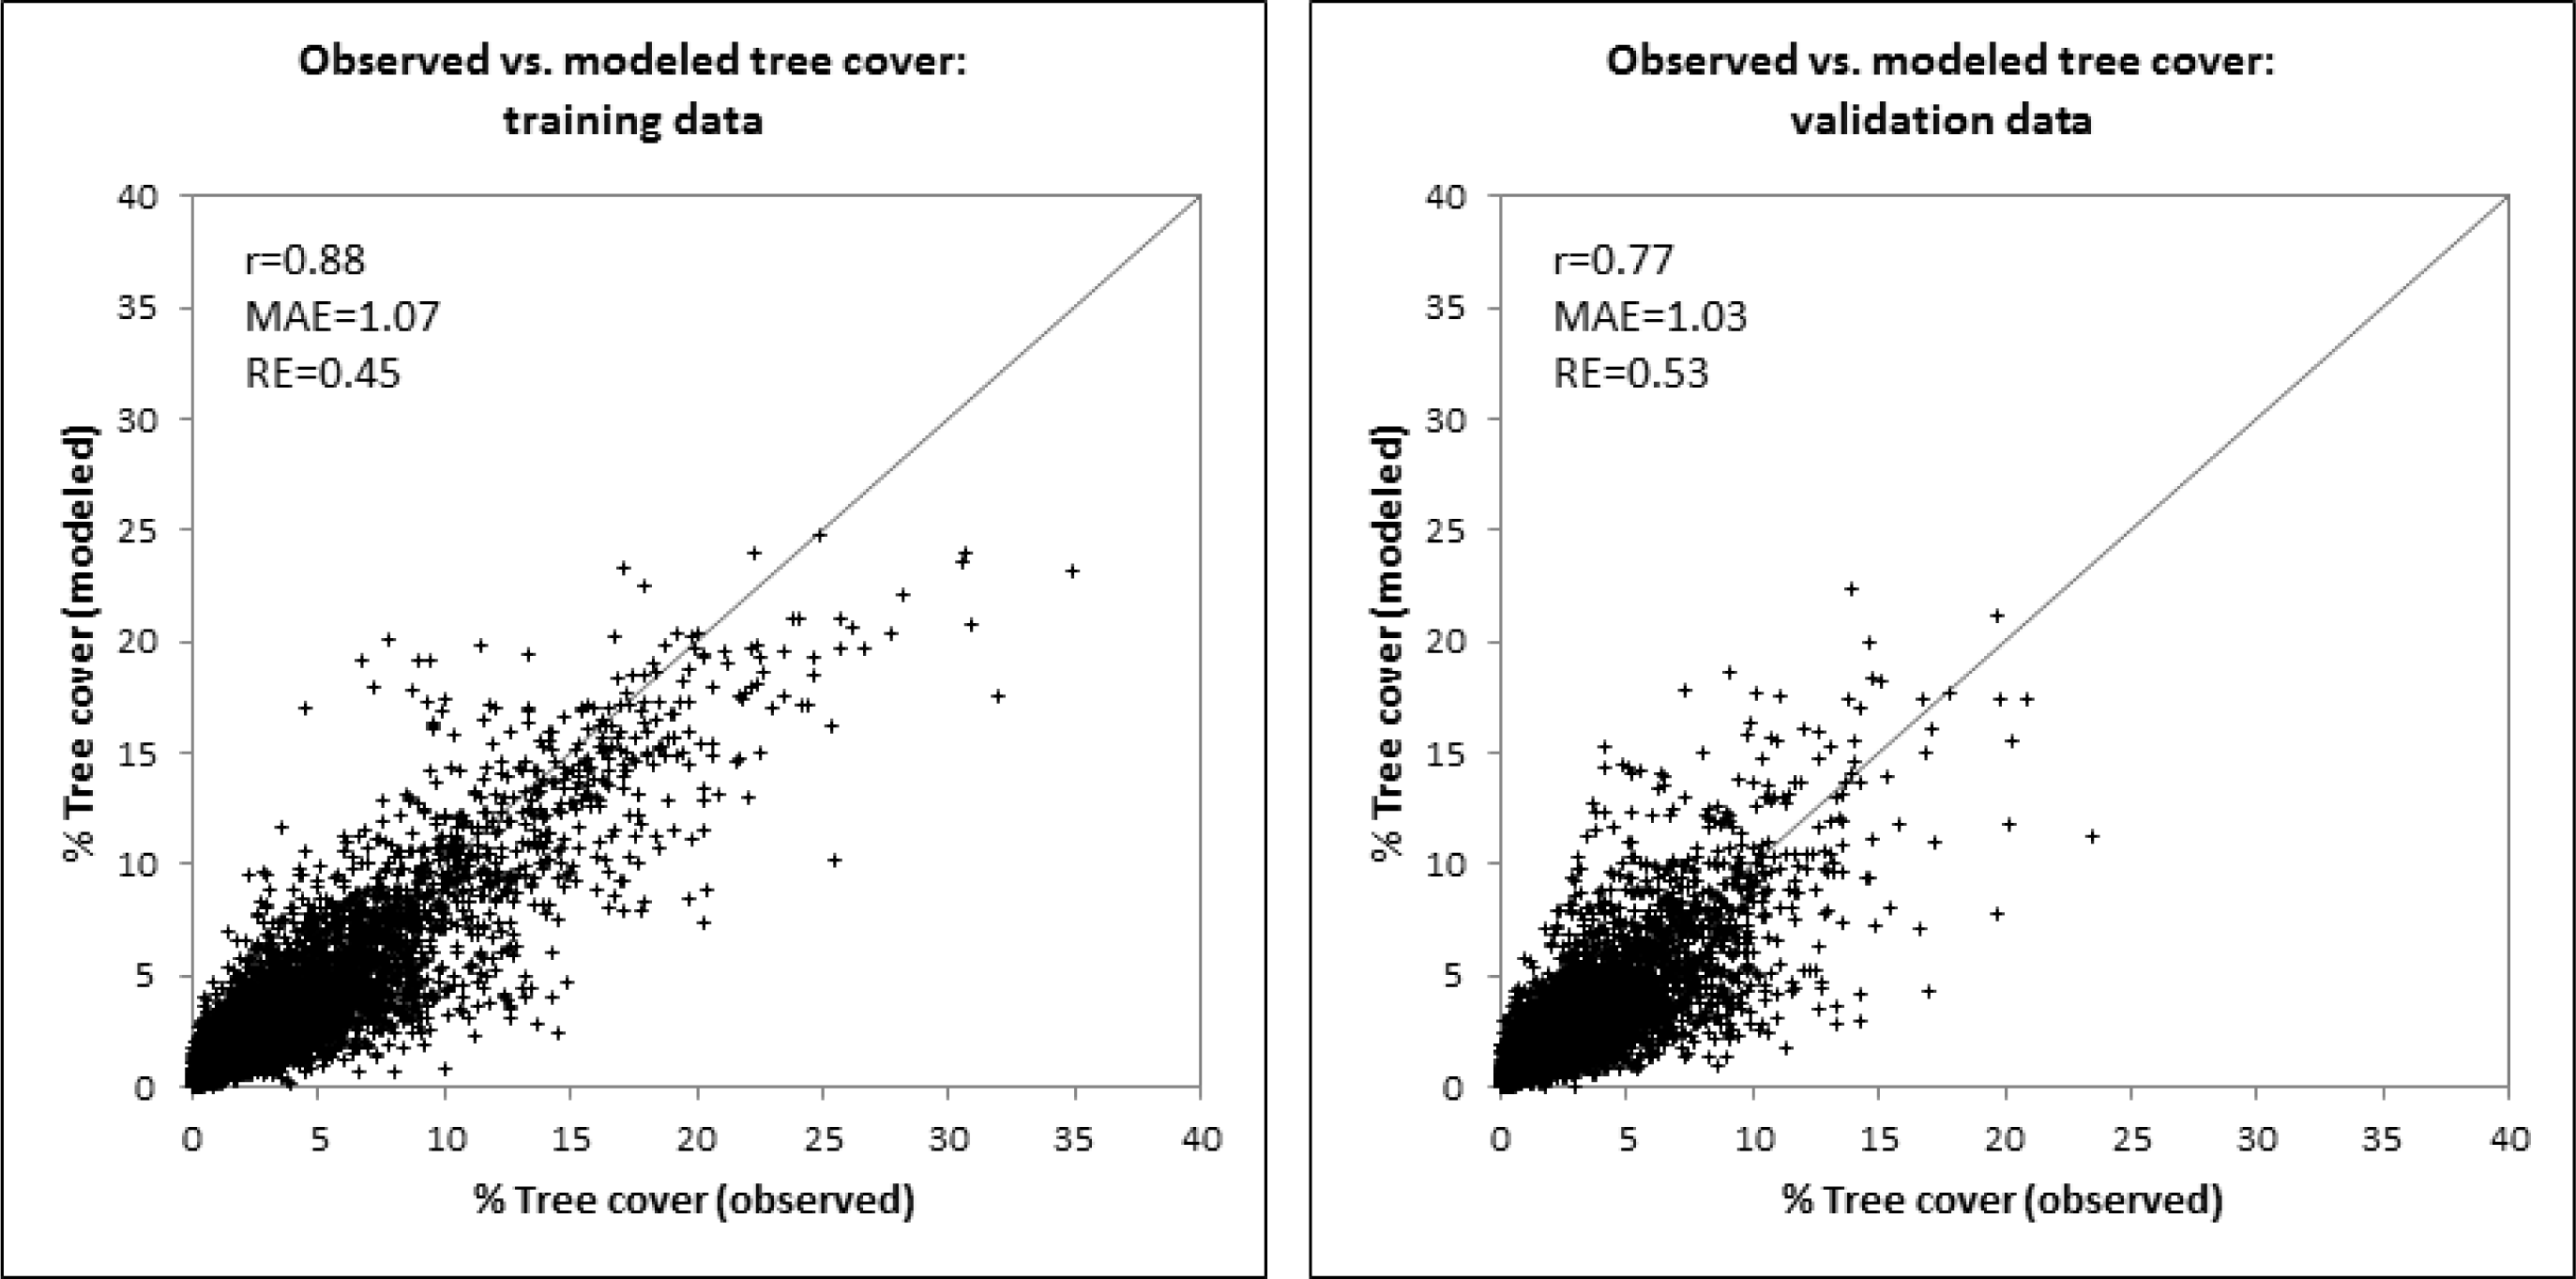
2.5. Model Validation
2.6. Change Detection Application
3. Results and Discussion
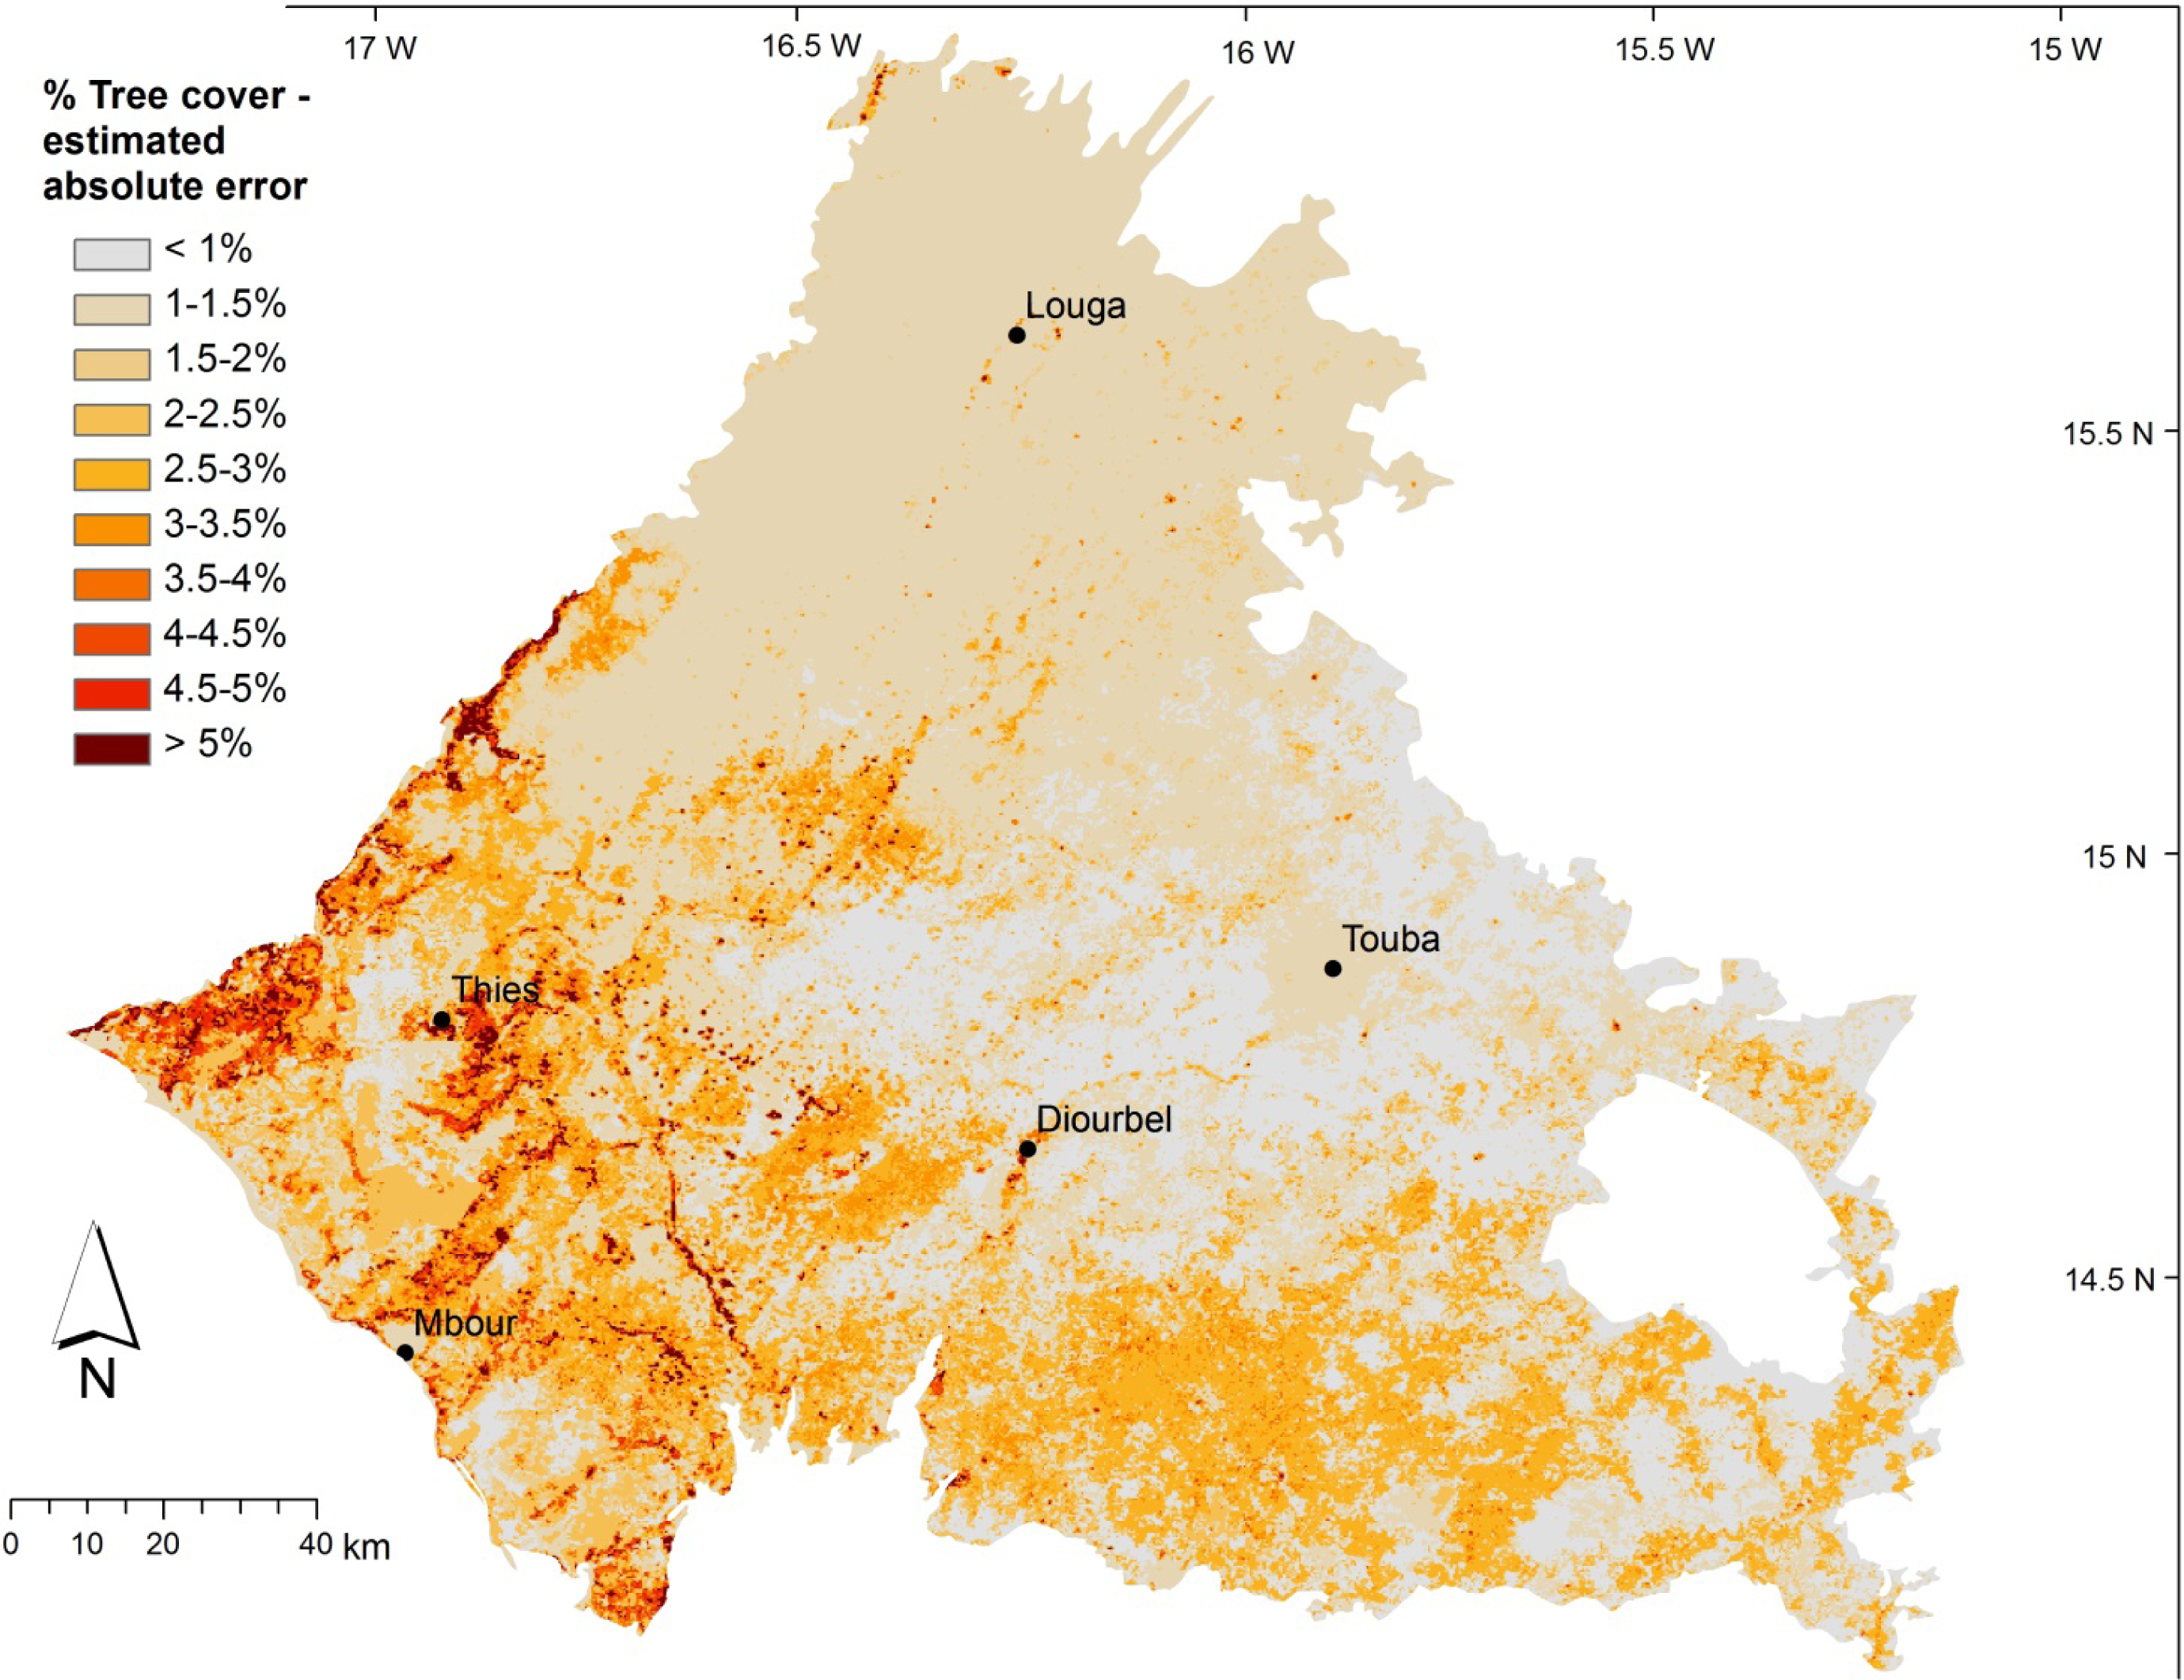
3.1. Model Accuracy and Variables Used
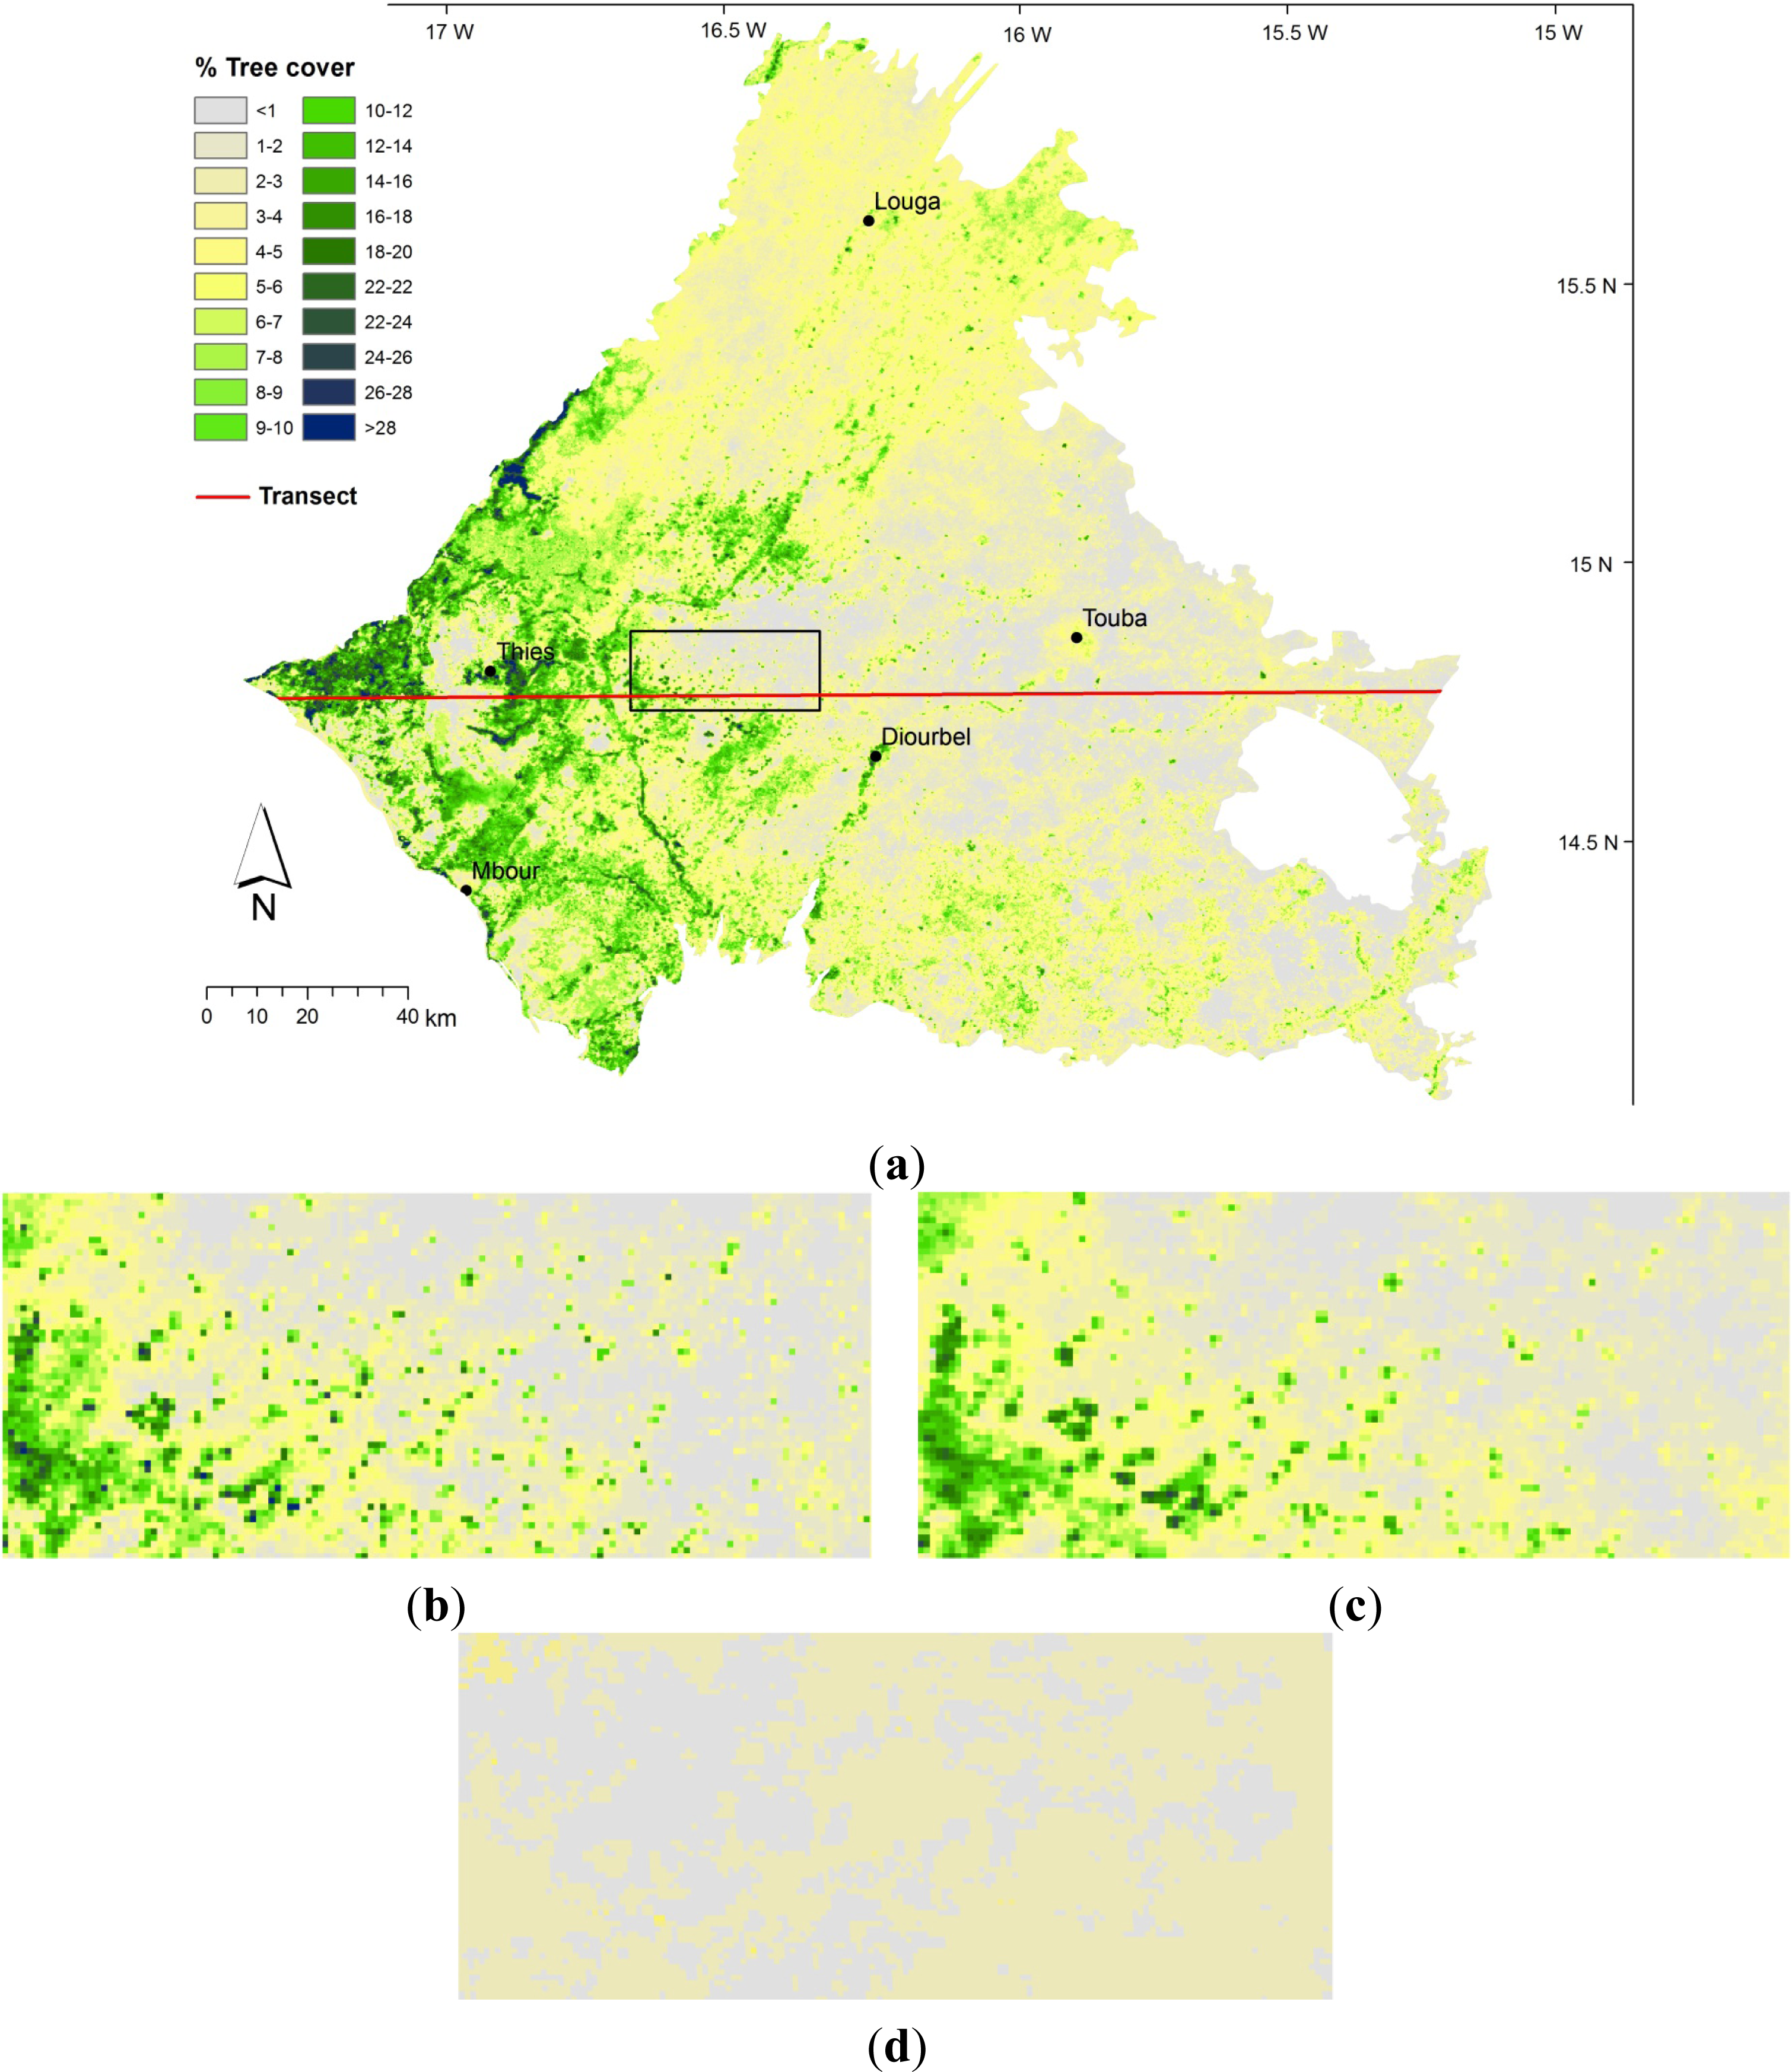
3.2. Spatial Patterns of Tree Cover and Their Interpretation
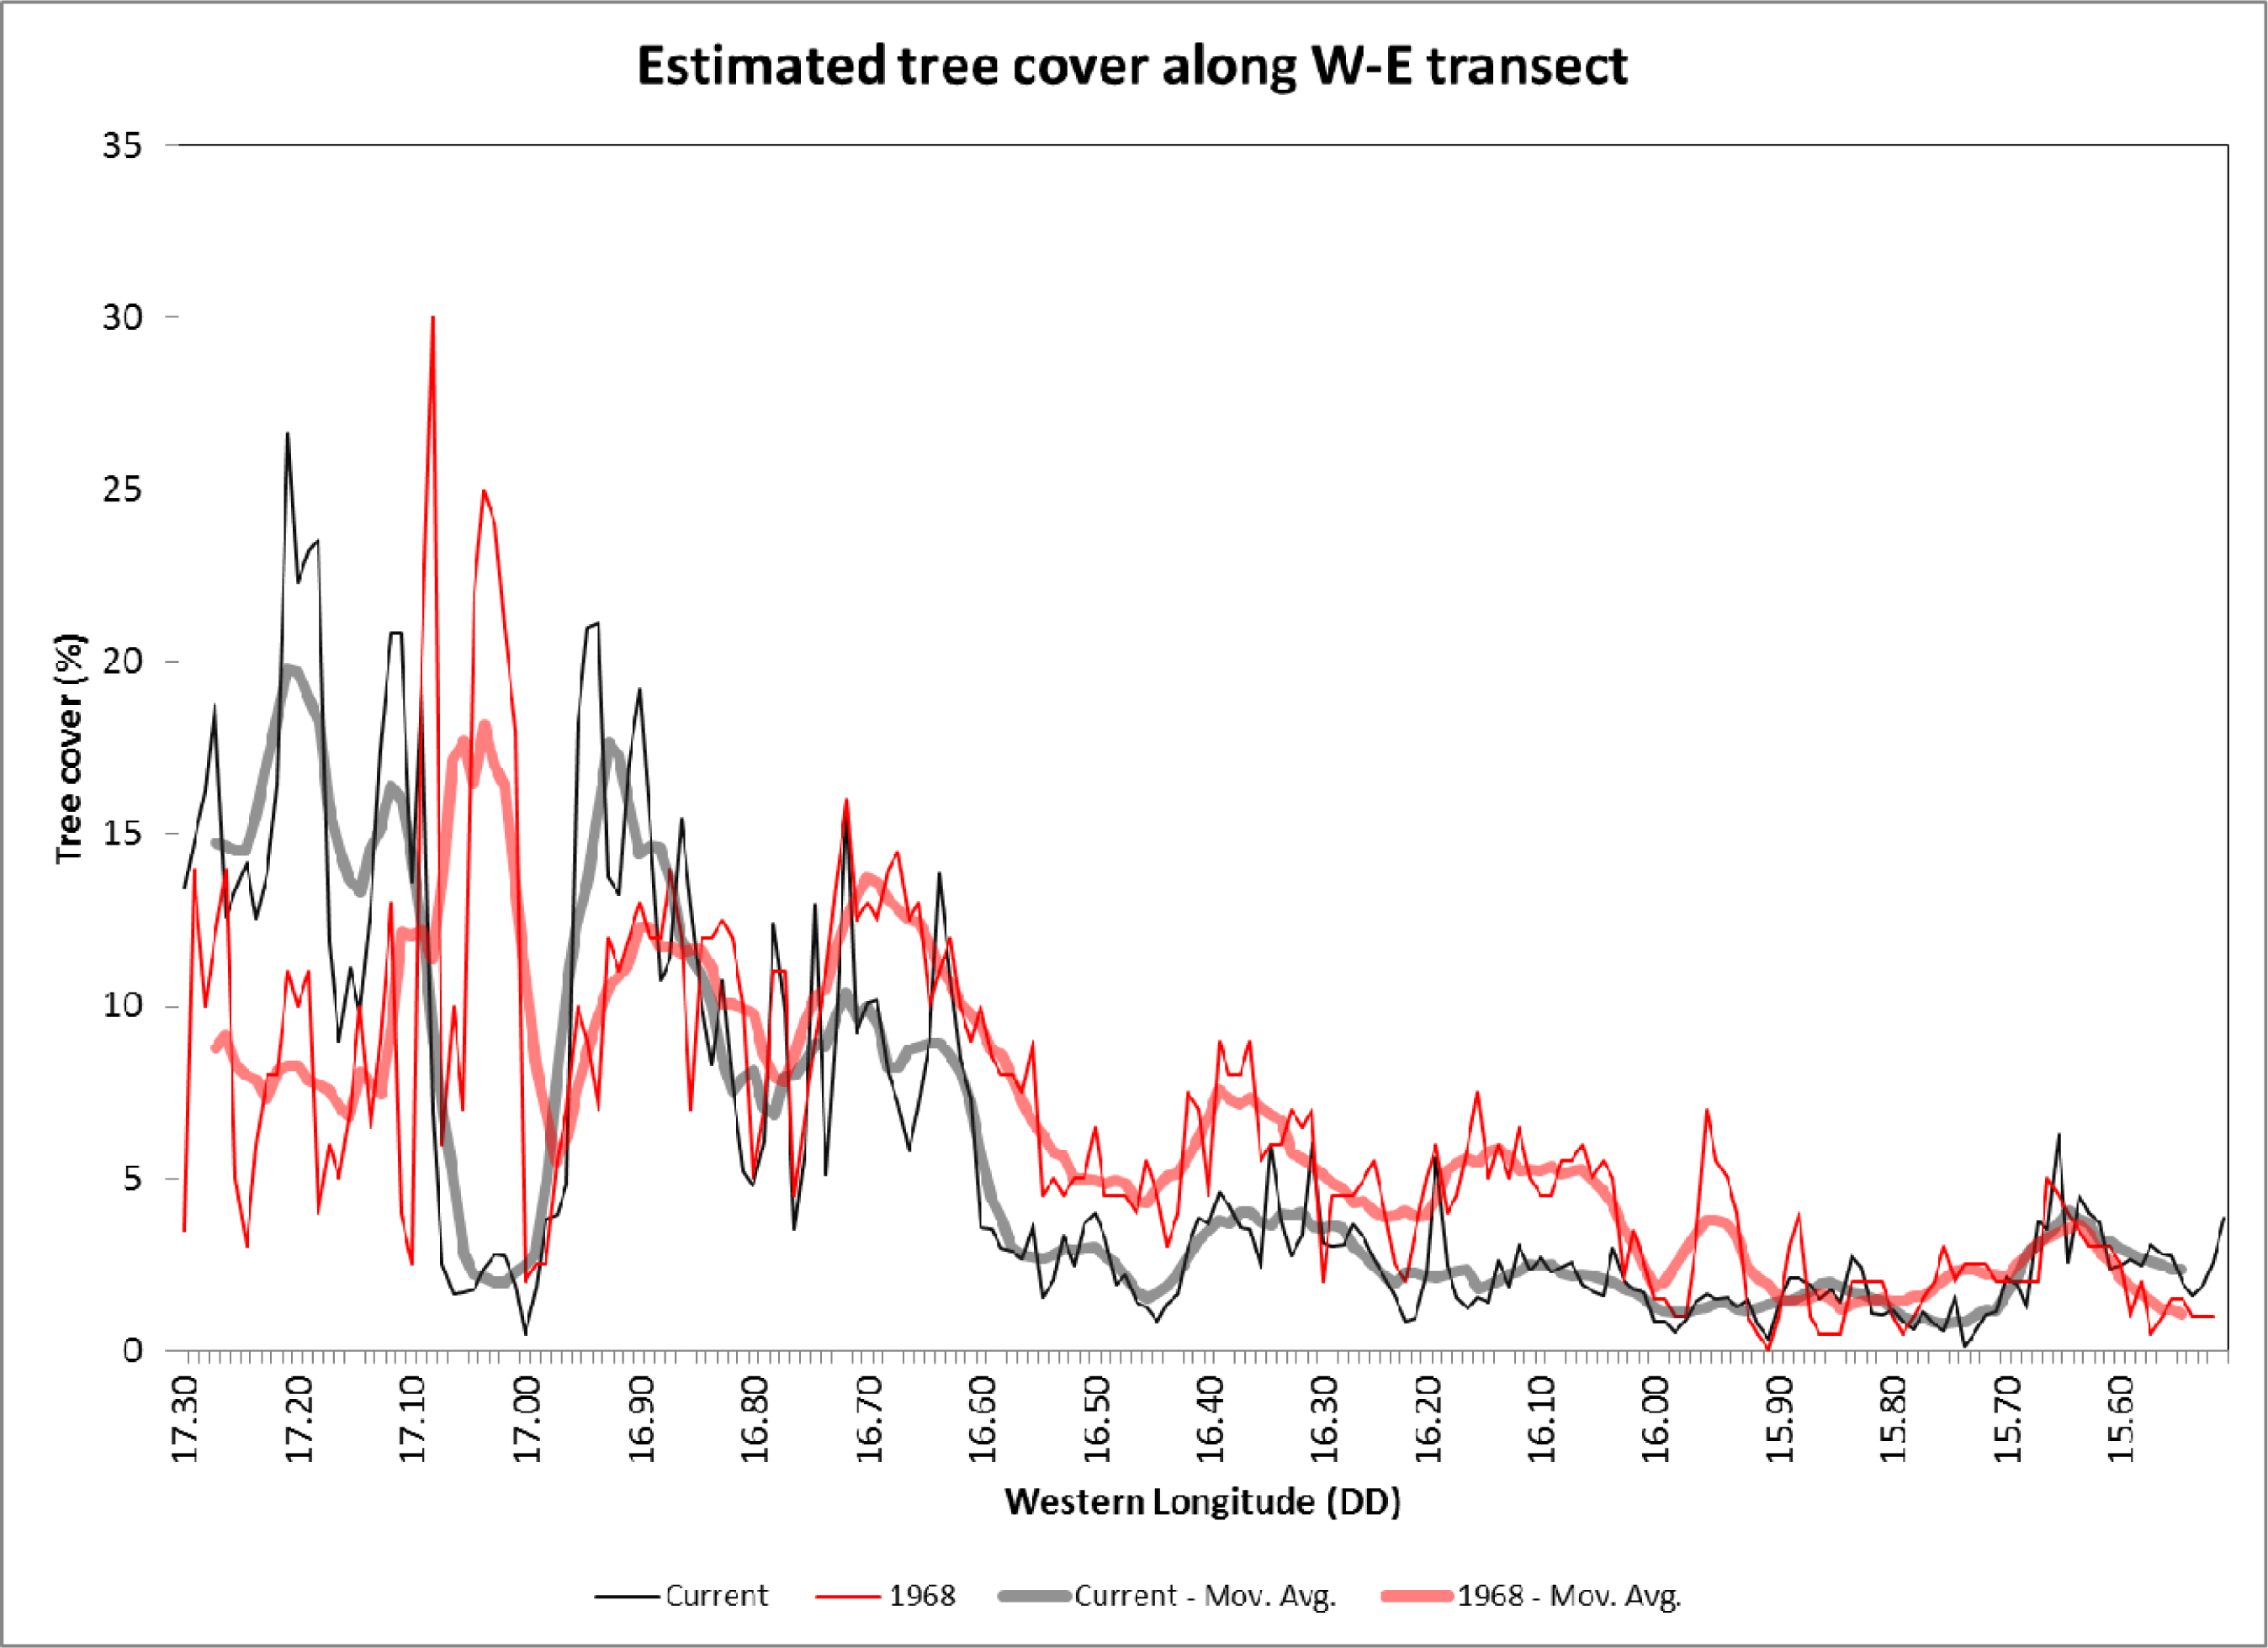
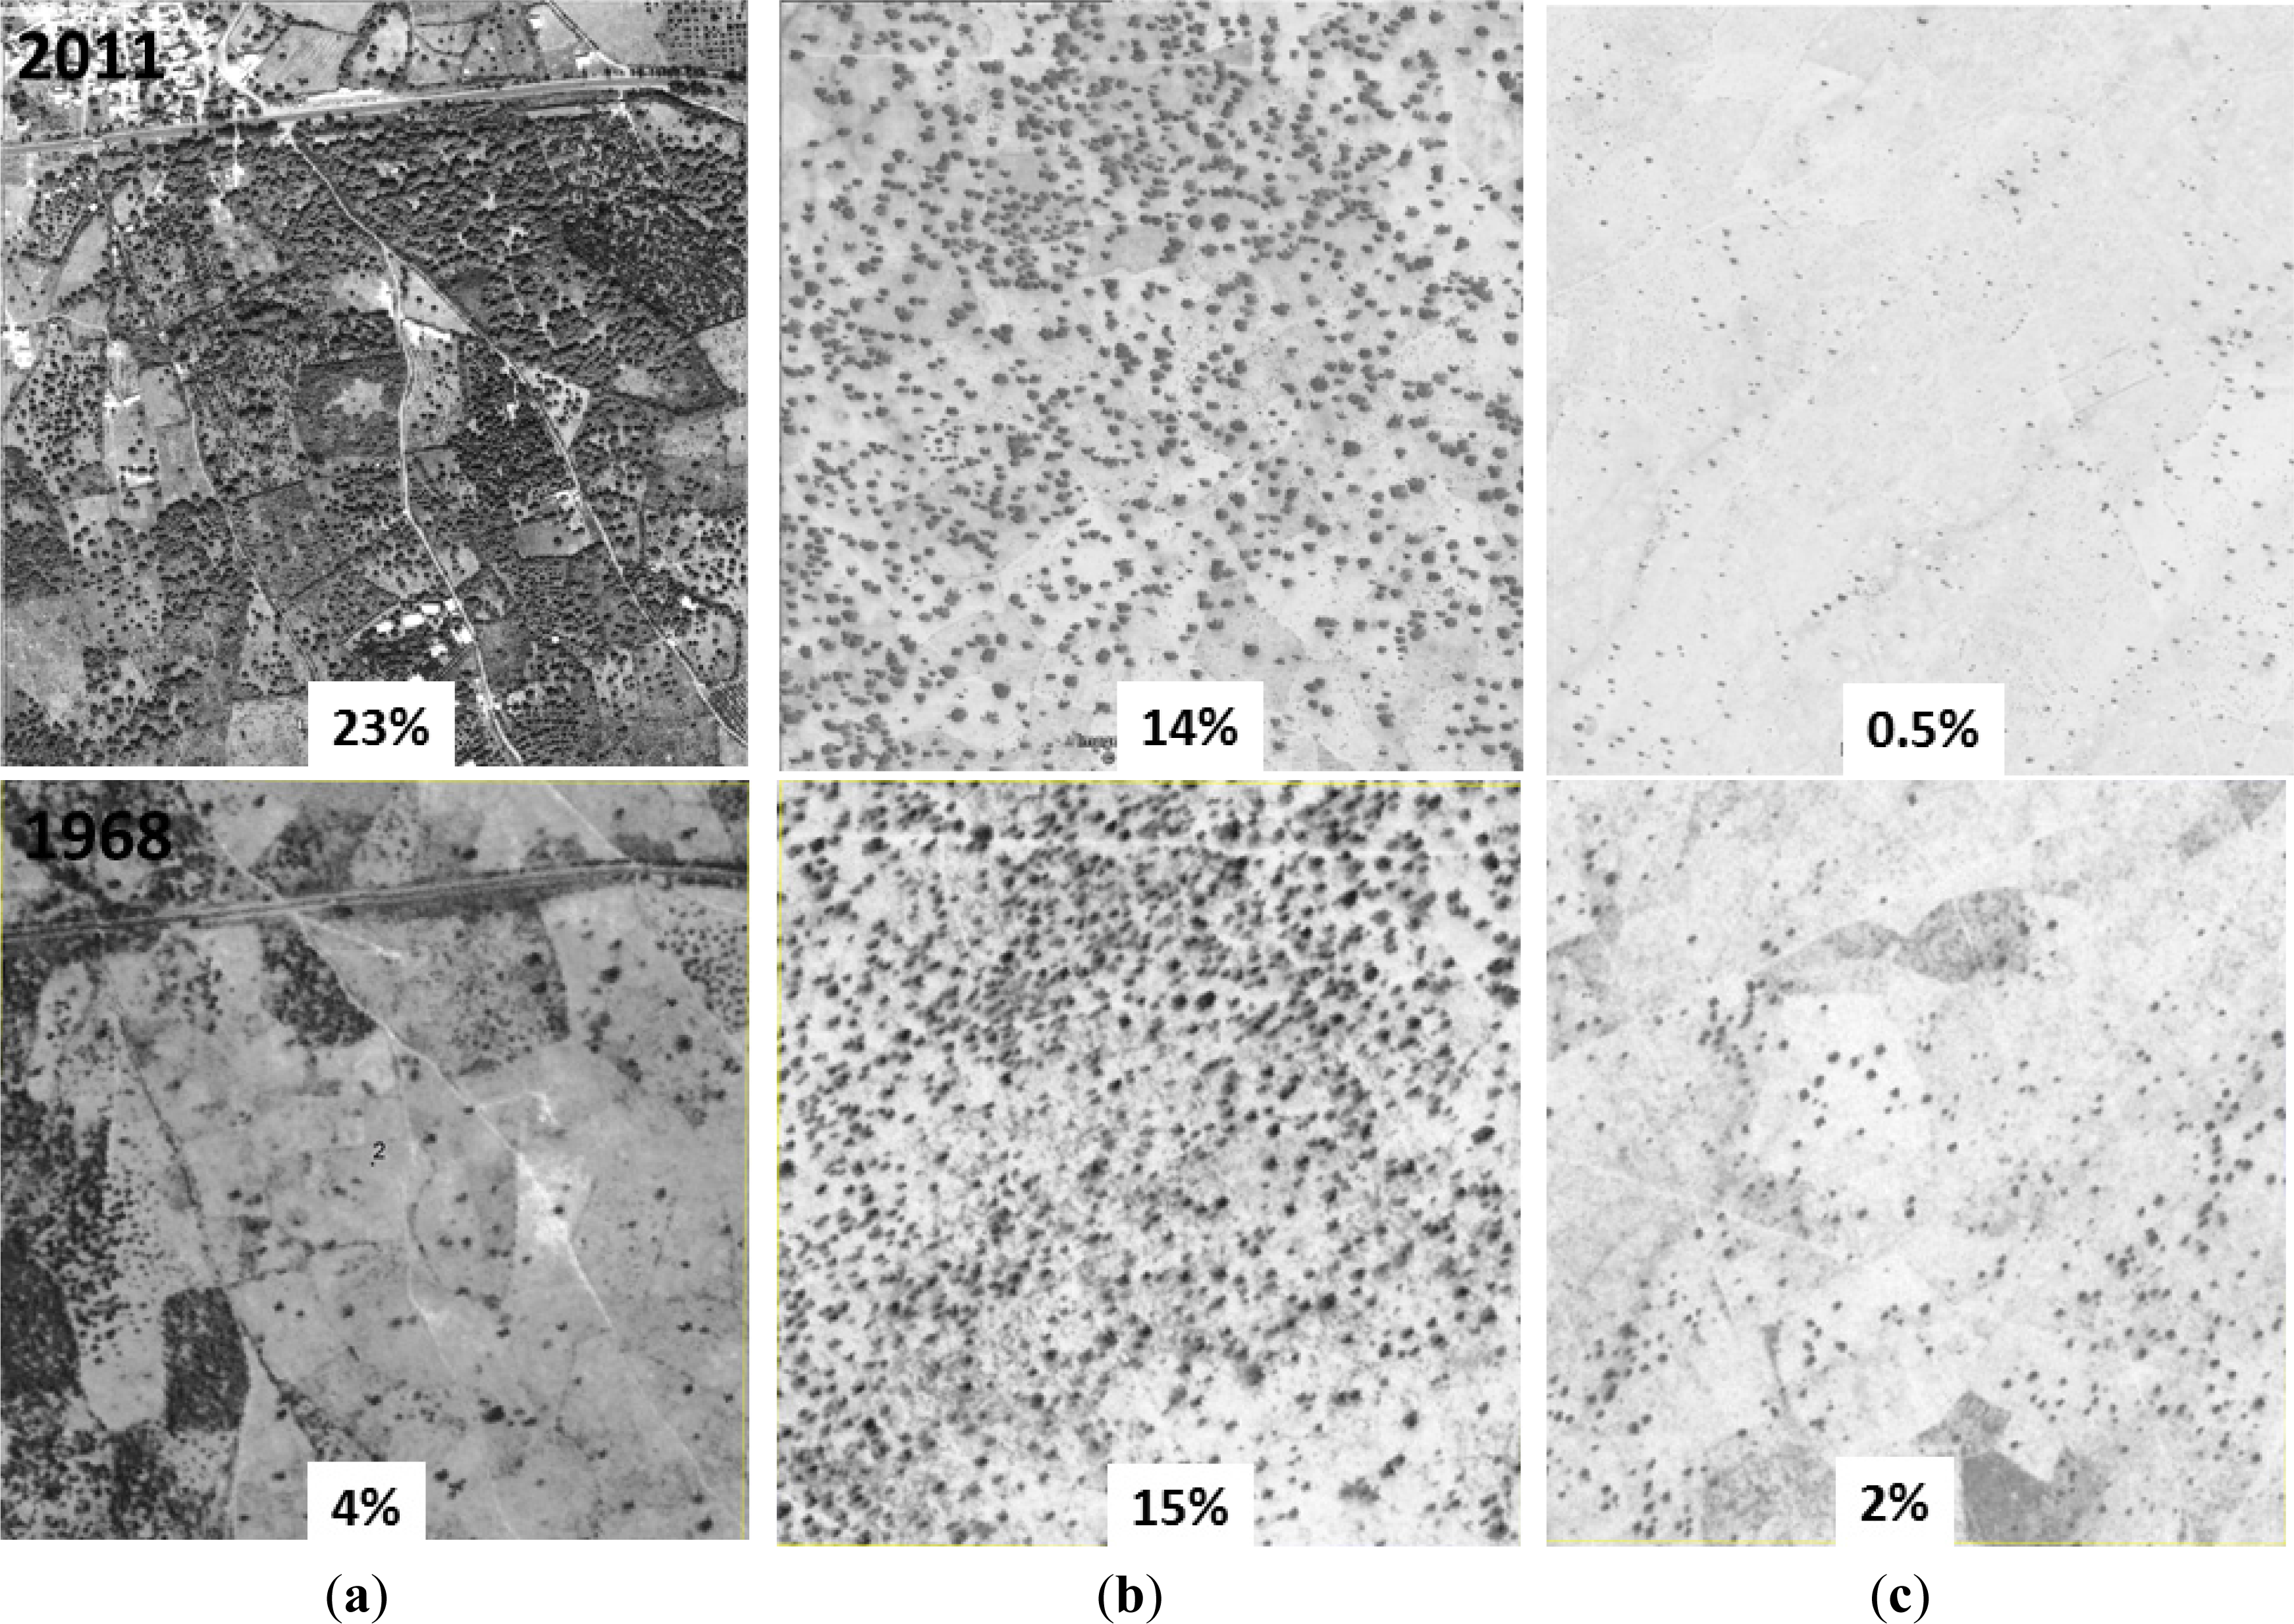
3.3. Stability and Change Since 1968
3.4. Applicability to Other Geographic Areas
4. Conclusions
Acknowledgments
Conflict of Interest
References
- Boffa, J.-M. Agroforestry Parklands in Sub Saharan Africa; FAO: Rome, Italy, 1999. [Google Scholar]
- Boffa, J.-M. West African agroforestry parklands: keys to conservation and sustainable management. Unasylva 2000, 51, 11–17. [Google Scholar]
- Pullan, A. Farmed parkland in West Africa. Savanna. 1974, 3, 119–152. [Google Scholar]
- Gonzalez, P. Desertification and a shift of forest species in the West Africa Sahel. Clim. Res 2001, 17, 217–228. [Google Scholar]
- Haglund, E.; Ndjeunga, J.; Snook, L.; Pasternak, D. Dry land tree management for improved household livelihoods: Farmer managed natural regeneration in Niger. J. Environ. Manage 2011, 92, 1696–1705. [Google Scholar]
- Garrity, D.P.; Akinnifesi, F.K.; Ajayi, O.C.; Weldesemayat, S.G.; Mowo, J.G.; Kalinganire, A.; Larwanou, M.; Bayala, J. Evergreen Agriculture: a robust approach to sustainable food security in Africa. Food Secur 2010, 2, 197–214. [Google Scholar]
- Reij, C.; Tappan, G.; Smale, M. Agroenvironmental. Transformation in the Sahel: Another Kind of “Green Revolution”; IFPRI Discussion Paper 914; International Food Policy Research Institute: Washington, DC, USA, 2009. [Google Scholar]
- Zomer, R.J.; Trabucco, A.; Coe, R.; Place, F. Trees on Farm: Analysis of Global Extent and Geographical Patterns of Agroforestry; ICRAF Working Paper 89; World Agroforestry Centre: Nairobi, Kenya, 2009. [Google Scholar]
- Chuvieco, E.; Huete, A. Fundamentals of Satellite Remote Sensing; FLCRC Press: Boca Raton, FL, USA, 2010. [Google Scholar]
- DeFries, R.S.; Hansen, M.C.; Townshend, J.R.G.; Janetos, A.C.; Loveland, T.R. A new global 1-km dataset of percentage tree cover derived from remote sensing. Glob. Change Biol 2000, 6, 247–254. [Google Scholar]
- Hansen, M.C.; DeFries, R.S.; Townshend, J.R.G.; Carroll, M.; Dimiceli, C.; Sohlberg, R.A. Global percent tree cover at a spatial resolution of 500 meters: First results of the MODIS vegetation continuous fields algorithm. Earth Interact 2003, 7, 1–15. [Google Scholar]
- Rokhmatuloh, D.N.; Al Bilbisi, H.; Tateishi, R. Percent tree cover estimation using regression tree method: A case study of Africa with very high resolution QuickBird images as training data. IEEE Trans. Geosci. Remote 2005, 3, 2157–2160. [Google Scholar]
- Souza, C.; Barreto, P. An alternative approach for detecting and monitoring selectively logged forests in the Amazon. Int. J. Remote Sens 2000, 21, 173–179. [Google Scholar]
- Lu, D.S.; Moran, E.; Batistella, M. Linear mixture model applied to Amazonian vegetation classification. Remote Sens. Environ 2003, 84, 456–469. [Google Scholar]
- Wang, C.; Qi, J.; Cochrane, M. Assessment of tropical forest degradation with canopy fractional cover from Landsat ETM+ and IKONOS imagery. Earth Interact 2005, 9, 1–18. [Google Scholar]
- Huang, C.; Yang, L.; Wylie, B.; Homer, C. A strategy for Estimating Tree Canopy Density Using Landsat 7 ETM+ and High Resolution Images over Large Areas. Proceedings of Third International Conference on Geospatial Information in Agriculture and Forestry, Denver, CO, USA, 5–7 November 2001.
- Favier, C.; Aleman, J.; Bremond, L.; Dubois, M.A.; Freycon, V.; Yangakola, J.-M. Abrupt shifts in African savanna tree cover along climatic gradient. Glob. Ecol. Biogeogr 2012, 21, 787–797. [Google Scholar]
- Tappan, G.G.; Sall, M.; Wood, E.C.; Cushing, M. Ecoregions and land cover trends in Senegal. J. Arid Environ 2004, 59, 427–462. [Google Scholar]
- Mbow, C.; Mertz, O.; Diouf, A.; Rasmussen, K.; Reenberg, A. The history of environmental change and adaptation in eastern Saloum, Senegal. Driving forces and perceptions. Glob. Planet. Change 2008, 64, 210–221. [Google Scholar]
- IPCC, Climate Change 2007—Impacts, Adaptation and Vulnerability. Contribution of Working Group II to the Fourth Assessment Report of the IPCC; Cambridge University Press: Cambridge, UK, 2007.
- Tschakert, P.; Tappan, G. The social context of carbon sequestration: considerations from a multi-scale environmental history of the Old Peanut Basin of Senegal. J. Arid Environ 2004, 59, 535–564. [Google Scholar]
- FAO, “Climate-Smart” Agriculture. Policies, Practices and Financing for Food Security, Adaptation and Mitigation; FAO: Rome, Italy, 2010.
- Homer, C.G.; Aldridge, C.L.; Meyer, D.K.; Schell, S.J. Multi-scale remote sensing sagebrush characterization with regression trees over Wyoming, USA: Laying a foundation for monitoring. Int. J. Appl. Earth Obs 2012, 14, 233–244. [Google Scholar]
- Townshend, J.R.G.; Justice, C.O. Towards operational monitoring of terrestrial systems by moderate-resolution remote sensing. Remote Sens. Environ 2002, 83, 351–359. [Google Scholar]
- Garcia-Moran, T.J.; Mas, J.-F.; Hinkley, E.A. Land cover mapping applications with MODIS; a literature review. Int. J. Digit. Earth 2012, 9, 63–87. [Google Scholar]
- Tucker, C.J. Red and photographic infrared linear combinations for monitoring vegetation. Remote Sens. Environ 1979, 8, 127–150. [Google Scholar]
- Tucker, C.J.; Nicholson, S.E. Variations in the size of the Sahara Desert from 1980 to 1997. Ambio 1999, 28, 587–591. [Google Scholar]
- Swets, D.L.; Reed, B.C.; Rowland, J.D.; Marko, S.E. A weighted least-squares approach to temporal NDVI smoothing. Proceedings of ASPRS Annual Conference: From Image to Information, Portland, Oregon; 1999. [Google Scholar]
- USGS, eMODIS Africa Product Guide Version 1.0; USGS EROS Data Center: Sioux Falls, SD, USA, 2011.
- McDonald, R.A. Corona: success for space reconnaissance, a look into the Cold War, and a revolution in intelligence. Photgramm. Eng. Remote Sens 1995, 61, 689–720. [Google Scholar]
- Bitelli, G.; Girelli, V.A. Metrical use of declassified satellite imagery for an area of archaeological interest in Turkey. J. Cult. Herit 2009, 10S, 35–40. [Google Scholar]
- Hamandawana, H.; Eckardt, F.; Chanda, R. Linking archival and remotely sensed data for long-term environmental monitoring. Int. J. Appl. Earth Obs 2005, 7, 284–298. [Google Scholar]
- Wardell, D.A.; Reenberg, A.; Tottrup, C. Historical footprints in contemporary landuse systems: forest cover changes in savannah woodlands in the Sudano-Sahelian zone. Glob. Environ. Chang 2003, 13, 235–254. [Google Scholar]
- Tappan, G.G.; Hadj, A.; Wood, E.; Lietzow, R.W. Use of Argon, Corona, and Landsat imagery to assess 30 years of land resource changes in West-Central Senegal. Photogramm. Eng. Remote Sens 2000, 66, 727–735. [Google Scholar]
- Eklundh, L.; Joensson, P. Timesat 3.0 Software Manual; Lund University: Lund, Sweden, 2010. [Google Scholar]
- Wagenseil, H.; Samimi, C. Woody Vegetation Cover in Namibian Savannahs: A Modelling Approach Based on Remote Sensing. Erdkunde 2007, 61, 325–334. [Google Scholar]
- Eklundh, L.; Olsson, L. Vegetation index trends for the African Sahel 1982–1999. Geophys. Res. Lett. 2003, 30. [Google Scholar] [CrossRef]
- Olsson, L.; Eklundh, L.; Ardoe, J. A recent greening of the Sahel—Trends, patterns and potential causes. J. Arid Environ 2005, 63, 556–566. [Google Scholar]
- Seaquist, J.W.; Olsson, L.; Ardoe, J.; Eklundh, L. Broad-scale increase in NPP quantified for the African Sahel, 1982–1999. Int. J. Remote Sens 2006, 27, 5115–5122. [Google Scholar]
- Heumann, B.W.; Seaquist, J.W.; Eklundh, L.; Joensson, P. AVHRR derived phenological change in the Sahel and Soudan, Africa, 1982–2005. Remote Sens. Environ 2007, 108, 385–392. [Google Scholar]
- Schowengerdt, R.A. Remote Sensing: Models and Methods for Image Processing, 3rd ed; Academic Press: London, UK, 2007. [Google Scholar]
- Breiman, L.; Olshen, J.; Stone, C. Classification and Regression Trees; Chapman and Hill: New York, NY, USA, 1984. [Google Scholar]
- Kuhn, M.; Johnson, K. Applied Predictive Modeling; Springer: New York, NY, USA, 2013. [Google Scholar]
- Atkinson, P.M; Foody, G.M. Uncertainty in Remote Sensing and GIS: Fundamentals. In Uncertainty in Remote Sensing and GIS; Foody, G.M., Atkinson, P.M., Eds.; Wiley: Chichester, West Sussex, UK, 2002; Chapter 1; pp. 1–18. [Google Scholar]
- Willmott, C.J.; Matsuura, K. Advantages of the mean absolute error (MAE) over the root mean square error (RMSE) in assessing average model performance. Clim. Res 2005, 30, 79–82. [Google Scholar]
- Terry, R.D.; Chilingar, G.V. Comparison charts for visual estimation of percent composition. Allen Hancock Foundation. Los Angeles, CA. Reprinted from. J. Sediment. Petrol 1955, 23, 226–234. [Google Scholar]
- Touré Fall, S.; Fall, A.S.; Cisse, I. Urban livestock systems in the Niayes zones in Senegal. Urban. Agric. Mag 2000, 2, 17–19. [Google Scholar]
- Hirai, M. A vegetation-maintaining system as a livelihood strategy among the Seerer, West Central Senegal. Afr. Study Monogr. 2005, Suppl. 30, 183–193. [Google Scholar]
- Townshend, J.R.G.; Carroll, M.; Dimiceli, C.; Sohlberg, R.; Hansen, M.; DeFries, R. Vegetation Continuous Fields MOD44B, 2001–2010 Percent Tree Cover, Collection 5; University of Maryland: College Park, MD, USA, 2011. Available online: http://glcf.umd.edu/data/vcf/ (accessed on 21 January 2013).
- Ba, Y. Problématique de la lutte contre la dégradation des ressources naturelles dans la communauté rurale de Fandène. (département de Thies.); Université Cheikh Anta Diop: Dakar, Senegal, 2010. [Google Scholar]


| Tree Cover Category | MAE in Training Data | MAE in Validation Data |
|---|---|---|
| 5% tree cover and less | 0.74% (N = 6722) | 0.81% (N = 6469) |
| 5%–10% tree cover | 2.11% (N = 1049) | 2.32% (N = 814) |
| 10%–15% tree cover | 3.15% (N = 276) | 3.70% (N = 119) |
| 15%–20% tree cover | 3.21% (N = 129) | 4.56% (N = 14) |
| 20% tree cover and more | 6.68% (N = 54) | 7.20% (N = 4) |
© 2013 by the authors; licensee MDPI, Basel, Switzerland This article is an open access article distributed under the terms and conditions of the Creative Commons Attribution license ( http://creativecommons.org/licenses/by/3.0/).
Share and Cite
Herrmann, S.M.; Wickhorst, A.J.; Marsh, S.E. Estimation of Tree Cover in an Agricultural Parkland of Senegal Using Rule-Based Regression Tree Modeling. Remote Sens. 2013, 5, 4900-4918. https://doi.org/10.3390/rs5104900
Herrmann SM, Wickhorst AJ, Marsh SE. Estimation of Tree Cover in an Agricultural Parkland of Senegal Using Rule-Based Regression Tree Modeling. Remote Sensing. 2013; 5(10):4900-4918. https://doi.org/10.3390/rs5104900
Chicago/Turabian StyleHerrmann, Stefanie M., Andrew J. Wickhorst, and Stuart E. Marsh. 2013. "Estimation of Tree Cover in an Agricultural Parkland of Senegal Using Rule-Based Regression Tree Modeling" Remote Sensing 5, no. 10: 4900-4918. https://doi.org/10.3390/rs5104900