Advances in Disaster Modeling, Simulation and Visualization for Sandstorm Risk Management in North China


Abstract
:1. Introduction
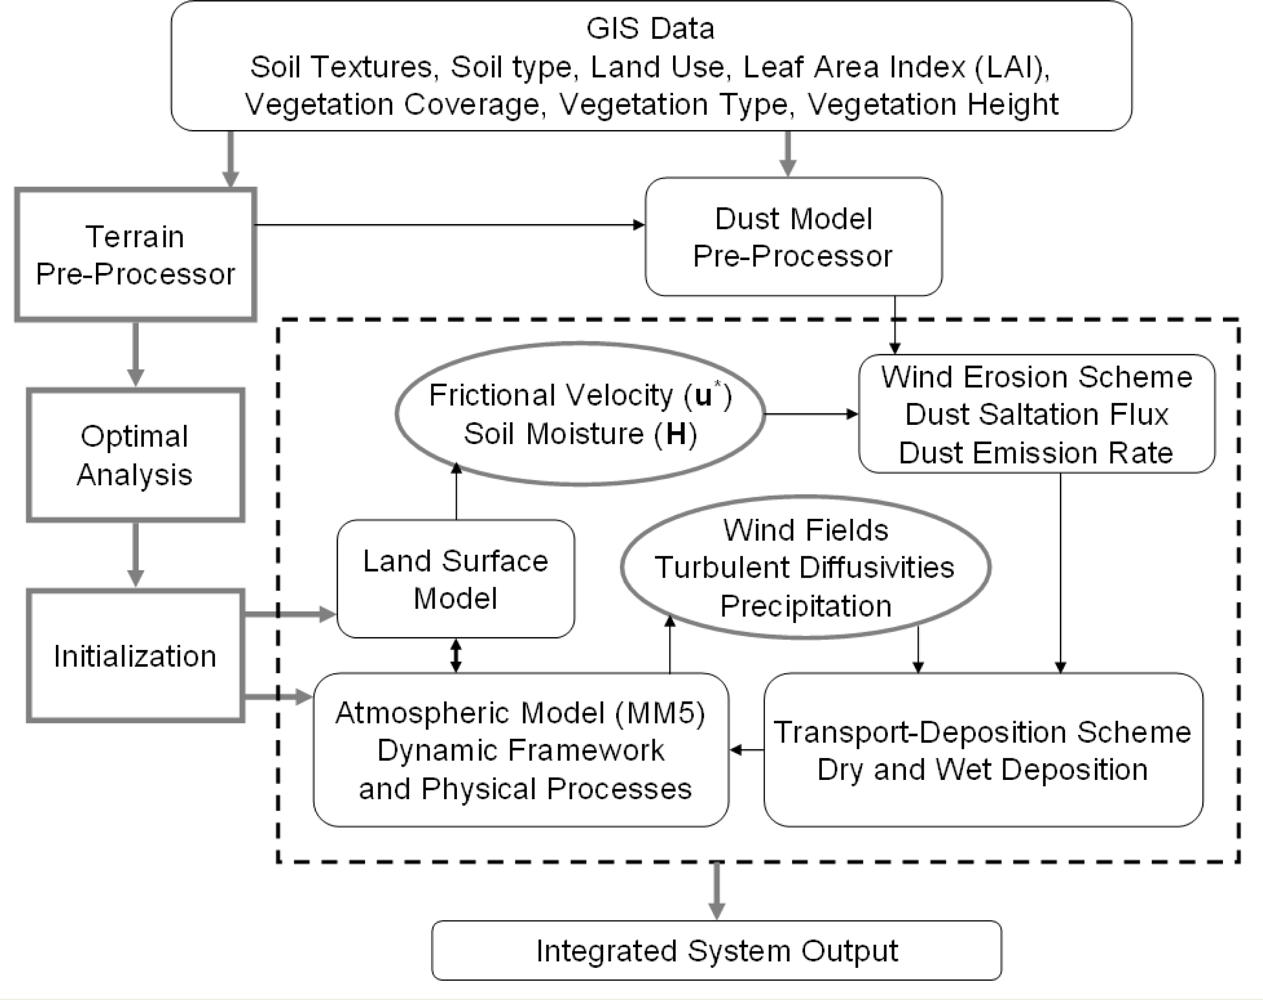
2. IAP Dust Storm Simulation and Prediction System (IAPS)
3. Impact of Land Surface Processes on Dust Storm Simulations
3.1. Dust Episode of 24–25 March 2002
3.2. Dust Episode of 21–24 April 2002
4. Discussion
5. Conclusions
Acknowledgments
References
- Gao, T.; Yu, X.; Ma, Q.; Li, H.; Li, X.; Si, Y. Climatology and trends of the temporal and spatial distribution of sandstorms in inner Mongolia. Water Air Soil Poll 2003, 3, 51–66. [Google Scholar]
- Quan, Q.; Pan, B.; Li, N.; Li, Q.; Zhang, J.; Xu, S.; Gao, H.; Liu, J. Loess record of the evolution history of severe sandstorms in the Tengger Desert during the Last Interglacial Period (MIS5). Geosciences J 2010, 14, 155–162. [Google Scholar]
- Li, S.; Dong, S.; Zhang, X.; Gao, Z. Assessment of land degradation and its spatial and temporal variation in Beijing surrounding area. Proc. SPIE, 2005. [Google Scholar] [CrossRef]
- Liu, X.; Xie, P.; Liu, Z.; Li, T.; Zhong, L.; Xiang, Y. Economic assessment of acute health impact due to inhalable particulate air pollution in the pearl river delta (in Chinese). Beijing Daxue Xuebao (Ziran Kexue Ban) 2010, 46, 829–834. [Google Scholar]
- Pope, C.A., III; Dockery, D.W. Health effects of fine particulate air pollution: Lines that connect. J. Air Waste Manag. Assoc 2006, 56, 709–742. [Google Scholar]
- Bell, M.L.; Ebisu, K.; Peng, R.D.; Walker, J.; Samet, J.M.; Zeger, S.L.; Dominici, F. Seasonal and regional short-term effects of fine particles on hospital admissions in 202 US counties, 1999–2005. Am. J. Epidemiol 2008, 168, 1301–1310. [Google Scholar]
- Chen, Y.S.; Sheen, P.C.; Chen, E.R.; Liu, Y.K.; Wu, T.N.; Yang, C.Y. Effects of Asian dust storm events on daily mortality in Taipei, Taiwan. Environ. Res 2004, 95, 151–155. [Google Scholar]
- Bell, M.L.; Levy, J.K.; Lin, Z. The effect of sandstorms and air pollution on cause-specific hospital admissions in Taipei, Taiwan. Occup. Environ. Med 2008, 65, 104–111. [Google Scholar]
- Chen, Y.S.; Yang, C.Y. Effects of Asian dust storm events on daily hospital admissions for cardiovascular disease in Taipei, Taiwan. J. Toxicol. Environ. Health A 2005, 68, 1457–1464. [Google Scholar]
- Meng, Z.Q.; Zhang, J.; Geng, H.; Lu, B.; Zhang, Q.X. Influence of dust storms on daily respiratory and circulatory outpatient number (in Chinese). Zhongguo Huanjing Kexue 2007, 27, 116–120. [Google Scholar]
- Yang, C.Y.; Tsai, S.S.; Chang, C.C.; Ho, S.C. Effects of Asian dust storm events on daily admissions for asthma in Taipei, Taiwan. Inhal. Toxico 2005, 17, 817–821. [Google Scholar]
- Zhang, M.; Song, Y.; Cai, X.; Zhou, J. Economic assessment of the health effects related to particulate matter pollution in 111 Chinese cities by using economic burden of disease analysis. J. Environ. Manage 2008, 88, 947–954. [Google Scholar]
- Im, H.J.; Kwon, H.J.; Ha, M.; Lee, S.G.; Hwang, S.S.; Ha, E.H.; Cho, S.H. Public perceptions of the risk of Asian dust storms in Seoul and its metropolitan area. J. Prev. Med. Public Health 2006, 39, 205–212. [Google Scholar]
- Chang, C.C.; Hwang, J.S.; Chan, C.C.; Wang, P.Y.; Cheng, T.J. Effects of concentrated ambient particles on heart rate, blood pressure, and cardiac contractility in spontaneously hypertensive rats during a dust storm event. Inhal. Toxicol 2007, 19, 973–978. [Google Scholar]
- Lei, Y.C.; Chan, C.C.; Wang, P.Y.; Lee, C.T.; Cheng, T.J. Effects of Asian dust event particles on inflammation markers in peripheral blood and bronchoalveolar lavage in pulmonary hypertensive rates. Environ. Res 2004, 95, 1–76. [Google Scholar]
- Meng, Z.; Zhang, Q. Damage effects of dust storm PM2.5 on DNA in alveolar macrophages and lung cells of rats. Food Chem. Toxicol 2007, 45, 1368–1374. [Google Scholar]
- Batjargal, Z.; Dulam, J.; Chung, Y.S. Dust storms are an indication of an unhealthy environment in East Asia. Environ. Monit. Assess 2006, 114, 447–460. [Google Scholar]
- Davara, F.; de la Cruz, A. Dust storm monitoring: effects on the environment, human health and potential security conflicts. Proc. SPIE 2004, 5574, 361–371. [Google Scholar]
- Chung, Y.S. On the observations of yellow sand in Korea. Atmos. Environ 1992, 26A, 2743–2749. [Google Scholar]
- Chon, J. Historical records of yellow sand observations in China. Res. Environ. Sci 1994, 7, 1–11. [Google Scholar]
- Chung, Y.S.; Kim, H.S.; Judger, D.; Natsagdorj, L.; Chen, S.J. On sand and duststorms and associated significant dust fall observed in Chongju-Cheongwon, Korea during 1997–2000. Water Air Soil Poll.: Focus 2003, 3, 5–19. [Google Scholar]
- Chung, Y.S.; Kim, H.S.; Park, K.H.; Jhun, J.G.; Chen, S.J. Atmospheric loadings, concentrations and visibility associated with sandstorms: satellite and meteorological analysis. Water Air Soil Poll.: Focus 2003, 3, 21–40. [Google Scholar]
- Kurosaki, Y.; Mikami, M. Recent frequent dust events and their relation to surface wind in East Asia. Geophys. Res. Lett 2003, 30, 1736. [Google Scholar]
- Wang, W.; Fang, Z.Y. Numerical simulation and synoptic analysis of dust emission and transport in East Asia. Glob. Planet. Change 2006, 52, 57–70. [Google Scholar]
- Kim, Y.K.; Song, S.K.; Lee, H.W.; Kim, C.H.; Oh, I.B. Characteristics of Asian dust transport based on synoptic meteorological analysis over Korea. J. Air Waste Manag. Assoc 2006, 56, 306–316. [Google Scholar]
- Kim, H.S.; Chung, Y.S. On the sandstorms and associated airborne dust fall episodes observed at Cheongwon in Korea in 2005. Air Qual. Atmos. Health 2010, 3, 83–94. [Google Scholar]
- Chung, Y.S. Air pollution detection by satellite: The transport and deposition of air pollutants over oceans. Atmos. Environ 1986, 20, 617–630. [Google Scholar]
- Kim, J. Transport routes and source regions of Asian dust observed in Korea during the past 40 years (1965–2004). Atmos. Environ 2008, 42, 4778–4789. [Google Scholar]
- Mckendry, I.G.; Hacker, J.P.; Stull, R. Long-range transport of Asian dust to the Hawaiian Islands. Science 2001, 220, 198–197. [Google Scholar]
- Chen, Y.; Cai, Q.; Tang, H. Dust storm as an environmental problem in North China. Environ. Manage 2003, 32, 413–417. [Google Scholar]
- Lee, H.C.; Liu, C.M. Coping with dust storm events: information, impacts and policymaking in Taiwan. Terr. Atmos. Oceanic Sci 2004, 15, 1035–1050. [Google Scholar]
- Wang, Y.; Stein, A.F.; Draxler, R.R.; de la Rosa, J.D.; Zhang, X. Global sand and dust storms in 2008: observation and HYSPLIT model verification. Atmos. Environ 2011, 45, 6368–6381. [Google Scholar]
- Chung, Y.S.; Yoon, M.B. On the occurrence of yellow sand and atmospheric loadings. Atmos. Environ 1996, 30, 2387–2397. [Google Scholar]
- Chung, Y.S.; Kim, H.S.; Dulam, J.; Harris, J. On heavy dust fall observed with explosive sandstorms in Cheongwon-Chongju, Korea in 2002. Atmos. Environ 2003, 37, 3425–3433. [Google Scholar]
- Chung, Y.S.; Kim, H.S. Observations of massive-air pollution transport and associated air quality in the Yellow Sea region. Air Quality Atmos. Health 2008, 1, 69–70. [Google Scholar]
- Kim, H.S.; Chung, Y.S. Satellite and ground observations for large-scale air pollution transport in the Yellow Sea Region. J. Atmos. Chem 2008, 60, 103–116. [Google Scholar]
- Ding, R.; Li, J.; Wang, S.; Ren, F. Decadal change of the spring dust storm in northwest China and the associated atmospheric circulation. Geophys. Res. Lett 2005, 32, L02808. [Google Scholar]
- Kim, Y.S.; Iwasaka, Y.; Shi, G.Y.; Nagatani, T.; Shibata, T.; Trochkin, D.; Matsuki, A.; Yamada, M.; Chen, B.; Zhang, D.; Nagatani, M.; Nakata, H. Dust particles in the free atmosphere over desert areas on the Asian continent: measurements from summer 2001 to summer 2002 with balloon-borne optical particle counter and lidar, Dunhuang, China. J. Geophys. Res 2004, 109, D19S26. [Google Scholar]
- Wehner, B.; Wiedensohler, A.; Tuch, T.M.; Wu, Z.J.; Hu, M.; Slanina, J.; Kiang, C.S. Variability of the aerosol number size distribution in Beijing, China: New particle formation, dust storms, and high continental background. Geophys. Res. Lett 2004, 31, 1–4. [Google Scholar]
- Wu, X.; Zheng, X.; Li, X.; Liu, J.; Kang, L.; Jiang, X. Analyses on the characteristics and weather pattern classifications of East-Asia spring dust storms by using meteorological satellite images (in Chinese). Climatic Environ. Res 2004, 9, 1–13. [Google Scholar]
- Qian, W.H.; Quan, L.S.; Shi, S.Y. Variations of the dust storm in China and its climatic control. J. Climate 2002, 15, 1216–1229. [Google Scholar]
- Lin, Z.; Chen, H.; Zhang, S.; Xu, X. Climatic and environmental background for the anomalous spring sandstorms over the North China during 2003 (in Chinese). Climatic Environ. Res 2004, 9, 191–202. [Google Scholar]
- Fan, K.; Wang, H.J. Antarctic oscillation and the dust weather frequency in North China. Geophys. Res. Lett 2004, 31, L10201. [Google Scholar]
- In, H.J.; Park, S.U. Estimation of dust emission amount for a dust storm event occurred in April 1998 in China. Water Air Soil Poll 2003, 148, 201–221. [Google Scholar]
- Shao, Y. Simplification of a dust emission scheme and comparison with data. J. Geophys. Res 2004, 109, D10202. 1–6. [Google Scholar]
- Shen, Y.; Shen, Z.; Du, M.; Wang, W. Dust emission over different land surface in the arid region of Northwest China. J. Meteorol. Soc. Jpn 2005, 83, 935–942. [Google Scholar]
- Song, Z. A numerical simulation of dust storms in China. Environ. Model. Softw 2004, 19, 141–151. [Google Scholar]
- Zhang, X.L.; Cheng, L.; Chung, Y.S. Development of a severe sand-dust storm model and its application to Northwest China. Water Air Soil Poll 2003, 3, 173–190. [Google Scholar]
- Zhang, X.Y.; Gong, S.L.; Zhao, T.L.; Arimoto, R.; Wang, Y.O.; Zhou, Z.J. Sources of Asian dust and role of climate change versus desertification in Asian dust emission. Geophys. Res. Lett 2003, 30, 2272. [Google Scholar]
- Gong, S.L.; Zhang, X.Y.; Zhao, T.L.; McKendry, I.G.; Jaffe, D.A.; Lu, N.M. Characterization of soil dust aerosol in China and its transport and distribution during 2001 ACE-Asia: 2. Model simulation and validation. J. Geophys. Res 2003, 108, 4262. [Google Scholar]
- Wang, L.; Zhao, L.; Shou, S.; Wang, J. Observation and Numerical Simulation Analysis of the Severe Sand Storm over Northern China in April of 2009 (in Chinese). Meteorol. Month 2011, 37, 309–317. [Google Scholar]
- Sun, J.; Zhao, L.; Zhao, S. A numerical simulation on severe dust storm events in North China and their dust sources (in Chinese). Climatic Environ. Res 2004, 9, 139–154. [Google Scholar]
- Chen, F.; Dudhia, J. Coupling an advanced land surface-hydrology model with the Penn-State National Center for Atmospheric Research (NCAR) MM5 modeling system. Part I: Model implementation and sensitivity. Mon. Weather Rev 2001, 129, 569–585. [Google Scholar]
- Chen, F.; Dudhia, J. Coupling an advanced land surface-hydrology model with the Penn-State NCAR MM5 modeling system. Part II: preliminary model validation. Mon. Weather Rev 2001, 129, 587–604. [Google Scholar]
- Mitchell, K. The Community NOAH Land-Surface Model (LSM) User’s Guide; Public Release Version 2.7.1; National Weather Service, National Center for Environmental Prediction: Camp Springs, MD, USA, 2005. [Google Scholar]
- Dudhia, J.; Gill, D.; Manning, K.; Wang, W.; Bruyere, C. PSU/NCAR Mesoscale Modeling System Tutorial Class Notes and Users’ Guide; MM5 Modeling System Version 3; NCAR: Boulder, CO, USA, 2005. [Google Scholar]
- Shao, Y.; Lu, H. A simple expression for wind erosion threshold friction velocity. J. Geophys. Res 2000, 105, 22437–22443. [Google Scholar]
- Owen, R.P. Saltation of uniform grains in air. J. Fluid Mech 1964, 20, 225–242. [Google Scholar]
- Shao, Y. A model for mineral dust emission. J. Geophys. Res 2001, 106, 20239–20254. [Google Scholar]
- Sun, J.; Zhao, L.; Zhao, S.; Zhang, R. An integrated dust storm prediction system suitable for East Asia and its simulation results. Global Planet. Change 2006, 52, 71–87. [Google Scholar]
- De Haan, L.L.; Kanamitsu, M.; Lu, C.H.; Roads, J.O. A comparison of the Noah and OSU land surface models in the ECPC seasonal forecast model. J. Hydrometeorol 2007, 8, 1031–1048. [Google Scholar]
- Sridhar, V.; Elliott, R.L.; Chen, F.; Brotzge, J.A. Validation of the NOAH-OSU land surface model using surface flux measurements in Oklahoma. J. Geophys. Res 2002, 107, 4418. [Google Scholar]
- Ek, M.B.; Mitchell, K.E.; Lin, Y.; Rogers, E.; Grunmann, P.; Koren, V.; Gayno, G.; Tarpley, J.D. Implementation of Noah land surface model advances in the National Centers for Environmental Prediction operational mesoscale Eta model. J. Geophys. Res 2003, 108, 8851. [Google Scholar]
- Jakeman, A.J.; Letcher, R.A.; Norton, J.P. Ten iterative steps in development and evaluation of environmental models. Environ. Model. Softw 2006, 21, 602–614. [Google Scholar]
- Colle, B.A.; Olson, J.B.; Tongue, J.S. Multiseason verification of the MM5. Part I: Comparison with the Eta model over the central and Eastern United States and impact of MM5 resolution. Weather Forecast 2003, 18, 431–457. [Google Scholar]
- Colle, B.A.; Olson, J.B.; Tongue, J.S. Multiseason verification of the MM5. Part II: Evaluation of high-resolution precipitation forecasts over the Northeastern United States. Weather Forecast 2003, 18, 458–480. [Google Scholar]
- Dudhia, J.; Bresch, J. A Global Version of MM5: Method and Verification. Proceedings of 20th Conference on Weather Analysis and Forecasting/16th Conference on Numerical Weather Prediction, Seattle, WA, USA, 12–16 January 2004; pp. 3259–3262.
- Zhang, Y.; Liu, P.; Pun, B.; Seigneur, C. A comprehensive performance evaluation of MM5-CMAQ for the Summer 1999 Southern Oxidants Study episode-Part I: Evaluation protocols, databases, and meteorological predictions. Atmos. Environ 2006, 40, 4825–4838. [Google Scholar]
- Zhang, Y.; Liu, P.; Pun, B.; Seigneur, C. A comprehensive performance evaluation of MM5-CMAQ for the summer 1999 southern oxidants study episode, Part III: Diagnostic and mechanistic evaluations. Atmos. Environ 2006, 40, 4856–4873. [Google Scholar]
- Han, Z.; Ueda, H.; An, J. Evaluation and intercomparison of meteorological predictions by five MM5-PBL parameterizations in combination with three land-surface models. Atmos. Environ 2008, 42, 233–249. [Google Scholar]
- Chen, F.; Mitchell, K.; Schaake, J.; Xue, Y.; Pan, H.L.; Koren, V.; Duan, Q.Y.; Ek, M.; Betts, A. 1996: Modeling of land surface evaporation by four schemes and comparison with FIFE observations. J. Geophys. Res 1996, 101, 7251–7268. [Google Scholar]
- Decharme, B. Influence of runoff parameterization on continental hydrology: Comparison between the Noah and the ISBA land surface models. J. Geophys. Res 2007, 112, D19108. [Google Scholar]
- Hogue, T.S.; Bastidas, L.; Gupta, H.; Sorooshian, S.; Mitchell, K.; Emmerich, W. Evaluation and transferability of the Noah land surface model in semiarid environments. J. Hydrometeorol 2005, 6, 68–84. [Google Scholar]
- Tewari, M.; Chen, F.; Wang, W.; Dudhia, J.; LeMone, M.A.; Mitchell, K.; Ek, M.; Gayno, G.; Wegiel, J.; Cuenca, R.H. Implementation and Verification of the Unified NOAH Land Surface Model in the WRF Model. Proceedings of 20th Conference on Weather Analysis and Forecasting/16th Conference on Numerical Weather Prediction, Seattle, WA, USA, 12–16 January 2004; pp. 2165–2170.
- Niu, R. Sand-Dust Weather Almanac (in Chinese); Meteorological Press: Beijing, China, 2004. [Google Scholar]
- WHO Secretariat. WMO Sand and Dust Storm Warning Advisory and Assessment System (SDWAS) Science and Implementation Plan in 2011–2015; WMO: Geneva, Switzerland, 2011. [Google Scholar]
- Gao, T.; Zhang, X.; Li, Y.; Wang, H.; Xiao, S.; Wulan; Teng, Q. Potential predictors for spring season dust storm forecast in Inner Mongolia, China. Theor. Appl. Climatol 2009, 97, 255–263. [Google Scholar]
- Dong, J.; Chen, H.; Wang, J.; Sun, D. Sandstorm occurrence frequency short-term prediction based on bootstrap method. Lect. Notes Comput. Sci 2008, 5370, 571–580. [Google Scholar]
- Jamalizadeh, M.R.; Moghaddamnia, A.; Piri, J.; Arbabi, V.; Homayounifar, A.; Shahrwyari, A. Dust storm prediction using ANNs technique: A case study—Zabol City. World Acad. Sci. Eng. Tech 2008, 43, 512–520. [Google Scholar]
- Liu, Z.; Ma., J.; Han, X.; Zhang, X. The comparison analysis of AVHRR LST data and TSF data in dust sources region: A case study during strong dust storm of Spring-Summer in 2001. Proc. SPIE 2003, 5286, 356–358. [Google Scholar]
- Barnun, B.H.; Winstead, N.S.; Wesely, J.; Hakola, A.; Colarco, P.R.; Toon, O.B.; Ginoux, P.G.; Brooks, L.; Hasselbarth, B.T. Forecasting dust storms using the CARMA-dust model and MM5 weather data. Environ. Model. Softw 2004, 19, 129–140. [Google Scholar]


Share and Cite
Lin, Z.; Levy, J.K.; Lei, H.; Bell, M.L. Advances in Disaster Modeling, Simulation and Visualization for Sandstorm Risk Management in North China. Remote Sens. 2012, 4, 1337-1354. https://doi.org/10.3390/rs4051337
Lin Z, Levy JK, Lei H, Bell ML. Advances in Disaster Modeling, Simulation and Visualization for Sandstorm Risk Management in North China. Remote Sensing. 2012; 4(5):1337-1354. https://doi.org/10.3390/rs4051337
Chicago/Turabian StyleLin, Zhaohui, Jason K. Levy, Hang Lei, and Michelle L. Bell. 2012. "Advances in Disaster Modeling, Simulation and Visualization for Sandstorm Risk Management in North China" Remote Sensing 4, no. 5: 1337-1354. https://doi.org/10.3390/rs4051337