2.1. The Least Squares Matching Algorithm
The LSM algorithm works based on the L2-norm theorem to determine the best matching position by adjusting the geometry and radiometry of the matching templates so that the sum of squares of the gray-value differences (SSD) between the two templates is minimized [
13,
18,
19]. Assume a discrete two dimensional function
F(
x,
y) represents intensity data of a subset of an image taken over a certain area at a time
t1.
G(
x′,
y′) represents intensity data of a subset of another image taken over the same area at some other time
t2. In principle, if the two subsets (templates) match, the two functions will be equal. However, due to the likely presence of noises in both images, random noise (
e) is added (
Equation (1)). In an ideal situation
e or its expectation equals zero. In the displacement measurement of Earth surface mass movements, the two images are often taken with long temporal baselines. Consequently, systematic radiometric changes can exist due to various factors such as changes in surface condition, illumination, noise, imaging condition and geometric distortions. It is often assumed that the systematic radiometric differences can be accounted for by gain (
λ) and offset (
η) parameters as in
Equation (2).
A moving slope, here represented by an image template, may also change geometrically. A geometric transformation model, characterized by parameters
p1 to
pn, relates the pixels of the reference template to those of the search template for each dimension, as shown for the affine model in
Equations (3) and
(4). The relationship between the two intensity data will consequently incorporate the parameters of the model (
Equation (5)). This relationship can be linearized using Taylor-series expansion and rewritten in matrix form as in
Equation (6). Here,
v is the residual,
A are the differential quotations computed from the gray-value gradients,
l is the difference between the gray-values of the matching templates, and
dp is an element of the adjustments (
dp1,…,
dpn,
dλ,
dη) to the initial parameter values that assume the same size, shape and orientation. The solution for
dp is then computed using
Equation (7). The process is iterated until the computed
dp converges close to zero. LSM is an unbiased minimum variance estimator with the variance computed as in
Equation (8) where
RC is the total number of observations (pixels in the template) and
n is the number of model parameters. Further details of the LSM algorithm are given in [
18,
20,
21].
2.2. The Least Squares Matching in Mass Movement Analysis
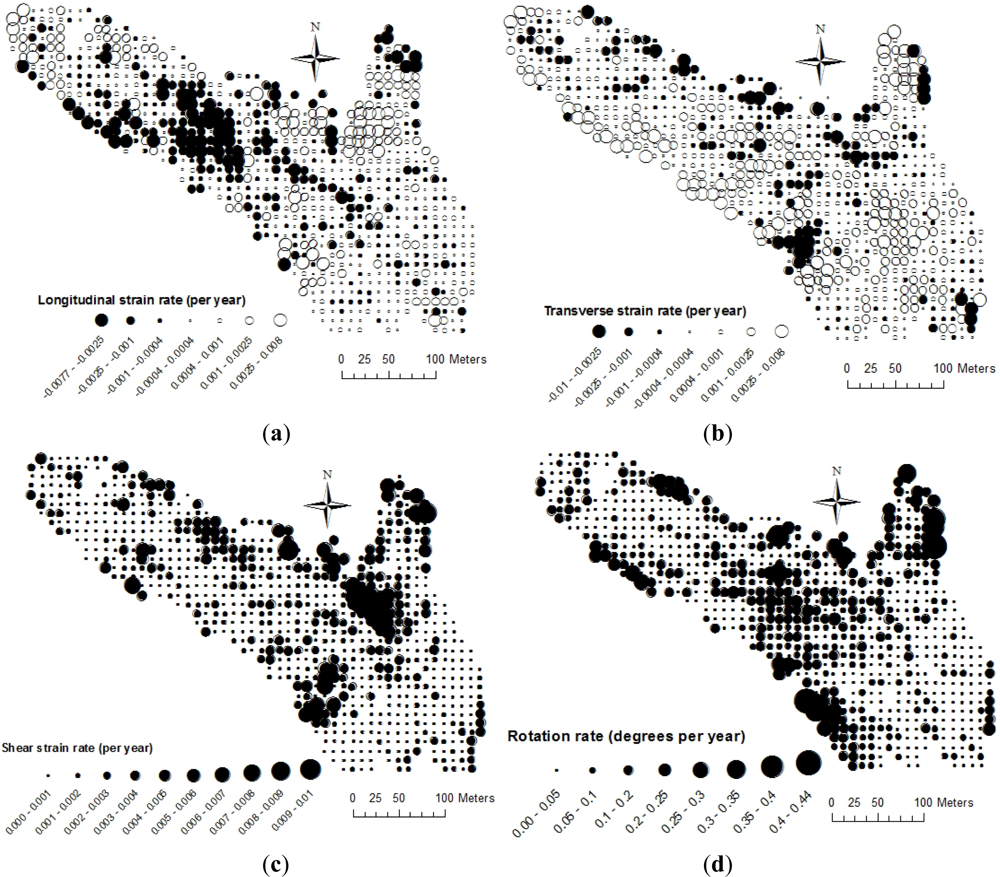
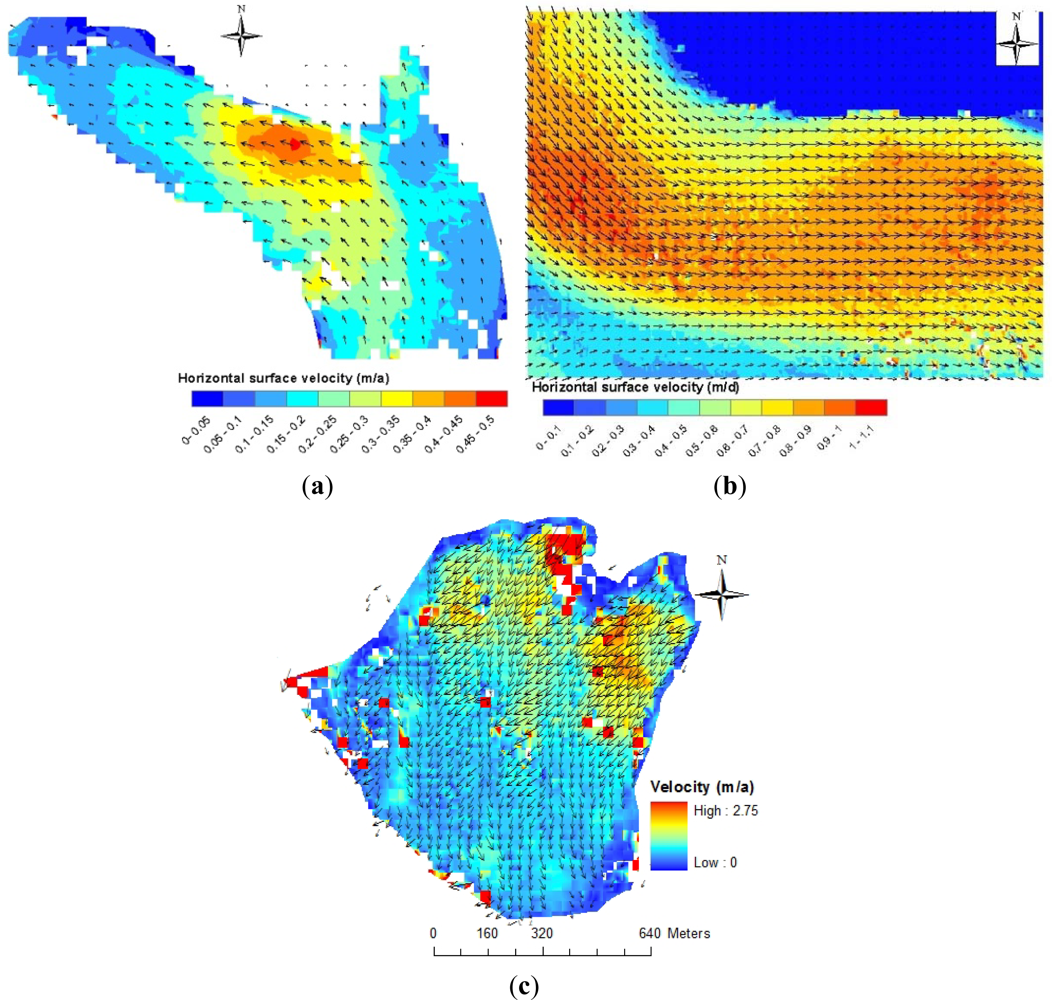
LSM, as a precise matching algorithm, is expected to produce precise velocity for each pixel of the template. This gives the advantage that velocity gradients,
i.e., strain rates, can be computed at sub-template level, even if computed after the matching. Additionally, the spatial transformation parameters (
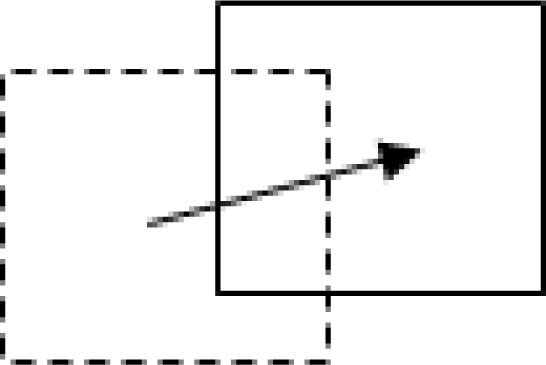
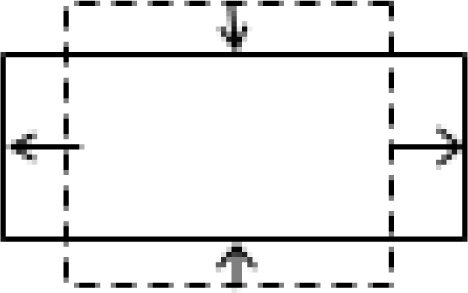
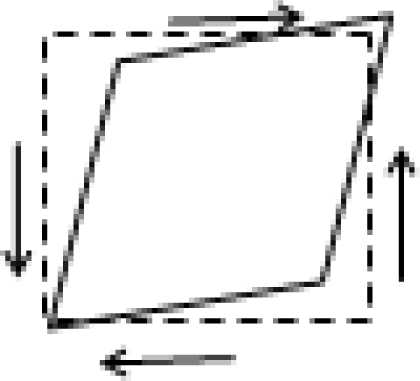
pi) are measures of the geometric deformation of the masses between the acquisition times of the two images. The specific meanings of each of the spatial transformation parameter in mass movements are presented in
Table 1 together with a sketch of the geometric changes represented. The spatial transformation parameters can be exploited to automatically compute strain rates simultaneous with the matching as outlined below.
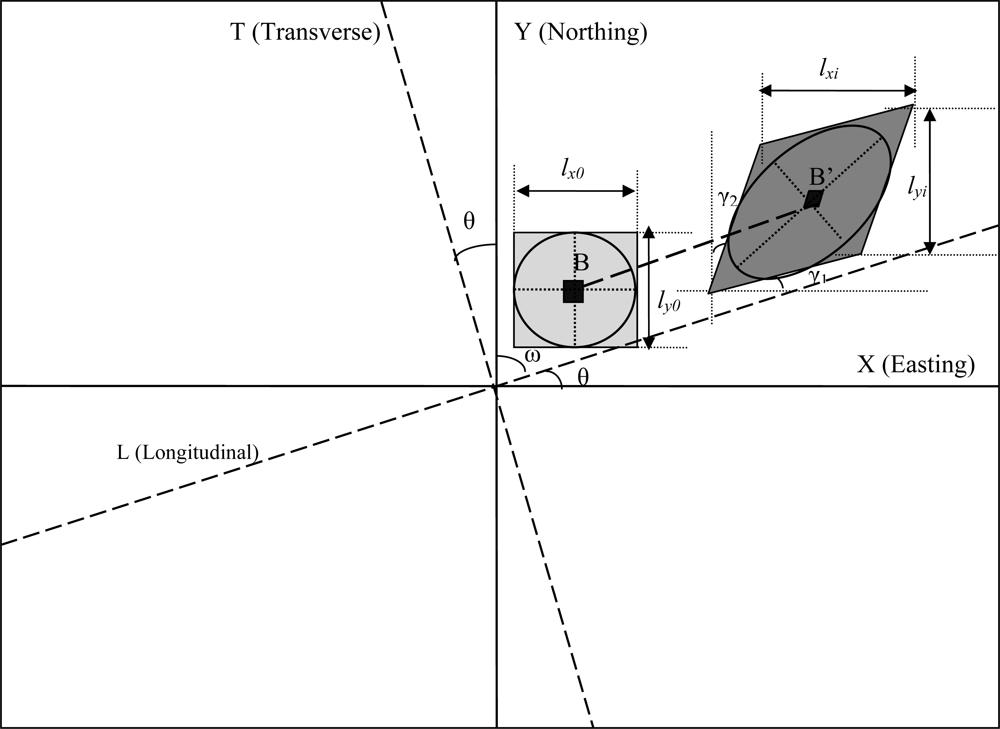
Figure 1 reduces the reality of Earth surface mass movements to the square template depicted, which has unit sizes in both dimensions (denoted as
lxo and
lyo respectively). The unit lengths can also be thought of as diameters (2r) of a circle as shown in the figure. After deformation, the template moves to a new location, attains new sizes (
lxi and
lyi) and gets rotated and/or sheared by angles
γ1 and
γ2 to a new shape. The circle now becomes an ellipse with maximum extension and compression shown orthogonal to each other (dashed axes of the ellipse). The orientation of the ellipse is not necessarily along the movement direction due to shearing and rotation. Notice that the central pixel itself is also deformed and displaced from the center. The Euclidian distance between
B and
B′ (parallel to the longitudinal direction) is the horizontal displacement magnitude while
ω is the angular displacement direction measured clockwise from the north. The change in size can be quantified using extension ratios (
Sx and
Sy) as in
Equations (9) and
(10).
Sx and
Sy are the same as the scaling factors
p2 and
p6 of
Table 1. The corresponding normal strains (
εx and
εy) and their relations with the scaling factors are given in
Equations (11) and
(12), adapted from [
22,
23]. Scaling factors greater than 1 (
i.e.,
εx and
εy values greater than 0) imply extension, where as scaling factors less than 1 (
i.e.,
εx and
εy values less than 0) imply compression.
The tangent of the shearing angle or the angle in radians (as the angles are often very small) for each direction is the same as the shearing factors (
p3 and
p5) of the transformation models. Shear results in both shearing and rotation. Thus, shear strain (
γxy) and rotation angle (
φxy) are derived from the shearing angles as given in
Equations (13) and
(14) respectively [
24]. Strain is better expressed in terms of strain rate (
ɛ̇i) which is strain per unit time (
Equation (15)). The strain rates in this study are expressed in the time unit that is covered by the dataset in order to avoid extrapolating to time periods not supported by data.
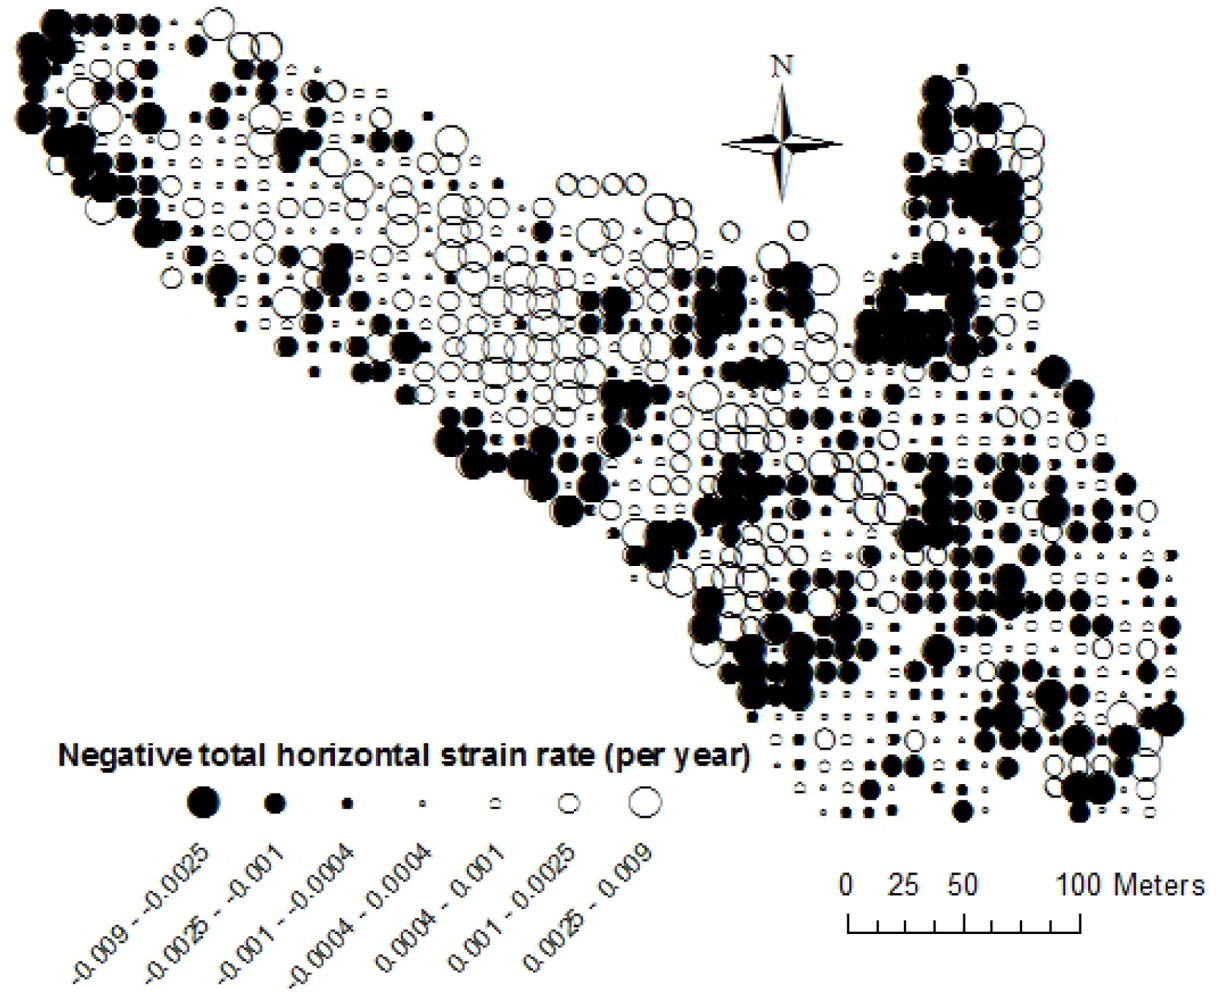
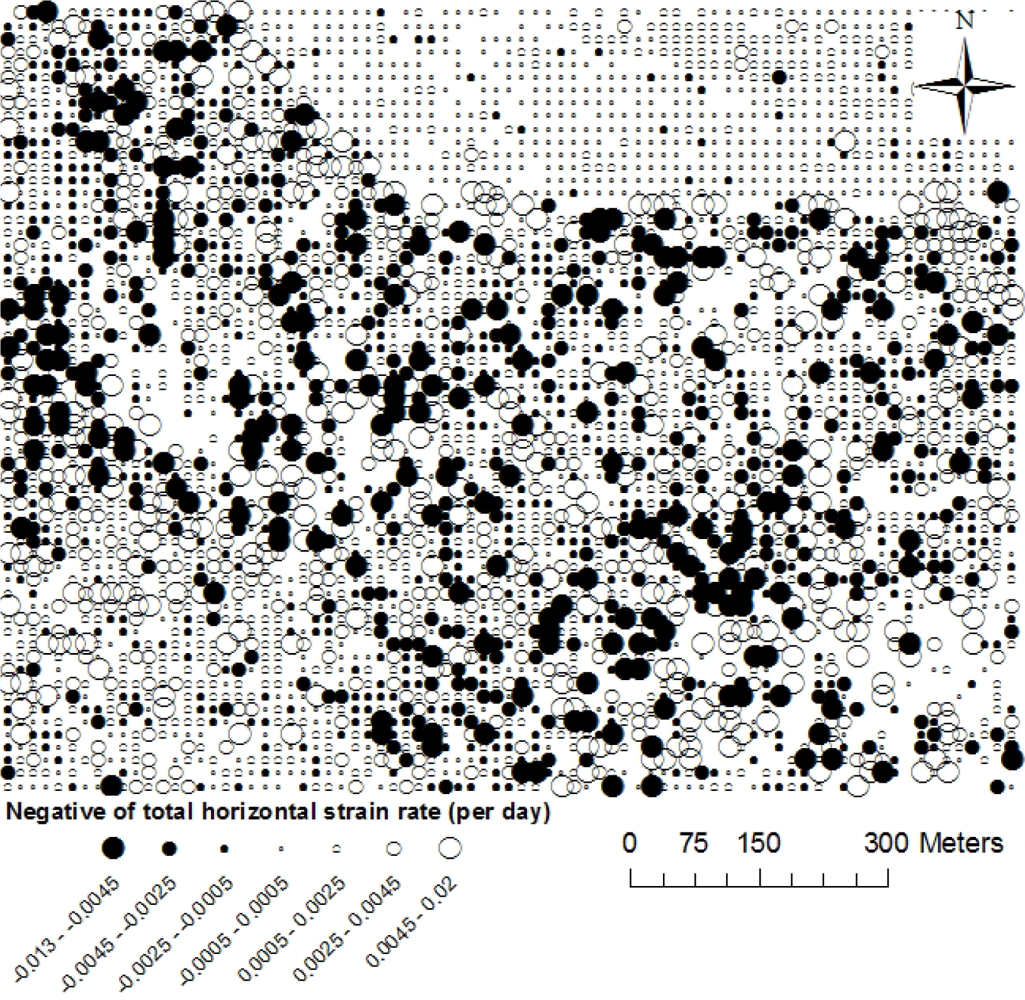
The horizontal length of the ground surface plane changes when there is compression or extension. As ice is incompressible, and thus also to a large extent masses that are super-saturated with ice, horizontal compression is usually balanced by vertical extension or vice versa [
25], making the total sum of the horizontal and vertical strain rates equal to zero. Compressive/extending motion is well discussed for glaciers [
24,
26,
27] and rockglaciers [
25,
28,
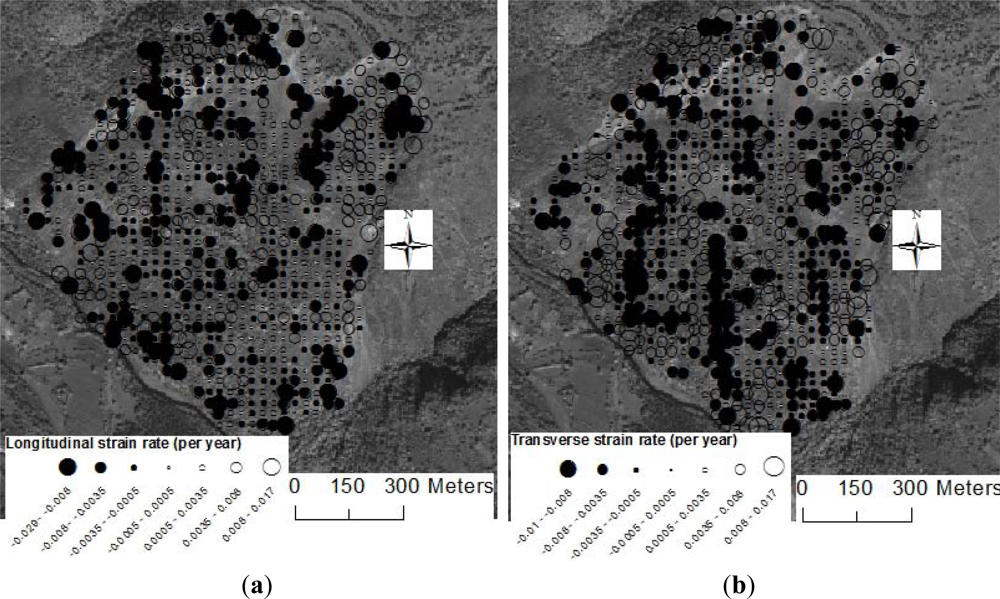
29]. In all cases, longitudinal (
i.e., along the flow direction) and transverse (
i.e., across flow direction) extension and compression are mentioned to lead to such processes as the formation of crevasses, calving and surface micro-topography. Shearing may lead to cracking of the masses and eventually collapses.
In this study, the radiometric parameters are not used further than estimation of the matching position although it can potentially be used in estimation of surface albedo changes.


