6.3. Parameter Correlation and Precision
Despite the slight apparent superiority of the OSI method, one of its drawbacks is the high correlation between the rangefinder offset d
0 and the perspective centre position Y
c.
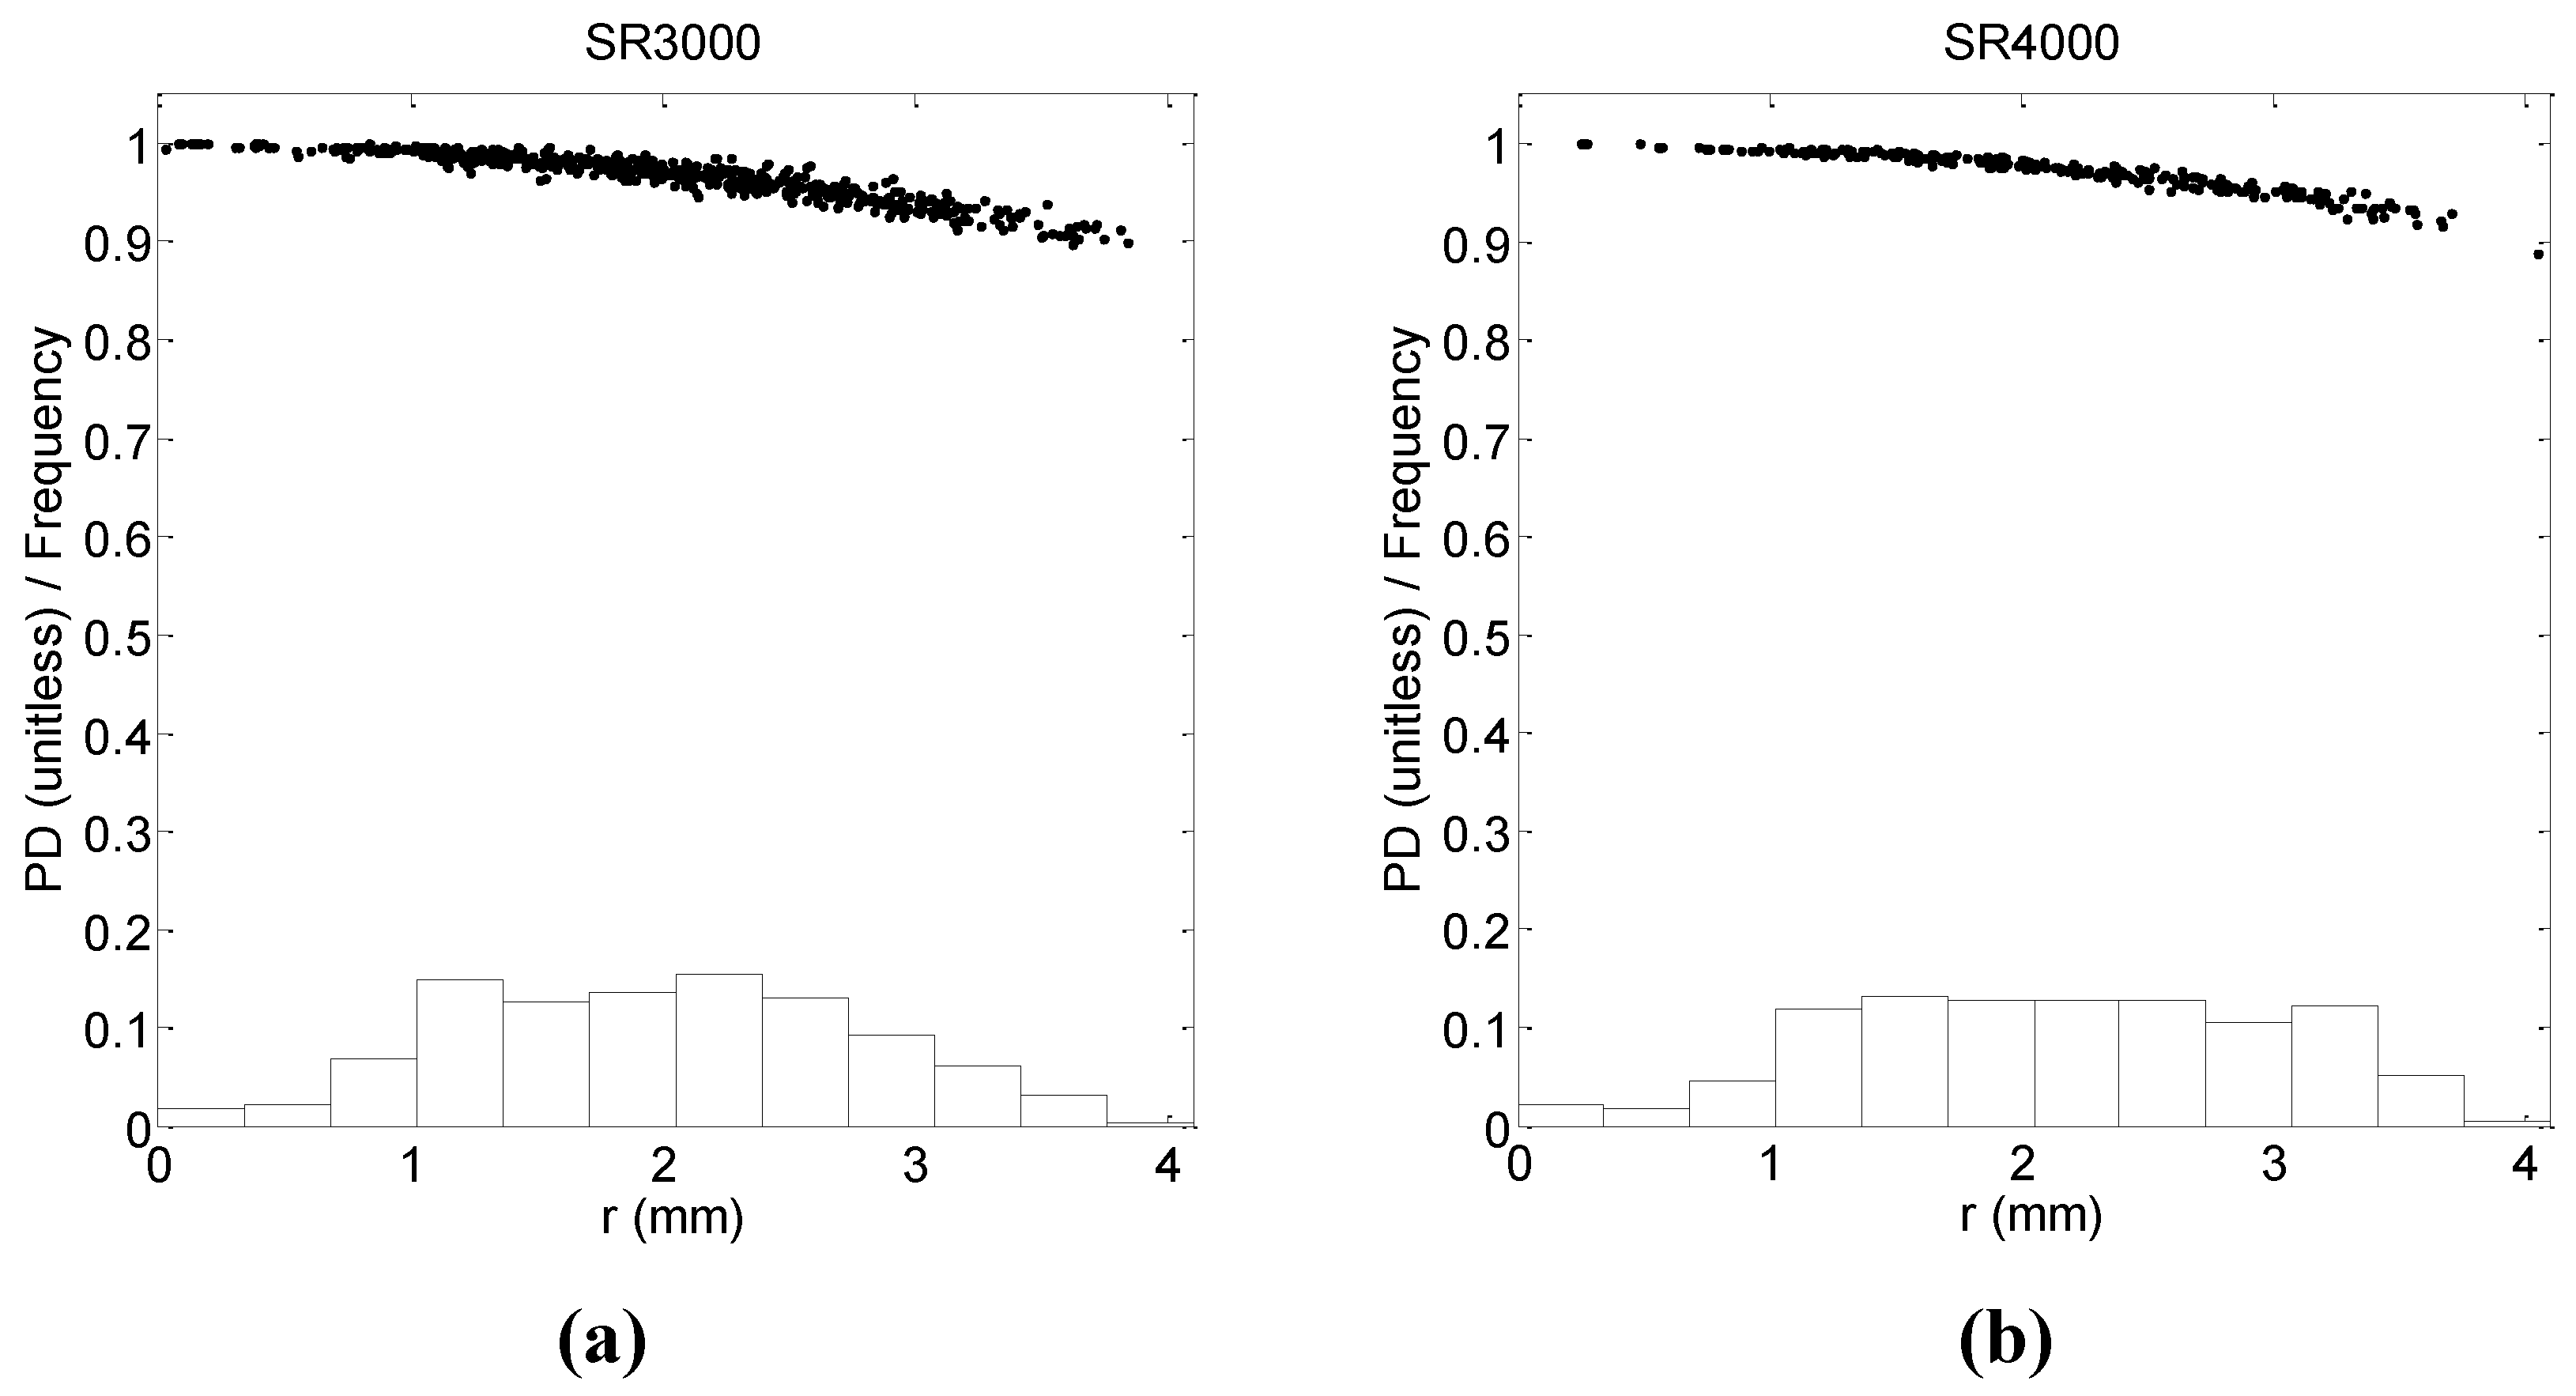
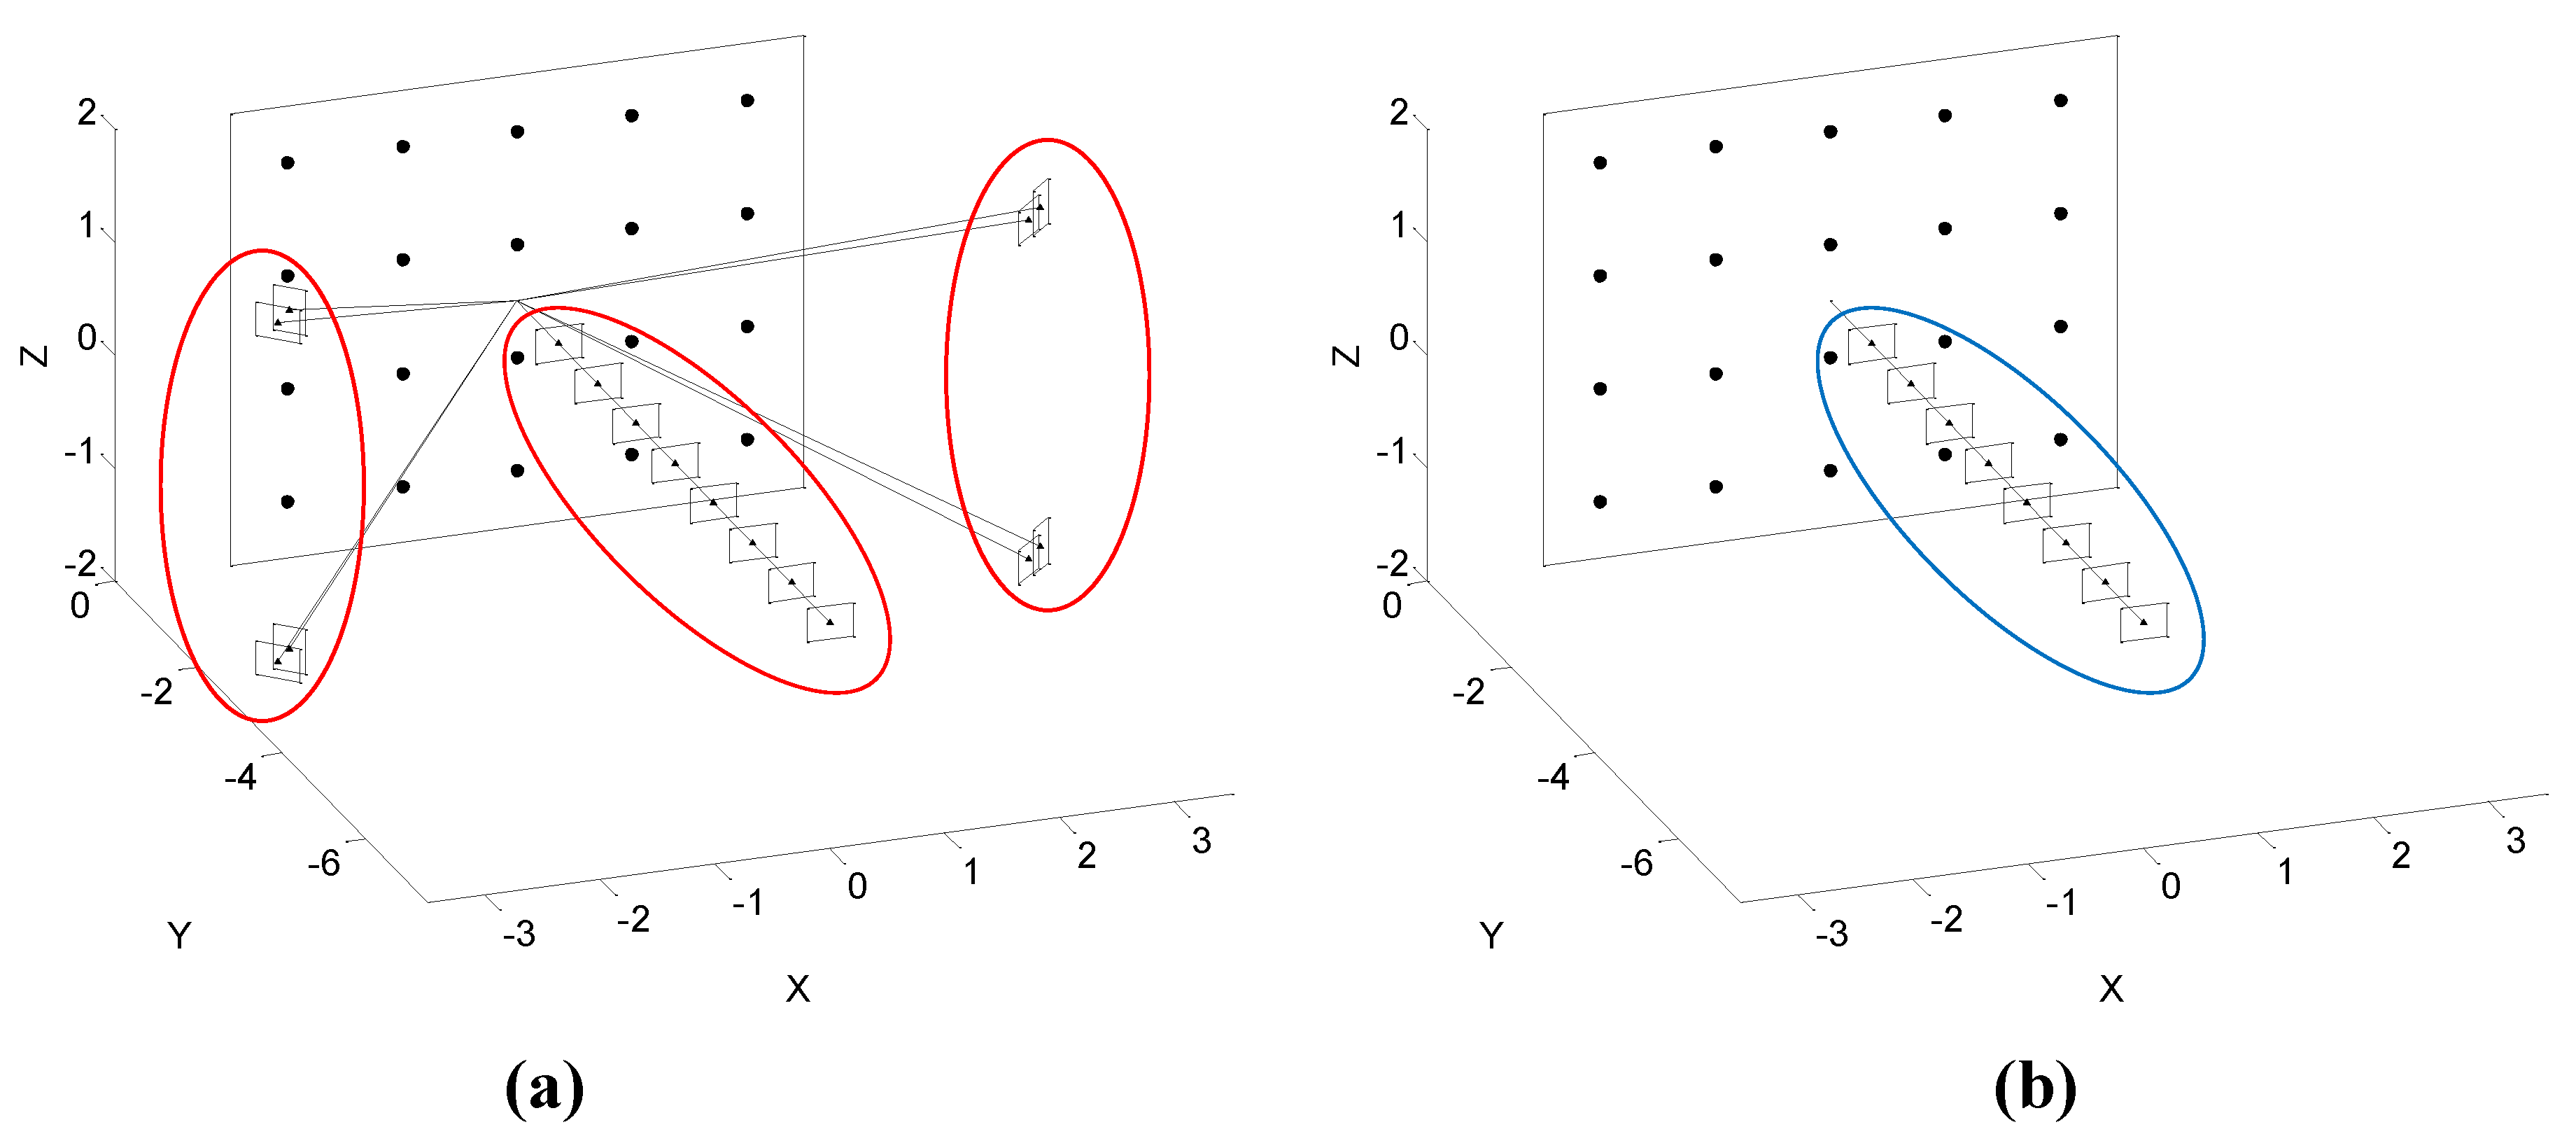
Figure 5 shows the strong functional dependence between these two variables in terms of the partial derivative given by Equation (12). Although the point distribution in the image plane is quite favorable for both datasets, the partial derivative drops only to about 0.9 near the image corners due to the cameras’ narrow field of view.
The rangefinder offset-perspective centre correlation is exacerbated by the longest-wavelength sine term (d
2) of the periodic error model. The large-magnitude correlations (Corr) among these three variables (0.97 between d
0 and d
2 and 0.99 between Y
c and d
0), which do not explicitly exist in the two-step calibration results, can be seen in
Table 5. Removal of the d
2 term from the OSI calibration model has a very positive impact on the rangefinder offset d
0 in terms of its precision (σ
d0), which drops from 12.0 mm to 2.8 mm, and its correlation with the camera position (Corr
Yc-d0), which drops to 0.87). It has a profound impact (29 mm change) on the estimated value of d
0 but does not affect the observation precision as measured by RMSE ρ. The d
0 estimates of the other methods are less affected by the removal of d
2, but the observation precision of the TSI method is affected considerably as the RMSE ρ increases from 17.9 mm to 25.4 mm. It is also worth noting that the principal distance, c, estimates and its precision from the OSI and the TSD methods match very closely, whereas the TSI seems to underestimate c whilst overestimating d
0. The principal distance precision (σ
c) in this method is lower due to the absence of the orthogonal images in the camera-lens calibration. The aforementioned de-correlation of the principal distance and the camera position in the OSI method and lack thereof in the two-step approaches can be seen in the (Corr
Yc-c) coefficients of
Table 5 and
Table 6.
Selected results from the SR4000 calibrations are presented in
Table 6. For this camera the OSI and TSD parameter estimates match very closely. Again the TSI method underestimates the principal distance and over-estimates the rangefinder offset d
0. As in the SR3000 case, the two-step methods give a more precise rangefinder offset d
0 since the uncertainty in the perspective centre position is not explicitly modeled. The principal distance precision from the TSI calibration is again comparatively lower for both cameras due to the lack of the orthogonal images.
Figure 5.
The partial derivative of Equation 12 as a function of radial distance, r, and histograms of image point distribution in the normal images for each dataset. (a) SR3000; (b) SR4000.
Figure 5.
The partial derivative of Equation 12 as a function of radial distance, r, and histograms of image point distribution in the normal images for each dataset. (a) SR3000; (b) SR4000.
Table 5.
Selected SR3000 adjustment results with and without the d2 term in the model.
Table 5.
Selected SR3000 adjustment results with and without the d2 term in the model.
| | One-step integrated (OSI) | Two-step independent (TSI) | Two-step dependent (TSD) |
|---|
| with d2 | without d2 | with d2 | without d2 | with d2 | without d2 |
|---|
| c (mm) | 8.164 | 8.164 | 8.098 | 8.167 |
| σc (μm) | 8.6 | 8.6 | 23.8 | 8.7 |
| d0 (mm) | 127.9 | 98.8 | 141.2 | 149.4 | 108.5 | 110.9 |
| σd0 (mm) | 12.0 | 2.8 | 1.1 | 1.5 | 1.1 | 1.1 |
| max |CorrYc-c| | 0.15 | 0.40 | 0.87 | 0.95 |
| Corrd0-d2 | −0.97 | - | 0.31 | - | 0.37 | - |
| max |CorrYc-d0| | 0.99 | 0.87 | - | - | - | - |
| RMSE ρ (mm) | 16.4 | 16.5 | 17.9 | 25.4 | 18.2 | 18.9 |
Table 6.
Selected SR4000 adjustment results.
Table 6.
Selected SR4000 adjustment results.
| | One-step integrated (OSI) | Two-step independent (TSI) | Two-step dependent (TSD) |
|---|
| c (mm) | 10.020 | 9.968 | 10.026 |
| σc (μm) | 12.4 | 62.3 | 12.6 |
| d0 (mm) | −4.7 | −8.7 | −4.8 |
| σd0 (mm) | 2.7 | 0.8 | 0.8 |
| max |CorrYc-c| | 0.19 | 0.57 | 0.86 |
| max |CorrYc-d0| | 0.92 | - | - |
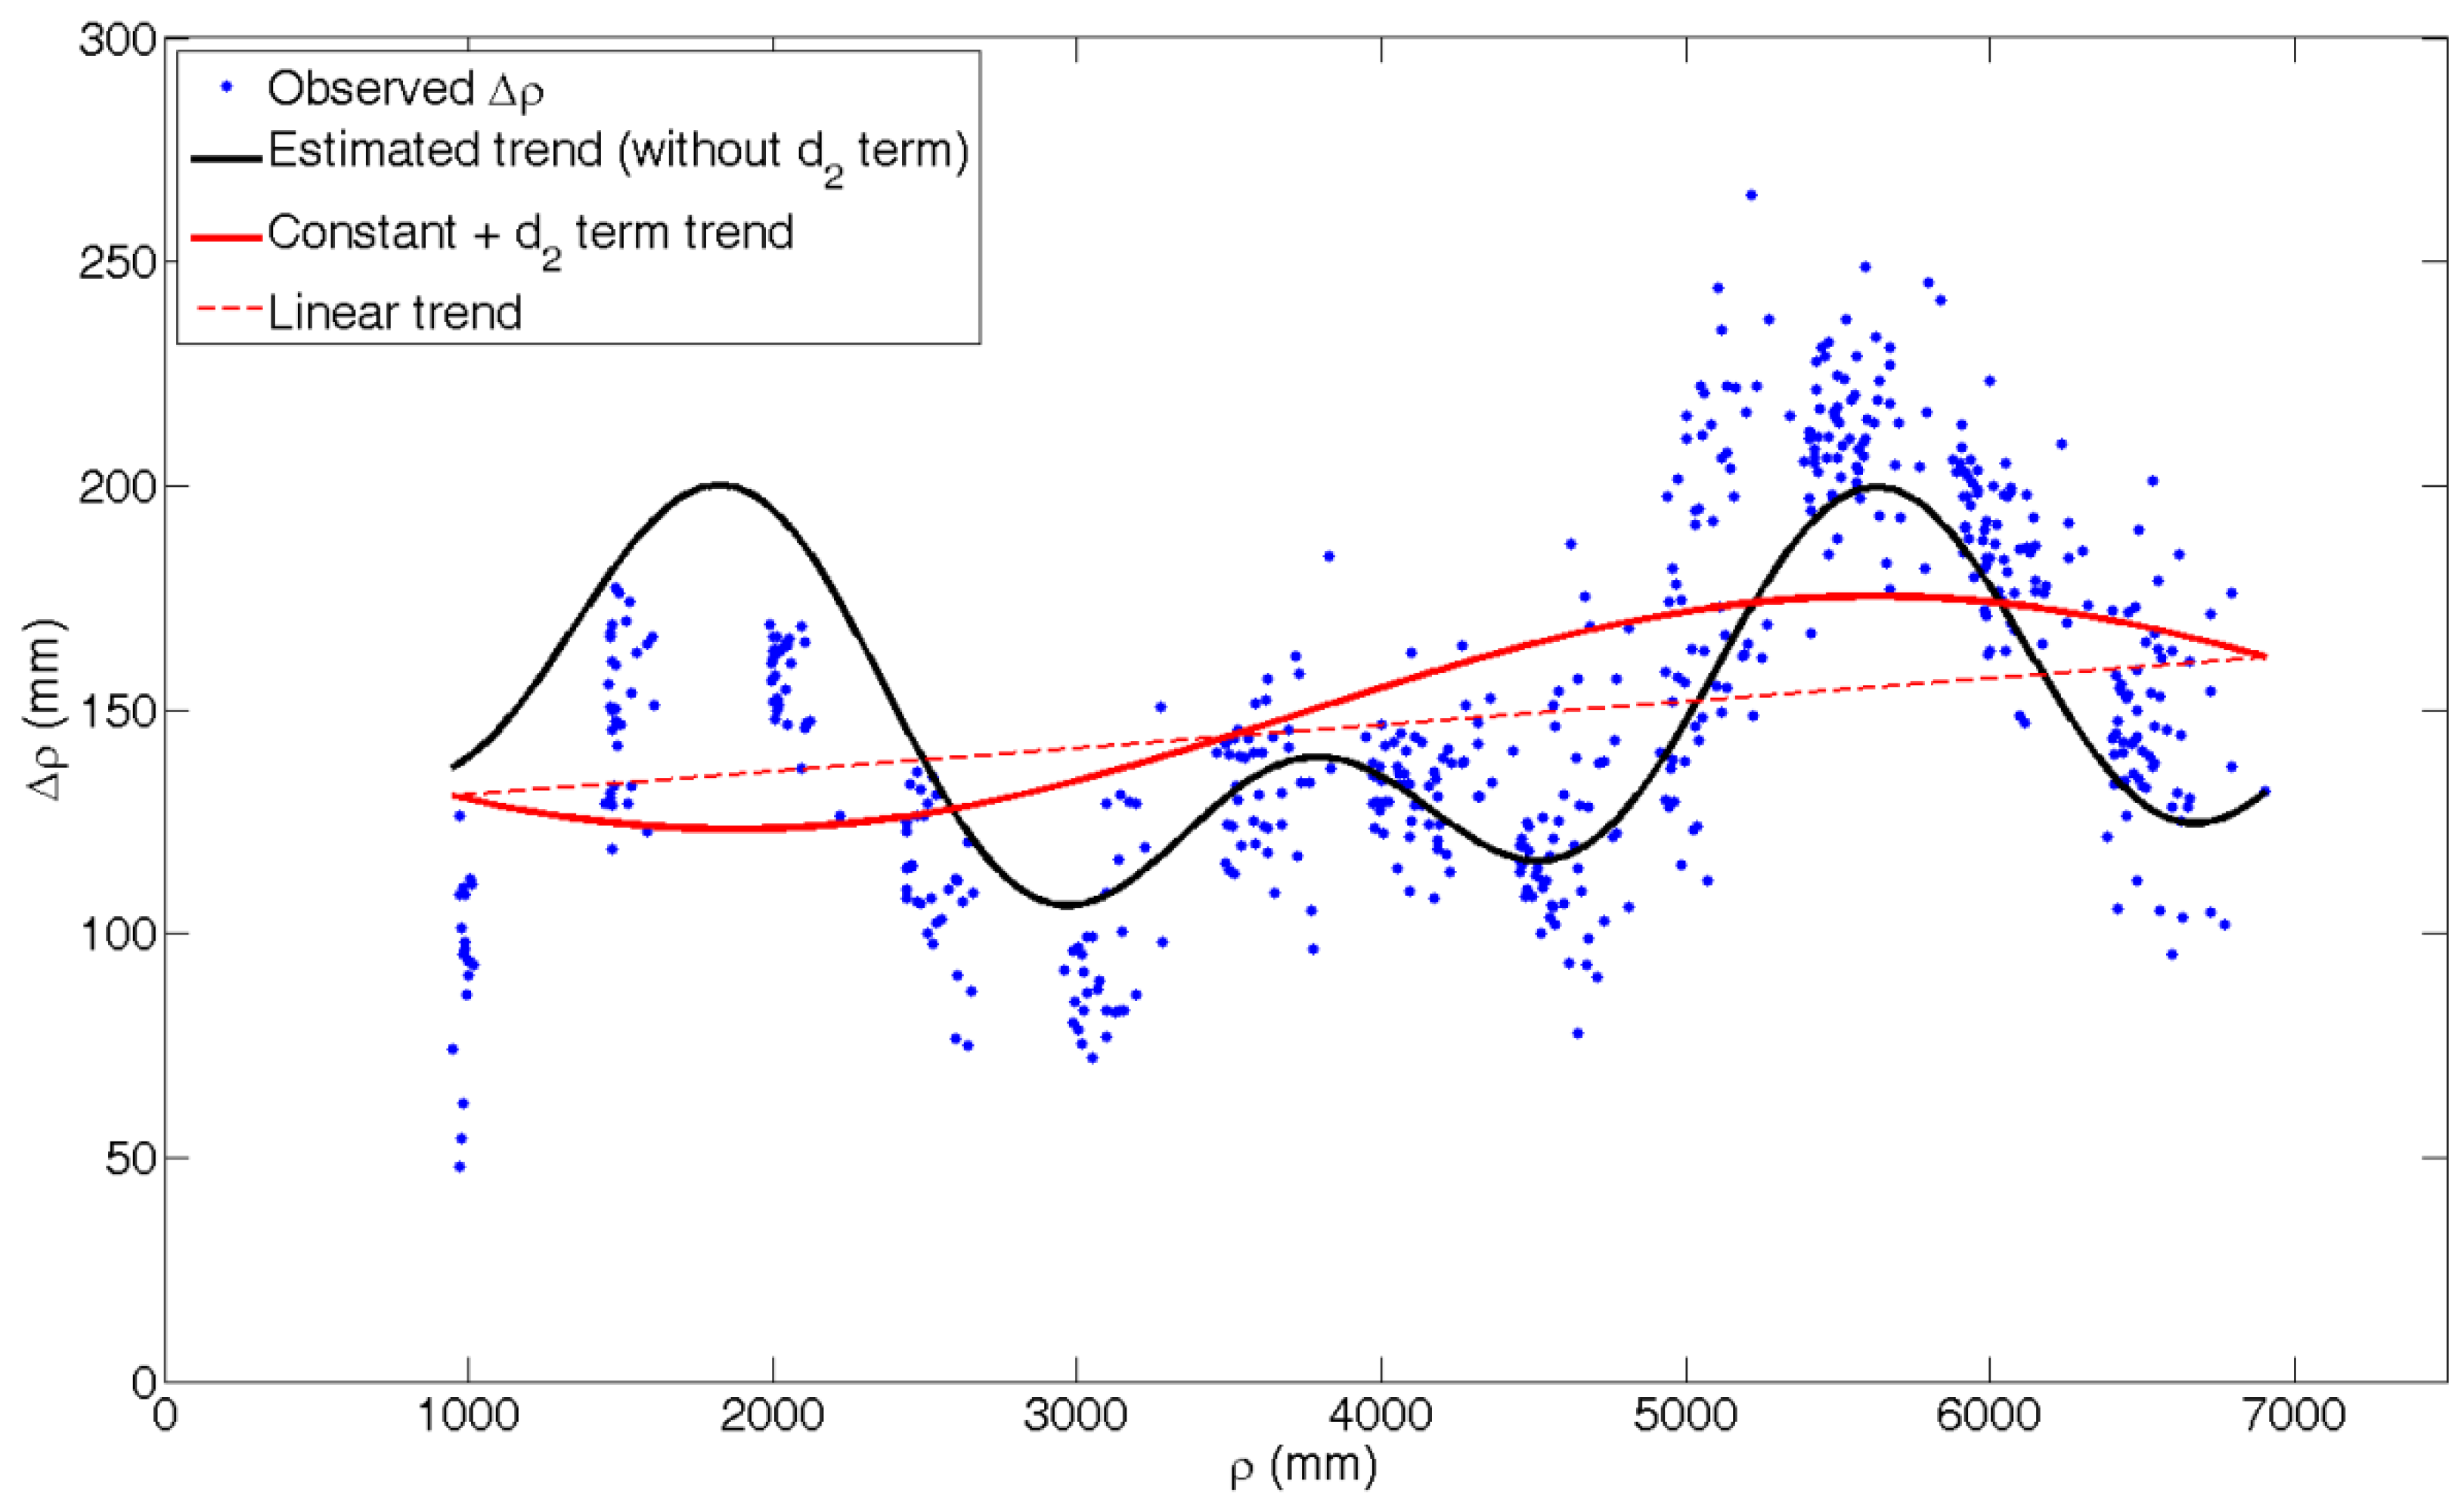
The role of the d
2 term can be seen in the TSI results plotted in
Figure 6. Clearly the periodic error model without the d
2 term is inadequate as it does not accurately fit the range difference observations: it overshoots the data between 1 m and 2 m and undershoots between 5 m and 7 m. The required d
2 sine trend (offset by the constant d
0 for clarity) and truncated by the observation limits (6.0 m or 80% of the 7.5 m unit length), exhibits not just sinusoidal behavior but also a linear trend. It has been proven in [
18] that an un-modeled constant range bias propagates into the residuals as a linear function of range in a one-dimensional ranging sensor self-calibration network. This linear dependence helps to explain the source of the high d
0–d
2 correlation in the OSI method. The fact that the d
2 term is not needed for the OSI and TSD calibrations suggests that these methods yield better perspective centre-d
0 parameter-set estimates, even though their numerical realizations differ, than the TSI method. Furthermore, it also suggests that the need to estimate d
2 may be an artifact of the calibration method caused by the data truncation, at least for the SR3000 camera investigated here. The collection of range observations over the full unit length, U, would alleviate this problem, but in practice this may be difficult due to saturation errors that occur at close range and low signal-to-noise ratio at long range. The integration times chosen for the data capture in this experiment were set so as to achieve a reasonable trade-off between these two factors and, as a result, the collection of data at close range (less than 1.0 m) had to be sacrificed.
Figure 6.
Two-step independent calibration range differences and error model trends.
Figure 6.
Two-step independent calibration range differences and error model trends.


