Article

Towards Multidecadal Consistent Meteosat Surface Albedo Time Series

1
Max-Planck-Institute for Meteorology, KlimaCampus, Bundesstr. 53, 20146 Hamburg, Germany
2
EUMETSAT, Am Kavalleriesand 31, 64295 Darmstadt, Germany
*
Author to whom correspondence should be addressed.
Remote Sens. 2010, 2(4), 957-967; https://doi.org/10.3390/rs2040957
Submission received: 3 March 2010 / Revised: 28 March 2010 / Accepted: 29 March 2010 / Published: 31 March 2010

Abstract

:
Monitoring of land surface albedo dynamics is important for the understanding of observed climate trends. Recently developed multidecadal surface albedo data products, derived from a series of geostationary satellite data, provide the opportunity to study long term surface albedo dynamics at the regional to global scale. Reliable estimates of temporal trends in surface albedo require carefully calibrated and homogenized long term satellite data records and derived products. The present paper investigates the long term consistency of a new surface albedo product derived from Meteosat First Generation (MFG) geostationary satellites for the time period 1982–2006. The temporal consistency of the data set is characterized. The analysis of the long term homogeneity reveals some discrepancies in the time series related to uncertainties in the characterization of the sensor spectral response of some of the MFG satellites. A method to compensate for uncertainties in the current data product is proposed and evaluated.

Graphical Abstract

1. Introduction

The Earth’s surface albedo is a key terrestrial variable which is important for the surface energy budget. Knowledge of temporal and spatial dynamics of surface albedo is therefore a key information to investigate the Earth climate and its variability at multiple time scales [1,2,3,4]. The importance of surface albedo has been recognized by the Global Climate Observing System (GCOS) and has led to a reprocessing of historical long-term satellite records to provide a consistent multidecadal surface albedo climate record.
Operational surface albedo data is available from the MODIS sensor since 2000 [5]. However, long term surface albedo data products that cover multiple decades could only rely on sensors on board of operational weather satellites which were not originally designed to perform climate monitoring.
Geostationary satellites have an extensive historical archive and it has been demonstrated by [6] that they have large potential for the retrieval of surface albedo information. The high temporal sampling frequency of geostationary satellites is advantageous for this purpose. It increases the possibility to observe clear-sky conditions, and it allows for a sequential accumulation of daily observations that can be used to disentangle atmospheric effects from surface anisotropy effects [7]. As geostationary satellite data are available for more than two decades, its exploitation might provide valuable information for climate studies at the regional to global scale [8,9]. The general potential to derive global maps of surface albedo from mosaics of geostationary observations has been shown by [10].
Long term Meteosat surface albedo (MSA) data product have been generated from Meteosat First Generation (MFG) satellite data by EUMETSAT. The MSA data product is available for two spatial domains every 10 days. The first covers the zero degree longitude mission and is available from 1982–2006. This time series has been acquired by six different radiometers exhibiting slightly different radiometric performance. The second data set covers the Indian Ocean (63oE) and is available since 1998.
Subsets of the Meteosat surface albedo data set have been used to investigate the role of surface albedo in African climate [1], monitor drought induced surface albedo changes in the Sahelian region [8] or investigate fire related land surface changes [11,12].
There is a strong need for long term and homogeneous observations of relevant climate variables. However, generating harmonized data records from multiple satellites over many decades is a very challenging task due to changes of the observation systems and their aging in space environment. The long term homogeneity of a satellite derived data product is an essential component in evaluating its applicability for climate research. The requirements for the absolute accuracy and long term homogeneity of surface albedo observations are 0.01 [-] and 0.002 [1/decade] [13].
Up to now, no evaluation of the long term homogeneity of the Meteosat surface albedo data product has been provided. The objectives of the present paper are therefore to analyze the temporal consistency of the Meteosat based MSA data product. Discontinuities in the data product are identified and an empirical method for their correction is developed. Finally, the homogeneity of the corrected data product is assessed.

2. Meteosat Surface Albdeo Data

2.1. Data Set Preparation

The radiometers on board the Meteosat First Generation satellites acquire radiances twice per hour in a single solar spectral band, ranging approximately from 0.4–1.1 μ m , referred to as the visible (VIS) band. The high temporal frequency of the Meteosat Visible and Infrared (MVIRI) sensor allows to disentangle surface and atmospheric effects on the recorded radiances. Pinty et al. [7] have developed a surface albedo retrieval scheme that allows for a simultaneous retrieval of the surface anisotropy as well as the aerosol optical depth of the atmosphere.
The Meteosat surface albedo (MSA) data product was derived for the time period 1982–2006 by EUMETSAT and is available from the EUMETSAT archive (http://archive.eumetsat.org). Details of the retrieval scheme and a description of the data product can be found in [7] and [10]. The data product contains information about the isotropic bi-hemispherical spectral albedo for a specific satellite ( B H R i s o , λ ) and the directional-hemispherical albedo at a sun zenith angle of 30 degree ( D H R 30 , λ ) [14]. These two quantities allow to calculate the actual surface albedo for any combination of diffuse and direct sky radiation [15]. The subscript λ indicates spectral albedo quantities, while the subscript b b will indicate broadband quantities throughout the paper. Quantitative estimates of the product uncertainties are provided with the data product [16]. It takes into account measurement errors (detector noise, digitalization noise) and errors of the retrieval model. Systematic errors as such resulting from calibration uncertainties are not considered [16].

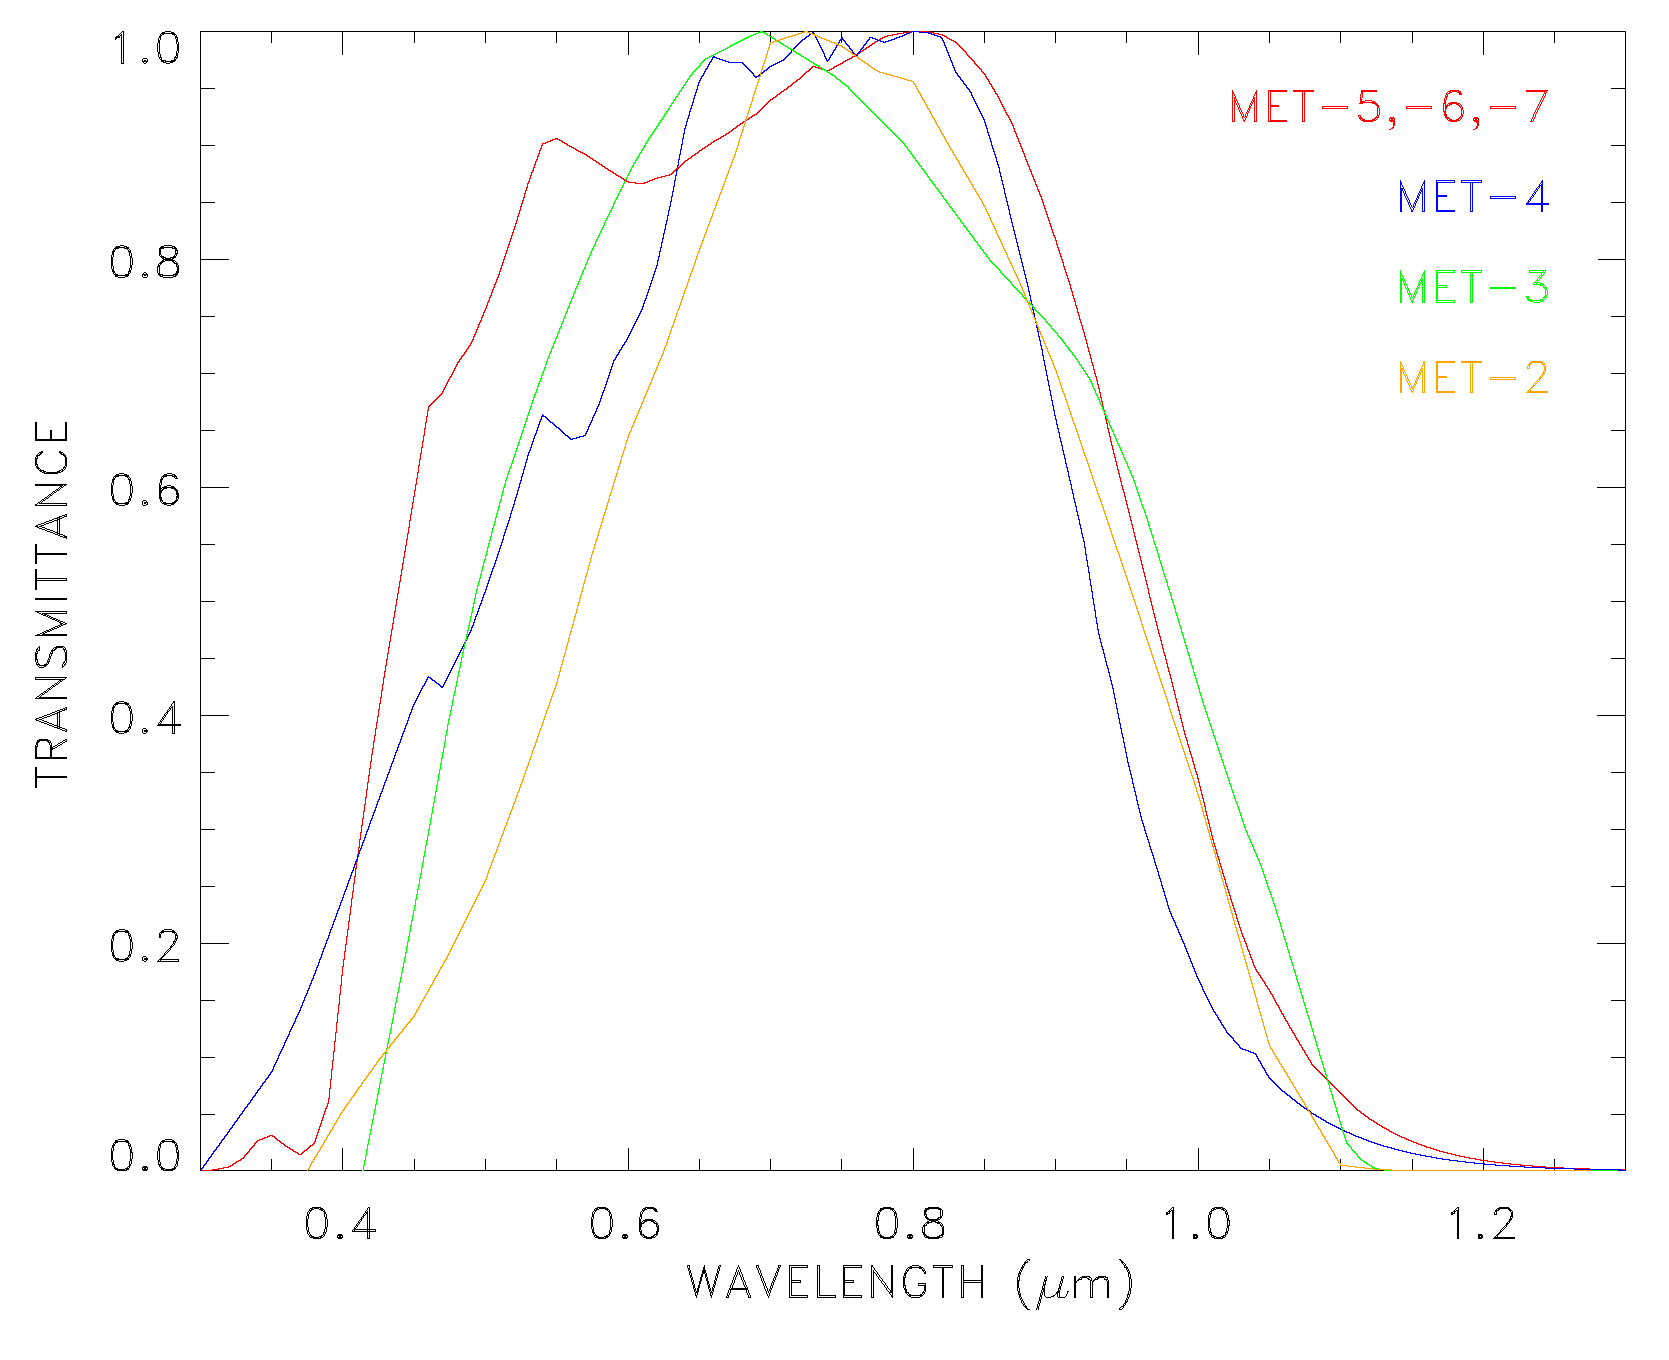
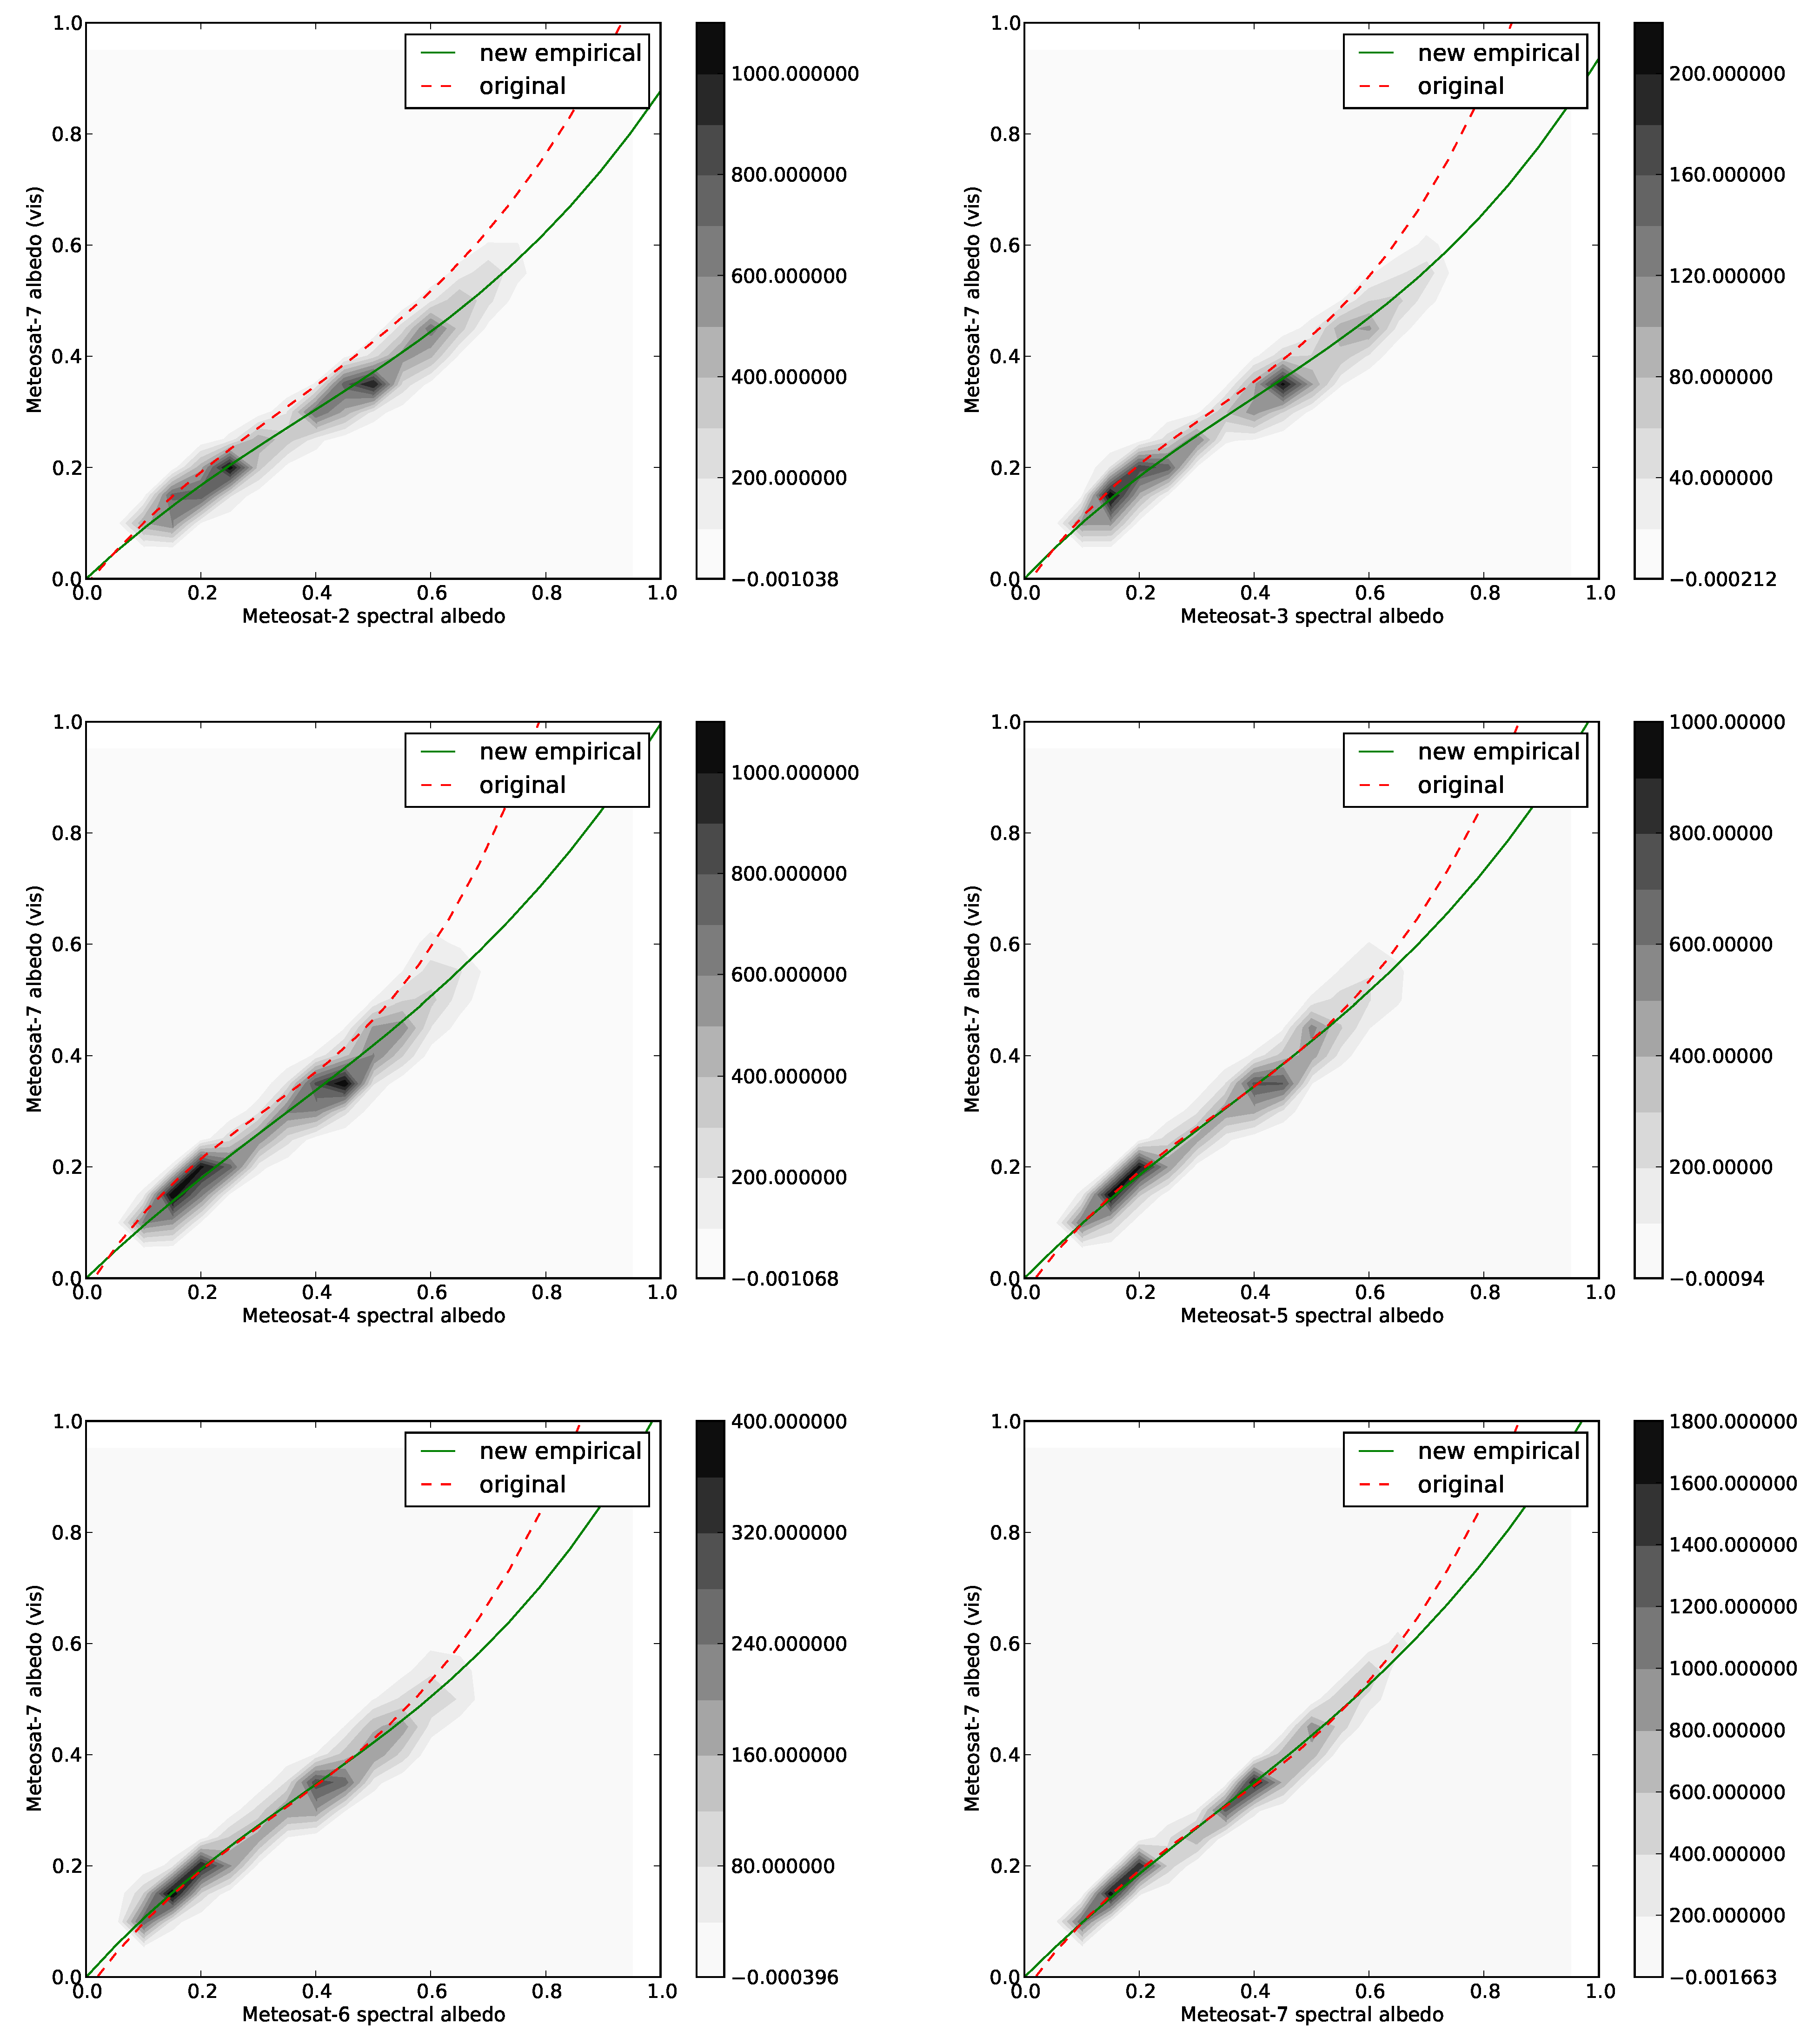
2.2. Spectral Conversion

To obtain a value for the broadband ( 0 . 3 3 . 0 μ m ) surface albedo B H R i s o , b b and D H R 30 , b b , the Meteosat spectral albedo in the VIS ( 0 . 4 1 . 1 μ m ), needs to be extrapolated individually for each satellite and requires information about the spectral response function of the radiometer. Figure 1 shows the spectral response functions for the different MFG satellites.
Figure 1. Spectral response functions of the visible channel of Meteosat First Generation radiometers.
Remotesensing 02 00957 g001
Govaerts et al. [17] have developed an approach to perform this conversion for a large variety of different surface conditions. The spectral conversion is based on a 3-rd order polynomial as
y = d + c x + b x 2 + a x 3
where y corresponds to B H R i s o , b b or D H R 30 , b b and x to B H R i s o , λ or D H R 30 , λ respectively. Different polynomial coefficients (a-d) are required for the different Meteosat satellites. The coefficients were derived using the method introduced by [17] and are given in the MSA product user manual [18]. This defined the standard procedure to derive broadband albedo from the individual satellite spectral albedos.

3. Temporal Consistency Analysis

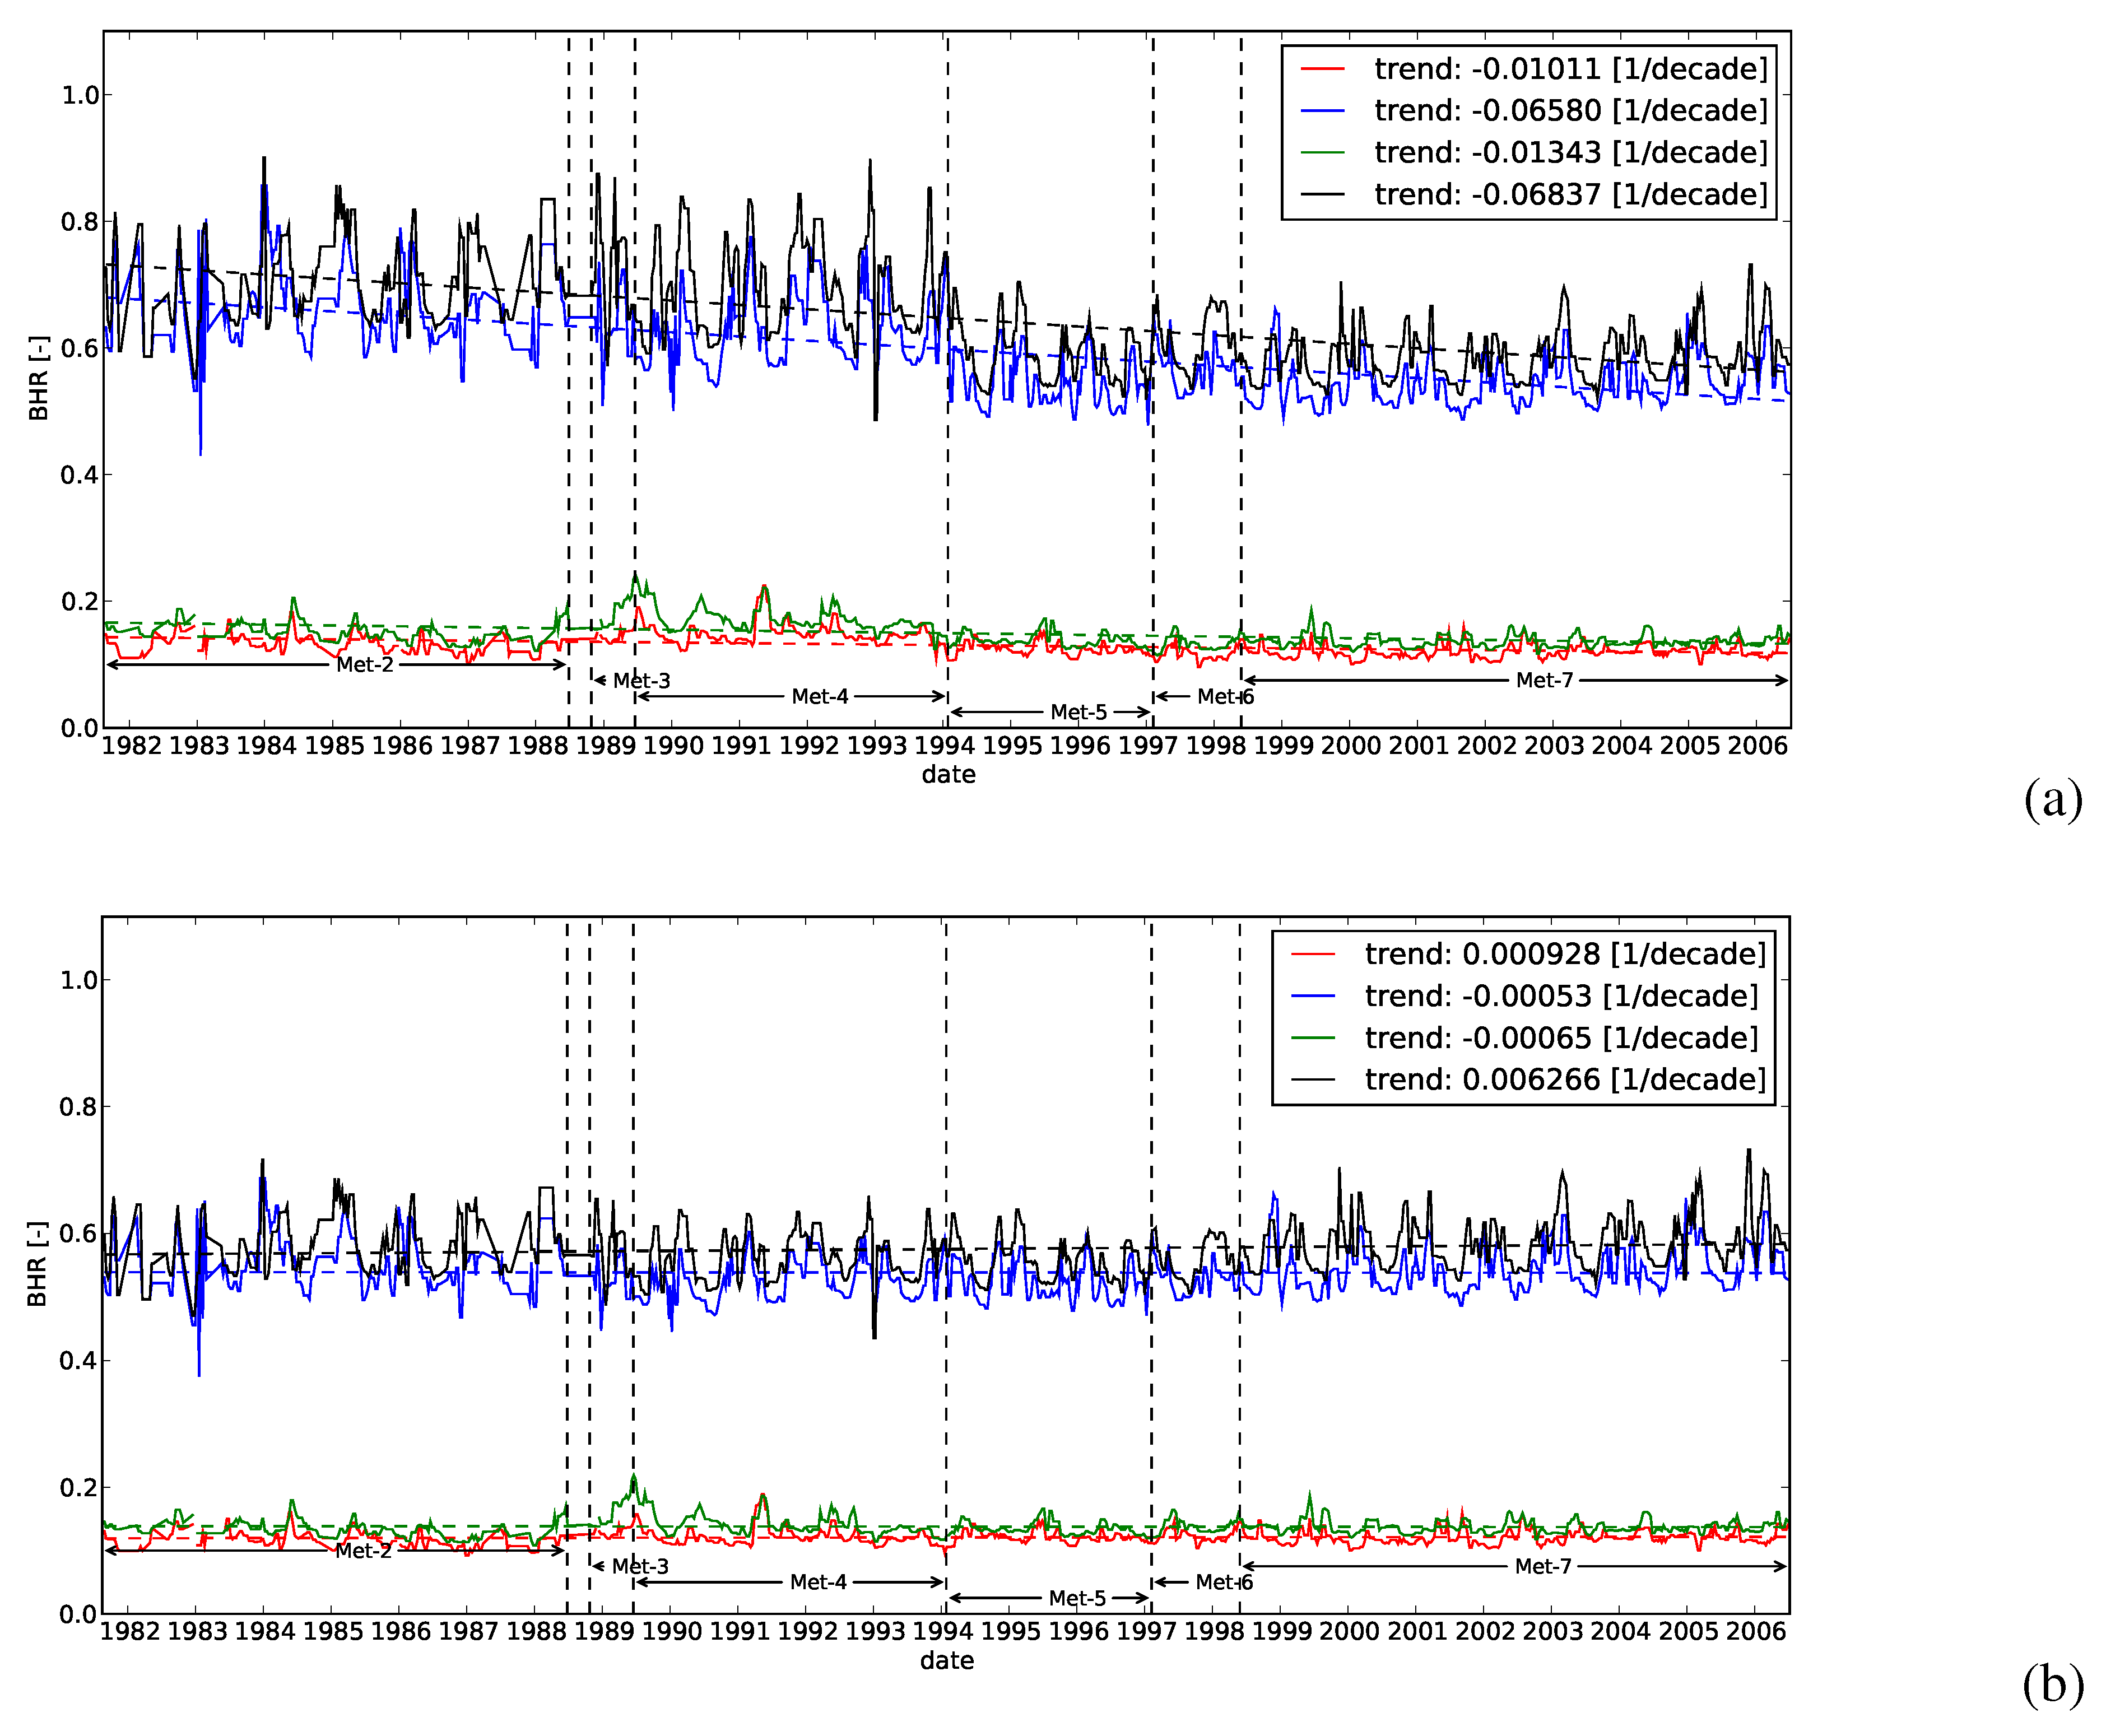
3.1. Vicarious Calibration Targets

The analysis of the temporal consistency of the MSA product is performed using dark and bright reference targets which are assumed to have stable albedo values in time. Desert regions provide good vicarious calibration sites for optical satellites and are widely used as reference targets for satellite (inter) calibration [19]. Desert lava rocks were chosen as dark reference targets and spatially uniform, sand dominated areas were chosen as bright reference sites. Time series of the surface spectral and broadband albedo were extracted from the MSA data product. The broadband albedo was hereby calculated by (1).
Figure 2a shows examples of extracted time series for B H R i s o , b b . The bright surfaces show a much higher inter- and intra-annual variability than the darker surfaces which is due to the higher magnitude of the signal. The coefficient of variation was found to be very similar for the dark and bright targets. A clear change in surface albedo is observed in 1994. This change is mainly observed for bright surfaces, while it is not observed for dark surfaces. Further the dynamical range of the observed surface albedo decreases after 1994. The observed change in broadband surface characteristics corresponds to a change from the Meteosat-4 to the Meteosat-5 satellite in January 1994. The observed changes of surface albedo are therefore likely to be an artifact of the change of the observing system. The selected targets are assumed to be rather stable over the observation period. However, a decrease of 0.06 (0.01) per decade is observed for the bright (dark) targets.
The spectral conversion coefficients applied in (1) are dependent on the spectral response of the specific satellite radiometer. Uncertainties in the spectral response function will therefore directly affect the non-linear extrapolation from the Meteosat spectral band to the solar broadband. As the discrepancies between the different sensors were not observed when the spectral albedo was converted to a much smaller wavelength interval (e.g., Meteosat-7 spectral interval), it is likely that the observed systematic artifacts are due to uncertainties in the spectral conversion coefficients and are not a result of inaccurate calibration of the sensor measurements themselves. The differences between the different sensors become more obvious, when analyzing surface albedo anomalies.

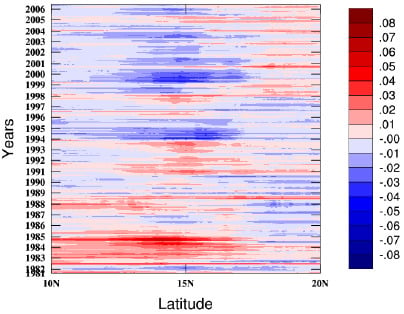
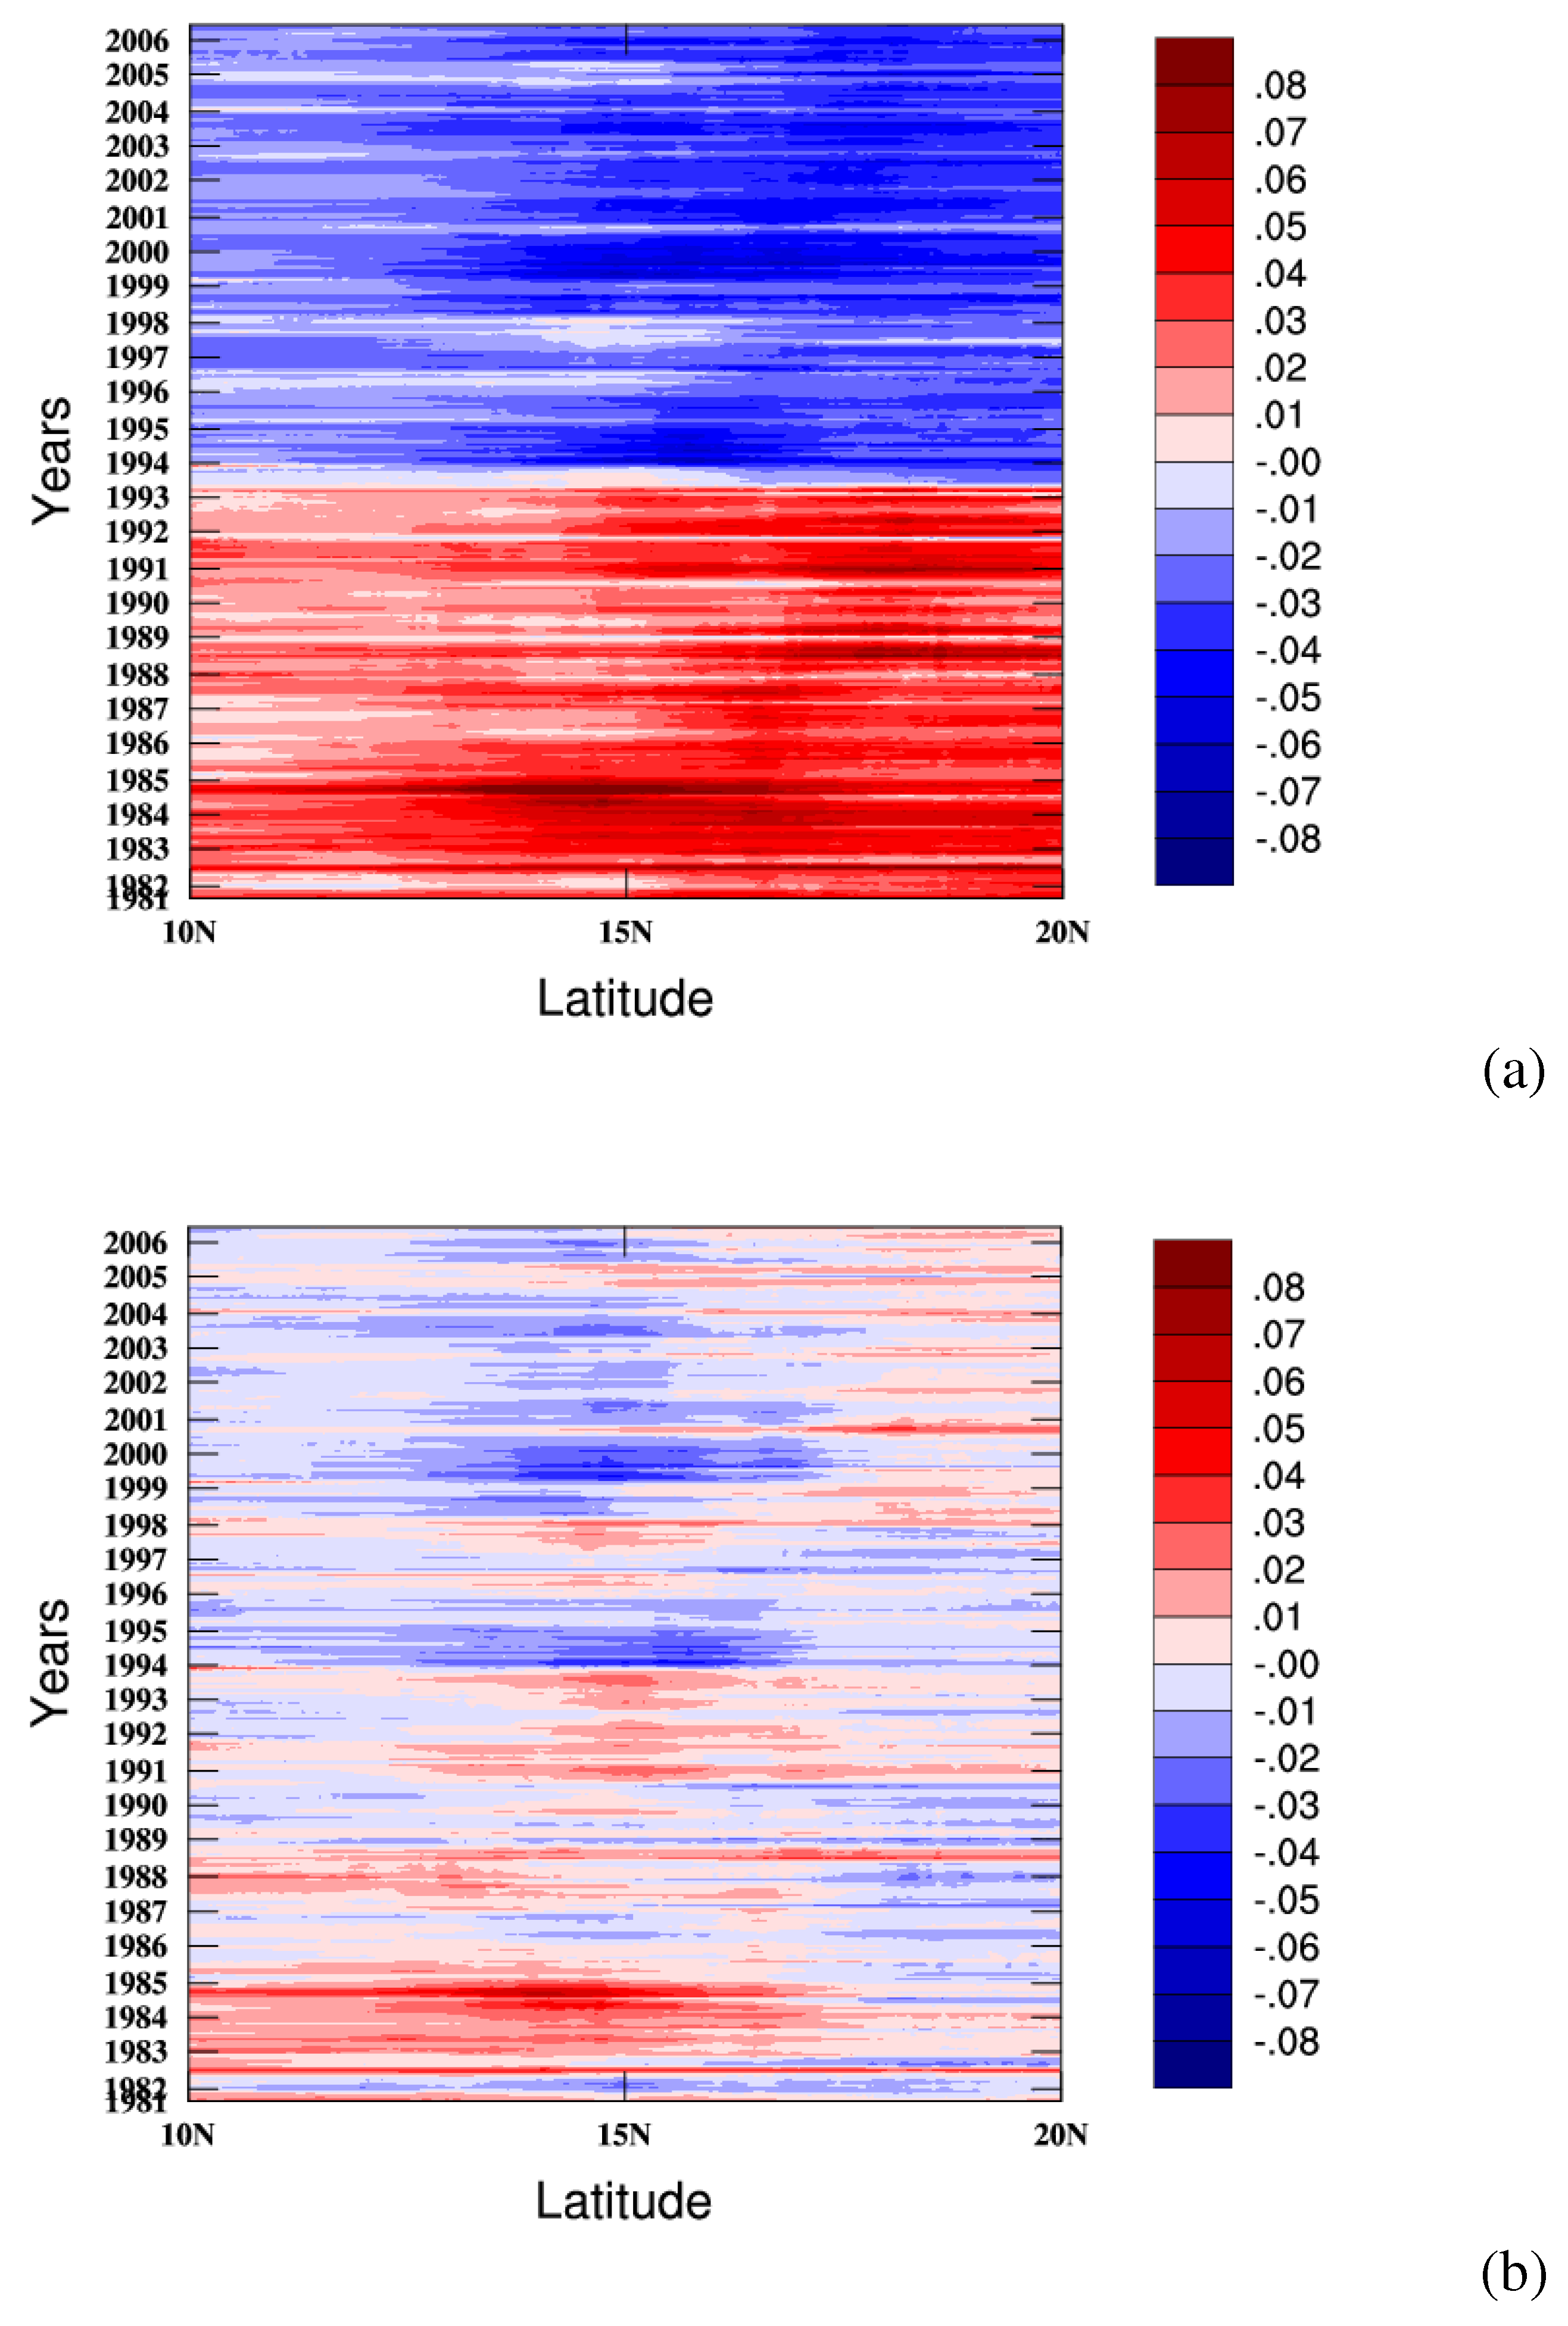
3.2. Analysis of Anomalies

An analysis of the surface albedo anomalies is made on a monthly basis for each pixel. The anomaly of a month is calculated as the difference between the monthly mean surface albedo and the climatological mean of the same month, while the latter is derived from the entire time series (1982–2006).
Figure 2. Surface albedo ( B H R i s o , b b ) time series for dark and bright desert targets for different spectral conversion approaches: (a) broadband albedo with standard conversion coefficients, (b) broadband with new conversion coefficients; different lines correspond to different targets.
Remotesensing 02 00957 g002
Figure 3a shows a time-latitude plot of surface albedo anomalies. The zonal average surface albedo anomaly was calculated for each month for an area between 10°N and 20°N and –10W to 30E for the period from 1982 to 2006. The observed abrupt change of surface albedo in the year 1994 is clearly observed for all latitudes in the anomaly plot. The surface albedo differences between the different satellites were estimated using two consecutive years of two satellites. Table 1 summarizes the estimated bias between subsequent satellites. While the mean difference between Met-4 and Met-5 was the largest one, considerable mean differences were also observed for Met-2/Met-3 and Met-3/Met-4, while only minor differences were found for more recent satellites (Table 1). The radiometers of the last three satellites have been produced in the same batch and exhibit therefore very similar spectral characteristics. A correction of the observed systematic differences between the different sensors is essential to ensure that the surface albedo changes in the MSA data product reflect changes of the surface properties and are not an artefact of the data processing. A methodology to re-evaluate the spectral conversion coefficients will therefore be developed and evaluated in Section 4.
Figure 3. Time-latitude (Hovmoeller) diagrams of monthly Meteosat surface albedo anomalies based on different spectral conversion approaches: (a) broadband visible, based on original spectral conversion coefficients [18], (b) broadband visible based on new coefficients. Reference period for anomaly calculation: 1982–2006.
Remotesensing 02 00957 g003

4. Empirical Correction

4.1. Method Description

Revised spectral conversion coefficients are derived to reduce the uncertainties in the MSA broadband product. The Meteosat-7 radiometer is the best characterized instrument in the Meteosat satellite series [16,20]. The Meteosat-7 broadband albedo product has been compared against surface albedo
Table 1. Mean surface albedo difference between pair of two consecutive Meteosat satellites before (original) and after (new coefficients) correction of spectral conversion coefficients.
sat1/sat2 B H R i s o , b b original B H R i s o , b b new coefficients
2/30.030–0.006
3/4–0.0230.004
4/50.0420.001
5/60.0030.002
6/70.000–0.004
from MODIS and MISR and it was found that the different products are in relative agreement by 10% [16]. The Meteosat-7 surface albedo is therefore used as a reference to revise the spectral conversion coefficients for the MSA data product.
To obtain new spectral conversion coefficients, an empirical approach is applied which only requires a detailed knowledge of the Meteosat-7 spectral response function. For Meteosat-7, B H R i s o , λ ( D H R 30 , λ ) is converted to B H R i s o , b b ( D H R i s o , b b ) using the original conversion coefficients [18]. To obtain new calibration coefficients for (1) for the other sensors, we extract B H R i s o , λ ( D H R 30 , λ ) for the reference targets. These targets were carefully selected to cover a range of surface conditions that differ in terms of albedo as much as possible while being as constant as possible throughout the period covered by the Meteosat data product. Examples of these reference target areas are bright desert areas, dark volcanic rocks or rain forested areas. A total of 113 reference targets were selected.
Assuming that the surface albedo did not change for the stable targets, new spectral conversion coefficients could be obtained through a least square fit by relating the extracted B H R i s o , λ ( D H R 30 , λ ) for each of the satellites to B H R i s o , b b ( D H R 30 , b b ) using the Meteosat-7 broadband surface albedo value as a reference. Figure 4 demonstrates density plots of the relationships between different Meteosat spectral albedos and Meteosat-7 broadband albedo. The original spectral conversion curve is shown, as obtained from the original spectral conversion coefficients, together with the new, empirically derived spectral conversion curve. It is seen that the new empirical estimate results in lower broadband surface albedo predictions for Met-2. The empirically estimated relationships for Met-6 are very close to the theoretically derived curve. In the surface albedo range from 0 to 0.6, which corresponds to the interval used to derive the theoretical conversion coefficients, the two curves are nearly identical. This indicates that the chosen reference points provide a good database for the estimation of the new spectral conversion coefficients which are given in Table 2.

4.2. Evaluation of the New Coefficient Robustness

As the estimation of the spectral conversion coefficients relies on the empirical selection of stable targets, the selection of these reference points might be crucial for the stability of the derived empirical relationships. We therefore investigated the robustness of the estimated conversion coefficients by a) removing a single reference point in the calculation of the polynomial coefficients and b) randomly select subsets of 75% of the reference targets and re-calculate the polynomial coefficients. While a) was
Table 2. Estimated spectral conversion coefficients for the conversion of Meteosat spectral albedo to the broadband albedo using equation (1) of the paper.
satellitechannelabcd
2 B H R i s o , b b 7.43798614e-01-8.48408699e-019.81895685e-01-2.85976712e-05
39.11732554e-01-1.07471538e+001.09896255e+00-2.85976712e-05
46.47315860e-01-6.55005634e-011.00361478e+00-2.85976712e-05
57.47902989e-01-7.66418219e-011.04928327e+00-2.85976712e-05
69.98916626e-01-1.13301563e+001.15992260e+00-2.85976712e-05
77.00615168e-01-6.88233614e-011.03751910e+00-2.85976712e-05
2 D H R 30 , b b 1.27798259e+00-1.45464587e+001.22636437e+00-2.95364443e-05
31.25365901e+00-1.52968502e+001.32036722e+00-2.95364443e-05
48.96015048e-01-1.07426369e+001.22655797e+00-2.95364589e-05
58.89843404e-01-1.09384084e+001.25341415e+00-2.95364443e-05
61.05711114e+00-1.31526375e+001.30573940e+00-2.95364443e-05
79.00940299e-01-1.11476350e+001.26273489e+00-2.95364589e-05
done once for each data point to assess the impact of a single point on the overall result, b) was repeated 1000 times, resulting in 1000 slightly different sets of polynomial coefficients, each based on a different subset of data points. The such obtained polynomial coefficients were used to calculate the broadband albedo. The differences between the different realizations was compared.
The obtained maximum broadband albedo difference, resulting from the different coefficients, was below 0.01, and thus far smaller than the uncertainties associated with the spectral albedo data product itself. The selected reference points are therefore considered to provide a robust estimate of the spectral conversion coefficients.

4.3. Results

Broadband albedo was calculated for the entire MSA product using the new conversion coefficients. The impact of the new spectral conversion coefficients on the long term consistency of the data product is evaluated. Figure 2b and Figure 3b show the surface albedo time series and time-latitude (Hovmoeller) diagrams for B H R i s o , b b derived from the new spectral conversion coefficients.
The plots show that the new coefficients correct successfully for the systematic differences between the different satellite sensors. The systematic differences have nearly vanished (Table 1). The resulting time series shows a similar temporal variance for the different satellites. No trend in the data is observed anymore. The estimated long term temporal trends are smaller than 0.007 per decade. The anomaly plot in Figure 3 gives a similar picture. The clear differences between Met-4 and Met-5 have vanished and the anomaly patterns show no clear sensor dependent anomalies any more.
Figure 4. Density plot of the relationship between B H R i s o , λ and B H R i s o , b b in the Meteosat VIS band for all Meteosat satellites. The red dashed line corresponds to the theoretical relationship as given in the product user manual [18] and the green solid line corresponds to the new empirically estimated relationship. While strong corrections are applied for the Met-2/3-4 sensors, the curves for Met-5/6/7 are nearly identical for the albedo range 0 0 . 6 .
Remotesensing 02 00957 g004

5. Conclusions

The MSA data product derived from the recent Meteosat-7 sensor is in good agreement with surface albedo data products derived from multispectral remote sensing instruments like MODIS and MISR [16]. However, the present study has revealed systematic deficits in the long term homogeneity of the MSA data record when derived from observation acquired prior to 1995 with Meteosat-2 to -4. Systematic discontinuities in the long term broadband surface albedo data product have been identified. These are mainly associated to uncertainties in the spectral conversion coefficients for Meteosat-2 to -4 due to uncertainties in the spectral characterization of older Meteosat radiometers. An empirical method was developed to derive a new set of spectral conversion coefficients. The new coefficients result in a much more robust and stable long term data record as is needed for the data analysis at climate timescales. A more comprehensive analysis, including the consistency between the MSA data set and other albedo and vegetation time series will be the focus of further research.

Acknowledgements

This work was supported through the Cluster of Excellence ‘CliSAP’ (EXC177), University of Hamburg, funded through the German Science Foundation (DFG). Meteosat surface albedo data was provided by EUMETSAT.

References

  1. Knorr, W.; Schnitzler, K.G.; Govaerts, Y. The role of bright desert regions in shaping North African climate. Geophys. Res. Lett. 2001, 28, 3489–3492. [Google Scholar] [CrossRef]
  2. Rechid, D.; Hagemann, S.; Jacob, D. Sensitivity of climate models to seasonal variability of snow-free land surface albedo. Theor. Appl. Climatol. 2008, 95, 197–221. [Google Scholar] [CrossRef]
  3. Pongratz, J.; Raddatz, T.; Reick, C.; Esch, M.; Claussen, M. Radiative forcing from anthropogenic land cover change since A.D. 800. Geophys. Res. Lett. 2009, 36. [Google Scholar] [CrossRef]
  4. Fletcher, C.; Kushner, P.; Hall, A.; Qu, X. Circulation responses to snow albedo feedback in climate change. Geophys. Res. Lett. 2009, 36. [Google Scholar] [CrossRef]
  5. Schaaf, C.; Gao, F.; Strahler, A.; Lucht, W.; Li, X.; Tsang, T.; Strugnell, N.C.; Zhang, X.; Jin, Y.; Muller, J.-P.; Lewis, P.; Barnsley, M.; Hobson, P.; Disney, M.; Roberts, G.; Dunderdale, M.; Doll, C.; d’Entremont, R.P.; Hu, B.; Liang, S.; Privette, J.L.; Roy, D. First operational BRDF, albedo and nadir reflectance products from MODIS. Remote Sens. Environ. 2002, 83, 135–148. [Google Scholar] [CrossRef]
  6. Pinty, B.; Roveda, F.; Verstraete, M.; Gobron, N.; Govaerts, Y.; Martonchik, J.; Diner, D.; Kahn, R. Surface albedo retrieval from Meteosat: Part 2: Applications. J. Geophys. Res. 2000, 105, 18113–18134. [Google Scholar] [CrossRef]
  7. Pinty, B.; Roveda, F.; Verstraete, M.; Gobron, N.; Govaerts, Y.; Martonchik, J.; Diner, D.; Kahn, R. Surface albedo retrieval from Meteosat 1. Theory. J. Geophys. Res. 2000, 105, 18099–18112. [Google Scholar] [CrossRef]
  8. Govaerts, Y.; Lattanzio, A. Estimation of surface albedo increase during the eighties Sahel drought from Meteosat observations. Global Planet. Change 2008, 64, 139–145. [Google Scholar] [CrossRef]
  9. Knapp, K.; Bates, J. ISCCP B1 data at NCDC: A new climate resource. In Proceedings of 13th Satellite Meteorology and Oceanography Conference, Norfolk, VA, USA; 2004. [Google Scholar]
  10. Govaerts, Y.M.; Lattanzio, A.; Taberner, M.; Pinty, B. Generating global surface albedo products from multiple geostationary satellites. Remote Sens. Environ. 2008, 112, 2804–2816. [Google Scholar] [CrossRef]
  11. Pinty, B.; Verstraete, M.; Gobron, N.; Govaerts, Y.; Roveda, F. Do Human-induced Fires Affect the Earth Surface reflectance at Continental Scales. EOS Trans. AGU 2000, 81, 381–389. [Google Scholar] [CrossRef]
  12. Myhre, G.; Govaerts, Y.; Haywood, J.; Berntsen, T.; Lattanzio, A. Radiative effect of surface albedo change from biomass burning. Geophys. Res. Lett. 2005, 32. [Google Scholar] [CrossRef]
  13. Ohring, G.; Wielicki, B.; Spencer, R.; Emery, B.; Datla, R. Satellite instrument calibration for measuring global climate change: Report of a Workshop. Bull. Amer. Meteorol. Soc. 2005, 86, 1303–1313. [Google Scholar] [CrossRef]
  14. Schaepman-Strub, G.; Schaepman, M.; Painter, T.; Dangel, S.; Martonchik, J. Reflectance quantities in optical remote sensingdefinitions and case studies. Remote Sens. Environ. 2006, 103, 27–42. [Google Scholar] [CrossRef]
  15. Pinty, B.; Lattanzio, A.; Martonchik, J.V.; Verstraete, M.M.; Gobron, N.; Taberner, M.; Widlowski, J.L.; Dickinson, R.E.; Govaerts, Y. Coupling diffuse sky radiation and surface albedo. J. Atm. Sci. 2005, 62, 2580–2591. [Google Scholar] [CrossRef]
  16. Govaerts, Y.M.; Lattanzio, A. Retrieval error estimation of surface albedo derived from geostationary large band satellite observations: Application to Meteosat-2 and Meteosat-7 data. J. Geophys. Res. 2007, 112. [Google Scholar] [CrossRef]
  17. Govaerts, Y.; Pinty, B.; Taberner, M.; Lattanzio, A. Spectral conversion of surface albedo derived from Meteosat first generation observations. IEEE Geosc. Rem. Sens. Letters 2006, 3, 23–27. [Google Scholar] [CrossRef]
  18. EUMETSAT. Meteosat Surface Albedo Product Users Manual and Format Guide; EUM/FG/13, Version 2.1; EUMETSAT: Darmstadt, Germany, 2007. [Google Scholar]
  19. Govaerts, Y.; Clerici, M. Evaluation of radiative transfer simulation accuracy over bright desert calibration sites. Adv. Space Res. 2003, 32, 2201–2210. [Google Scholar] [CrossRef]
  20. Govaerts, Y.M. Correction of the Meteosat-5 and -6 VIS band relative spectral response with Meteosat-7 characteristics. Int. J. Remote Sens. 1999, 20, 3677–3682. [Google Scholar] [CrossRef]

