Spatial Enhancement of MODIS-based Images of Leaf Area Index: Application to the Boreal Forest Region of Northern Alberta, Canada


Abstract
:1. Introduction

2. Methods
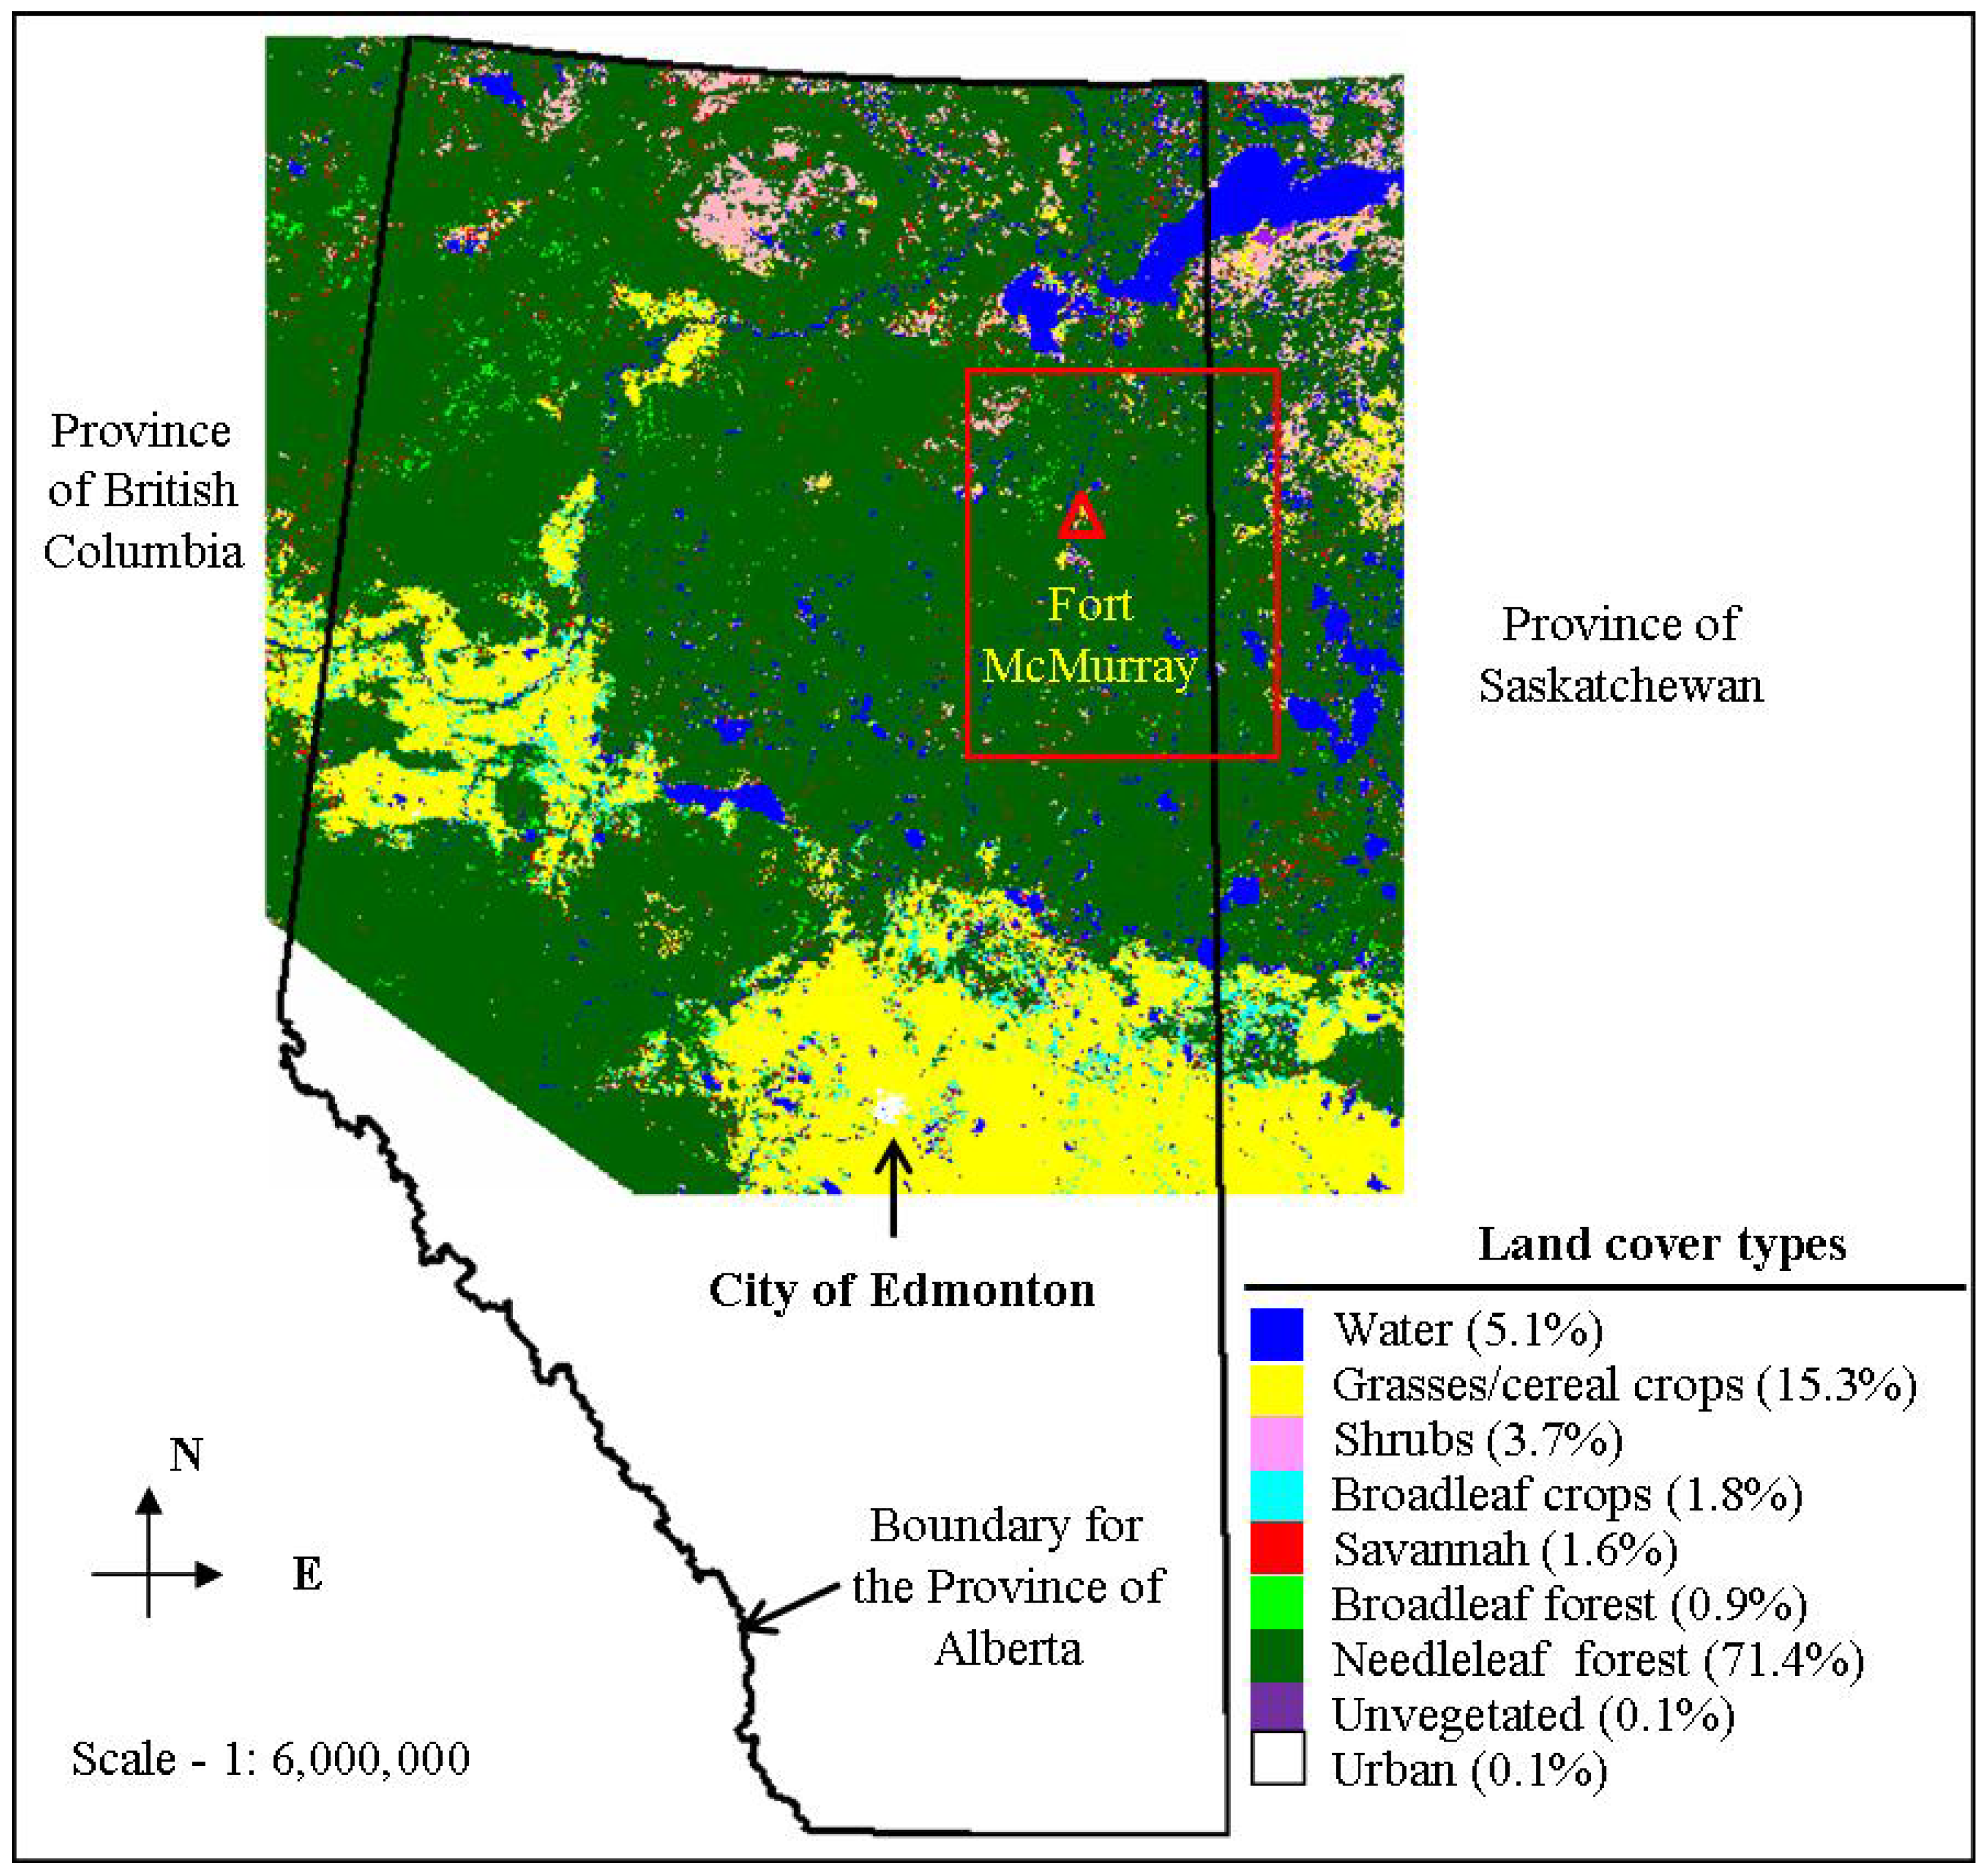
2.1. General Description of the Study Area and Data Requirements
2.2. Image Pre-Processing
2.3. Data Fusion
2.4. Field-based LAI Data Acquisition and Processing
3. Results and Discussion


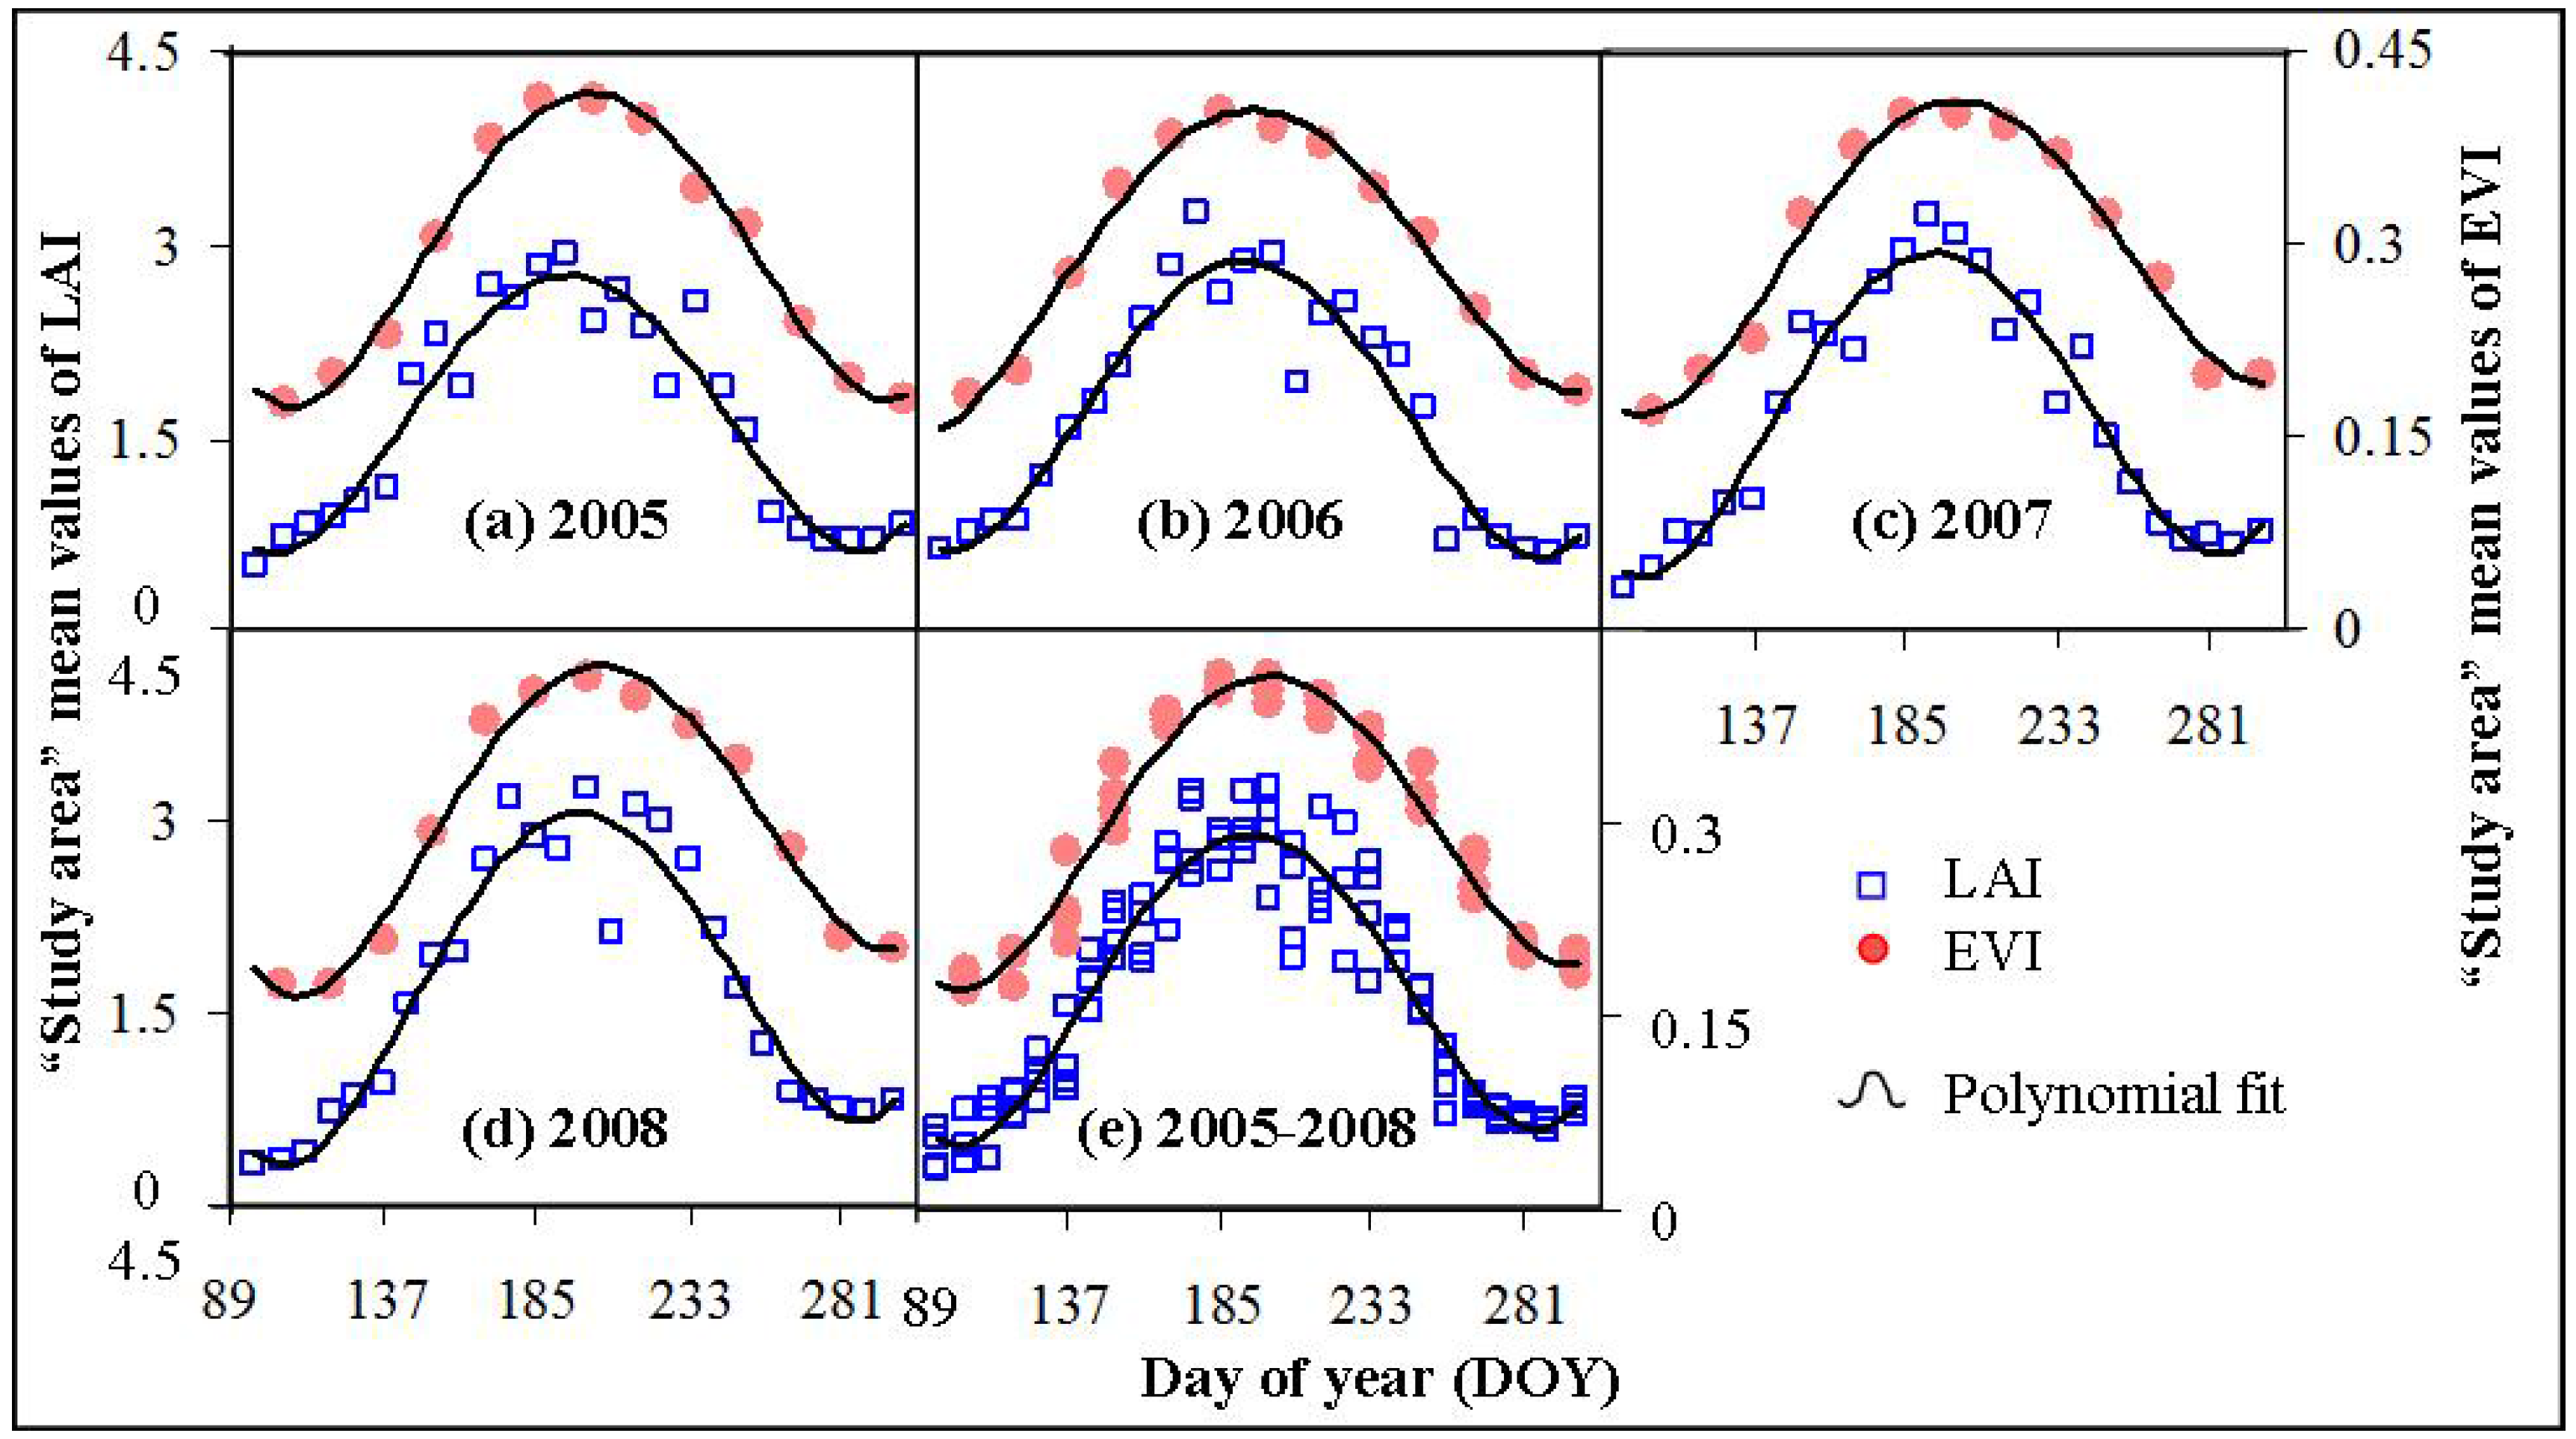
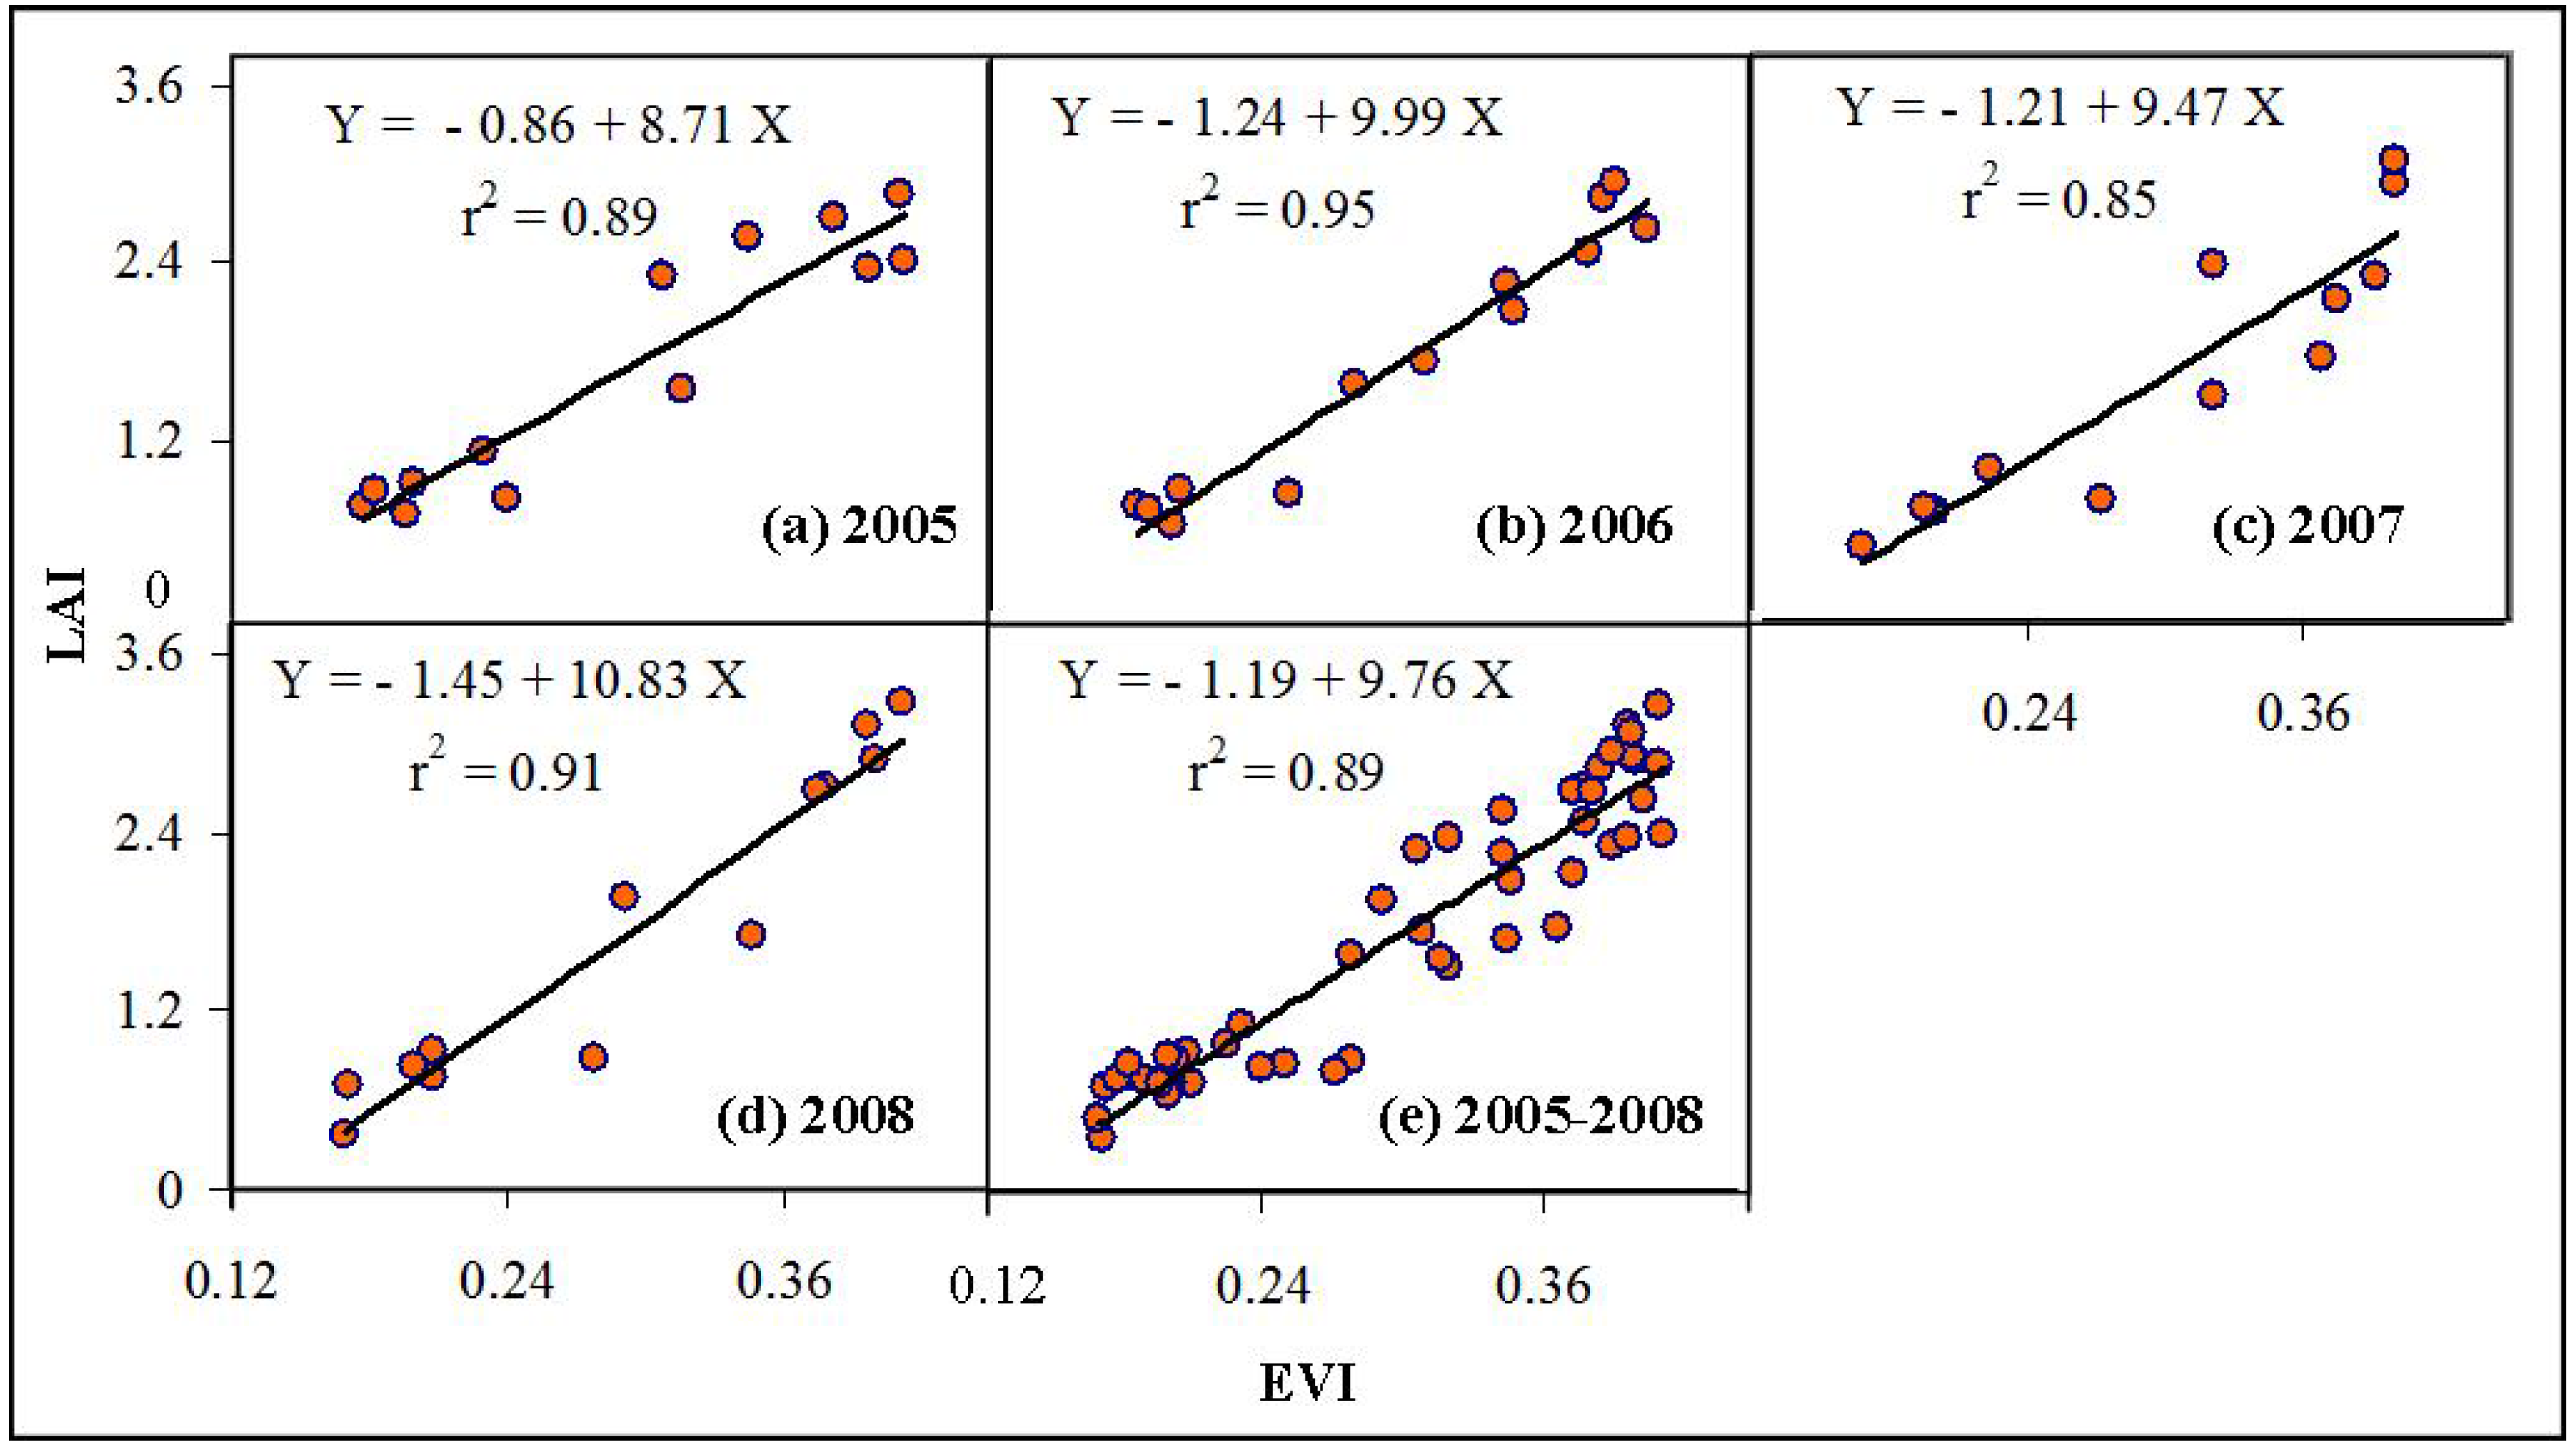
| Variable | Year | a0 | a1 | a2 | a3 | a4 | r2 | F-stat |
|---|---|---|---|---|---|---|---|---|
| LAI | 2005 | 3e-08 | 2e-05 | 0.0065 | 0.70 | 26.82 | 0.93 | 70.03 |
| EVI | 3e-09 | 3e-06 | 0.0007 | 0.08 | 3.40 | 0.99 | 189.24 | |
| LAI | 2006 | 3e-08 | 2e-05 | 0.0063 | 0.67 | 25.50 | 0. 92 | 59.93 |
| EVI | 2e-09 | 2e-06 | 0.0004 | 0.04 | 1.53 | 0. 98 | 149.15 | |
| LAI | 2007 | 4e-08 | 3e-05 | 0.0075 | 0.81 | 31.00 | 0. 95 | 100.82 |
| EVI | 3e-09 | 2e-06 | 0.0006 | 0.06 | 2.59 | 0. 98 | 122.07 | |
| LAI | 2008 | 4e-08 | 3e-05 | 0.0084 | 0.94 | 36.71 | 0. 94 | 76.98 |
| EVI | 3e-09 | 3e-06 | 0.0007 | 0.08 | 3.60 | 0. 98 | 110.84 | |
| LAI | All years | 3e-08 | 3e-05 | 0.0072 | 0.78 | 30.00 | 0. 92 | 279.71 |
| EVI | 3e-09 | 2e-06 | 0.0006 | 0.07 | 2.78 | 0. 97 | 351.15 |


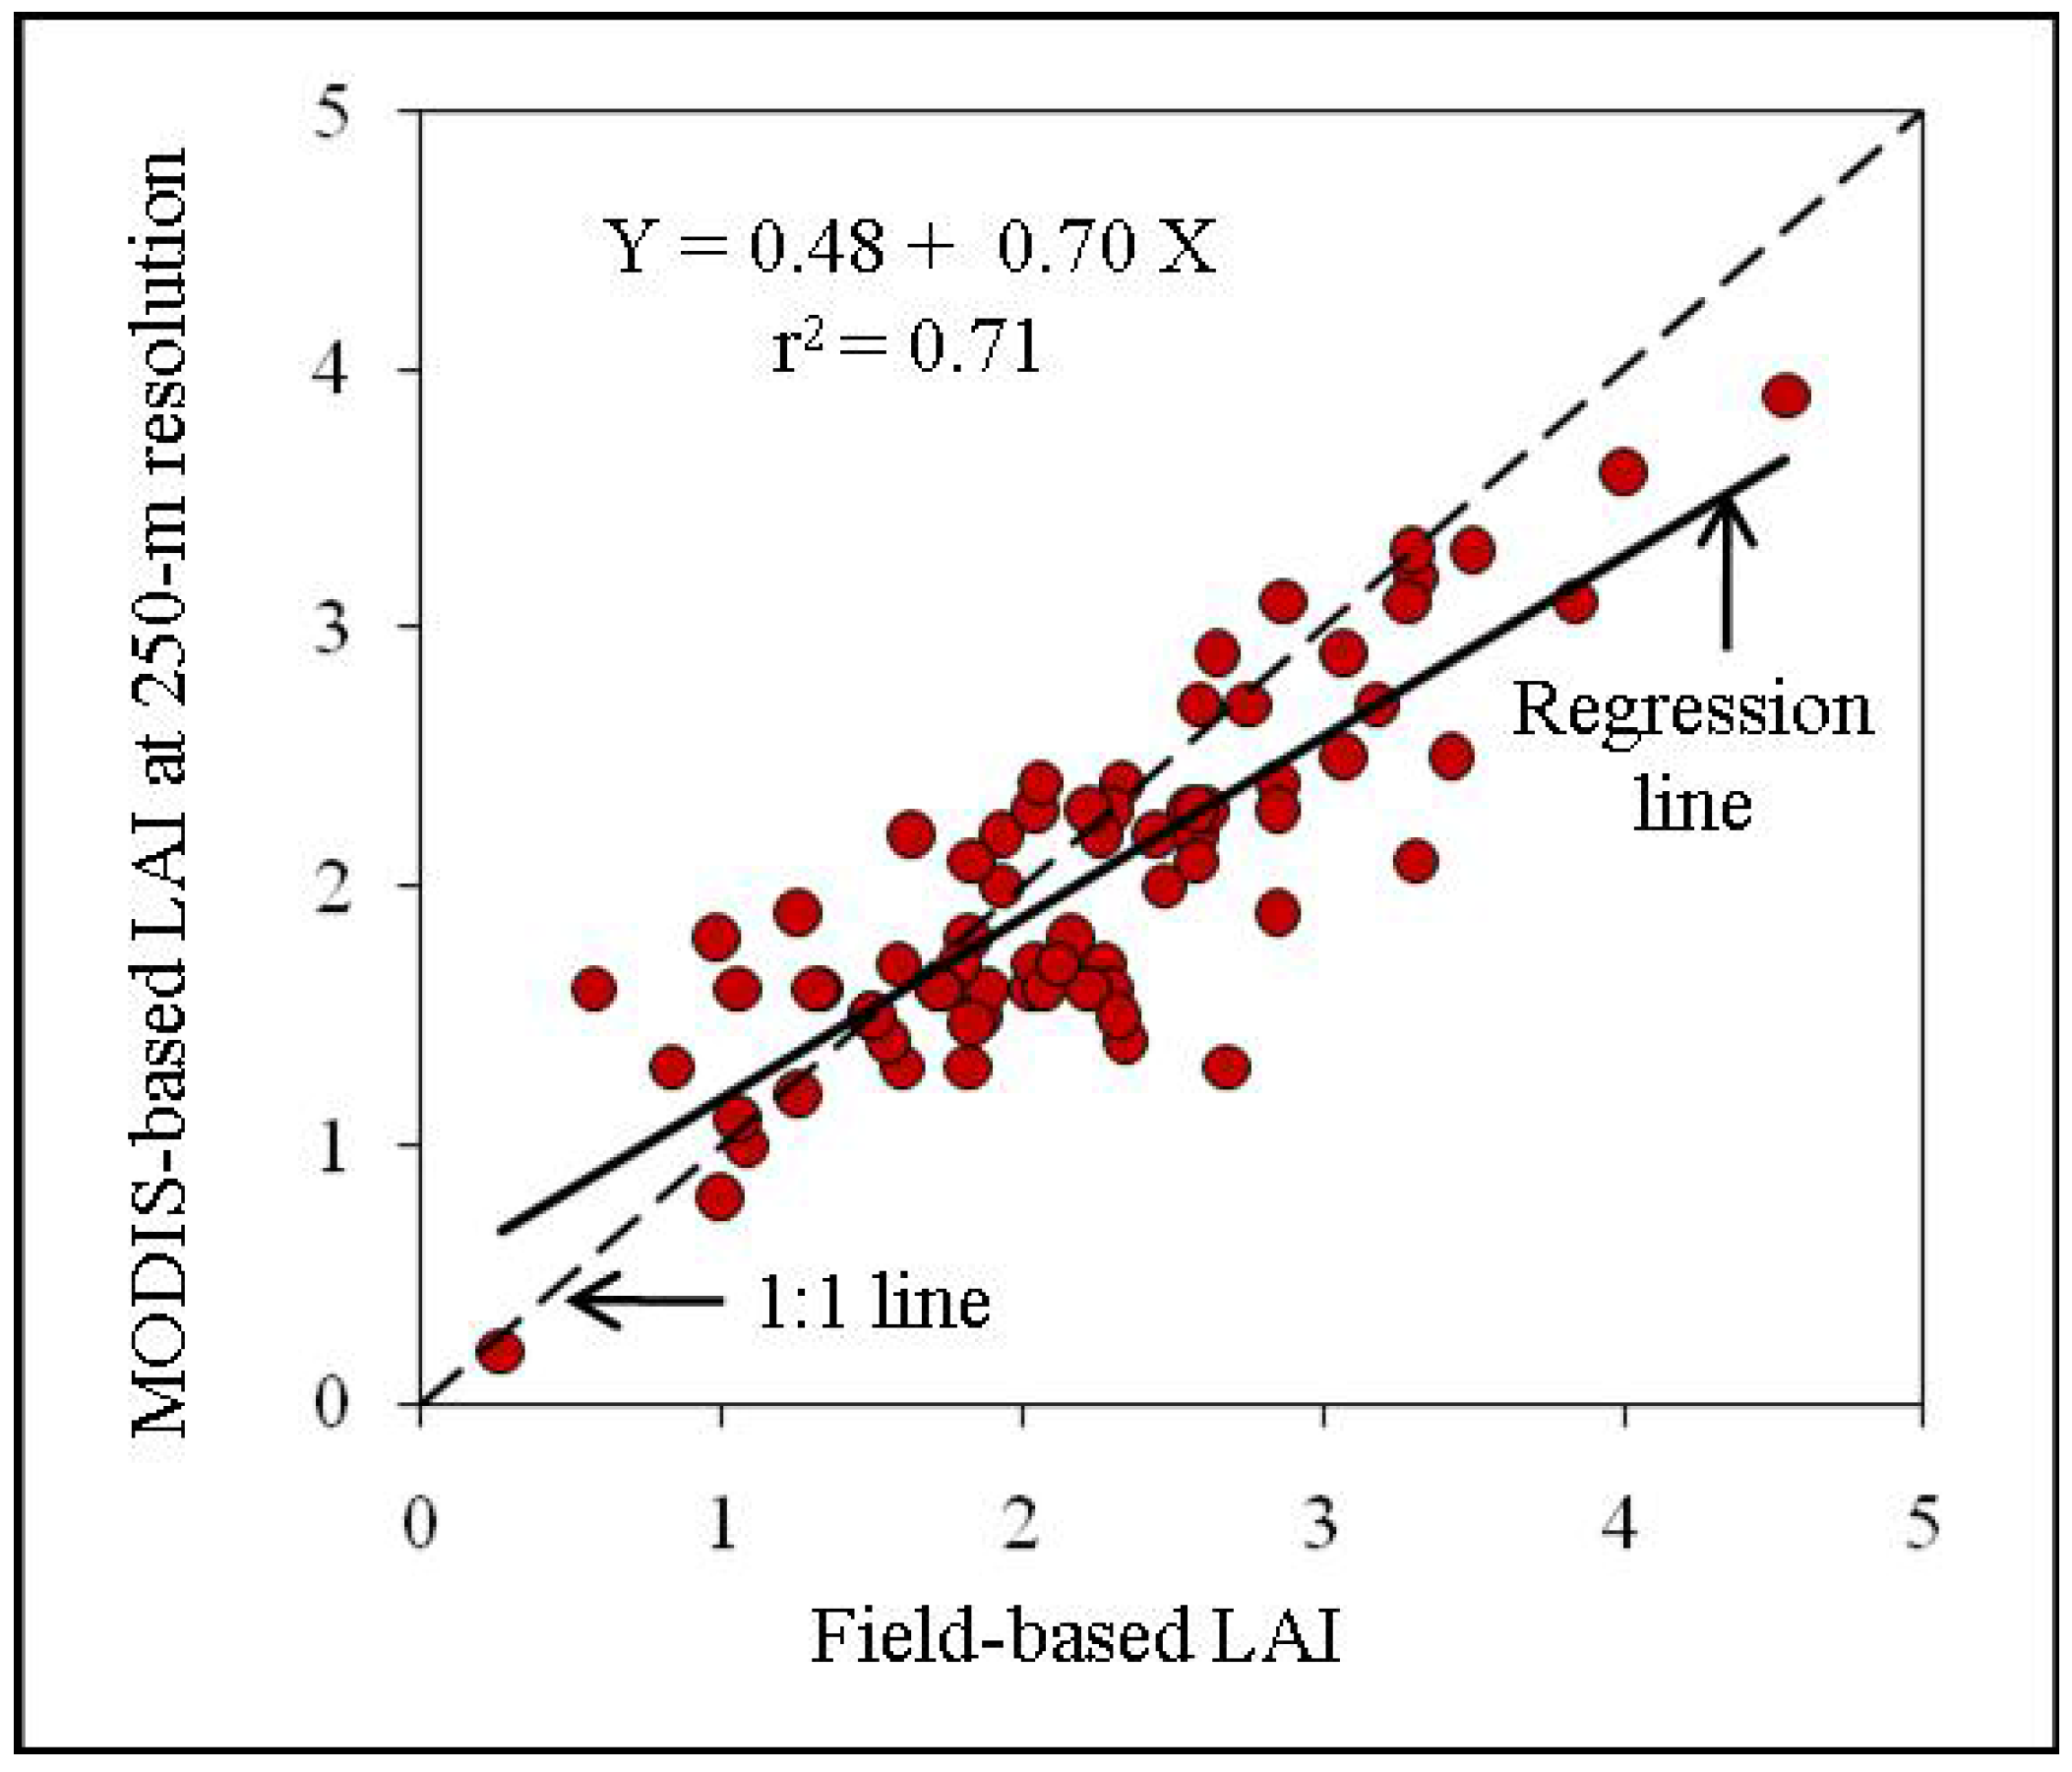
- (i)
- Field-based measurements are collected at a particular time of a day, whereas MODIS-based estimates are generated from 8- and 16-day composites, and
- (ii)
- Field-based measurements are collected by sensing the canopy from below, and as a result the measure of LAI cannot account for the understorey component. In contrast, RS-based methods measure LAI from sensing the top of the canopy. Under sub-optimal overstorey densities, understorey canopy effects are most likely to influence sensor readings and subsequent calculation of LAI.
4. Concluding Remarks
Acknowledgements
References and Notes
- Chen, J.M.; Black, T.A. Defining leaf area index for non-flat leaves. Plant Cell Environ. 1992, 15, 421–429. [Google Scholar] [CrossRef]
- Jonckheere, I.; Fleck, S.; Nackaerts, K.; Muys, B.; Coppin, P.; Weiss, M.; Baret, F. Review of methods for in situ leaf area index determination, Part I. Theories, sensors and hemispherical photography. Agric. For. Meteorol. 2004, 121, 19–35. [Google Scholar] [CrossRef]
- Myneni, R.B.; Nemani, R.R.; Running, S.W. Estimation of global leaf area index and absorbed PAR using radiative transfer models. IEEE Trans. Geosci. Remote Sens. 1997, 35, 1380–1393. [Google Scholar] [CrossRef]
- Huete, A.; Didan, K.; Miura, T.; Rodriguez, E.P.; Gao, X.; Ferreira, L.G. Overview of the radiometric and biophysical performance of the MODIS vegetation indices. Remote Sens. Environ. 2002, 83, 195–213. [Google Scholar] [CrossRef]
- Ahl, D.E.; Gower, S.T.; Burrows, S.N.; Shabanov, N.V.; Myneni, R.B.; Knyazikhin, Y. Monitoring spring canopy phenology of a deciduous broadleaf forest using MODIS. Remote Sens. Environ. 2006, 104, 88–95. [Google Scholar] [CrossRef]
- Chen, P.-Y.; Fedosejevs, G.; Tiscareno-Lopez, M.; Arnold, J.G. Assessment of MODIS-EVI, MODIS-NDVI and VEGETATION-NDVI composite data using agricultural measurements: An example at corn fields in western Mexico. Environ. Monitor. Assess. 2006, 119, 69–82. [Google Scholar] [CrossRef] [PubMed]
- Gupta, R.K.; Prasad, T.S.; Vijayan, D. Relationship between LAI and NDVI for IRS LISS and Landsat TM bands. Advan. Space Res. 2000, 26, 1047–1050. [Google Scholar] [CrossRef]
- Johnson, L.F. Temporal stability of an NDVI-LAI relationship in a Napa Valley vineyard. Aus. J. Grape Wine Res. 2003, 9, 96–101. [Google Scholar] [CrossRef]
- Wang, Q.; Adiku, S.; Tenhunen, J.; Granier, A. On the relationship of NDVI with leaf area index in a deciduous forest site. Remote Sens. Environ. 2005, 94, 244–255. [Google Scholar] [CrossRef]
- Davi, H.; Soudani, K.; Deckx, T.; Dufrene, E.; Le Dantec, V.; François, C. Estimation of forest leaf area index from SPOT imagery using NDVI distribution over forest stands. Int. J. Remote Sens. 2006, 27, 885–902. [Google Scholar] [CrossRef]
- Fan, L.; Gao, Y.; Brück, H.; Bernhofer, C. Investigating the relationship between NDVI and LAI in semi-arid grassland in Inner Mongolia using in-situ measurements. Theo. Appl. Climatology 2009, 95, 151–156. [Google Scholar] [CrossRef]
- Sellers, P.J. Canopy resistance, photosynthesis and transpiration. Int. J. Remote Sens. 1985, 6, 1335–1372. [Google Scholar] [CrossRef]
- Hassan, Q.K.; Bourque, C.P.-A.; Meng, F.-R.; Richards, W. Spatial mapping of growing degree days: An application of MODIS-based surface temperatures and enhanced vegetation index. J. Appl. Remote Sens. 2007, 1, 013511:1–013511:12. [Google Scholar] [CrossRef]
- Knyazikhin, Y.; Martonchik, J.V.; Myneni, R.B.; Diner, D.J.; Running, S.W. Synergistic algorithm for estimating vegetation canopy leaf area index and fraction of absorbed photosynthetically active radiation from MODIS and MISR data. J. Geophys. Res. 1998, 103, 32257–32276. [Google Scholar] [CrossRef]
- Knyazikhin, Y.; Martonchik, J.V.; Diner, D.J.; Myneni, R.B.; Verstraete, M.; Pinty, B.; Gobron, N. Estimation of vegetation canopy leaf area index and fraction of absorbed photosynthetically active radiation from atmosphere-corrected MISR data. J. Geophys. Res. 1998, 103, 32239–32256. [Google Scholar] [CrossRef]
- Huete, A.R.; Didan, K.; Shimabukuro, Y.E.; Ratana, P.; Saleska, S.R.; Hutyra, L.R.; Yang, W.; Nemani, R.R.; Myneni, R.B. Amazon rainforests green-up with sunlight in dry season. Geophys. Res. Lett. 2006, 33, L06405:1–L06405:4. [Google Scholar] [CrossRef]
- Hassan, Q.K.; Bourque, C.P.-A.; Meng, F.-R. Application of Landsat-7 ETM+ and MODIS products in mapping seasonal accumulation of growing degree days at an enhanced resolution. J. Appl. Remote Sens. 2007, 1, 013539:1–013539:10. [Google Scholar] [CrossRef]
- Gao, F.; Masek, J.; Schwaller, M.; Hall, F. On the blending of the Landsat and MODIS surface reflectance: predicting daily Landsat surface reflectance. IEEE Trans. Geosci. Remote Sens. 2006, 44, 2207–2218. [Google Scholar]
- Zhang, Y. Understanding image fusion. Photogramm. Eng. Remote Sens. 2004, 70, 657–661. [Google Scholar]
- Hassan, Q.K.; Bourque, C.P.-A. Spatiotemporal dynamics of MODIS-based leaf area index in the boreal forest of northern Alberta. In Proceedings of the Canadian Symposium on Remote Sensing, Lethbridge, Alberta, Canada, June 2009.
- Environment Canada. Available online: http://climate.weatheroffice.ec.gc.ca (accessed on 30 November 2009).
- Natural Regions Committee. Natural Regions and Subregions of Alberta; Downing, D.J., Pettapiece, W.W., Eds.; Government of Alberta: Edmonton, Alberta, Canada; Pub. No. T/852; 2006.
- Botkin, D.B. Forest Dynamics: An Ecological Model; Oxford University Press: Cary, NC, USA, 1993. [Google Scholar]
- Botkin, D.B.; Simpson, L.G. The First Statistically Valid Estimate of Biomass for a Large Region. Biogeochemistry 1990, 9, 161–174. [Google Scholar]
© 2010 by the authors; licensee Molecular Diversity Preservation International, Basel, Switzerland. This article is an open-access article distributed under the terms and conditions of the Creative Commons Attribution license (http://creativecommons.org/licenses/by/3.0/).
Share and Cite
Hassan, Q.K.; Bourque, C.P.-A. Spatial Enhancement of MODIS-based Images of Leaf Area Index: Application to the Boreal Forest Region of Northern Alberta, Canada. Remote Sens. 2010, 2, 278-289. https://doi.org/10.3390/rs2010278
Hassan QK, Bourque CP-A. Spatial Enhancement of MODIS-based Images of Leaf Area Index: Application to the Boreal Forest Region of Northern Alberta, Canada. Remote Sensing. 2010; 2(1):278-289. https://doi.org/10.3390/rs2010278
Chicago/Turabian StyleHassan, Quazi K., and Charles P.-A. Bourque. 2010. "Spatial Enhancement of MODIS-based Images of Leaf Area Index: Application to the Boreal Forest Region of Northern Alberta, Canada" Remote Sensing 2, no. 1: 278-289. https://doi.org/10.3390/rs2010278