Article

Assessing Conservation Conditions at La Fortaleza de Kuelap, Peru, Based on Integrated Close-Range Remote Sensing and Near-Surface Geophysics

1
University of Piura, Estacion Cientifica Ramon Mugica, Piura 20009, Peru
2
Centre of Andean Studies, University of Warsaw, 00-927 Warsaw, Poland
3
Department of Earth and Space Sciences, Columbus State University, Columbus, GA 31907, USA
4
Department of Anthropology, Brown University, Providence, RI 02912, USA
5
Laboratory of 3D Scanning and Modeling, Department of History of Architecture, Arts and Technology, Wroclaw University of Science and Technology, 50-370 Wrocław, Poland
6
Ludwig Boltzmann Institute for Archaeological Prospection and Virtual Archaeology, A-1090 Vienna, Austria
7
Department of Environmental Protection and Development, Wrocław University of Environmental and Life Sciences, 50-375 Wrocław, Poland
8
CARETUR Amazonas, Chachapoyas 01001, Peru
9
Terrasolutions Peru, Lima 15086, Peru
10
MEDS Amsterdam, 7556 MZ Hengelo, The Netherlands
11
Proyecto Paisajes Arqueologicos de Chachapoyas, Lima 15036, Peru
*
Author to whom correspondence should be addressed.
Remote Sens. 2024, 16(6), 1053; https://doi.org/10.3390/rs16061053
Submission received: 1 January 2024 / Revised: 17 February 2024 / Accepted: 22 February 2024 / Published: 16 March 2024

Abstract

:
We combined datasets from multiple research projects and remote sensing technologies to evaluate conservation conditions at La Fortaleza de Kuelap, a pre-Hispanic site in Peru that suffered significant damage under heavy seasonal rains in April 2022. To identify the causes of the collapse and where the monument is at further risk, we modeled surface hydrology using a DTM derived from drone LiDAR data, reconstructed a history of collapses, and calculated the volume of the most recent by fusing terrestrial LiDAR and photogrammetric datasets. In addition, we examined subsurface water accumulation with electrical resistivity, reconstructed the stratification of the monument with seismic refraction, and analyzed vegetation loss and ground moisture accumulation using satellite imagery. Our results point to rainwater infiltration as the most significant source of risk for La Fortaleza’s perimeter walls. Combined with other adverse natural conditions and contemporary conservation interventions, this led to the 2022 collapse. Specialists need to consider these factors when tasked with conserving monuments located in comparable high-altitude perhumid environments. This integration of analytical results demonstrates how multi-scalar and multi-instrumental approaches provide comprehensive and timely assessments of conservation needs.

1. Introduction

La Fortaleza de Kuelap is among the most impressive structures ever built by an Indigenous Andean society (Figure 1). Located at 3000 m.a.s.l. in Peru’s northeastern Andean tropical montane rain forests, it consists of an immense walled platform extending 550 m north–south with a maximum width of 150 m. Perimeter walls made of stone blocks, 300–2000 kg each, attain heights of 20 m, enclosing the rocky summit of Cerro La Barreta and an estimated 600,000 m3 of stone and clay fill that supports 5.11 ha. of platform surface [1,2,3]. A settlement of approximately 420 circular stone habitations and five special-purpose buildings is found on top of the platform.
La Fortaleza looms over an extensive pre-Hispanic cultural landscape, the “Kuelap archaeological complex”, where approximately 16 ancient hamlets, mortuary sites, small contemporary settlements, and agricultural infrastructure are spread across 450–500 ha on a sloping plateau overlooking the Utcubamba River valley (Figure 2). Bandelier [4] and Ruiz [2] both estimated a total of approximately 300 dwellings on the plateau, although recent studies may indicate more [5,6].
The importance of Kuelap as cultural heritage site is unquestioned. Along with seven contemporaneous sites (Figure 3), it is included on Peru’s Tentative List of World Heritage Sites, as emblematic of the pre-Hispanic Chachapoyas culture. Kuelap is judged as outstanding because it represents an astonishing and singular achievement. Further, La Fortaleza’s circular dwellings unite many design elements that characterize the architectural style for which the region is known [7]. As a tourist destination, Kuelap has been marketed as a “second Machu Picchu”. In 2017, the country’s first cable car was installed to afford rapid access from Nuevo Tingo [8] and visits boomed. Yet, as criticism mounted over the conditions of La Fortaleza, particularly the main entrance (Acceso 1), visitor numbers fell in 2019 just prior to the temporary closure brought about by COVID-19. The downward trend raised questions about the long-term sustainability of increasing tourism at the site.
Today, this seemingly invulnerable monument faces a crisis. Between April 10th and 11th, 2022, at the peak of the region’s heavy rainy season, several collapses brought down a large section of its southern perimeter wall. Our research suggests that this was not an isolated event—that the site has a long history of collapses since pre-Hispanic times. A substantial, yet poorly documented collapse also occurred along the eastern perimeter wall on 31 March 2013, leading to an aborted restoration project that today is represented by a large, unfilled excavation area near Acceso 1 and mounds of exhumed construction fill nearby. According to government reports, conservation conditions at La Fortaleza continued to worsen thereafter. Two earthquakes struck the region on 28 November 2021 (7.5 magnitude) and 3 February 2022 (6.5 magnitude). Mounting evidence of structural instability prompted authorities to declare La Fortaleza in emergency on 12 February 2022. Weeks later, the collapse of its southern perimeter wall precipitated the current crisis. Conservators advised that the structural deterioration and the threat of additional collapses required a pause in tourism at La Fortaleza. Because it is the primary tourist attraction in the region, this unavoidable decision resulted in substantial financial losses for the local and regional service economies.
To stabilize La Fortaleza and resume visits, the Peruvian government implemented emergency conservation measures, with three goals: (1) preventing additional collapses and mitigating structural deterioration, (2) evaluating water retention and drainage, and (3) identifying the causes of structural failures. Our goal has been to support these efforts by identifying the causes of deterioration, including a hydrological evaluation. Because of the site’s complete closure for several months after the collapse, this study focuses on systematic analysis of available remote sensing data, followed by ground-truthing after the site reopened. Specifically, we evaluate the hypothesis that the underlying cause of the collapse has been the increasing retention of moisture within the platform’s subsurface construction fill, and pooling behind the perimeter walls [9,10,11]. Here we present a hydrological analysis of the site surface, based on a Digital Terrain Model (DTM) generated from airborne LiDAR. We then integrate that model with the results of ERT surveys that identify pockets of high humidity inside the fill, producing a risk map of La Fortaleza. Our combined analyses demonstrate the potential of integrating data acquired using near-surface geophysics and close-range remote sensing technologies to produce a more complete, precise, and nuanced understanding of the risks that threaten this monument.

1.1. The Land and the Climate

La Fortaleza is situated at UTM 18S 176537 E 9289675 N in Anexo Kuelap, Tingo District, Luya Province, near the southern boundary of the Amazonas region. Cerro Barreta is part of the Calla Calla Mountain range, which trends north–south between the Marañon River to the west and the Utcubamba River to the east, as it descends 120 linear km north–northeast. The Utcubamba trends in the same direction and feeds the Marañon River where it breaks through the Andes and begins its curve eastward into the Amazon. The geology of the Calla Calla range is primarily limestone and characterized by karst features such as sinkholes and caverns. Surrounding Kuelap, the tropical Andean cloud forests and steep mountain terrain are spectacular, yet while the landscape may seem benign and majestic on sunny days, it is also subject to furious rain and hailstorms, which arrive with little notice and with greater intensity during the rainy season between October and May. Storms are most violent (and dangerous) above 2500 m.a.s.l., where they frequently produce flash floods, trigger landslides, and impede travel. The tree line forests are also called Ceja de Selva (the “eyebrow” of the Tropical Forest”) because they lie at the highland rim of the Amazon basin. Steep topography and variable weather patterns produce a diverse mosaic of ecological zones, including at least 84 of the 103 life zones in the Holdridge life zone biogeographic classification system [12]. These include high-altitude grasslands (paramo/jalca), humid and perhumid tropical montane forests, and arid thorn forests found in low-altitude rain shadows. Broken terrain thwarts connectivity, and high levels of species endemism render the region a biodiversity hotspot [13].
At Kuelap, mean annual temperatures range from 7 to 15 °C. Rainfall numbers from weather stations represent only vertical rainfall, excluding considerable additional moisture contributed by forest vegetation through transpiration. As a result, area humidity and annual precipitation are underestimated. A reasonable estimate may be 2500–3500 mm yearly, at least between extreme events [14]. Abundant precipitation along the eastern Andean cordillera results from orogenic lift, as moisture-laden winds cross the Amazon basin and encounter the eastern Andean slopes. Condensation above 2500 m.a.s.l. generates an altitudinal fog belt where the cloud forest formation is sustained as transpiration of vegetation exceeds evaporation [15]. The same dense clouds flow into the Utcubamba and Marañón river valleys, enveloping Kuelap and mountaintops to its north and south. Deforestation eliminates the key variable of transpiration, and cloud forests deteriorate as they dry up. Such conditions may result in drought and endangerment of species, unable to keep pace with biogeographical change, especially at tree lines [16].
Traces of terraces now exposed and visible in many parts of the Utcubamba valley attest to ancient deforestation for agriculture. Paleoecological evidence from lake sediment samples indicates human occupation in and adjacent to Chachapoyas prior to 4000 BCE and maize cultivation by 2200 BCE [17], while more direct radiocarbon evidence from the pre-Hispanic site of Lamud Urco attests to human occupation by 1500 BCE [18]. Archaeologists have recovered numerous 14C dates pointing to widespread occupation after 1 CE [19,20], but the few systematic multiregional surveys may show sampling bias.
Records of environmental change attest to substantial variation during Kuelap’s occupation. Precipitation oscillations observed in speleothems retrieved from the lower northeastern Andean slopes show signals of more humid conditions during the peak of the Medieval Climate Anomaly by 950 CE. Drier conditions prevailed ca. 1300 CE with the beginning of the Little Ice Age [21]. Such periodic short- and long-term wet and dry periods provoked shifts in human settlement and mobility [22], as changes in moisture levels altered natural resource distribution and locations where agriculture was feasible.
The first Spanish chronicler to write an eye-witness description of the Utcubamba valley was Carmelite Friar Antonio Vasquez de Espinoza, who visited in 1615 [23]. By that time, the greater region had experienced an Indigenous population collapse, much of it due to conflict and disease [24]. The friar observed that the province was “heavily wooded”. Vazquez de Espinosa’s description ca. 84 years after the Spanish incursion illustrates the rapid tempo of population collapse and regrowth of forests on terrain previously cultivated. Regional population numbers did not rebound until the 19th century, likely initiating a trend towards deforestation.
Today, climate change impacts both landscapes and livelihoods. Weather events are expected to intensify. Climatological studies document increasing temperature and rainfall in this part of Peru over the past 50 years, with trends varying seasonally and by metric [25]. Interdisciplinary studies are documenting the upward migration of the cloud belt and its consequences [26,27]. Highland farmers are already struggling to schedule their planting and harvest seasons as weather patterns become less predictable.

1.2. Kuelap and Chachapoyas: Cultural Contexts

Today, people habitually use the name “Kuelap” when referring to La Fortaleza, the official designation of one sector within the Kuelap archaeological complex. As the most prominent and imposing monumental construction visible from much of the Utcubamba valley, La Fortaleza has become emblematic of the Chachapoyas ethnohistorical and archaeological “culture area”. The scale of La Fortaleza’s perimeter walls is the most obvious of numerous architectural attributes that set it apart from other pre-Hispanic sites in the region. Also unique is the diversity of mortuary styles and traditions present—cists under house floors, above-ground open structures (chullpas), burials in La Fortaleza’s walls, and cliff tombs in Cerro Barreta. The dispersed, uninterred skeletal remains of at least 106 victims of a mass killing were uncovered by archaeologists in 2007 at the south end of La Fortaleza [28,29]. Special structures are found at each end of the site—in the south, both Templo Mayor and Plataforma Circular are associated with ritual activities; in the north, the Torreon provides a relatively high vantage point (Figure 4). The central and southern areas of the settlement on La Fortaleza comprise Pueblo Bajo, while the northern sector, Pueblo Alto, is separated by another high stone wall and can only be approached through restricted access points. Excavations by Ruiz [2] revealed Inka modifications, including the placement of a long, multi-doored feasting hall (typically called a kallanka). Another, smaller kallanka lies at the south end, near Templo mayor. South of the so-called ritual precinct, a lower area referred to as “Las Terrazas” will figure in our discussions below.
Pre-Hispanic Chachapoyas was comprised of numerous large and small autonomous societies identified by distinctive material patterning, most readily seen in shared architectural attributes, although close inspection of material culture reveals marked variability at local levels [30]. Guengerich [7] and VanValkenburgh et al. [3] point out that Kuelap is the most intensively studied pre-Hispanic site in the Chachapoyas area. One popular narrative suggests that Kuelap was a political center that dominated the entire northeastern Peruvian Andes since 500 CE, but other archaeologists working in the region point to lack of evidence that the site was the “capital” of a pre-Hispanic unified state or proto-state [31,32]. Guengerich maintains that data bearing on problems as basic as site chronology have yet to be published by archaeologists who directed the most recent investigations and conservation at the monument, and she rejects interpretations of regional sociopolitical unity based on documented architectural variability [30].
Despite its singular appearance, La Fortaleza shares elements with hundreds of other Chachapoya settlements, large and small, throughout the middle and upper Utcubamba watershed (Figure 3). Other pre-Hispanic settlements feature ridge-top locations, circular structures built on platforms accessed by stairs and cantilever walkways, decoration with structurally incorporated embellishments such as bas relief slabs with carved heads, geometric friezes using inlaid stone slabs, and niches. Defensive affordances (including restricted access points, left-turning baffled entrances, and hidden stairways) are not uncommon among large and complex regional settlements during the Late Intermediate Period (1100–1450 CE). The settlement atop La Fortaleza is large, but no larger than Purumllacta de Soloco, La Joya [7,30,33], and other large sites on the slopes overlooking the Utcubamba River. Some of La Fortaleza’s friezes are impressive, but its structures are in themselves neither larger nor more elaborate than those found at other sites in the valley. In addition, research near Kuelap suggests that leveling and filling were relatively common forms of landscape modeling [3].
These interpretations do not diminish Kuelap’s prominent role in multi-community rituals, to judge by exotic offerings at El Tintero (now called the Templo Mayor) [34] and mortuary variability at the site [29]. The number of high-value, exotic artifacts as well as the variety of mortuary practices are so far unmatched in the middle Utcubamba region. The great diversity of mortuary traditions from distant areas north and south supports the interpretation that Kuelap was a center for ritual practice. Guengerich argues that, throughout Chachapoyas, the range of quality and elaboration of house constructions correspond to status differences and differential abilities of their owners to muster sufficient labor and other resources [35]. By this criterion, status differences among La Fortaleza’s residents are reflected in house size, quality, and location. Pueblo Alto appears to be a locality corresponding to higher status.
In the centuries prior to the Inka invasion, Chachapoyas can be considered a borderland, crossroads, and nexus of interactions between the adjacent highlands and lowlands with as early a pre-Hispanic history as other Andean regions. Published archaeological data attest to human occupation in the Utcubamba at least by the Initial Period (1800–1000 BCE). The name “Chachapoyas”, an eponymous label applied by the Inka and maintained during the colonial period, was the largest of the Inka provinces created for governance. Lerche [36] estimated a regional population of 300,000 to 500,000 individuals before the Inka invasion. The regional population is genetically unique according to recent studies that suggest long-term autochthony for local Indigenous peoples and genetic distance from highland and lowland populations to the west and east, respectively. Genomic mixing is evident and can be explained with reference to late pre-Hispanic incursions, conquests, and immigration [37,38,39]. Linguistically, non-Quechua family and place names preserve elements of a substrate of pre-Inka local language(s) that are being reconstructed and used to hypothesize affiliations with other language groups and families [40,41,42,43,44].
Archaeological sites across Chachapoyas have become the most informative archives of the region’s sociopolitical history before the Inka invasion. Some of the largest, such as Olan, Yalape, and La Xalca (also La Jalca), lie on the eastern Utcubamba slopes facing Kuelap and do not show evidence of fortification, yet consist of 300–500 dwellings. Perhaps we need to ask not only, “What was Kuelap”, but “Why was Kuelap?” This question must be posed if construction of the monument’s southern end was completed by 500–600 CE as Narvaez contends, based on unpublished radiocarbon dates [32,45]. What forces would underlie the investment in, and mobilization of, that much labor? Archaeological evidence, especially contemporaneous 14C dates recovered elsewhere in the Utcubamba watershed [46] (Table 1, p. 318), supports the argument that social groups at that time were smaller and more mobile than those of the Late Intermediate Period builders of the best-known monumental settlements.
Close reading of several early historical and ethnohistorical analyses combine to support the likelihood that societies living on the eastern and western slopes above the Utcubamba maintained a mutually antagonistic relationship. On the cusp of the Inka incursion, Chillaos societies settled on the Calla Calla range reportedly contributed thousands of warriors in support of Inka Huascar’s failed military campaign against his rival Atahualpa [47]. Societies settled on the opposite slope above the Utcubamba, consistently referred to as “Chacha”, were sworn enemies of the Inka [36,48].
Was La Fortaleza a fortress? Narvaez refers to it as a “fortified city” [49]. Bradley [50] was the first to present a substantial rebuttal to this notion. La Fortaleza does not meet published criteria for the definition of an Andean fortification [51,52] or standardized Western definitions [53]. The settlement on top of La Fortaleza does not meet the criteria set out for qualification as a pre-Columbian city by Hardoy [54]. The current literature presents a vision of Kuelap’s history and functions that leaves open the question of whether the site was a fortress designed to keep enemy groups out, or to draw people in to participate in rituals conducted to integrate surrounding societies—or both. It is probably significant that the most conspicuous and impressive side of the monument faces eastward and is visible from virtually all major pre-Hispanic settlements on the opposite slope of the Utcubamba valley. Still, while we can suggest that La Fortaleza maintained a defensive posture, the builders’ intentions remain uncertain.

2. Materials

This study draws on data collected by various research teams (Figure 5). We present, in as much detail as possible, these data´s sources, and methods of acquisition and processing.

2.1. Background Information on the Site

This study draws upon various sources for comprehensive insight: first, publications by late 19th and early 20th century visitors who show a preoccupation with the conservation of Kuelap, particularly its connection to vegetation [4,55,56,57,58,59,60,61,62,63]; second, excavation reports published by Reichlen and Reichlen [62] and Ruiz Estrada [2] and available excavation and conservation information produced under Narváez’s directorship [32,34]; third, information offered by inhabitants in the vicinity of La Fortaleza who have worked on excavation and conservation projects at the site since 1985 [64]; fourth, government documents reporting the state of conservation of site sectors. Readings from fissurometers (crack detectors) collected since 2017 are especially important [64]. While they do not inform about the deformation of the whole structure, they can provide useful insights into development over time and the current stages of displacement cycles at certain places.

2.2. Maps of the Site

Early visitors created the first maps [4]. In the 1980–2000s, teams led by Narváez created topographic maps using theodolites and total stations [32,45]. The maps were updated in 2009 and in 2015 by COPESCO. Their detail and accuracy are similar; both use the UTM projection (Zone 18S) and datum (WGS 1984). The instruments of the time required that every survey point be individually recorded, sometimes by hand, and the maps are thus schematic and lacking the spatial resolution to capture all the idiosyncrasies of the site’s structures, including the positions of individual stones within walls.

2.3. Terrestrial Laser Scanning (TLS)

Before the 2022 collapse, portions of La Fortaleza were scanned using terrestrial LiDAR (TLS), with high point densities well suited for documenting the vertical surfaces of standing architecture. Fortunately, in October 2019, Kucera, Van Valkenburgh, and Rojas captured the portion of the perimeter wall that collapsed in 2022 with a Riegl VZ-2000 (RIEGL LMS) provided by the Peruvian company COTECMI (Miraflores, Peru) (Figure 6). Based on the technical parameters of the instrument, one might expect the best 3D accuracy of the resulting point cloud to be 3 mm at a 50 m distance for each scan position. However, the actual accuracy may be slightly higher, attributable to the alignment of the scan positions and varying temperature, air pressure, and humidity. The applied angular resolution of 40 mdeg guarantees approximately 50 points/cm2 of average point density at the areas of interest (i.e., approximately up to 20 m in every direction off the path along which the scanner was placed, with each scan position separated by less than 15 m). In three days, 250 scans were recorded, starting in the southern end, following the visitor´s path along the western perimeter wall, entering La Fortaleza via Accesso 3, continuing to Pueblo Alto, and ending in the central sector.

2.4. Airborne Laser Scanning (ALS)

The first available LiDAR 3D point cloud was acquired in August 2018 by VanValkenburgh and colleagues using a Velodyne VLP-32 puck mounted on a DJI Matrice 600 Pro commercial hexacopter drone [3]. The second was captured by Righetti et al. [6,65] in November 2019 using the Riegl VUX-1 sensor on a GEOX 7 hexacopter drone from Robotic Air Systems.

2.5. Digital Photogrammetry

We analyzed data from three UAV-based photogrammetric surveys conducted after the 2022 collapse. On April 12th, Roger Vigo used a DJI Mavic Mini 2, with a 1/2.3″ CMOS sensor and 24 mm (35 mm format equivalent) lens that produces 4000 × 2250 size images. On April 30th, Napoleon Vargas flew a DJI Mavic Air equipped with a 1/2.3″ CMOS sensor and a 24 mm (35 mm equivalent) lens that produces 4056 × 3040 size images. Both surveys recorded the collapsed area on the southeastern corner of the site before it was sheltered with protective roofing. On June 14th, 2022, Ghezzi and Contreras used a DJI Phantom 3 equipped with a Sony EXMOR 1/2.3″ CMOS sensor and a 20 mm (35 mm equivalent) lens to produce 4000 × 3000 size images of the southeastern corner of the site. These surveys produced data suitable for IBM models of the collapse (Figure 7).

2.6. Satellite Data

Two types of publicly available satellite data were used in this study. The first type was historical, with high-resolution RGB imaging (8192 × 4897 pixels). Images from July 2005 to June 2022 were selected as best illustrating changes in the vegetation cover of La Fortaleza. We also collected two years of cloudless Normalized Difference Water Index (NDWI) images from the Sentinel-2 L2A satellite numbering 11 images for 2021 and 10 for 2022. NDWI is used to monitor changes related to water content in bodies of water. Sentinel-2 data are calculated according to the equation NDWI = (NIR − MIR)/(NIR + MIR), where: NIR—is Near Infrared band 8, and MIR—is Mid-Infrared band 12. The intervals between the individual images range from 2 weeks to 2 months. These were used to monitor seasonal and annual changes in ground moisture.

2.7. Electrical Resistivity Tomography (ERT), Vertical Electrical Soundings (VES), and Seismic Refraction (SR)

This study integrates near-surface geophysics surveys using ERT, VES, and SR. In 2019, Barriga carried out a resistivity survey around Acceso 1 [66], using the Syscal Pro resistivity meter with a multichannel pole–dipole electrode arrangement for 10 ERT transects and Schlumberger arrangements for 11 VES [67]. In 2021, Mori carried out 3 longitudinal and 10 transversal ERT profiles (Figure 8) atop La Fortaleza [9] using the ARES I 850W resistivity meter. Given its high sensitivity, and good contact with the ground, he chose a dipole–dipole array which is a suitable option when horizontal resolution and coverage are important [68]. He used the software RES2DINV for the processing of data, employing the least squares inversion technique with a smoothing constraint to produce quantitative two-dimensional resistivity subsurface models or sections. In 2022, ALEPH laid out 2 longitudinal and 18 transverse ERT profiles (Figure 8), and 27 VES with a Schlumberger Symmetric Linear tetra-electrode configuration [69].
In 2023, Mori developed a geoseismic profile of La Fortaleza by recording with an array of geophone sensors the variations in the velocity of primary compression waves generated by 40 SR lines, evenly divided between 50 m and 100 m arrays [70] (Supplementary Materials). This technique, used to interpret the depth and composition of soils and rocks, allowed him to characterize subsurface geological conditions and stratification, and subsequently to model the bedrock and estimate the volume of the construction fill.
The results of these geophysical surveys are consistent with, and complementary to, each other, and their reports contain valuable observations on the geological structure and hydrological conditions of the site. These observations are important elements for analyzing the mechanisms of damage to the monument’s perimeter walls. Due to the diverse quality of the graphics available, the illustrations of further analyses of geophysical results in this study are based on the data from Mori.

3. Methodology of the Study and Applied Methods

Because of La Fortaleza´s prolonged closure after the collapse, we evaluated our hypothesis by focusing on the systematic analysis of the aforementioned remote sensing datasets. Hence, our methodology and applied methods were organized to answer two fundamental questions: 1. Is there correspondence between surface rainwater runoff and soil moisture?; and 2. If so, which features of the terrain micro-landscape pose the greatest threats, and specifically where do these threats occur?
Our research process has followed seven steps: (1) primary data gathering; (2) primary data preprocessing; (3) evaluation of the processed data; (4) data postprocessing; (5) analyses; (6) valuation; (7) synthesis of results. The last step produces the data that will constitute thematic layers on a proposed Kuelap GIS, a prerequisite for implementing a comprehensive solution to La Fortaleza´s conservation problems. Next, we will discuss key areas to address the two fundamental questions posed above. The general logic of these studies, data flow, and applied methods, are synthesized in the diagrams at the beginning of each subsection.

3.1. The General Plan of the Site

An accurate and detailed plan is the primary study material on a heritage site. It is particularly important in the event of conservation threats, and yet more so for a tentative World Heritage site. In the existing plan, the location, shape, and even existence of individual buildings differ significantly from the reality observed in the published LiDAR survey [3]. The discrepancies, and the results of recent LiDAR surveys [71,72], highlights the urgent need of a more accurate plan. In the base layer of the Kuelap GIS, all interested parties might deposit their products (Figure 9). Recent advances in the fusion of digital photogrammetry and TLS data offered by Metashape 2.0.4 [73,74] will facilitate an integration with detailed “stone by stone” drawings, as practiced by Kościuk [75] (pp. 11–15), [76] (Volume 92, plates IX-XIa-b, XII-XVIII).

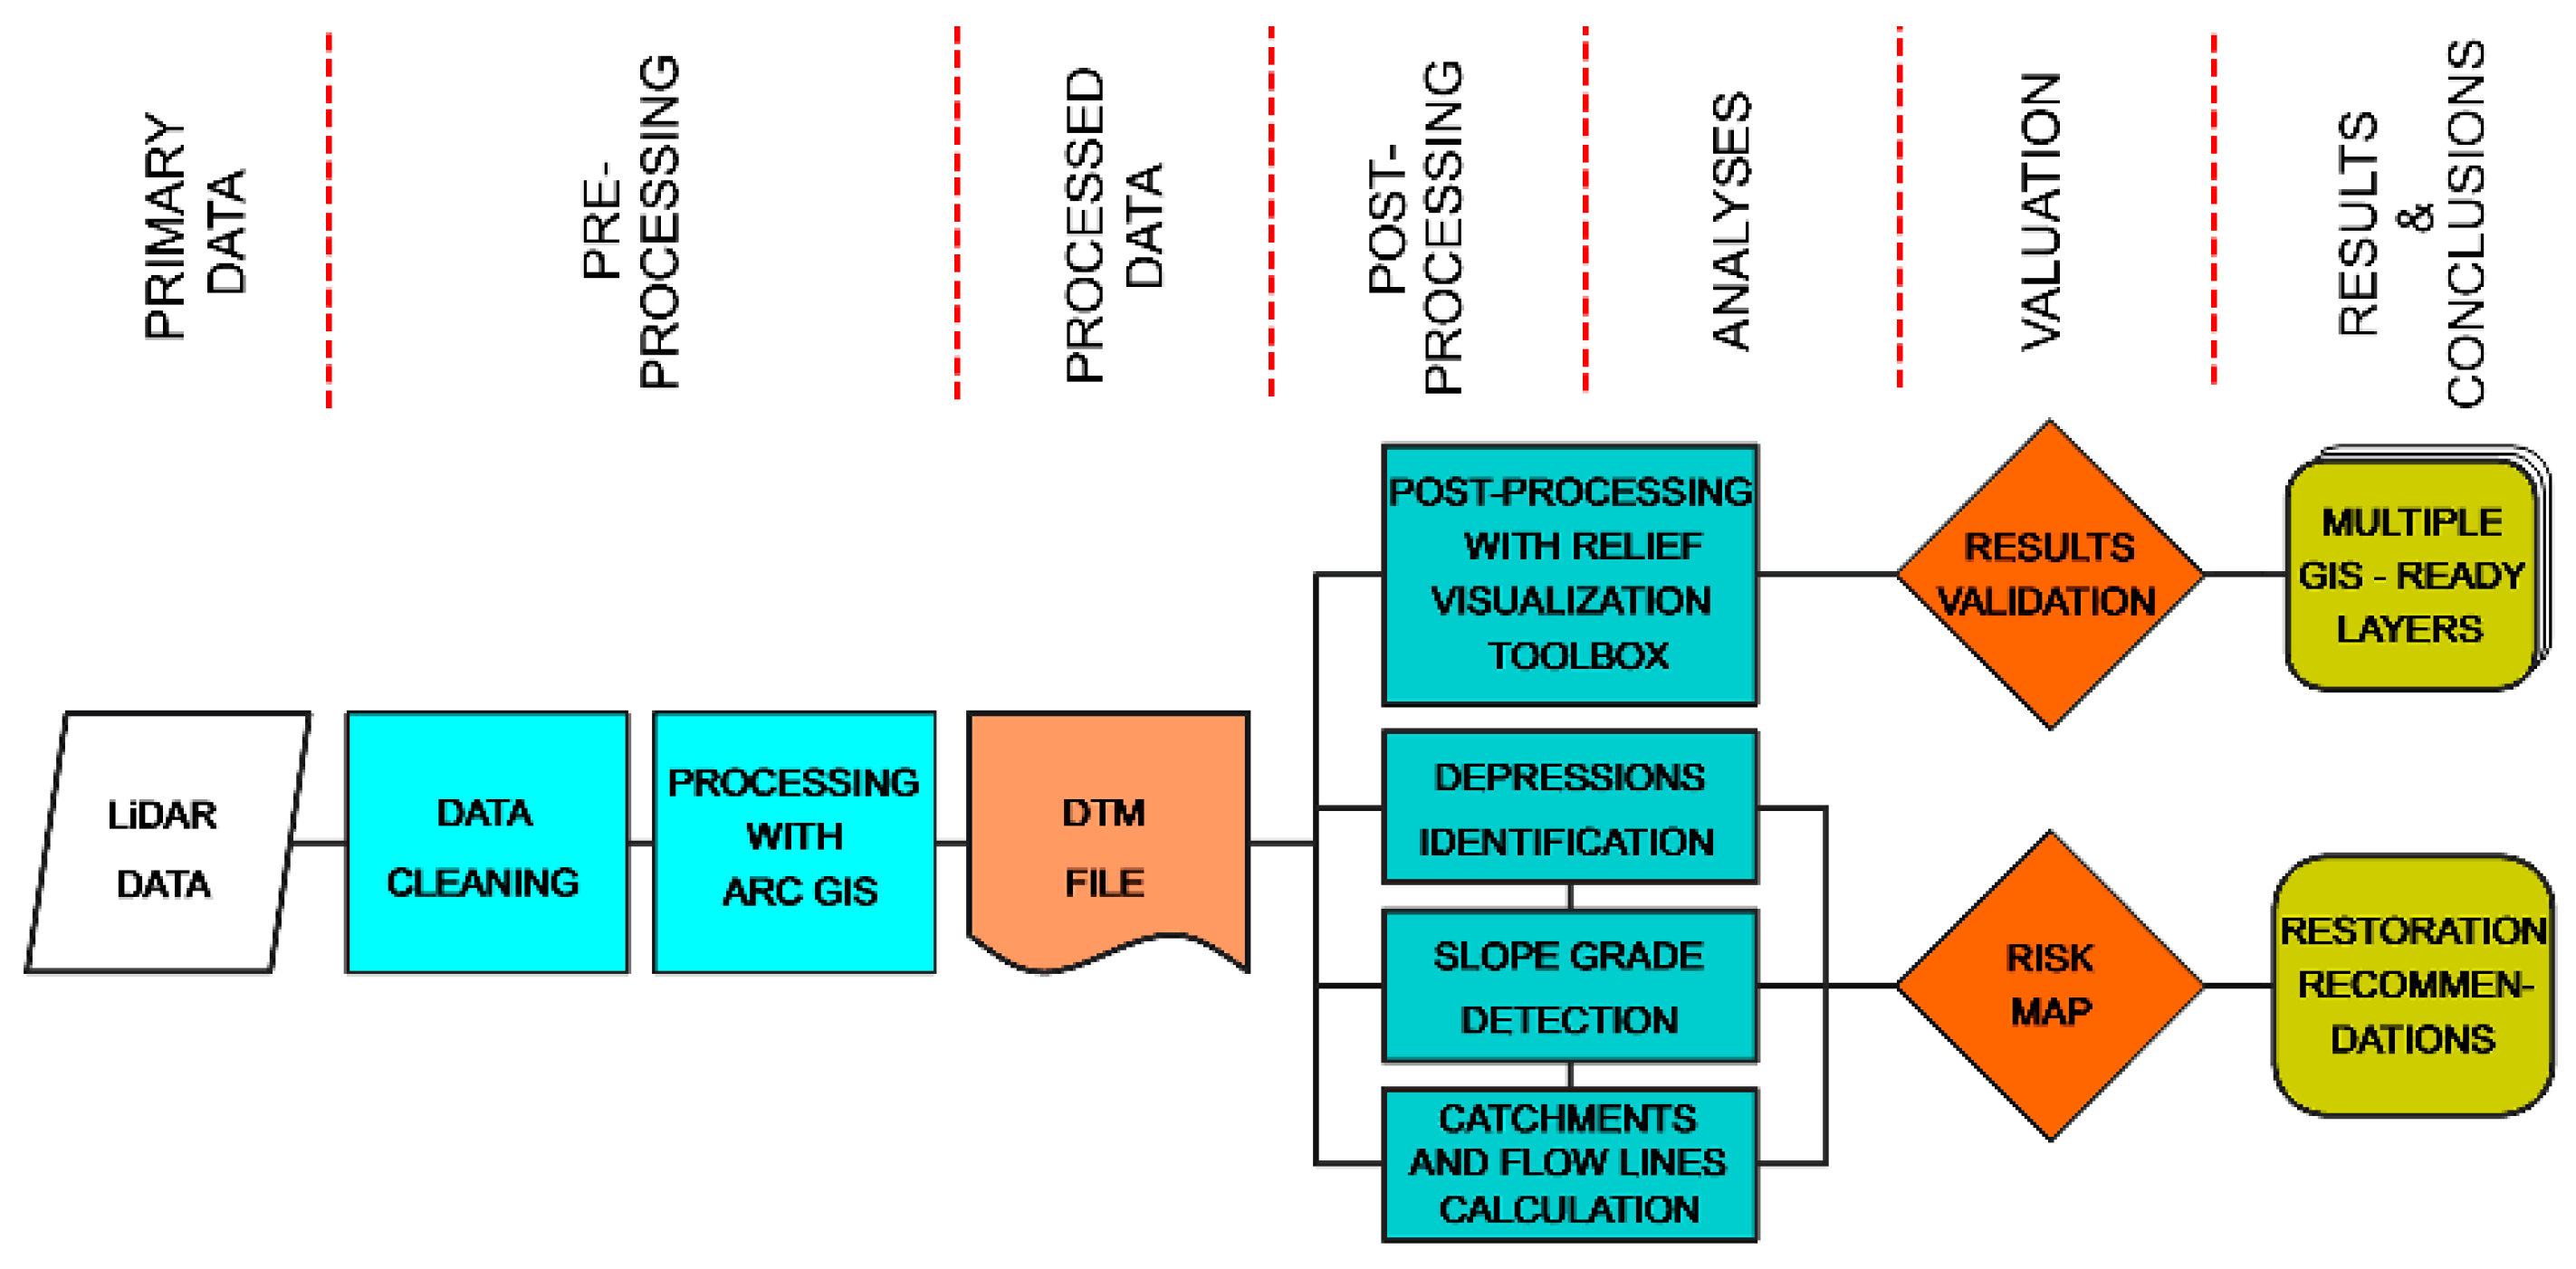
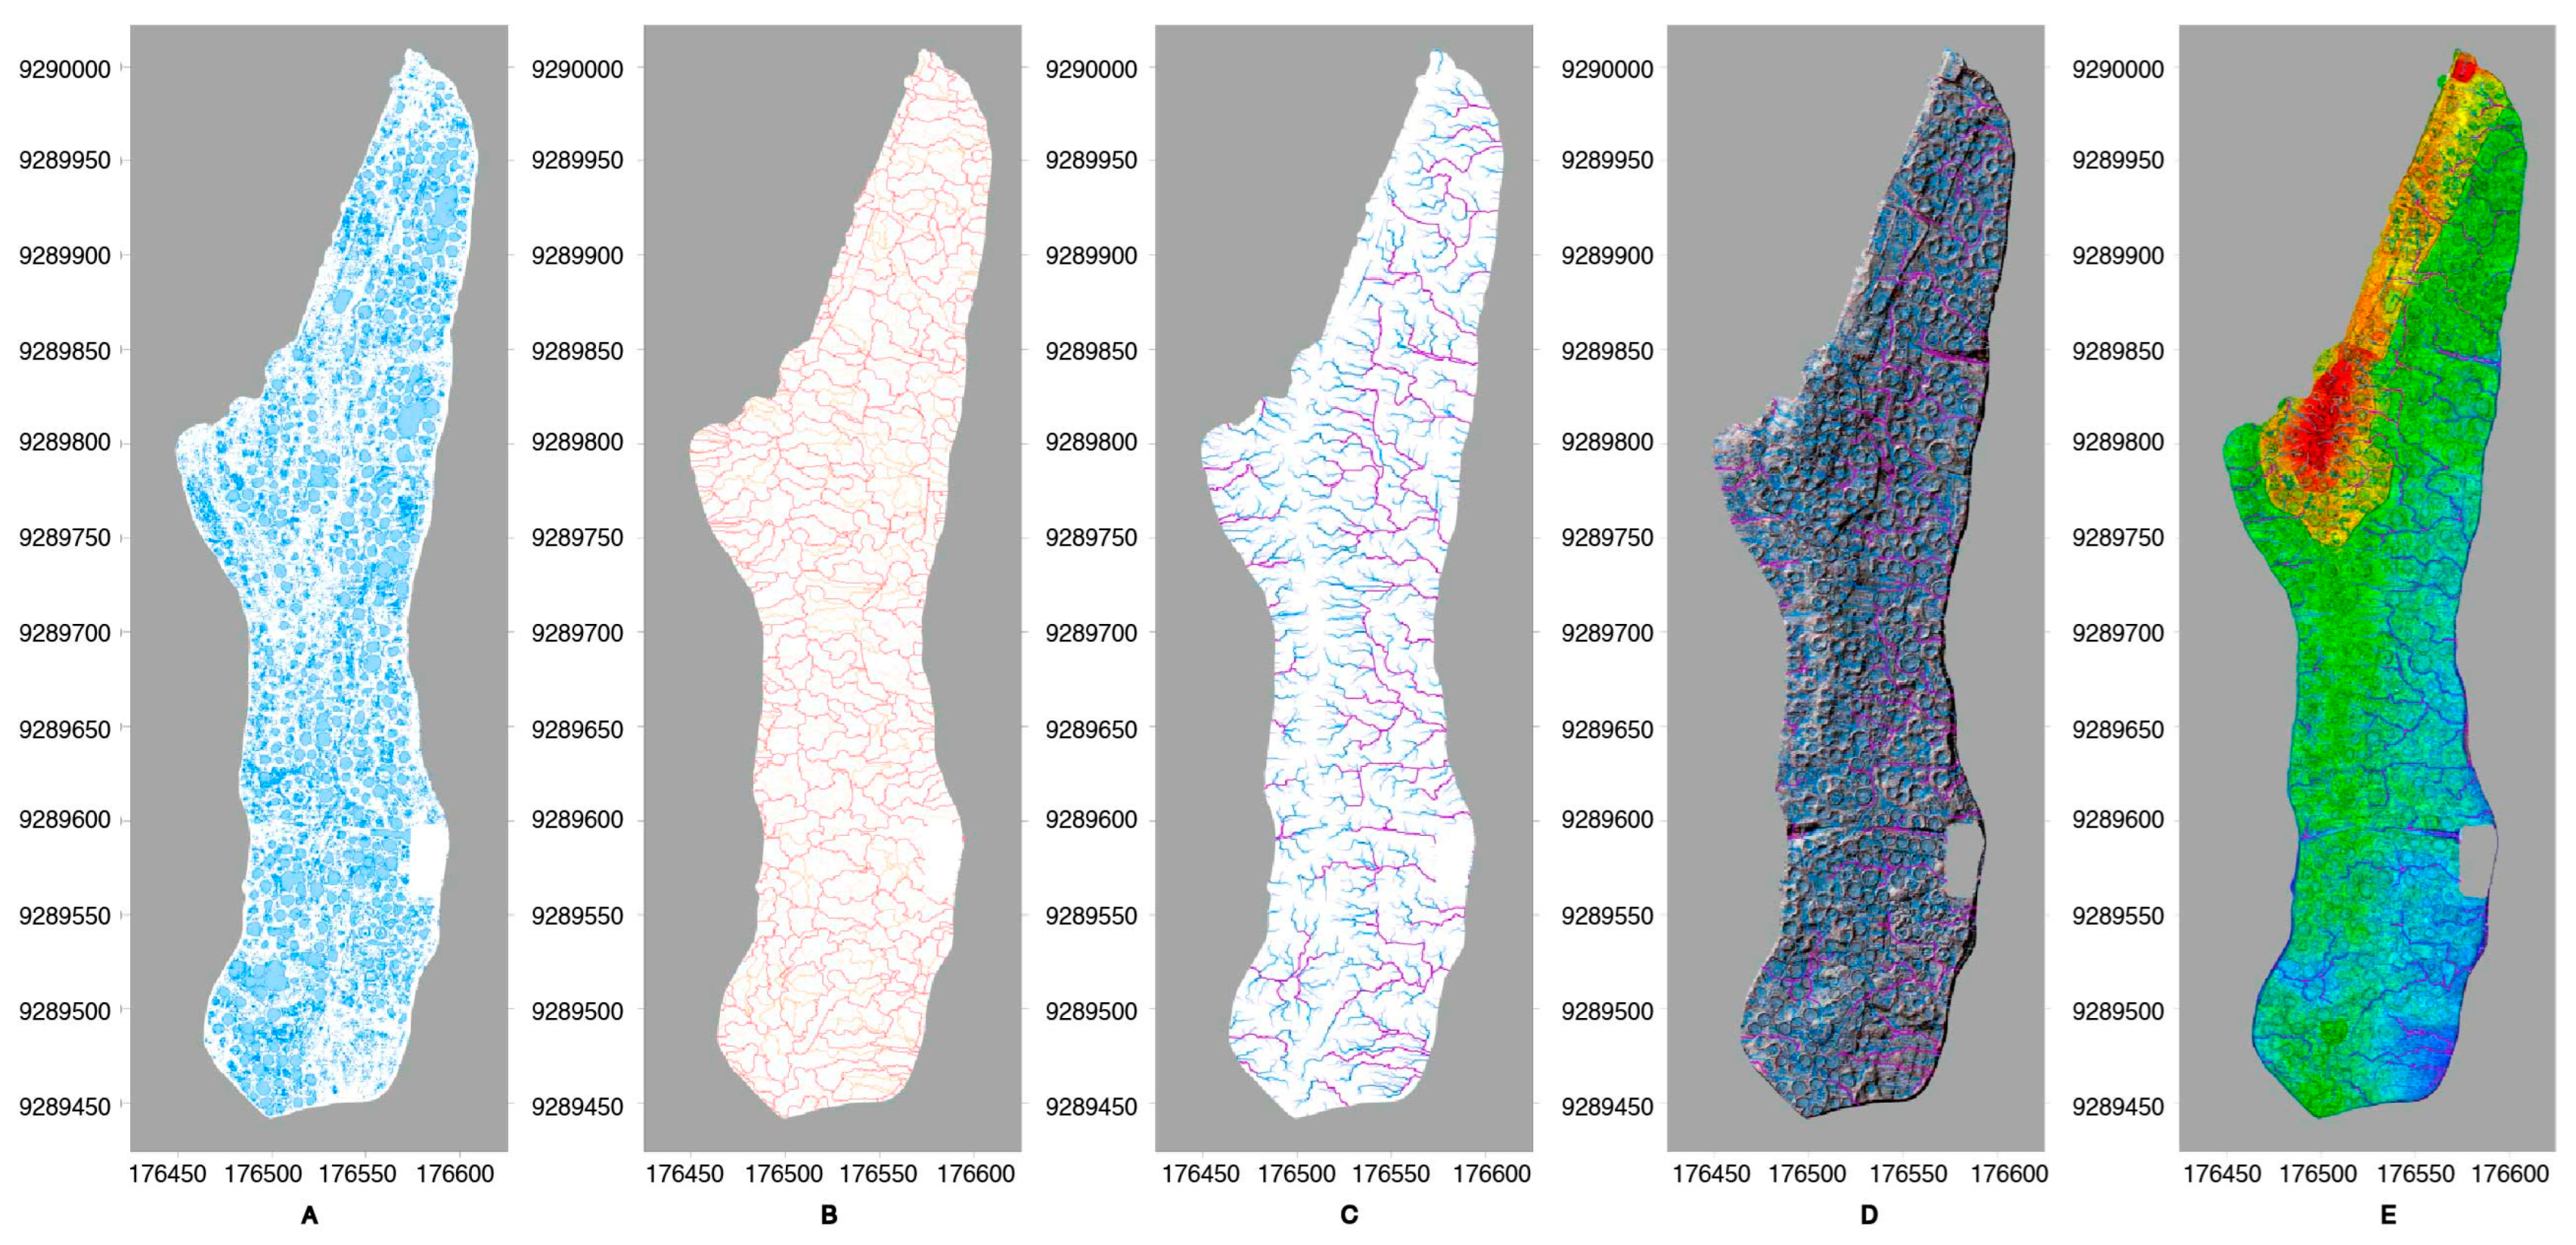
3.2. LiDAR Data Visualization and Hydrological Analysis

Our source for analyzing La Fortaleza was the data collected during the LiDAR survey by MEDS. Primary data filtering and classification were conducted with MEDS proprietary software ATLAS 1.3.7 2019 (Figure 10). The data, in *.las format, were categorized as: “never classified” (mostly high vegetation, but also relics of vertical and sloping walls), “ground”, and “low vegetation” as described by Righetti et al. [6,65]. However, in a terrain characterized by nearly indistinguishable clumps of vegetation and walls with varying degrees of damage, a reclassification was required and mostly executed automatically in Cyclone 3DR v. 2023.1, but manually in some instances. Two additional classes were introduced: “ground and architecture” and “vegetation on walls”. These interventions were limited to the following cases: automatically filtrating vertical and sloping walls, and moving them from the “never classified” class to the “ground and architecture” class; manually selecting previously unfiltered vegetation clumps and moving them from the “ground” class to the “low vegetation” class; manually selecting vegetation growing on vertical and sloping walls and moving it from the “ground and architecture” class to the new “vegetation on walls” class; and in a few instances, moving parts of the “low vegetation” class which may represent the slopes and tops of circular features where relics of round buildings are buried to “ground and architecture”.
The final 3D cloud in *.las format (WGS 1984 UTM Zone 18S), consisting only of the “ground and architecture” class, was used in the ArcMap v.10.6 software function “Las Data Set To Raster Conversion Tool” to generate a 10 cm resolution DTM file representing the bare ground surface and building remains. The steps to obtain the most detailed terrain maps as input data for the development of hydrological and risk maps are described in the next section, while the whole methodology is presented in Figure 11.

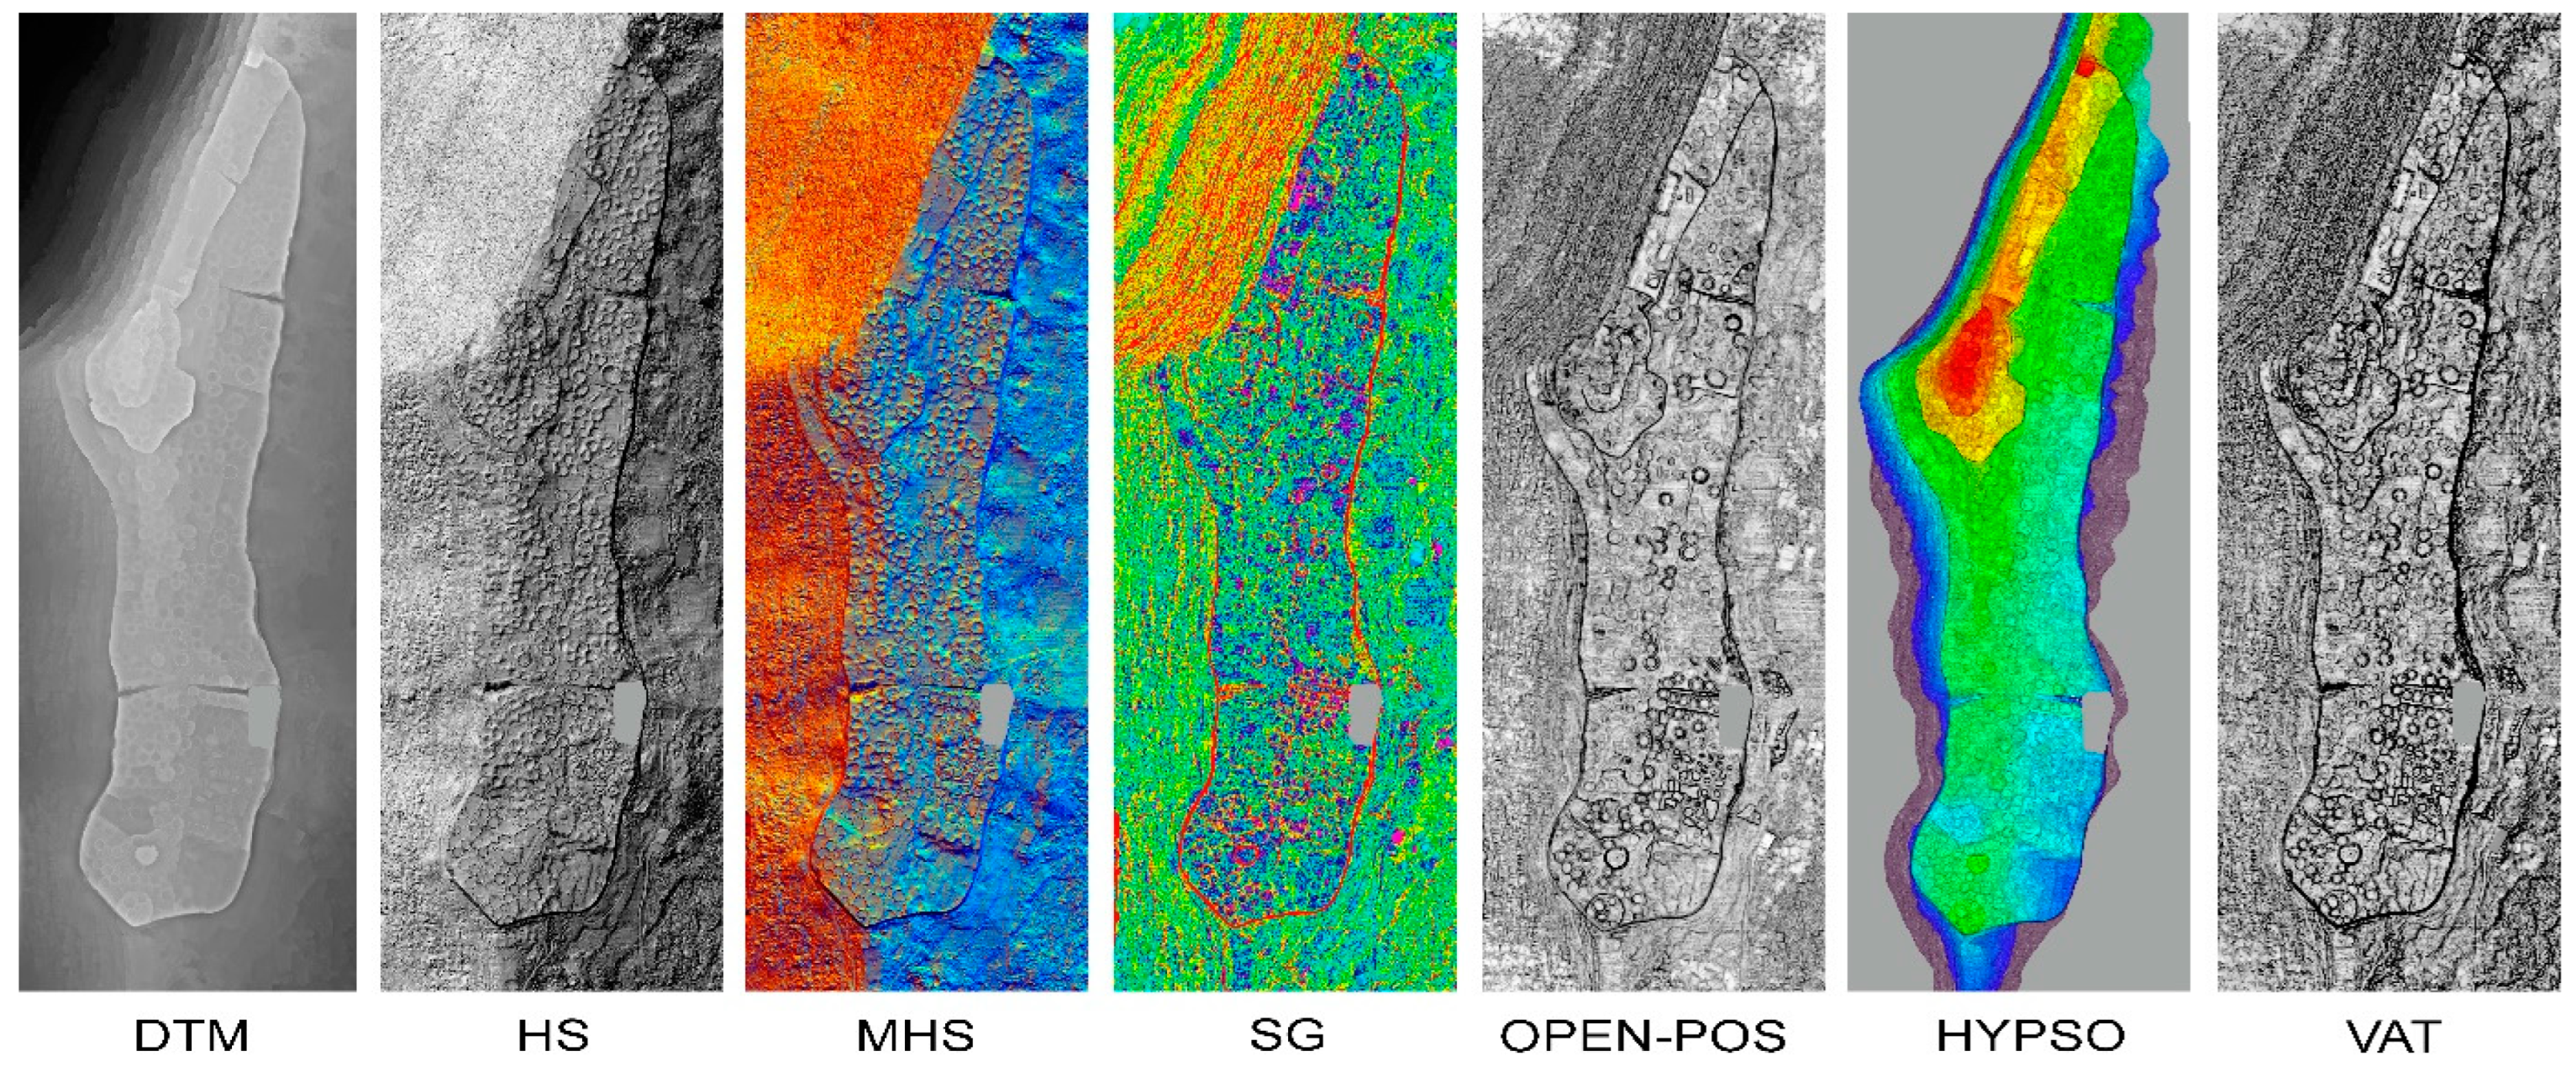
3.2.1. DTM Postprocessing with Relief Visualization Tool Box (RTV)

We used postprocessing tools for detecting La Fortaleza’s buildings and archaeological features, specifically the Relief Visualization Toolbox v.2.0 [77], an application to further process the DTM. The choice of analytical tools included: Unidirectional hill-shading [78] (p. 41), Multidirectional hill-shading up to 64 azimuth directions, Principal Component Analysis of hill-shading [79] (p. 472), Slope gradient [80] (p. 47); [81] (p. 285), Simple local relief model, Sky-View factor, and Anisotropic Sky-View factor [82] (p. 402); [77], Openness (negative and positive), Sky illumination [83], and Local dominance. Because of the diversity of the features in the DTM, deciding which visualization modes will effectively detect and emphasize the desired features [84] (p. 288), [80] (p. 47) requires the analyst to experiment with different algorithms and settings. In our case, the most effective visualization modes are illustrated in Figure 12. Each represents different aspects and features of the terrain. Important additional data that characterize the area are supplied by hypsometry (Figure 12 HYPSO). However, the most detailed information was obtained using a Mixer mode, allowing the combination (with a degree of transparency) of up to five different visualization modes (Figure 12 VAT). The resulting images were used as thematic layers in the GIS system and as raster references in CAD projects, providing different backgrounds against which individual problems can be analyzed.

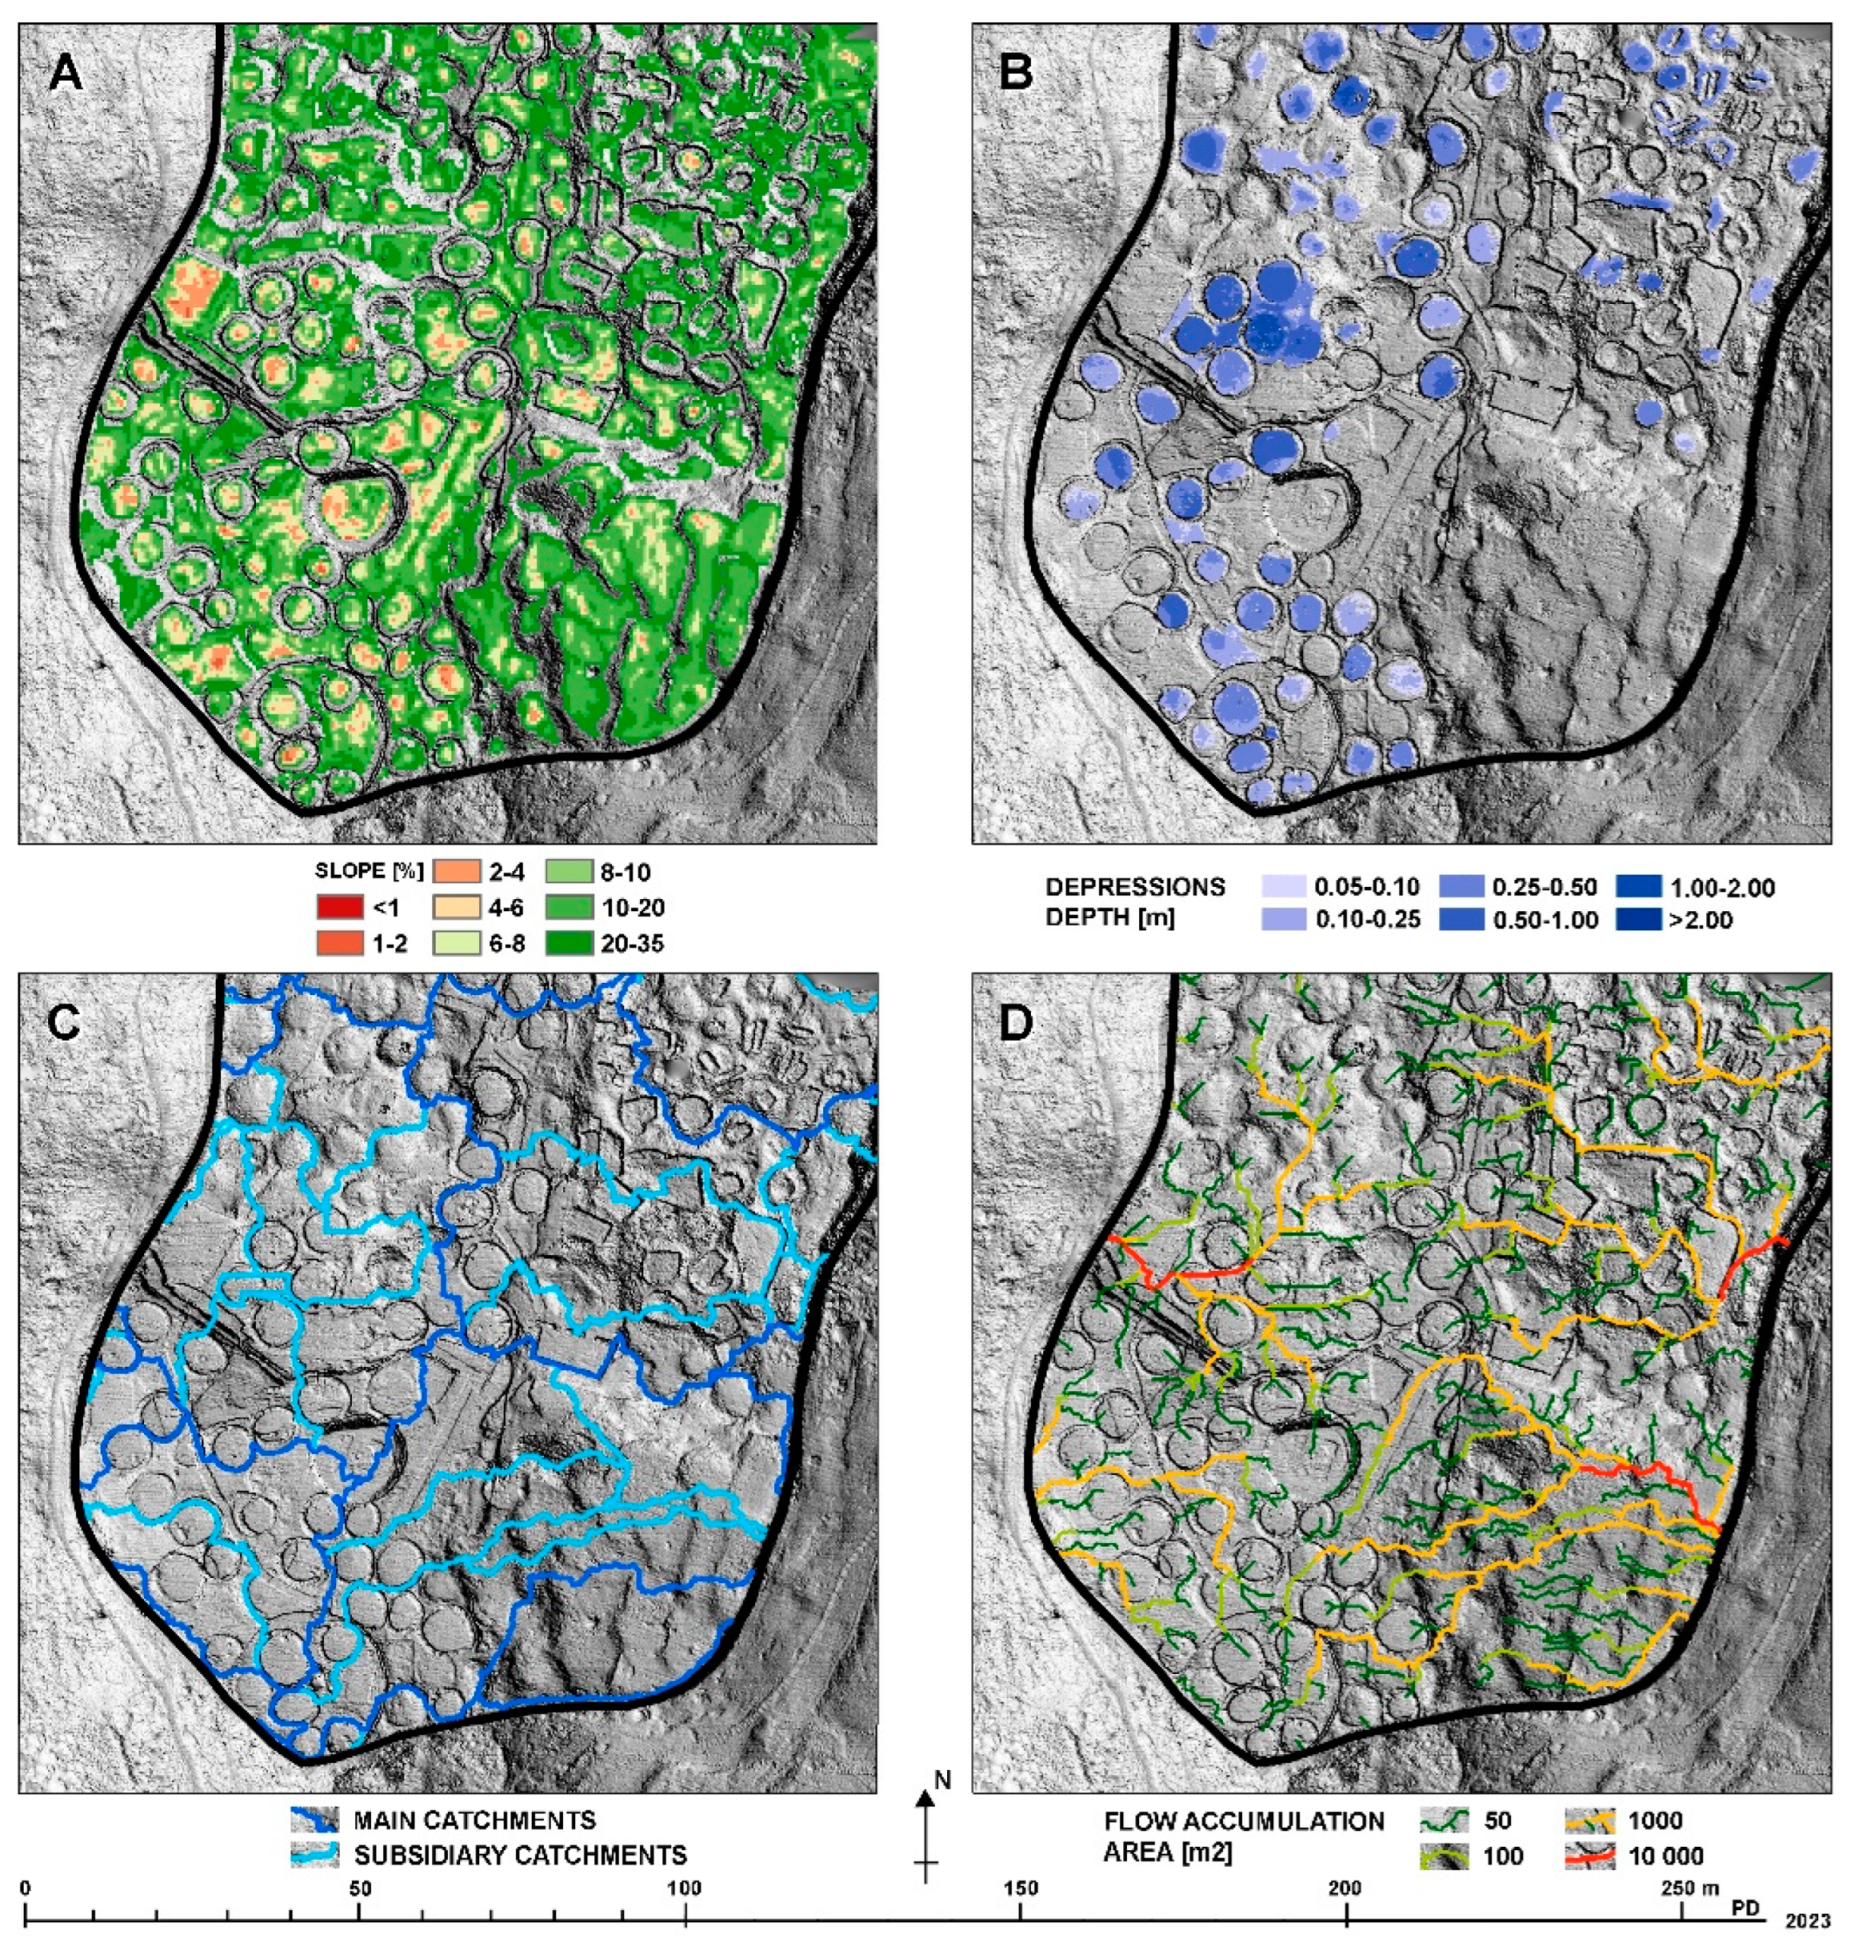
3.2.2. Hydrological Analysis Based on DTM

The past installation of drainage systems in La Fortaleza indicates that the infiltration of rainwater was understood since the 1980s as one cause of deterioration [85]. However, no hydrological analyses were conducted to simulating rainwater runoff on the site surface, nor is there technical documentation of the drainage systems considering calculations of all rainwater flows, slopes, the diameters of pipes, and so forth.
Drainage projects require hydrological analyses. These can be done on a DTM to determine the main elements of the system: slope gradient which, along with other parameters, will indicate the relative proportions of surface runoff and ground infiltration (Figure 13A); local depressions, where rainwater can only evaporate or soak into the ground (Figure 13B); boundaries of individual water catchments and their areas, necessary as input data for calculations of the drainage system (Figure 13C); and main rainwater runoff lines (Figure 13D).

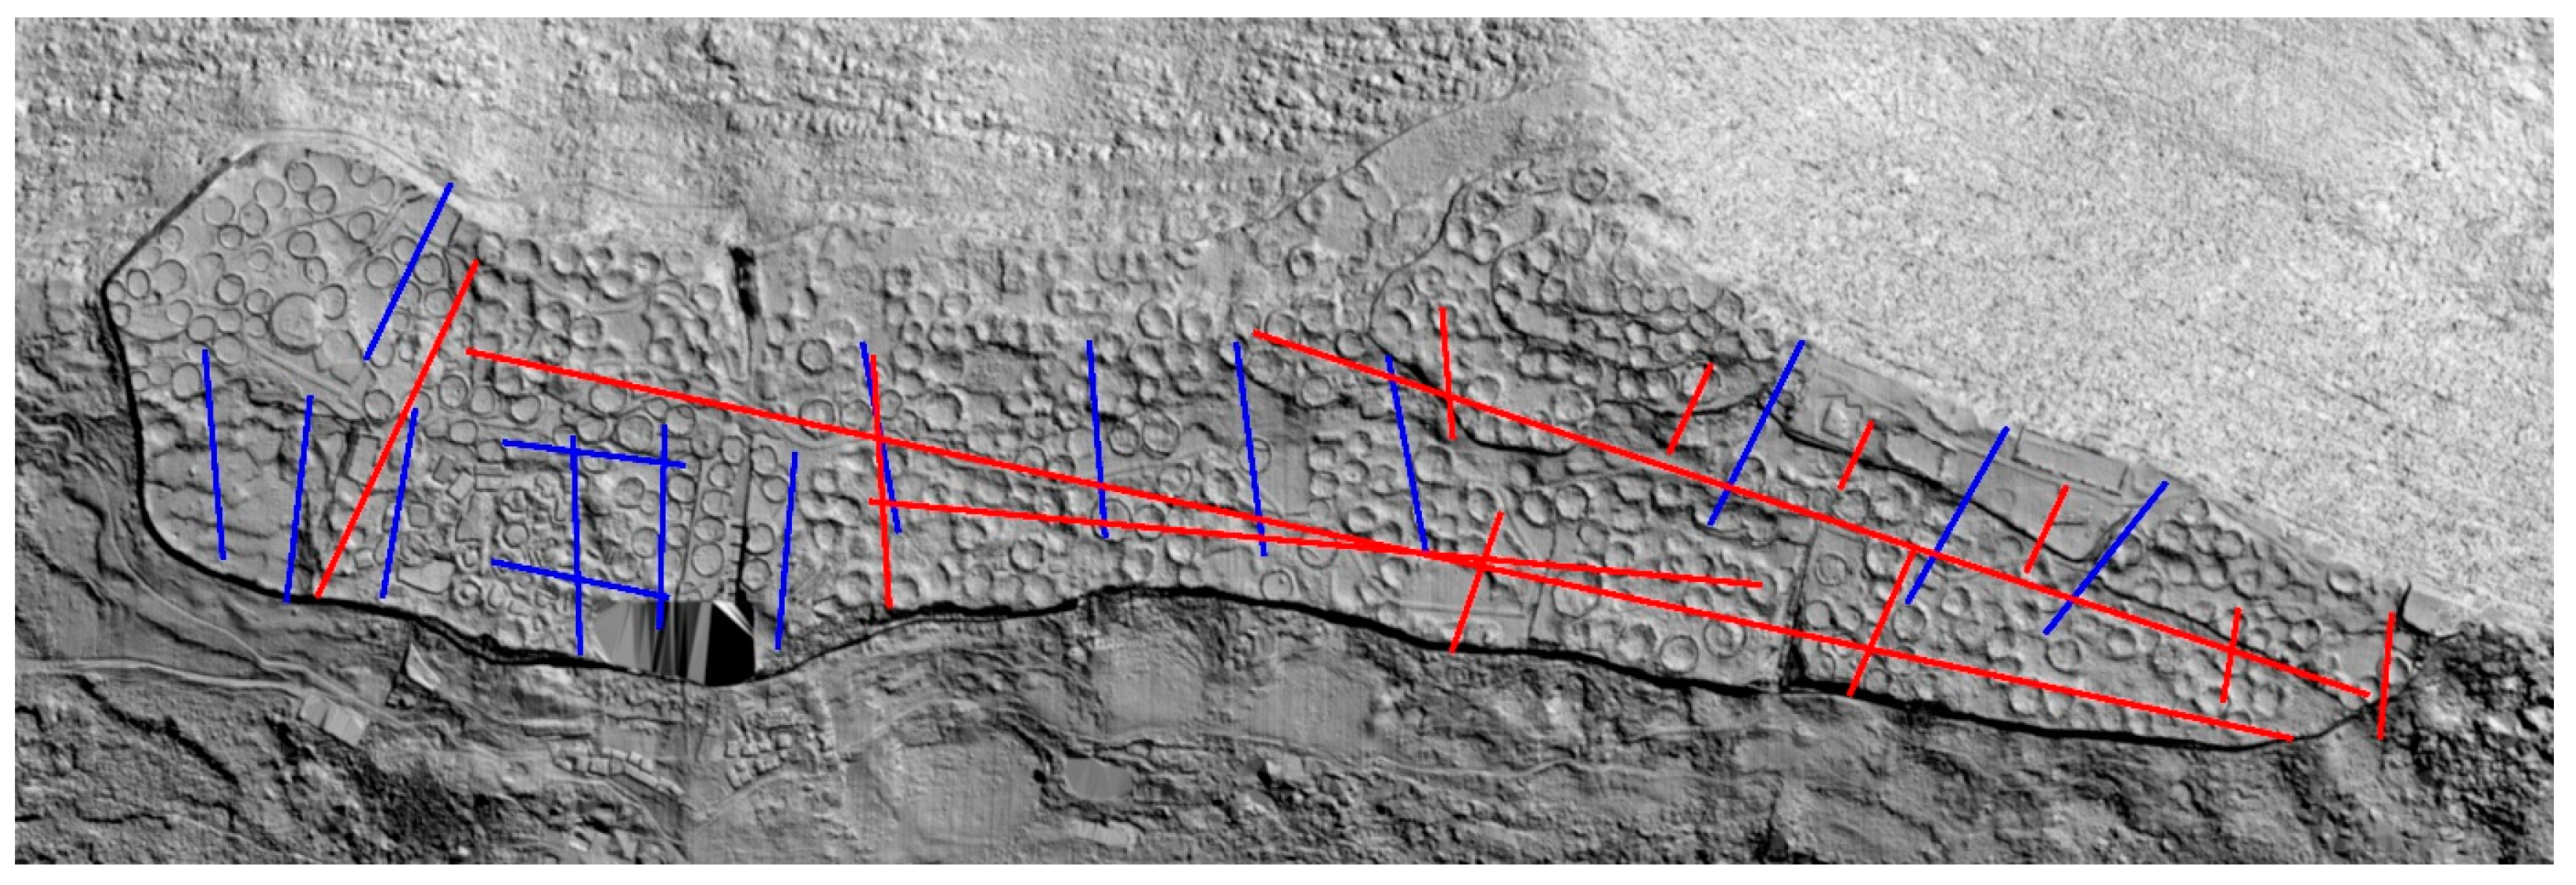
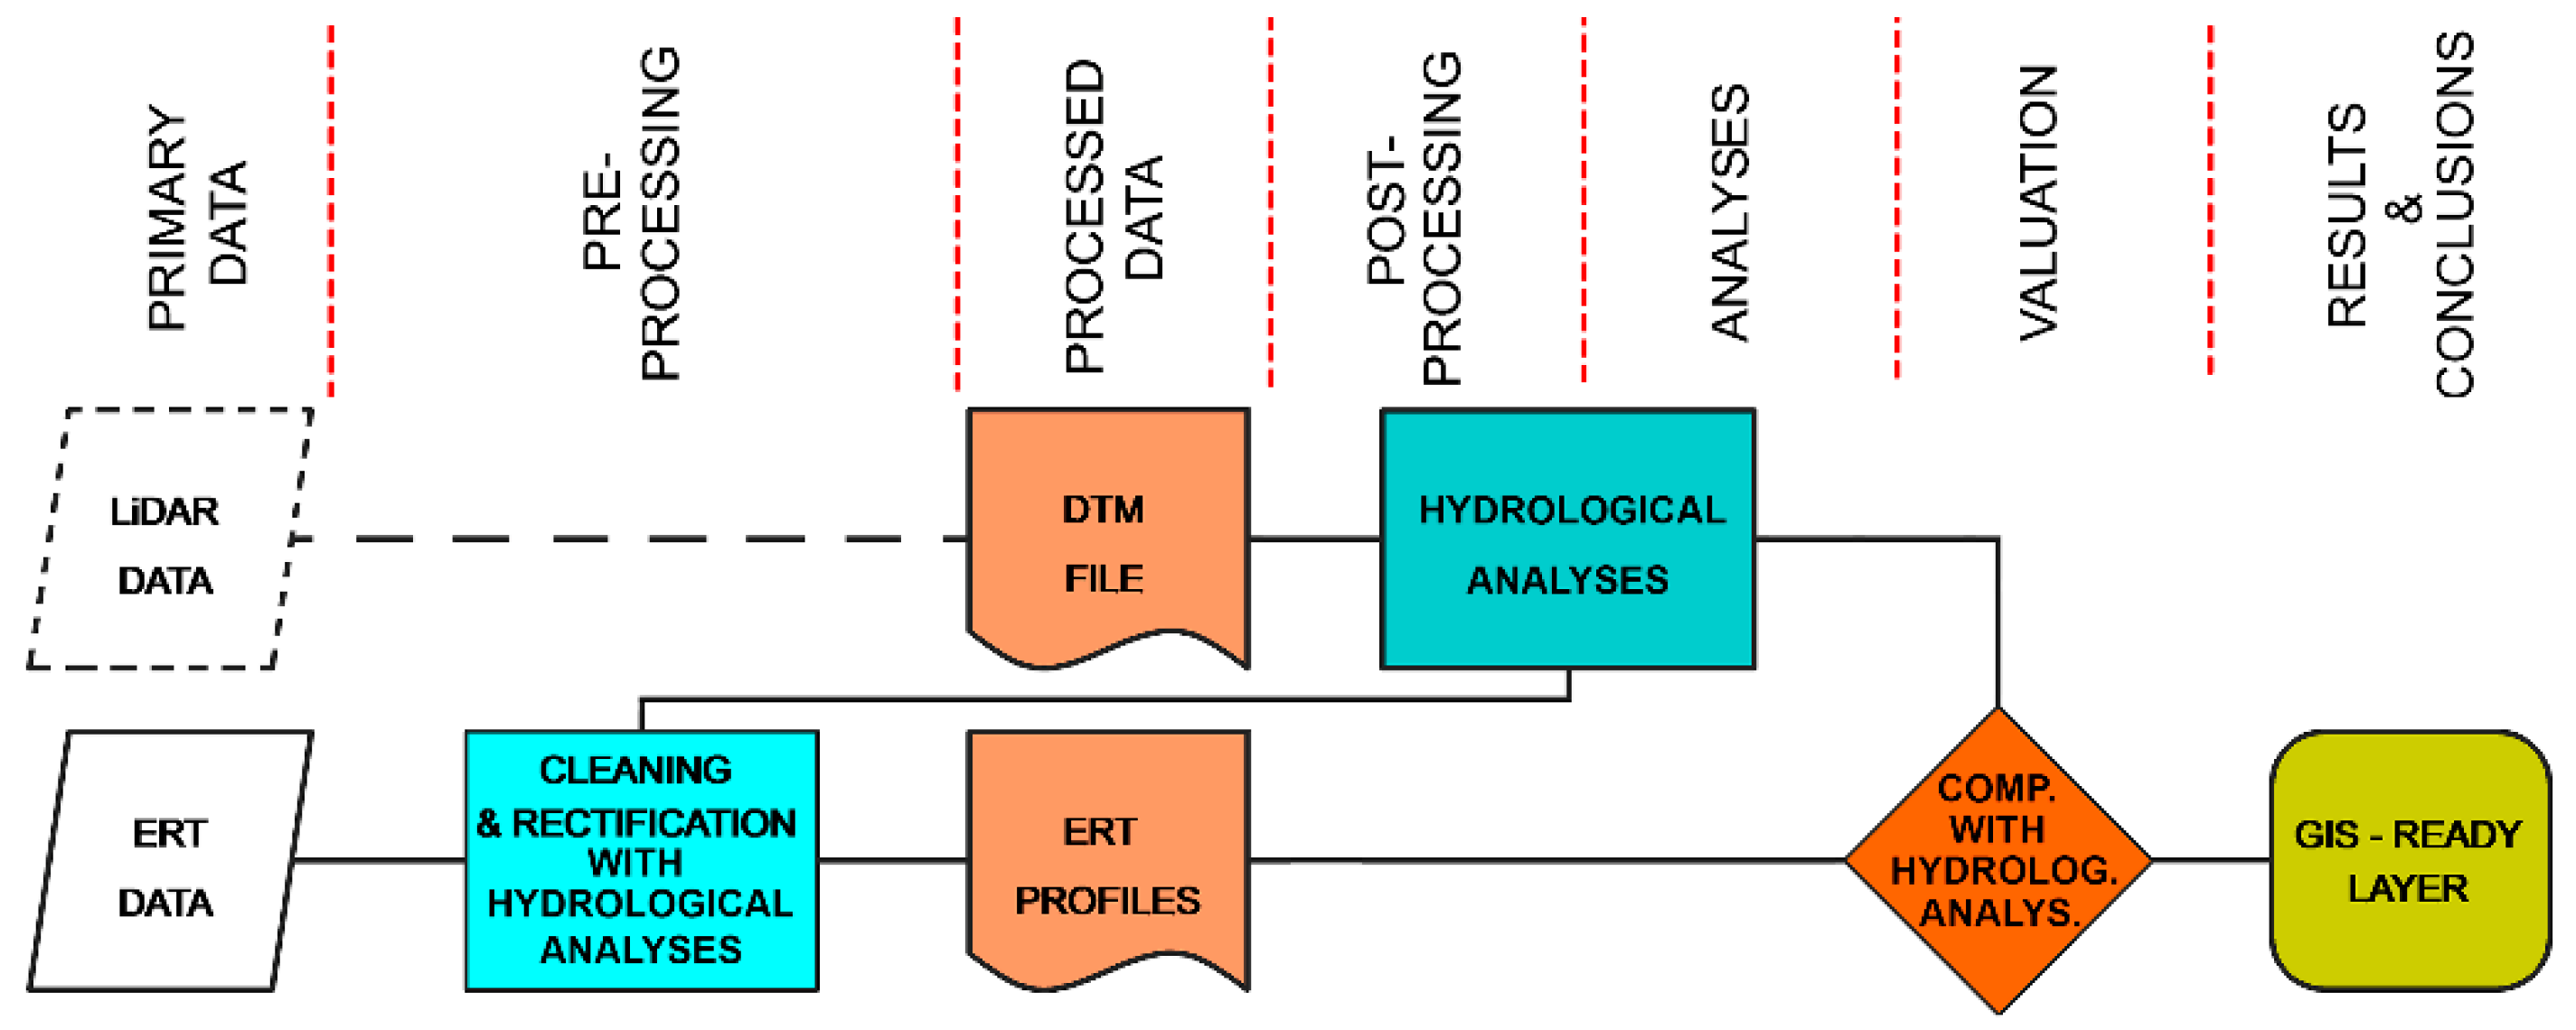
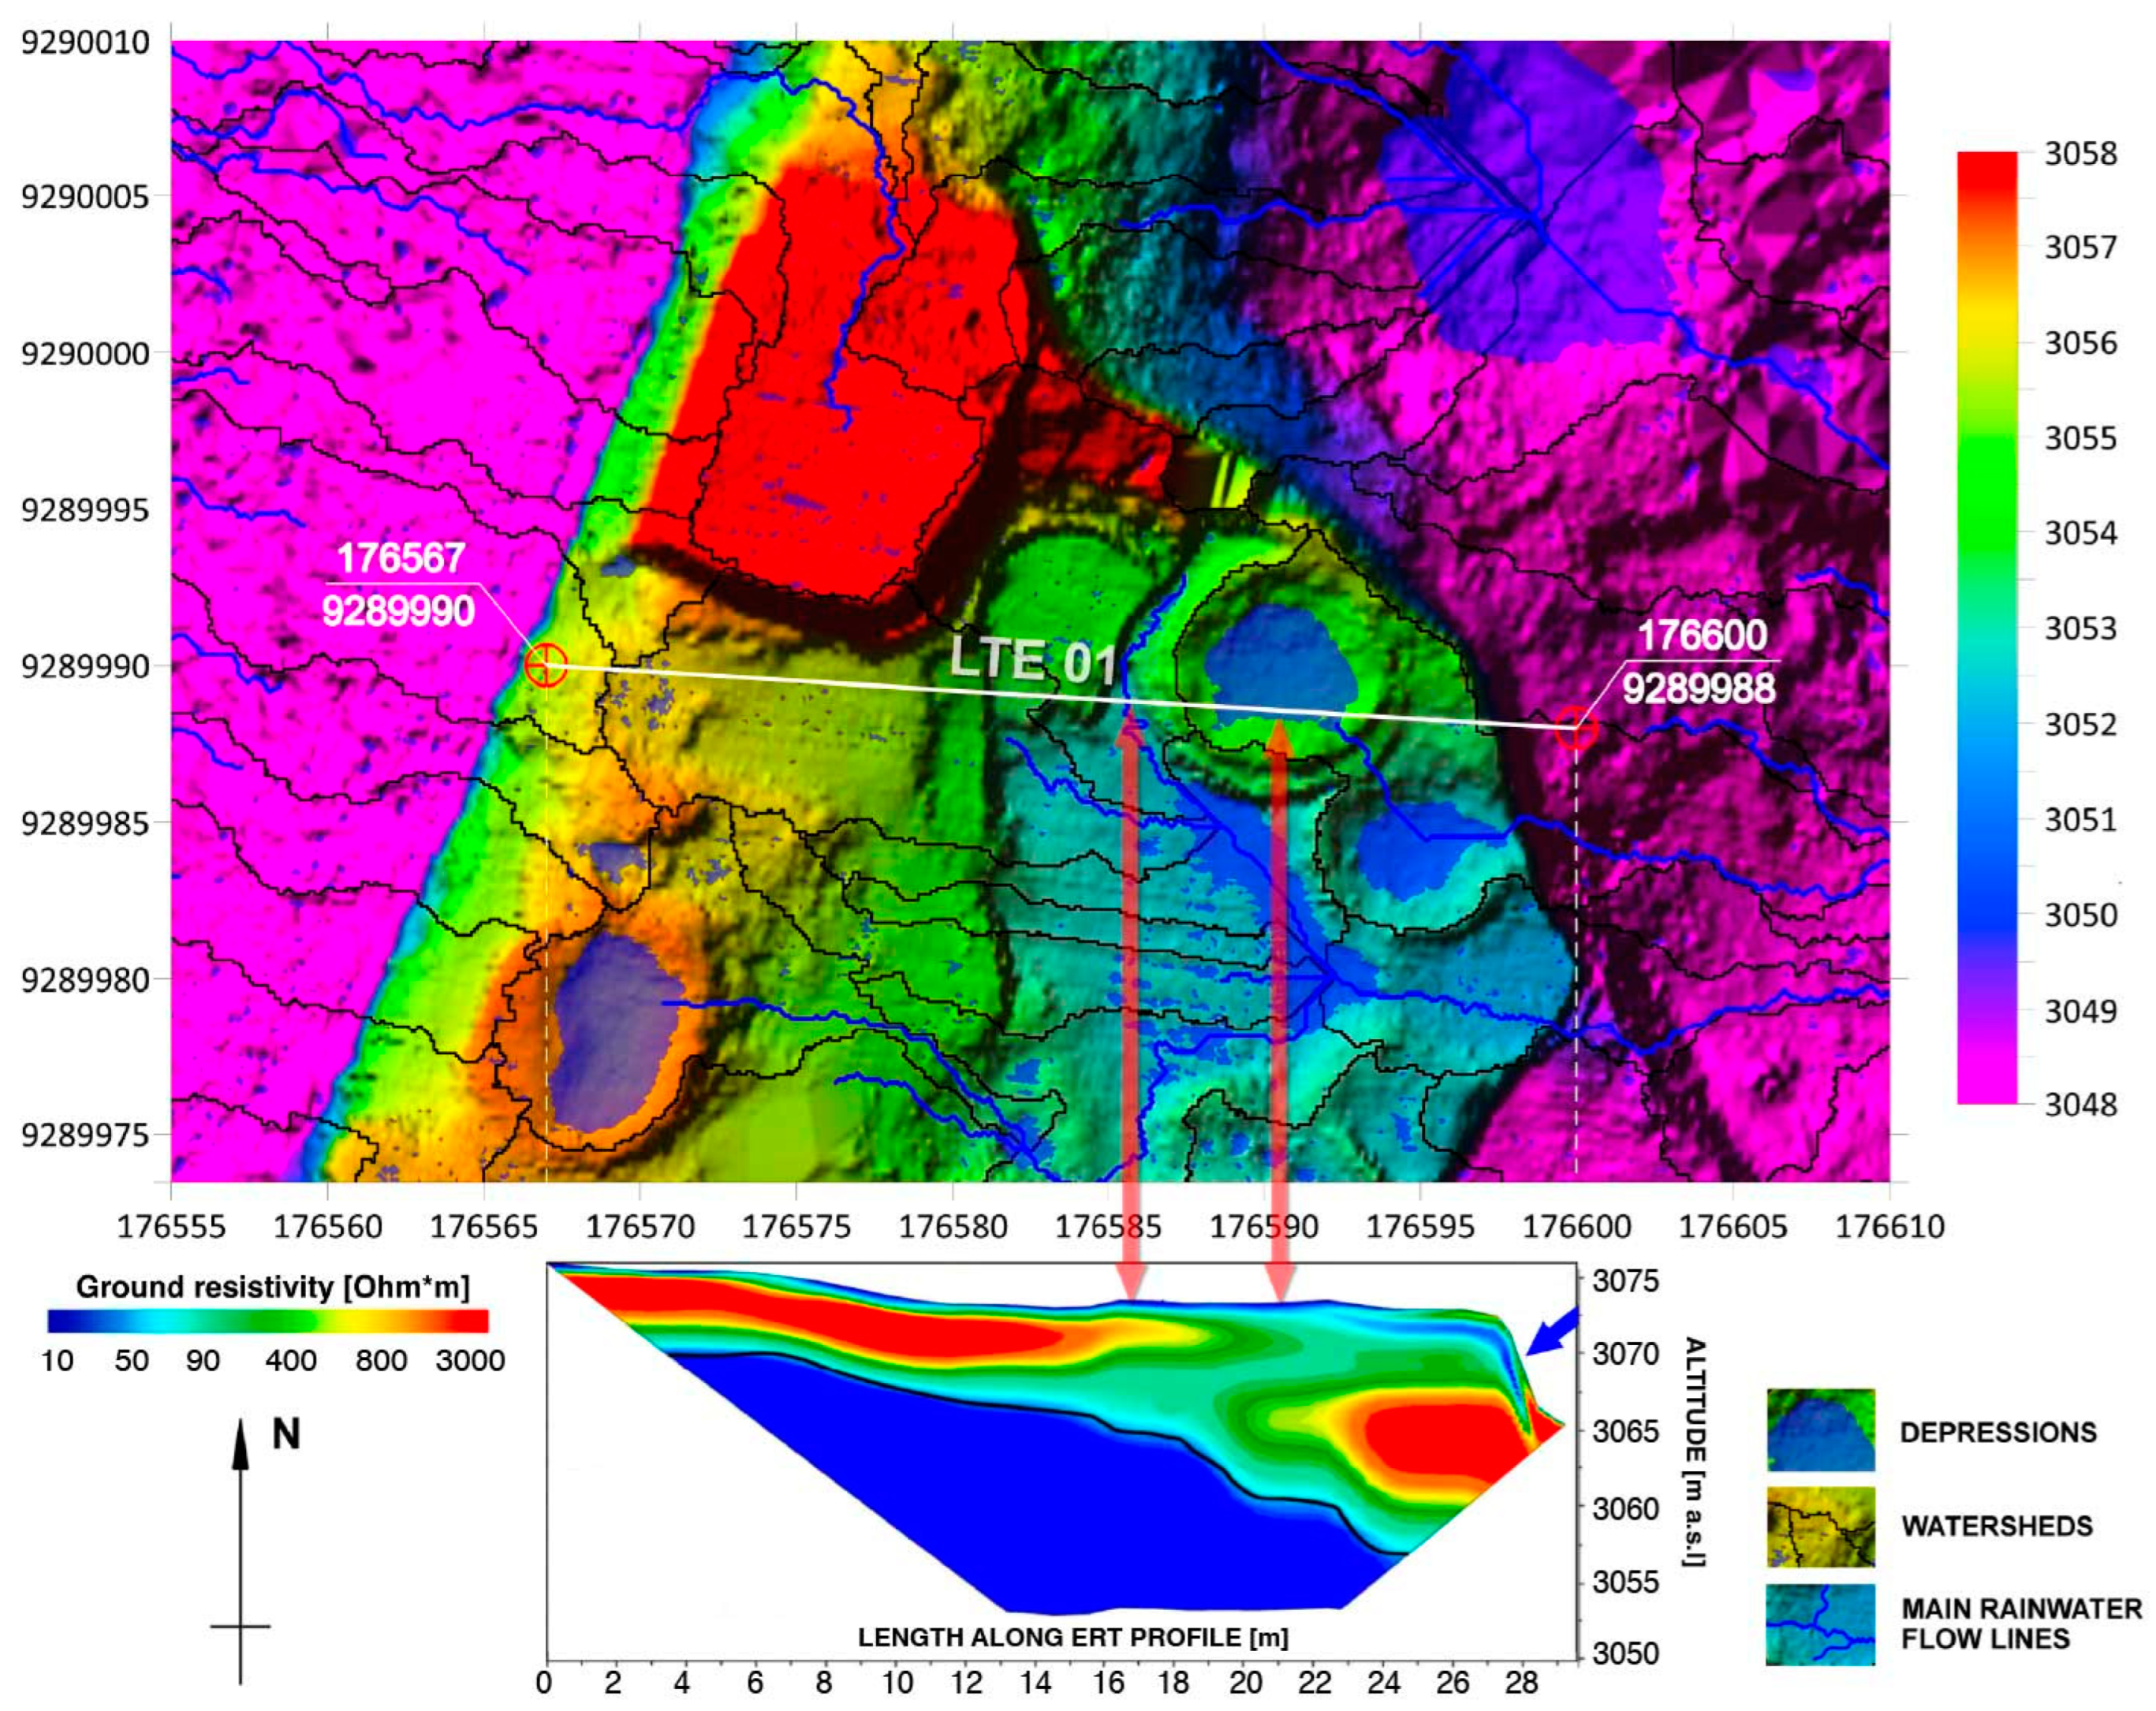
3.3. Comparison of ERT Data with the Results of Hydrological Analyses

To study the relationship between precipitation at La Fortaleza and threats to the monument, we integrated our hydrological analyses with the results of geophysical surveys (Figure 14), specifically the ERT readings collected by Mori [9] (Figure 15).
Thirteen ERT profiles (Figure 8) were plotted over the hydrological maps using their georeferencing information. These allowed direct comparisons between the hydrological risks modeled using the DTM and evidence of increased subsurface humidity from the resistivity measurements. For example, the left red arrow on Figure 15 shows coincidence between a main rainwater runoff line and a zone of increased subsurface humidity. The right red arrow on the figure shows how a Chachapoya circular building forms a depression that tends to collect water and favor infiltration, and matches increasing subsurface soil moisture. The blue arrow seen below in the section profile points to detected increased humidity within the structured fill directly behind the perimeter wall of La Fortaleza.

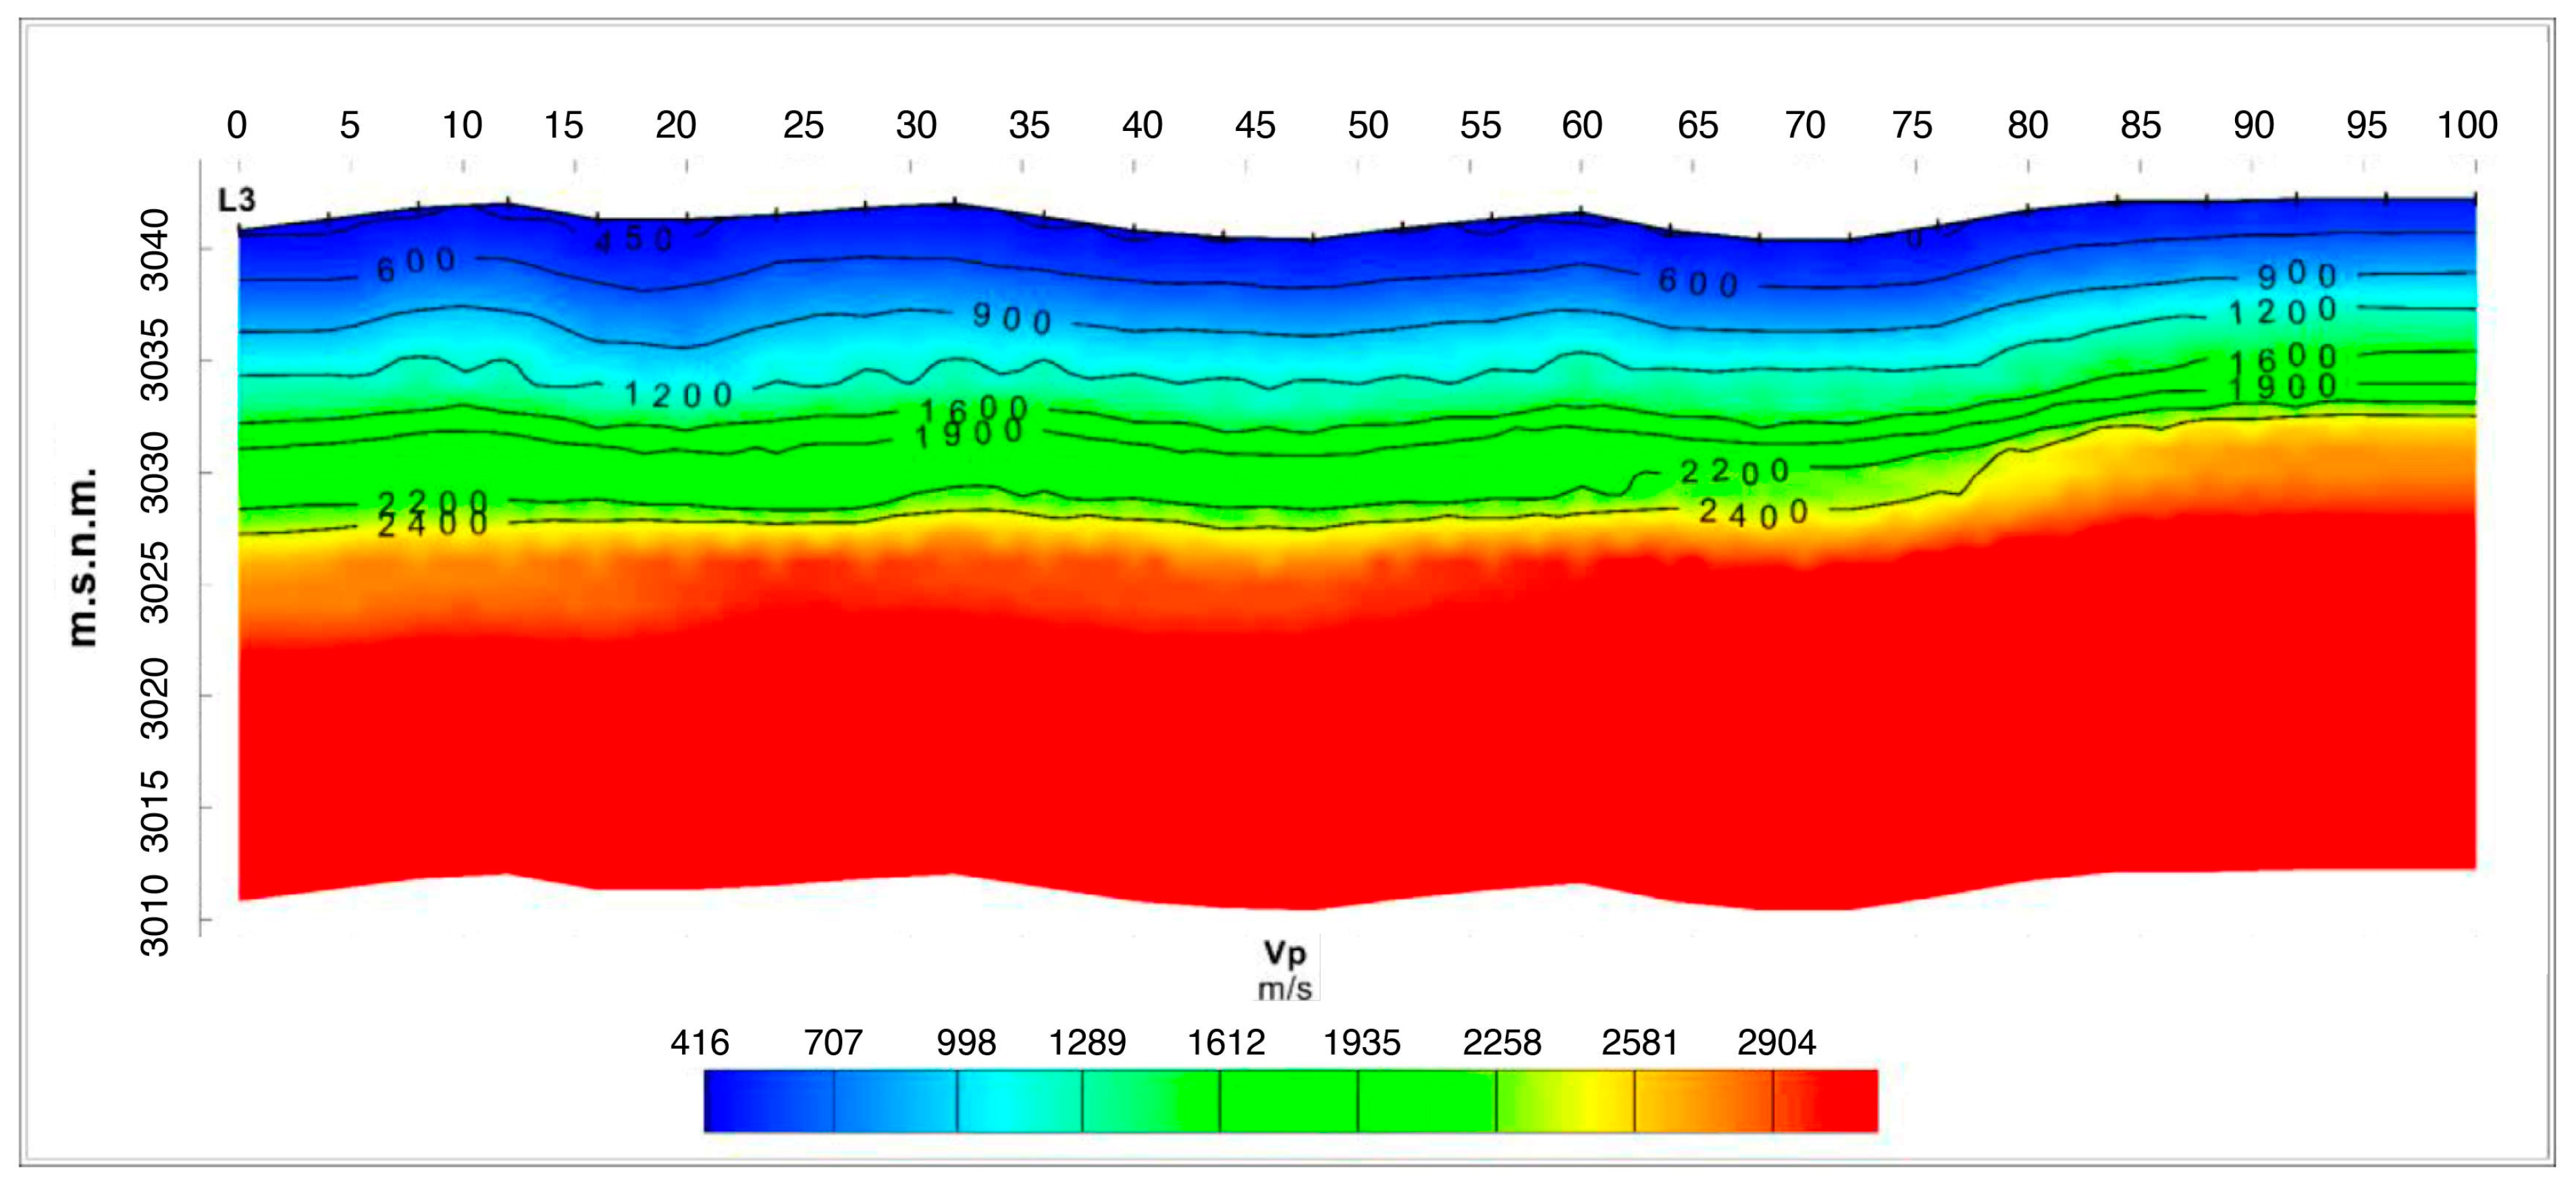
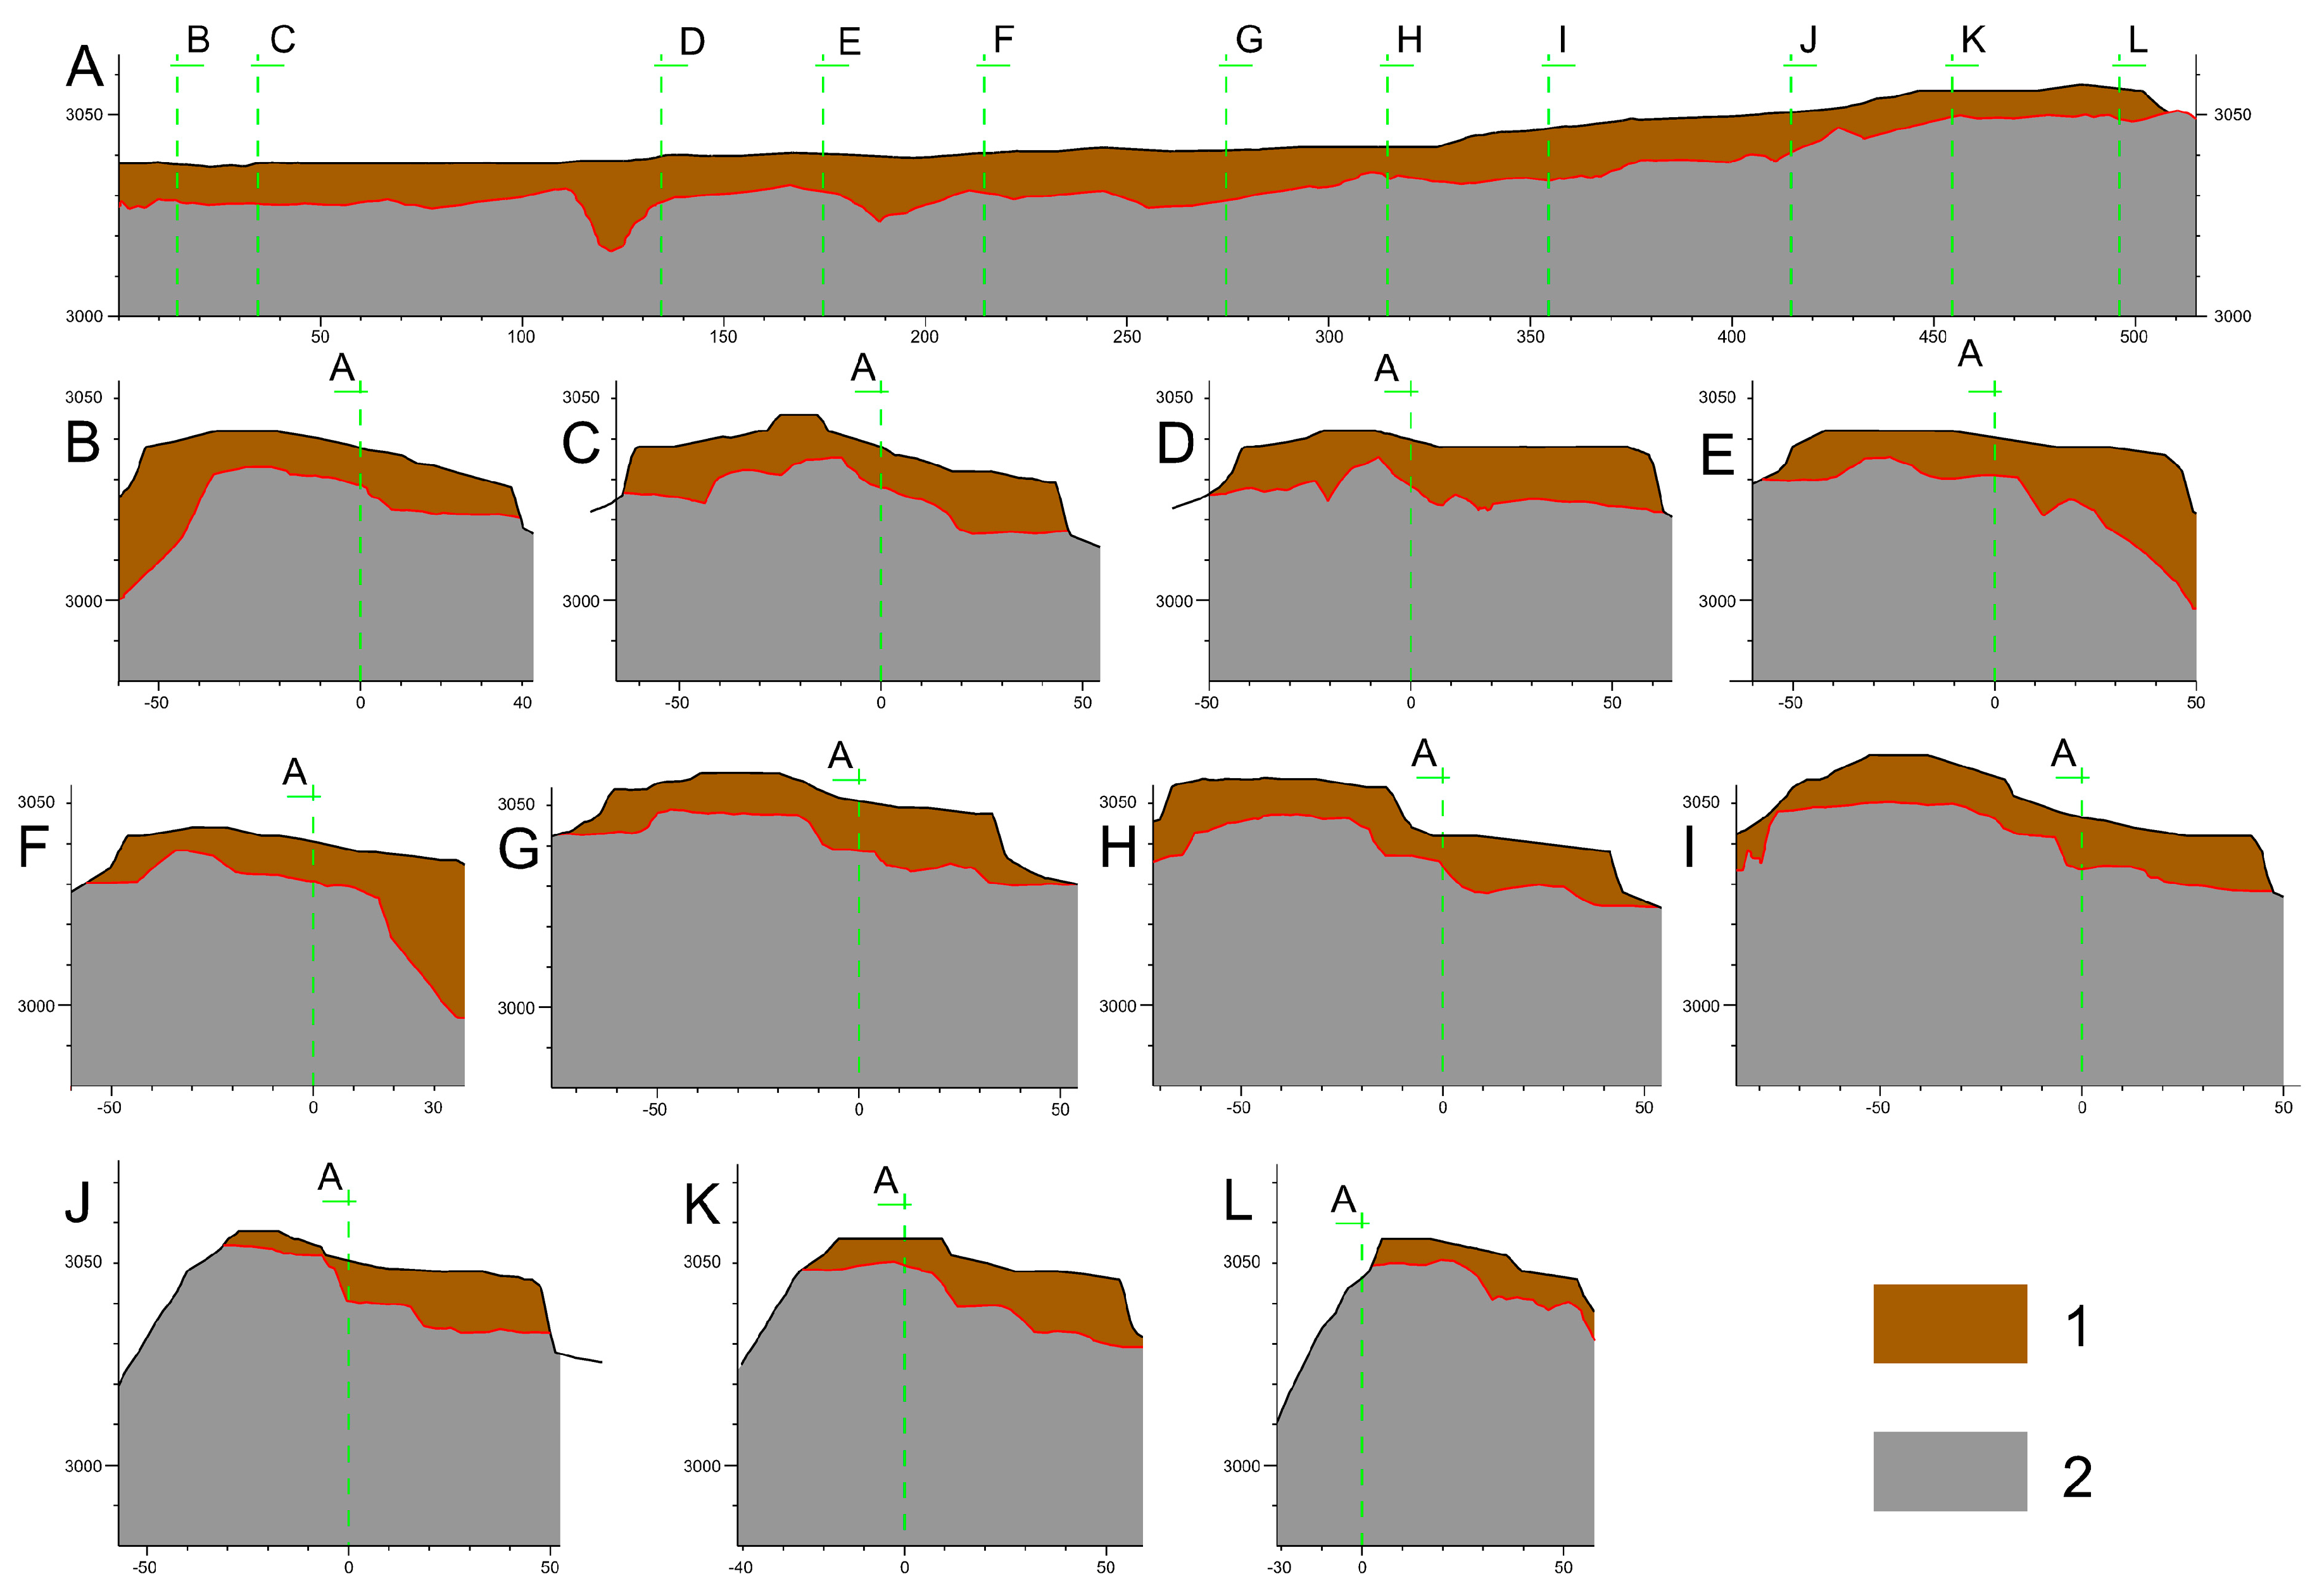
3.4. Stratification of La Fortaleza Using Seismic Refraction

The measured variations in the propagation speed (velocity) of the primary compression waves (Vp) generated by the SR lines were processed using the applications SeisImager2D, version 3.3, and Easy Refract, version 20.4.518, to generate 2D geoseismic profiles of La Fortaleza (Figure 16). The compactness of the materials present in the stratification was defined according to the Vp: (1) 900 m/s > Vp: medium dense to densely compact material; (2) 900 m/s ≤ Vp < 1300 m/s: densely compact material; (3) 1300 m/s ≤ Vp < 2200 m/s: very densely compact material; (4) 2200 m/s ≤ Vp: contact with bedrock [70].
To estimate the volume of the construction fill, Mori used a Vp speed of 2200 m/s as a point of contact with the bedrock and reclassified the strata into two units (Figure 17): the construction fill, composed of limestone blocks and argillaceous clay plus the topsoil (900 m/s ≤ Vp < 2200 m/s), and the underlying bedrock (2200 m/s ≤ Vp). Then, he used Oasis Montaj, version 9.3, to model the surfaces of both La Fortaleza’s platform and the bedrock in high resolution 3D. Finally, these 3D surfaces were analyzed in AutoDesk Civil 3D 2023 and, by considering the mathematical difference between both, Mori arrived at the volume of the existing construction fill at approximately 600,000 m3.

3.5. Fusion of Image-Based Modeling (IBM), ALS, and TLS Data

No pre-collapse “stone by stone” documentation of the perimeter wall exists, but Kucera, VanValkenburgh, and Rojas provided TLS data which, when integrated with IBM and ALS data, produced results that were crucial for revealing causes of the collapse. Illustrated here are: (1) detailed stone-by-stone plans, (2) techno-morphological analysis, and (3) multitemporal deformation studies. These will be critical in formulating conservation guidelines and specifying the scope and treatment methods for the collapsed parts.

3.5.1. Detailed “Stone by Stone” Plans

Given a good overlap between TLS and photogrammetry projects with well-spaced and equally distributed ground control points, the integrated documentation can provide a fast and accurate source for a more detailed study (Figure 18).
Another approach to combining photogrammetric and TLS data for documentation is use of their 2D products. Figure 19 shows the data flow for this efficient method of documenting the facades of any walls as well their ground plans. In both cases, such 2D drawings or 3D models can be used as base layers for any conservation purposes.

3.5.2. Techno-Morphological Studies

There are many studies of Inka masonry [86,87,88,89,90,91,92] such as Protzen’s investigations of construction phases at Ollantaytambo [90] (pp. 241–256) or the sequence of laying stone blocks at Sacsayhuaman’s retaining walls [88] (Figure 37, p. 181). These in-depth techno-morphological approaches were only adopted recently in the Andean region [93,94]. Even less can be said about use of such methods in the Chachapoyas region. One reason for this gap in research is a lack of accurate “stone-by-stone” building documentation at Chachapoya sites. The fusion of IBM and TLS data may improve the situation for straight walls. However, most Chachapoyas constructions are oblong or circular. Unrolling the faces of inclined walls of an irregular plane demands substantial data and computing power. However, some applications operating on TLS or IBM data can unroll cylindrical surfaces well enough for our purposes. A complex curved wall can be divided into sections with constant radius. Because wall inclinations rarely exceed 10°, a cylinder is used as an estimate of that part of the wall. Then, subsequent sections of the wall are unrolled and can be stitched into one image. Depending on the software used and the input data, this method can be used either on 3D mesh models or directly on 3D point clouds. The resulting unrolled “pseudo” orthoimage can then be used as a raster reference with any 2D CAD program for further vectorization, delimiting zones of special interest, and calculating their areas. Finally, it can be also used for techno-morphological studies such as ours presented below in Section 4.5.1.

3.5.3. Deformation Analysis Based on Multitemporal Hybrid Data

Data captured before and after the collapse can help to reconstruct the events and processes preceding and following La Fortaleza’s structural failure [95,96]. Analyses of perimeter wall deformations “on the eve” of such a disaster can be particularly illuminating. Such analyses require two steps. First, to ensure the accuracy of further analysis, data from initiatives before and after the collapse must be precisely referenced and joined into a single coordinate system. Second, if cleaning the point clouds of vegetation growing on the walls and moving objects is not done effectively, the comparison (often Cloud2Mesh) will show mostly vegetation changes. Cleaning vegetation from 3D clouds is challenging, especially when the background is wall of variable inclination, and made of heterogeneous blocks with complex distributions. Such work requires either labor-intensive manual cleaning of the cloud or specific filtration methods adequate for the task.
To examine the April 2022 collapse at La Fortaleza, we have three sets of data before the collapse, and two sets acquired afterwards. Two of them are 2018 and 2019 ALS surveys. Georeferencing of both was based only on GPS data, and no ground control points (GCPs) were set for either survey. The resolution of the 3D point clouds representing the wall greatly exceeded 1 cm. These factors, and difficulties clearing the point cloud of data representing the vegetation growing on the walls obstructed effective analysis of deformations that may have occurred between these two surveying projects. The third pre-collapse dataset comes from the 2019 TLS survey and is referenced to existing geodetic points in the area. The resolution of these data did not exceed 1 cm. Unfortunately, deformation cross-analyses between both sets of ALS data and the TLS data did not bring satisfactory results in this case either. Therefore, we concluded that ALS data are not suitable for multitemporal deformation analyses here.
We also accessed data from the drone surveys by R. Vigo and N. Vargas right after the 2022 collapse. Because of concerns for the safety of the pilots and their equipment, no ground control points (GCPs) were placed for their surveys. GCPs are crucial for the correct scaling and georeferencing of IBM models. GCPs guarantee identification of possible distortions. To overcome this problem, five control points were defined using TLS data. Distinct points (cracks, edges of stones), distinguishable in both TLS and IBM data, were defined in RiscanPro 2.14.1 and exported in the respective projection (WGS84 UTM 18S).
The resolution of an IBM model is determined by the sensor, the distance, the number, and the quality of images. A high number of images from various positions is preferable. The UAV surveys right after the collapse produced up to 25 images, resulting in a rough model that is nonetheless valuable because the survey predated installment of a cover over the area, thus enabling an estimation of the collapsed volume. For processing, we used Metashape 1.7.2 and the control points previously defined in the TLS dataset at a resolution of 1 cm. This rendered a positioning accuracy of 2–3 cm for each of the five defined control points. Their positioning accuracy is also tied to the image resolution. During processing, we observed that this accuracy was well below 5 cm, which enabled sufficient comparability with the TLS data. After exporting the control points to the IBM, they were identified manually within single images, and the datasets were matched.
To georeference the TLS model, 11 GCPs (Riegl 5 cm cylinder, retro targets) were placed near Acceso 1 and measured using an RTK GNSS system. An initial localization of the scan positions was gained by an onboard GNSS antenna atop the scanner. During the processing of the TLS data in RiscanPro 2.14.1, georeferencing was based on the GCPs and the automated extraction of reference planes to geometrically align the scans. The accuracy of the absolute positioning of the model thus depends on the accuracy and precision of the geodetic survey. The high data quality and density allow for a crisp rendering of individual stones in the walls of La Fortaleza. These data permit calculations of the impact of the 2022 collapse, and will provide an essential reference for future wall reconstruction.
We marked the outline of the collapsed area in 3D, and the point clouds were reduced to the surfaces enclosing the marked area. The resulting point clouds—TLS data and the post-collapse IBM at a resolution of 5 cm—were exported to Geomagic Wrap 2021 to render and calculate the volume of the collapsed segment. Both data sets were merged and triangulated to create a solid mesh according to the software routines. The merged point clouds were resampled to an overall 5 cm resolution, and noise reduction was applied. After triangulation, the surface was smoothed to remove spikes and further noise. Finally, the collapsed volume was calculated. Keeping in mind an overall positioning error of approximately 5 cm, one might estimate an average error of the volume as roughly 5%.

4. Results and Discussion

Our research produced useful results that clarify not only the current state of La Fortaleza, but that also tell us much about the monument’s past.

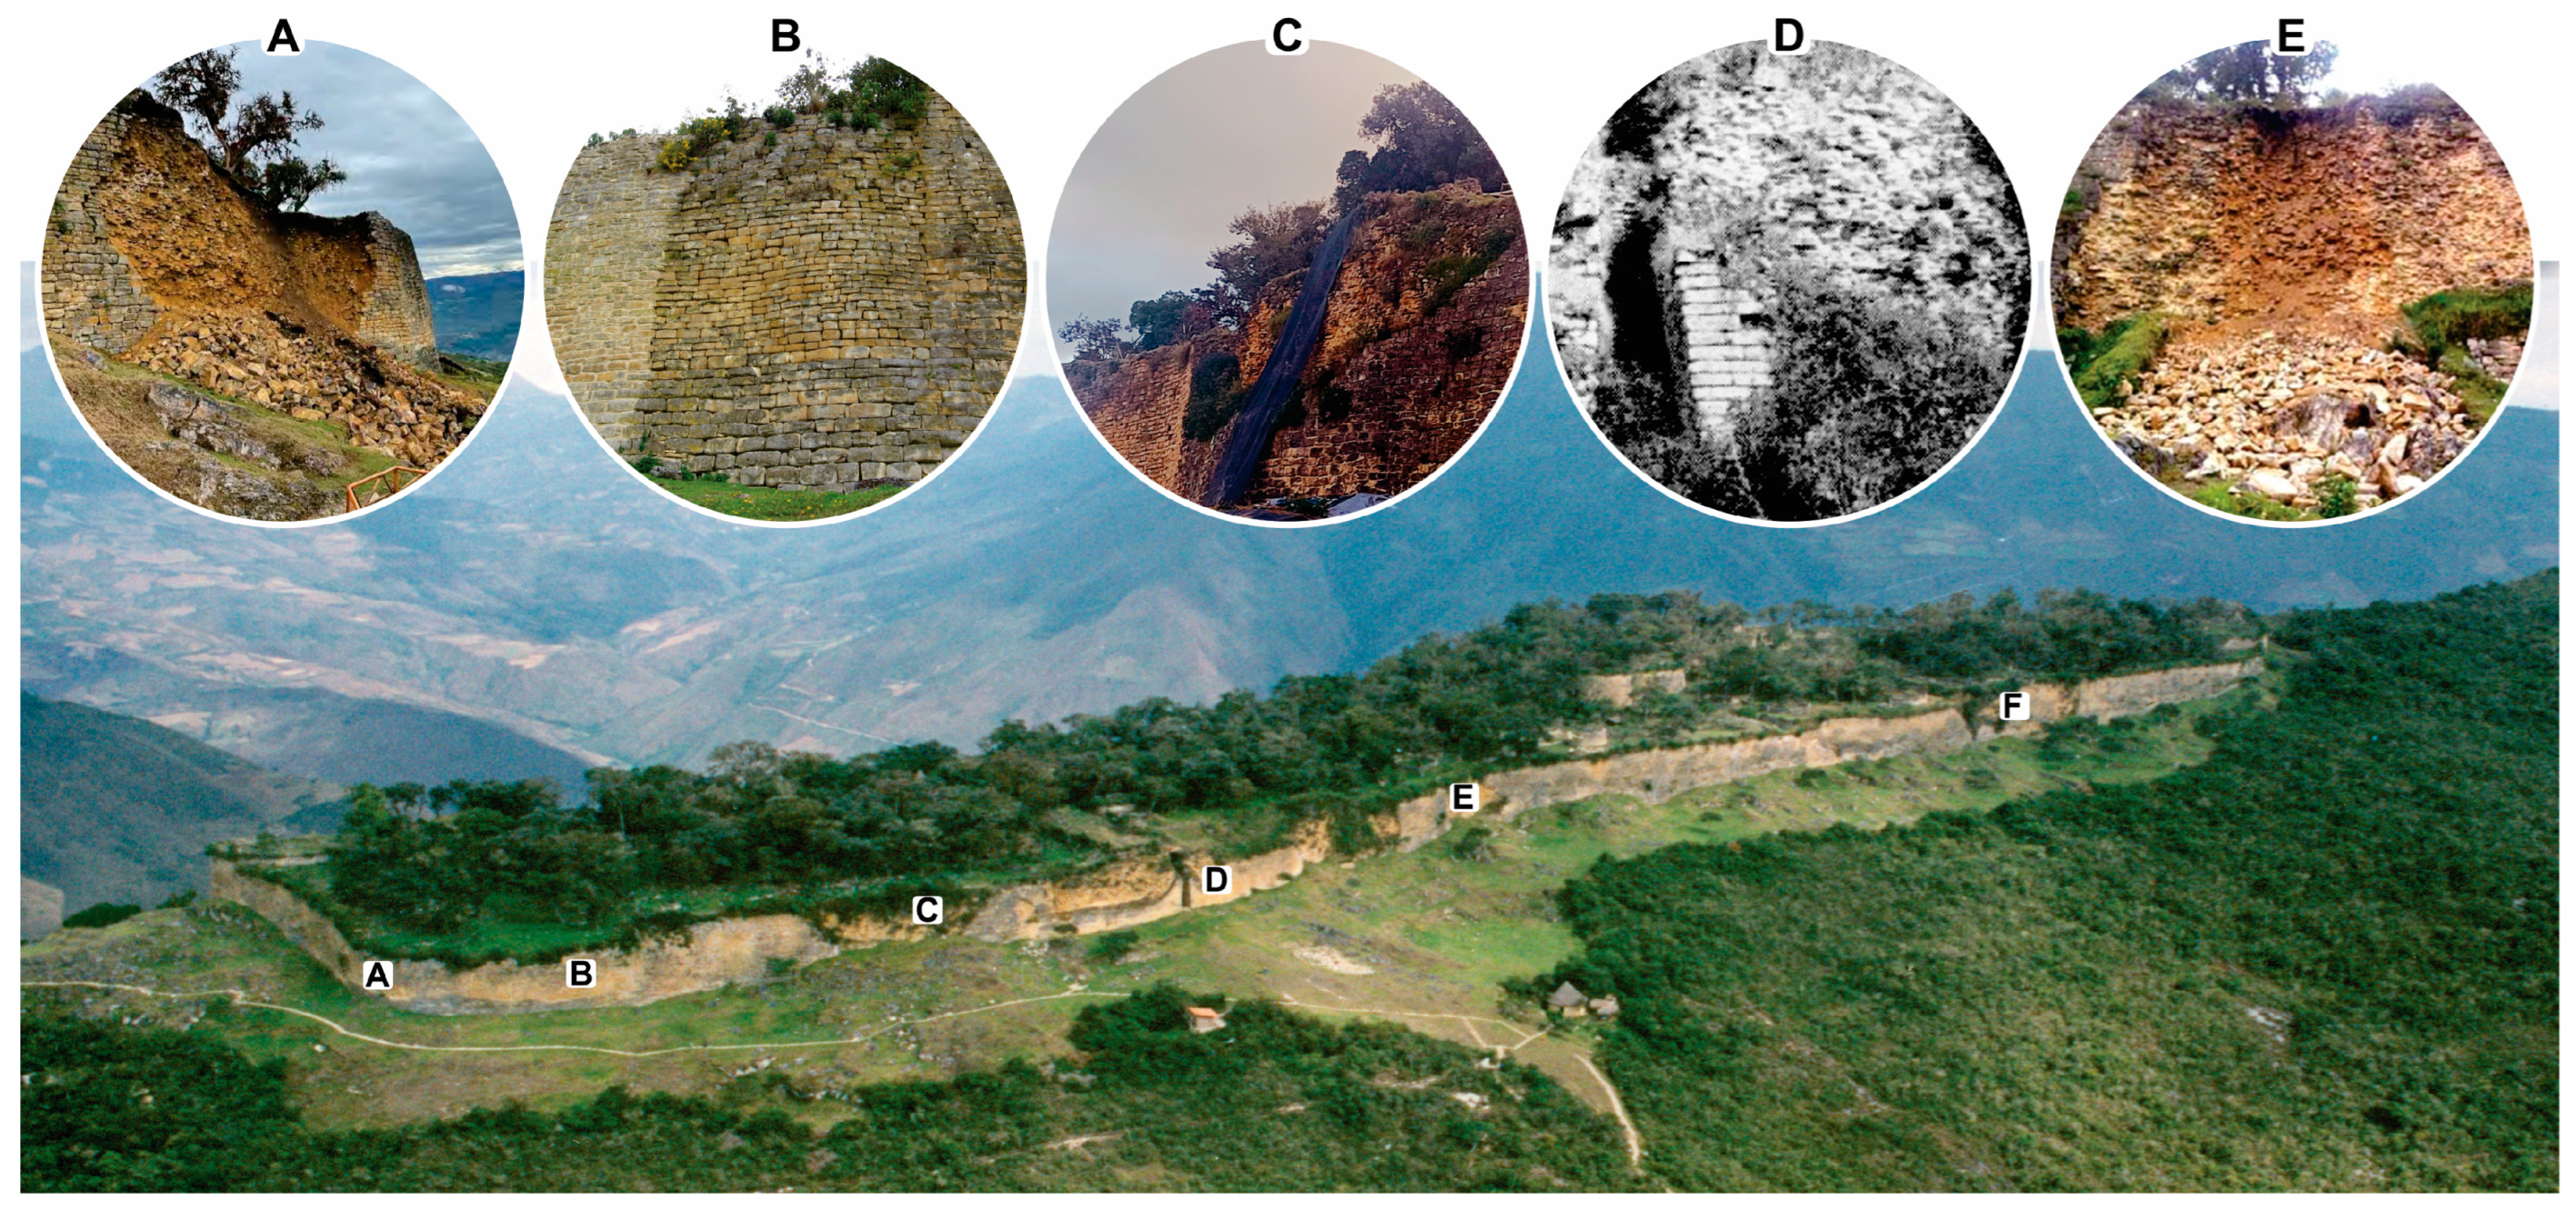
4.1. Background Information, Ground-Truthing, and Stratigraphy

Historical sources and ground-truthing of features detected by remote sensing reveal structural deterioration and stability problems at La Fortaleza reported since the late 19th century. We also separately documented a long history of collapses of the perimeter wall [64]. Obviously, the record is incomplete, and most information pertains to the past 100 years. Nonetheless, we identified a pre-Hispanic collapse involving an area of 210 m2 on the southeastern perimeter wall (Figure 20B). Photographs published in visitor reports [4,58,59,61,62,63] reveal a collapse on the eastern perimeter wall, just north of Acceso 1, between 1910 and 1933 (Figure 20D). The March 2013 collapse affected the eastern perimeter wall 30 m north of Acceso 1 (Figure 20E). Of course, the April 2022 collapse prompted our present study (Figure 20A).
The history of La Fortaleza’s collapses attests to the fragility of the perimeter wall. The monument’s structural instabilities long predate the 2022 crisis and usually affect the southeast quarter despite decades of conservation efforts. One important reason for recurrent wall failures at this same locality is the shape of the underlying bedrock, which is characterized by inclinations towards the east [10,34,97] and south, as revealed in a model developed by Mori using seismic refraction data (Figure 17 and Figure 21). These dips in the underlying limestone, the low permeability of this rock, and the high rates of rainfall infiltration through the layers above [71] create geotechnical conditions that favor the preferential movement of subsurface water downward towards the monument’s southeast quadrant. To these processes we can add topographical surface features that result in the flow of rainwater towards the eastern perimeter walls. The 1893 map of La Fortaleza that Bandelier created with a theodolite allowed him to illustrate cross sections showing surface slopes dipping west to east, and north to south [4].

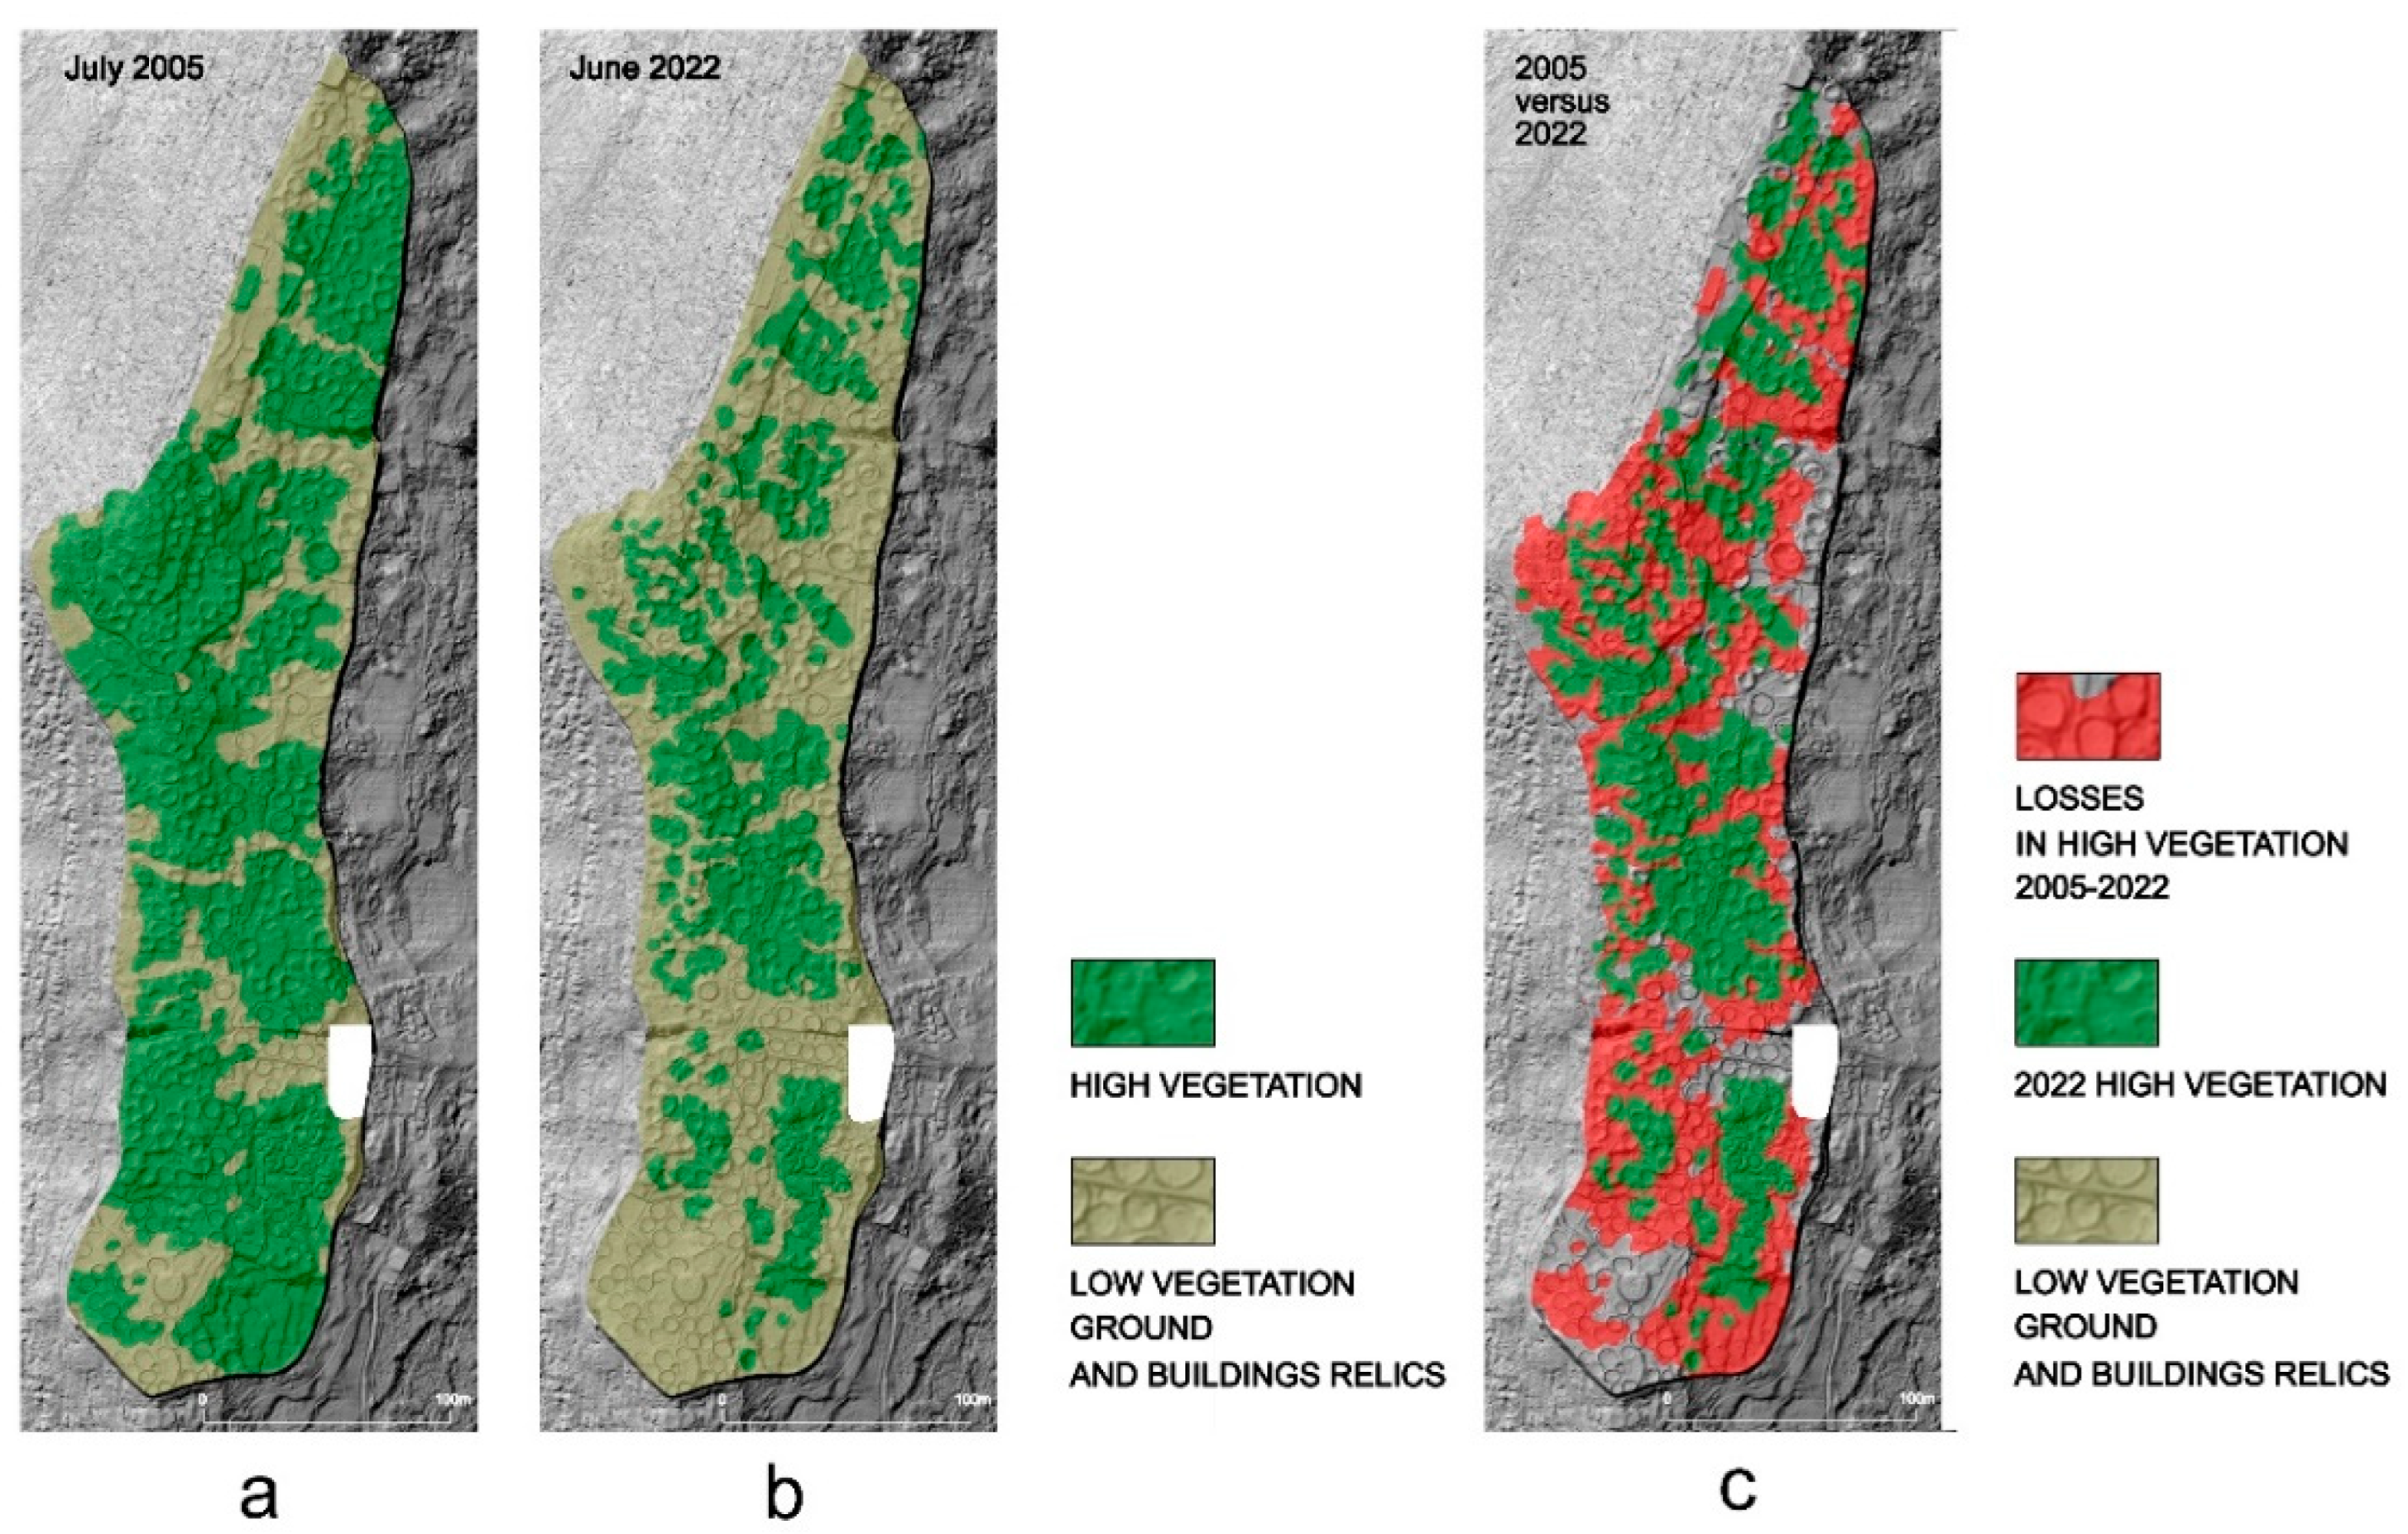
4.2. The Problem of Deforestation at La Fortaleza

Our study of the historical literature allowed us to positively identify at least two mid-19th century attempts to clear-cut La Fortaleza’s trees and shrubs, and one 20th century report of total deforestation [56,57,98]. The first published photographs of Kuelap taken by Middendorf in 1866 show the monument nearly hidden by abundant vegetation draped over the tops of the walls while the surrounding forest masks the wall base [58]. There must have been additional deforestation attempts leading up to an incisive admonition by Horkheimer in 1958: “[The monument] … is impressive owed to the intimate nexus of its walls and the powerful vegetation… Completely removing the vegetation would destroy that bond” [63].
Historical satellite images of the 21st century prove useful for documentation of a significant change in forest cover at La Fortaleza. As shown by Figure 22, the area covered with tall vegetation decreased approximately 30% between 2005 and 2022. More dramatic changes can be seen by comparing present conditions in forest cover to aerial photographs from 1995 (Figure 20) and 2000 (Figure 1), when most of the platform was densely covered by vegetation, except for deforested areas around the entryways and special buildings.
The management of heritage sites is a compromise between protecting the built heritage and its natural context [99], yet the changes observed (Figure 22) in forest cover at La Fortaleza presumably affected the ground’s direct exposure to rainfall, permeability and absorptivity. Regarding the protection of built heritage at Kuelap, a distinction must be made between problems with the vegetation growing on walls, and the vegetation growing on the surface. On the walls, roots penetrating and expanding cracks accelerate their destruction. Water may accumulate in such cracks and, in climates like Kuelap’s where temperatures may fall below 0 °C, the effects of the water’s freezing and expanding further weaken wall masonry. On the other hand, every conservator can cite examples where old-growth root systems have become integrated with masonry and even contribute to stabilizing a wall. This applies particularly to walls with earth or clay mortars, or dry masonry constructed without mortar. Therefore, it is even recommended that:
No attempt should be made to remove woody root systems from within the masonry of the monument until the plants have died and a decision can be taken on the best way of dealing with them. In some cases, it may be less damaging to leave the dead root systems within the walls than to dig them out”.
[99] (p. 45).
Thus, while vegetation growth on the walls of La Fortaleza should be prevented or at least minimized, in the case of old-growth already firmly rooted in the structure, a thorough analysis of the potential effects of removal is recommended. Perhaps the most damaging and still-common action undertaken is the reckless stripping of vegetation rooted in mortar between stones. As consequence, some or all the mortar attached to the roots is pulled out along with the vegetation, thus further destabilizing the wall. In all cases, analyses must also consider chemical interactions between the vegetation and building materials, in particular where masonry consists of sedimentary rocks (mainly sandstones and limestones), such as in La Fortaleza [50,100].
The problem of vegetation control is equally complex where trees and shrubs grow on surfaces between the walls. Effects depend on soil conditions, especially structure and compaction, and the periodic variability of moisture, but mostly on the individual properties of each tree species. The configuration of tree root systems can accelerate rainwater infiltration [101]. However, a species’ characteristics can limit the depth of penetration. The form of the root system (tangled, spreading, or heart-shaped) and the structure of the root matter (coriaceous and compact, or spongy) are important features to consider.
Another factor to ponder, both for vegetation growing on walls, as well as on site surfaces, is the mechanical impact of wind. Wind exerting pressure on tree crowns can displace trunks and surrounding soils up to several centimeters at its base. Depending on the soil type, this causes temporary or permanent deformations of the ground surface, disturbance of subsurface archaeological contexts, and increased infiltration of rainwater. The effect will depend on many factors: forces affect the posture of the trunk, such as wind speed and the spread and height of the tree crown, the tree species (its mechanical properties and the type of root system). The likelihood of these trees toppling can be mitigated by nurturing and managing forest islands at less exposed locations on La Fortaleza’s surface. Management would entail fostering the development of small-scale ecological systems to provide more structural support and greater resilience for each tree.
Despite the lack of in-depth interdisciplinary study of plant and tree growth dynamics, Alvarez [10] (p. 54) recommended the complete removal of vegetation at La Fortaleza, which he considered damaging to the structures, and detrimental for processes of drainage, infiltration, and insolation. We contend that an interdisciplinary analysis of the potential effects of vegetation removal is required, and conservation initiatives must incorporate botanical expertise. Determination of whether trees are to be grubbed up or cut down is also essential. The infiltration rate of rainwater into the ground will probably increase to greater and lesser degrees in each case. The drying (shrinking) and rotting root systems left by tree cutting would leave convenient pathways for rainwater to penetrate the deeper layers of the fill, especially in the case of trees with taproot systems. Tree grubbing, in turn, disturbs the soil structure and archaeological contexts, and rainwater penetrates more easily into loosened soil layers. In each case, there is an unfavorable change in the hydric balance—less water flows over the ground surface and more water soaks in.
Last, but far from the least of important considerations during attempts at vegetation control are the effects of secondary growth that always follows deforestation and removal of old-growth vegetation. In virtually every case, the rapid colonization and growth of opportunistic, and light-demanding grasses and woody shrubs following deforestation will hinder or even defeat attempts to conserve a site such as Kuelap. The growth of secondary vegetation unleashes another round of surface and subsurface bioturbation, roiling the soils and possibly penetrating construction fill. In other words, the clearing of old-growth vegetation anywhere on the site potentially lessens the structure’s resilience. The inevitability of tropical forest succession demands in-depth botanical research in search of effective management practices [102].

4.3. Hydrological Analysis
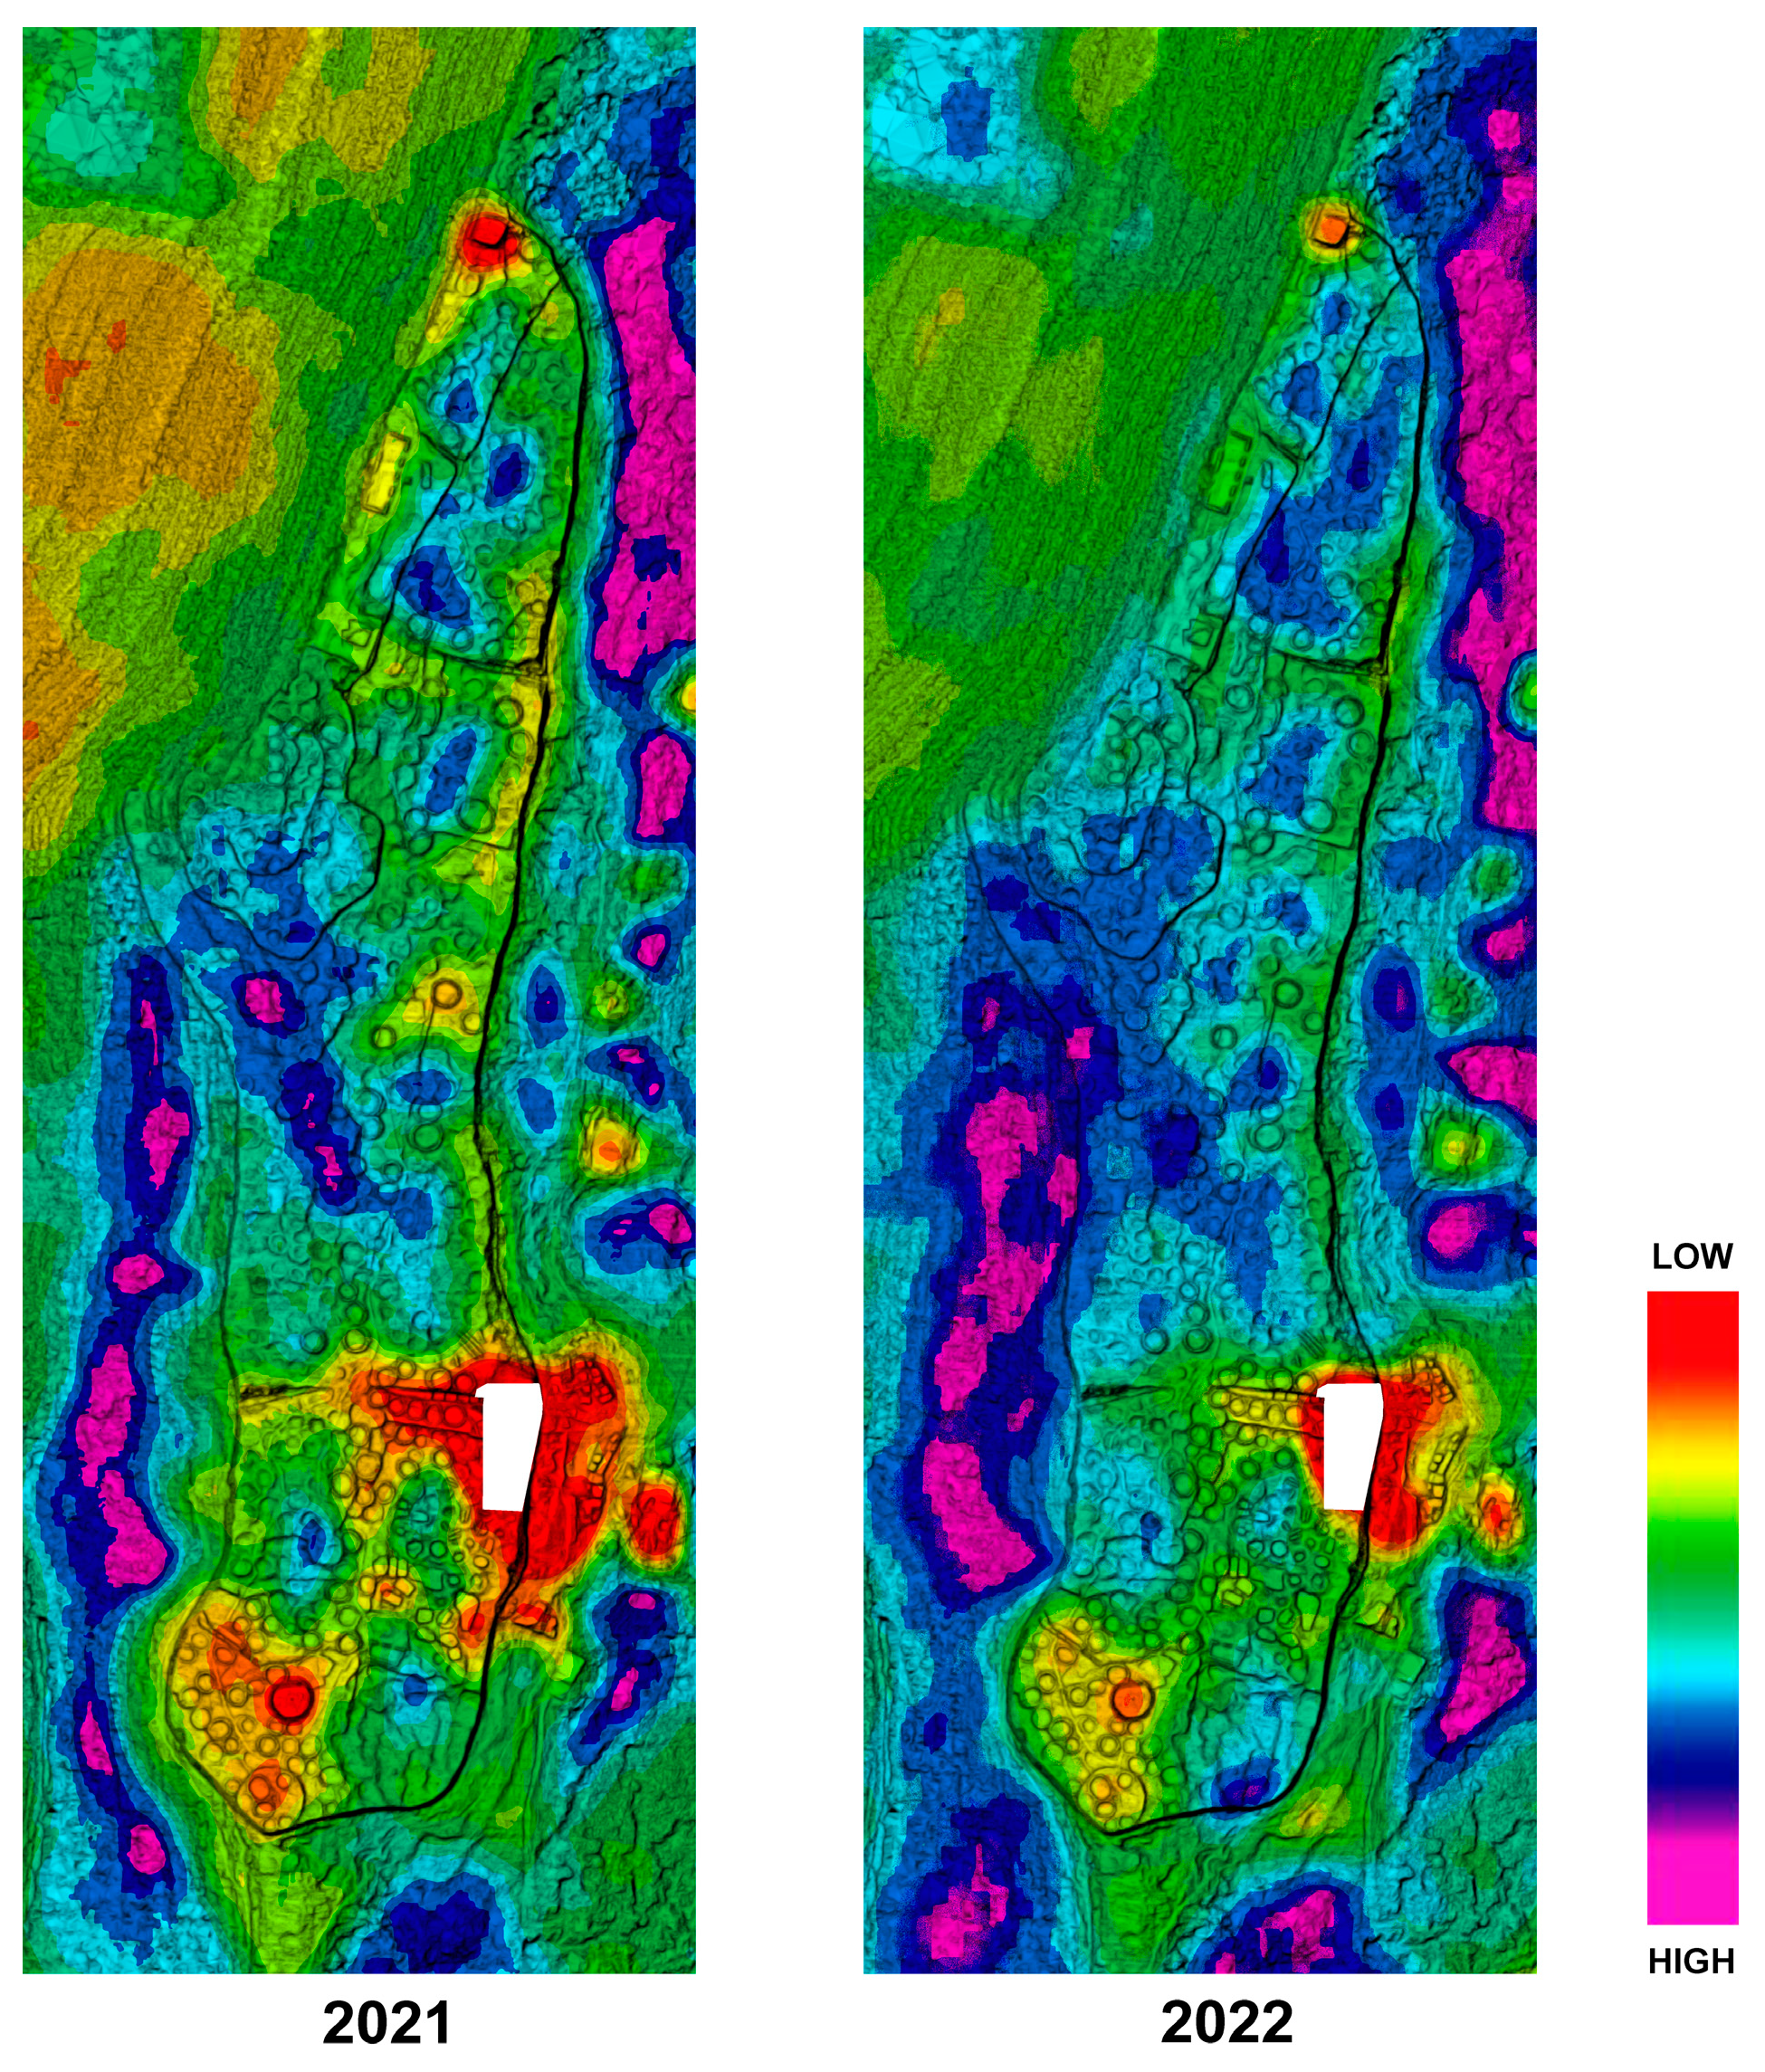
The purpose of these analyses has been to use a “hydrologically correct”, continuous, high-resolution DTM to delimit the margins and sizes of catchment areas, and to identify the directions and accumulations of surface flow networks. Hydrological analyses in a GIS environment allow identification of the catchment areas in relation to the drained area. Depending on the needs and scale of the study, analysis parameters such as the classification of the slope gradient or the size of the catchment area can be freely modified. A variety of analyses (Figure 23) constitutes the basic input for conducting further study, including development of risk maps that illustrate the impacts of rainfall on La Fortaleza. The software SURFER v. 22.3.185 [103] was also used to prepare these input data, as well as contour lines and cross sections through the terrain.
When the results of ERT surveys were plotted over the hydrological maps, we found good alignment between them. The layers of soil lying below local depressions and main rainwater runoff lines have a correspondingly higher level of humidity, as measured by a lower electrical resistivity value (Figure 15).

4.4. Risk Maps

Evaluation of the impact of precipitation on the stability of the fill and perimeter walls of La Fortaleza required preparation of a cumulative map with three essential risk elements: depressions (Figure 24A), surface water runoff lines (Figure 24B), and areas with an average slope of less than 5% (Figure 24C).
The cumulative results are shown in Figure 24D. These results are qualitative, not quantitative, due to the lack of data on the absorptivity of soil, infiltration rate, the nature of the ground surface, and consequently the surface water runoff rate dependent on these parameters. Lack of data prevents us from calculating the hydric balance and the areas of individual catchments. For now, we have conservatively calculated five risk classes. This cumulative risk map, and our other observations on the conservation conditions of La Fortaleza, provide a useful tool to guide short- and long-term mitigation solutions necessary to improve La Fortaleza’s structural integrity and permit its sustainable public use.
The NDWI allows for the estimation of soil moisture content and sheds additional light on this problem. Such data analyzed year after year, even if only qualitatively (Figure 25), are amenable to hydric balance calculations.

4.5. Results of Multitemporal Studies on the Area of the April 2022 Collapse

Special attention was paid to the area of the 2022 collapse. Several observations were obtained using various multitemporal datasets and methodological approaches.

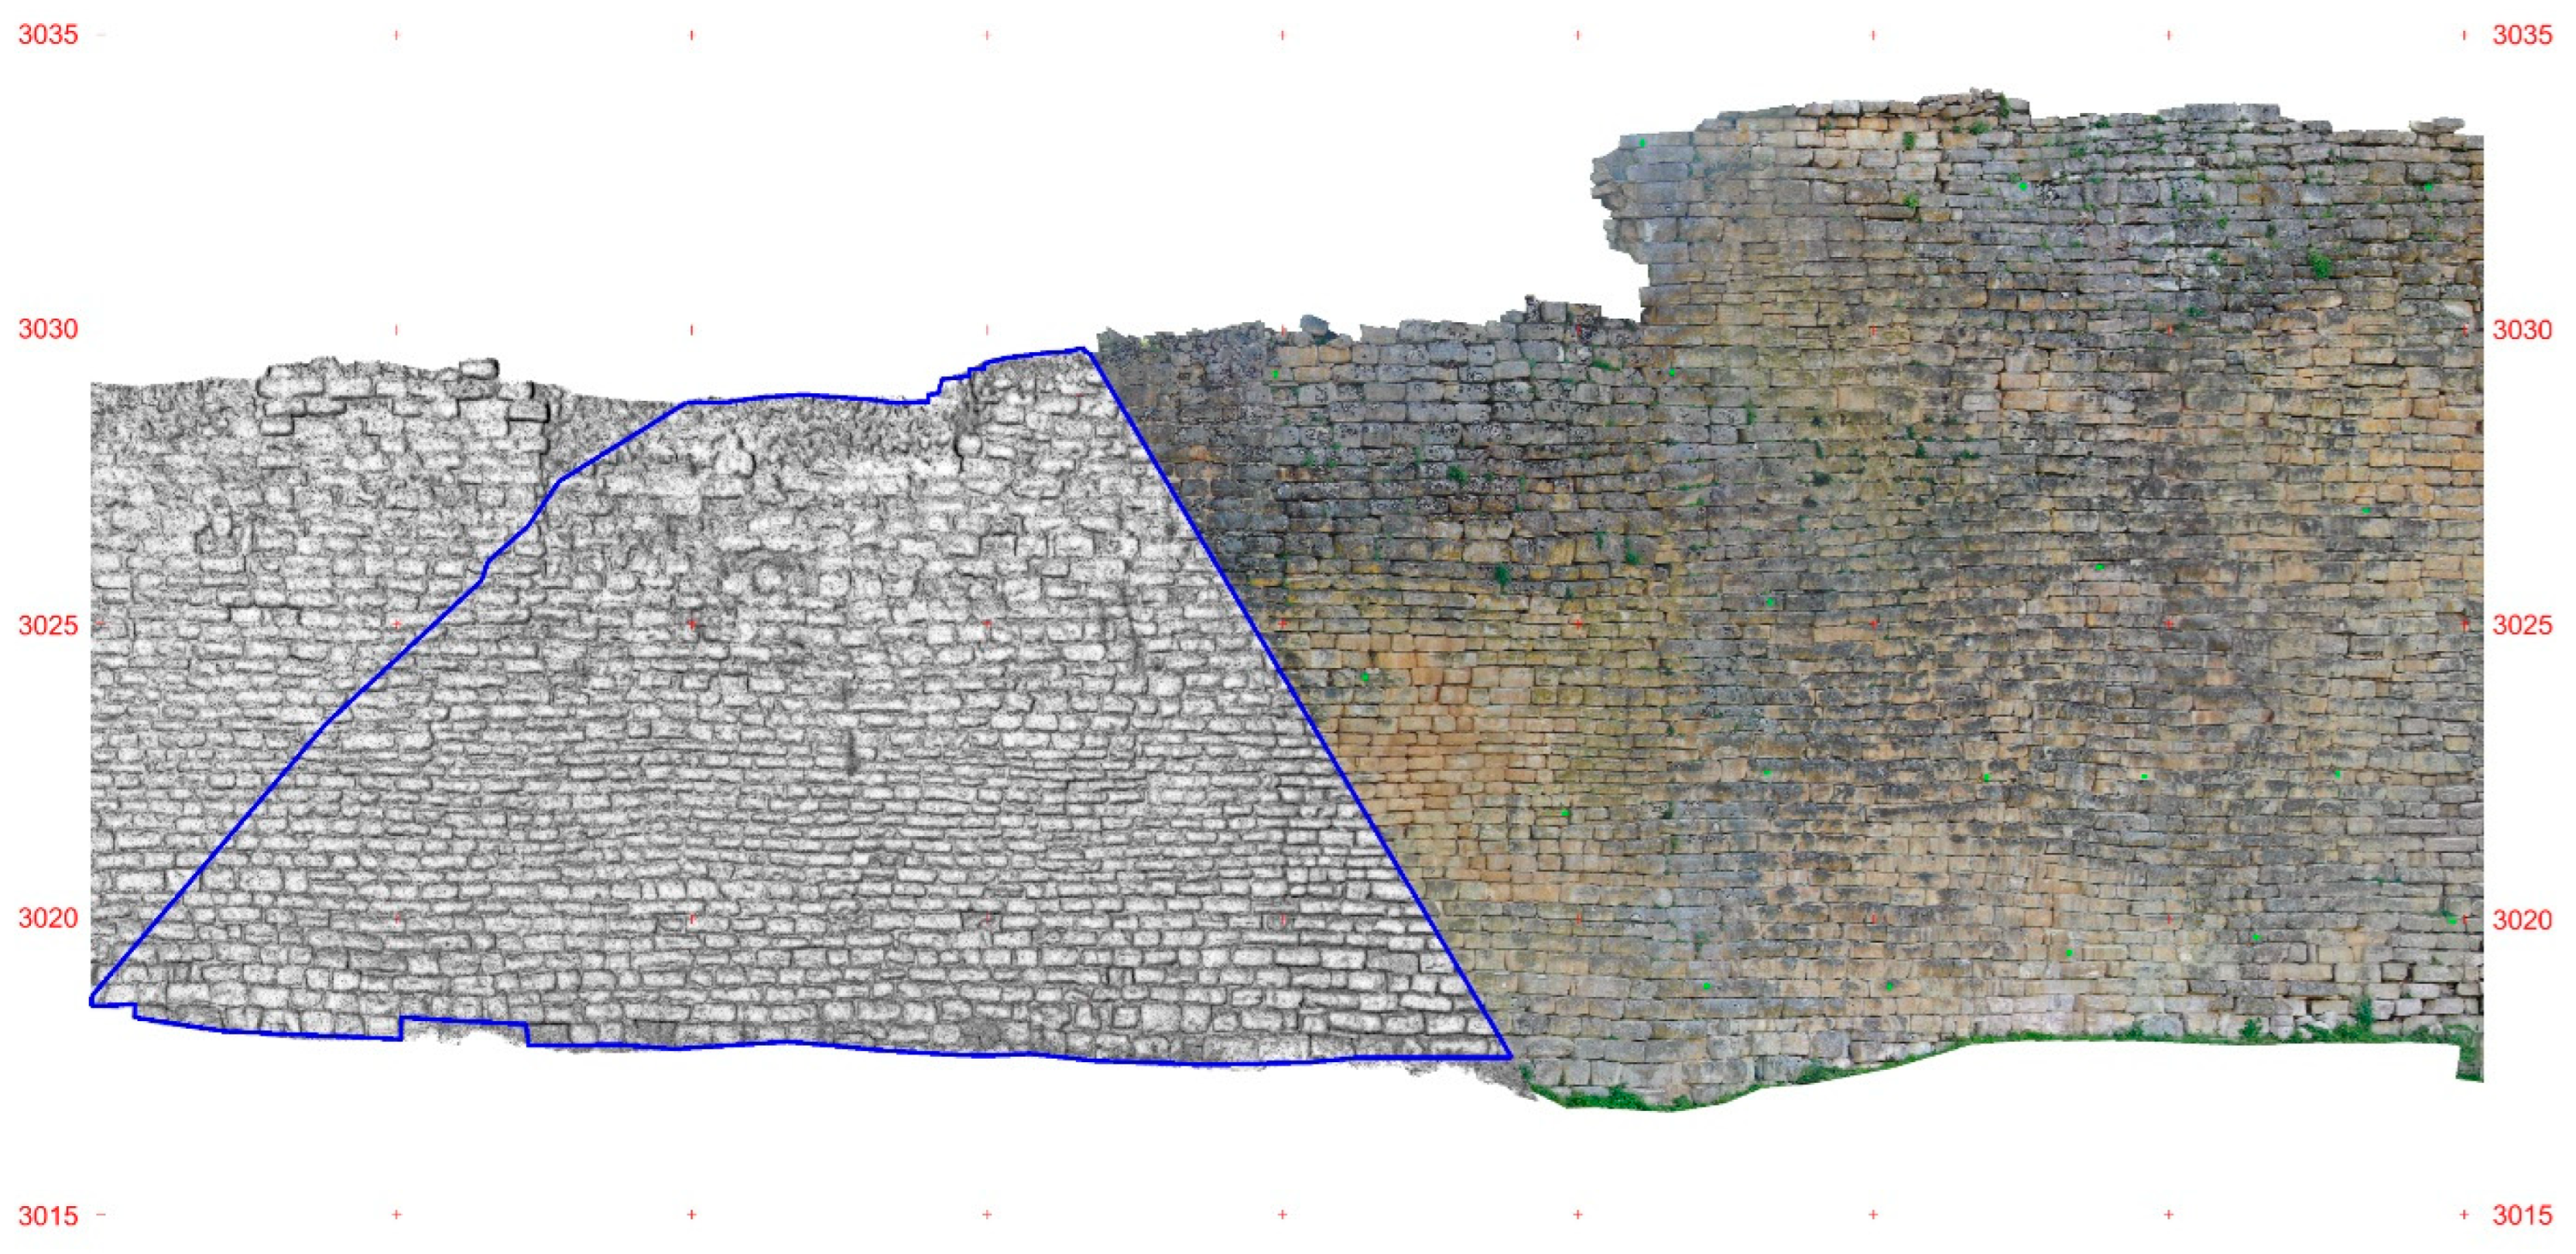
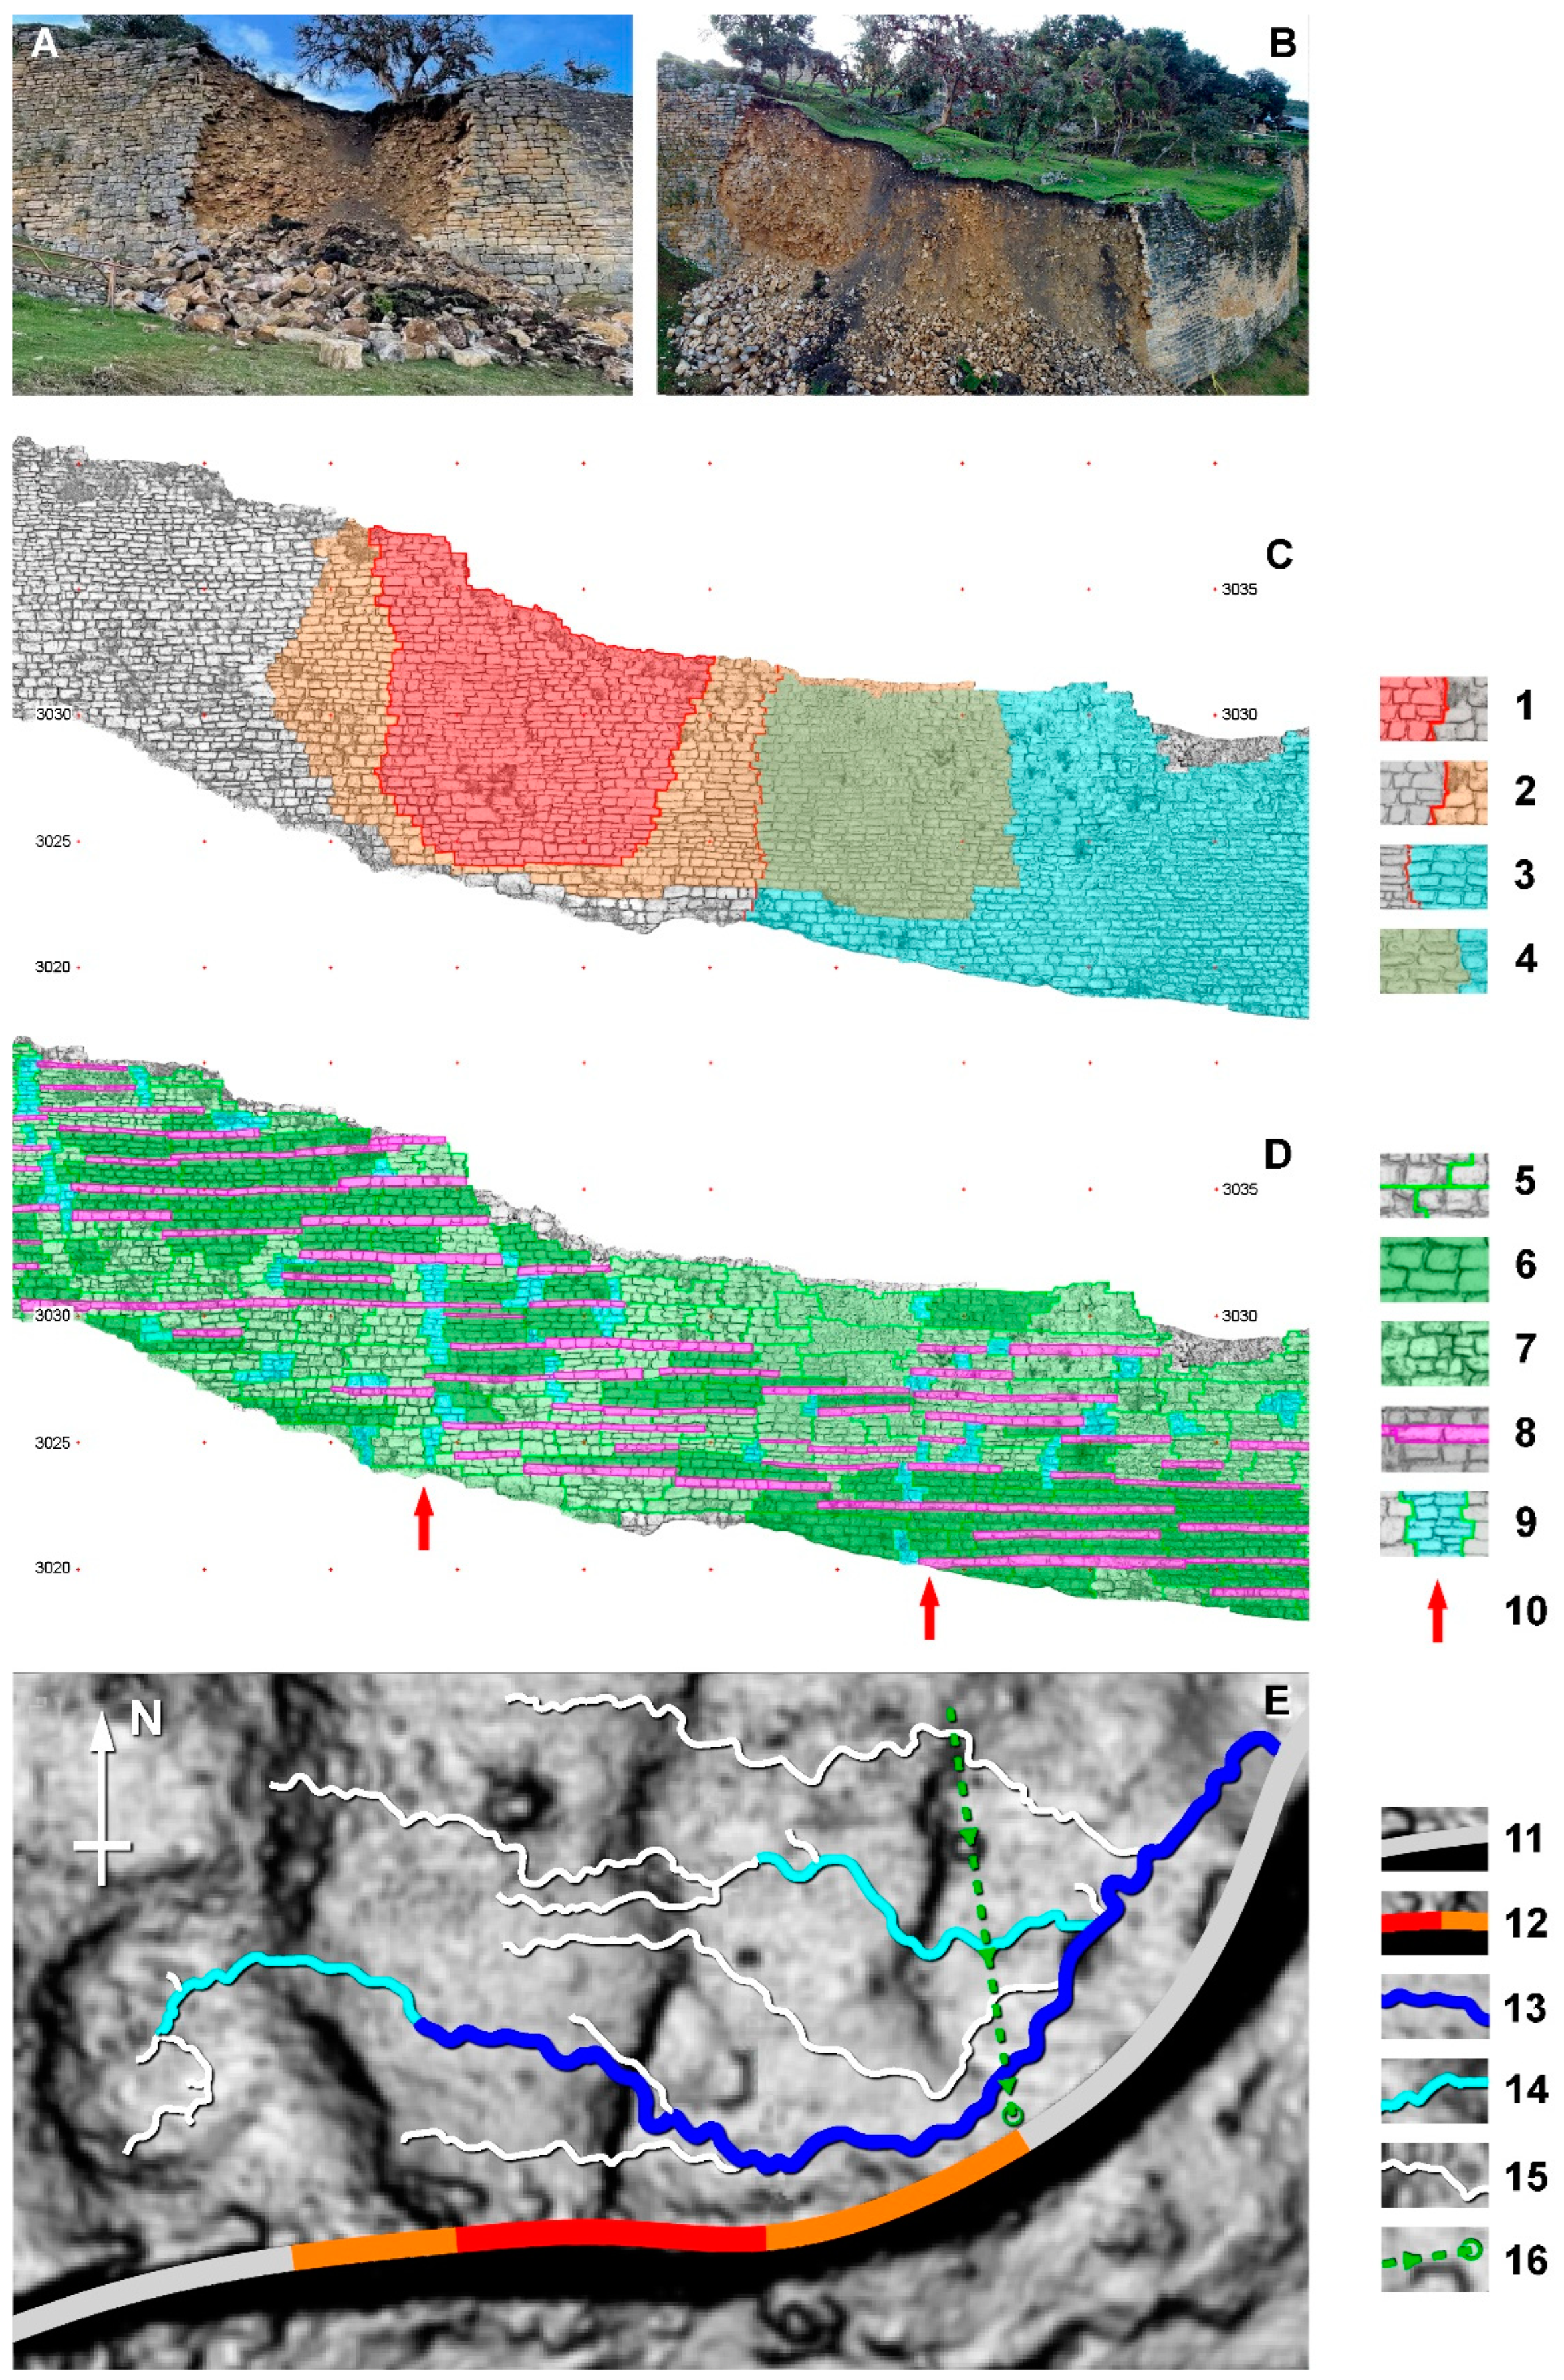
4.5.1. Techno-Morphological Study of the Perimeter Wall Collapse of 2022

During April 2022, a total of five subsequent collapses brought down a large part of the southern perimeter wall at La Fortaleza (Figure 26A,B). The first occurred on April 10th, directly west of the margins of part of the wall with contemporary conservation (repointed with modern mortar). Nearly 12 m of wall collapsed, and only 2–4 lower courses of stone blocks remained in situ (Figure 26C, 1). The area of damage was 116 m2, but an additional 80 m2 were weakened. This led to subsequent collapses, progressing towards the east, and the total area of destruction reached 285 m2 (Figure 26C, 2), including nearly 85 m2 of the repointed wall (Figure 26C, 4). The mean thickness of the stone wall is 0.68 m, as calculated from 15 randomly chosen facade blocks, which results in 193 m3 of fallen wall face. Thanks to the unrolling of the 3D model from TLS data, we reconstructed the arrangement of blocks in the missing part of the wall and proposed first estimates of techno-morphological studies (Figure 26D).
The southeast quadrant of the perimeter wall is extremely heterogeneous, and individual segments can be distinguished. They may correspond to a complex sequence of technological and/or chronological phases (Figure 26D, 5). At present, it is not possible to determine the chronology of events leading to development of a Harris matrix for this wall, as in the proposed methodology for techno-morphological studies [94] (Figure 17.5; 17.15; 17.19). Nevertheless, we have several observations of interest from both the point of view of Chachapoya building techniques and relevant to understanding the 2022 collapse.
Four separate kinds of stonework can be distinguished. The first represents coursed masonry (Figure 26D, 5). Its stone blocks, typically 24–48 cm high, are well shaped and laid in almost horizontal 2 to 4 courses with tendencies to use blocks of similar height within one layer. These uniform segments of stonework occur mainly in the upper eastern section and the lower western section of the studied wall. Their lengths in the western part measure up to 16 m, and in the eastern part, they exceed 22 m. These segments of masonry can be interpreted as the work of well-organized stonemasons and perhaps the remains of a primary construction stage. Other fragments of this stonework type are irregularly scattered over the rest of the wall. They occur in sections approximately 3.5 m long, which may correspond to the width of the front work of a small stonemason team. For now, we cannot determine whether these are the remains of a primary stage of construction of this wall, or repairs done by organized stonemasons.
Sections of coursed masonry sometimes border with sections of uncoursed stonework (Figure 26D, 7). In the latter instance, adjacent blocks have different heights, ranging 13–65 cm. Such stonework occurs in sections 0.6–1.3 m high and 2.5–5 m long and can be postulated either as belonging to a primary stage of construction of the wall section, or as subsequent repairs.
Long sections of wall are built over a layer of ashlars (Figure 26D, 8). Their lengths extend up to a dozen meters, and they usually overlap fragments of coursed and uncoursed masonry. The height of the stone blocks used in these layers varies from flat slabs 9 cm thick to ashlars 35 cm high; however, within one layer, the height differences are small, so that their upper surface forms a common plane. We interpret this as leveling layers, merging the underlying stonework fragments and equalizing the upper working surface. The vertical distance between such layers ranges 0.5–1.2 m and averages 0.8 m, matching the height to which even a heavier stone block can be comfortably lifted.
The vertical distribution of these layers probably corresponds to building stages of the perimeter wall: work would have been carried out on the inside, and as it progressed, the backfill would have been raised to minimize the height to which the stone blocks had to be lifted. Thus, if uncoursed masonry is adjacent to fragments of coursed masonry and at the same time covered with a leveling layer, we can propose that it belongs to the original construction stage. Otherwise, they could be traces of repairs.
The last type of stonework consists of scattered small irregular patches (Figure 26D, 9). Their width is 1–2 m, and their height usually does not exceed 1.5 m. The choice of stone materials is based on expediency, and their horizontal joints do not correspond with bordering fragments of masonry. These are either filling of gaps left between larger sections of works or traces of repairs that appear to have been made ad hoc. The concentration of these patches on the margins of the collapse from April 2022 (Figure 26D, 10) marks a zone where there would have been previous stability problems, and the whole wall section was already weakened (see Section 4.5.3).
The techno-morphological analysis of multitemporal IBM and TLS data allowed us to reconstruct the arrangement of stone blocks in the collapsed part of this wall, revealing its alignment with the margins of the collapse and the location of pre-Hispanic repairs and contemporary repointing as we will show in the following sections.

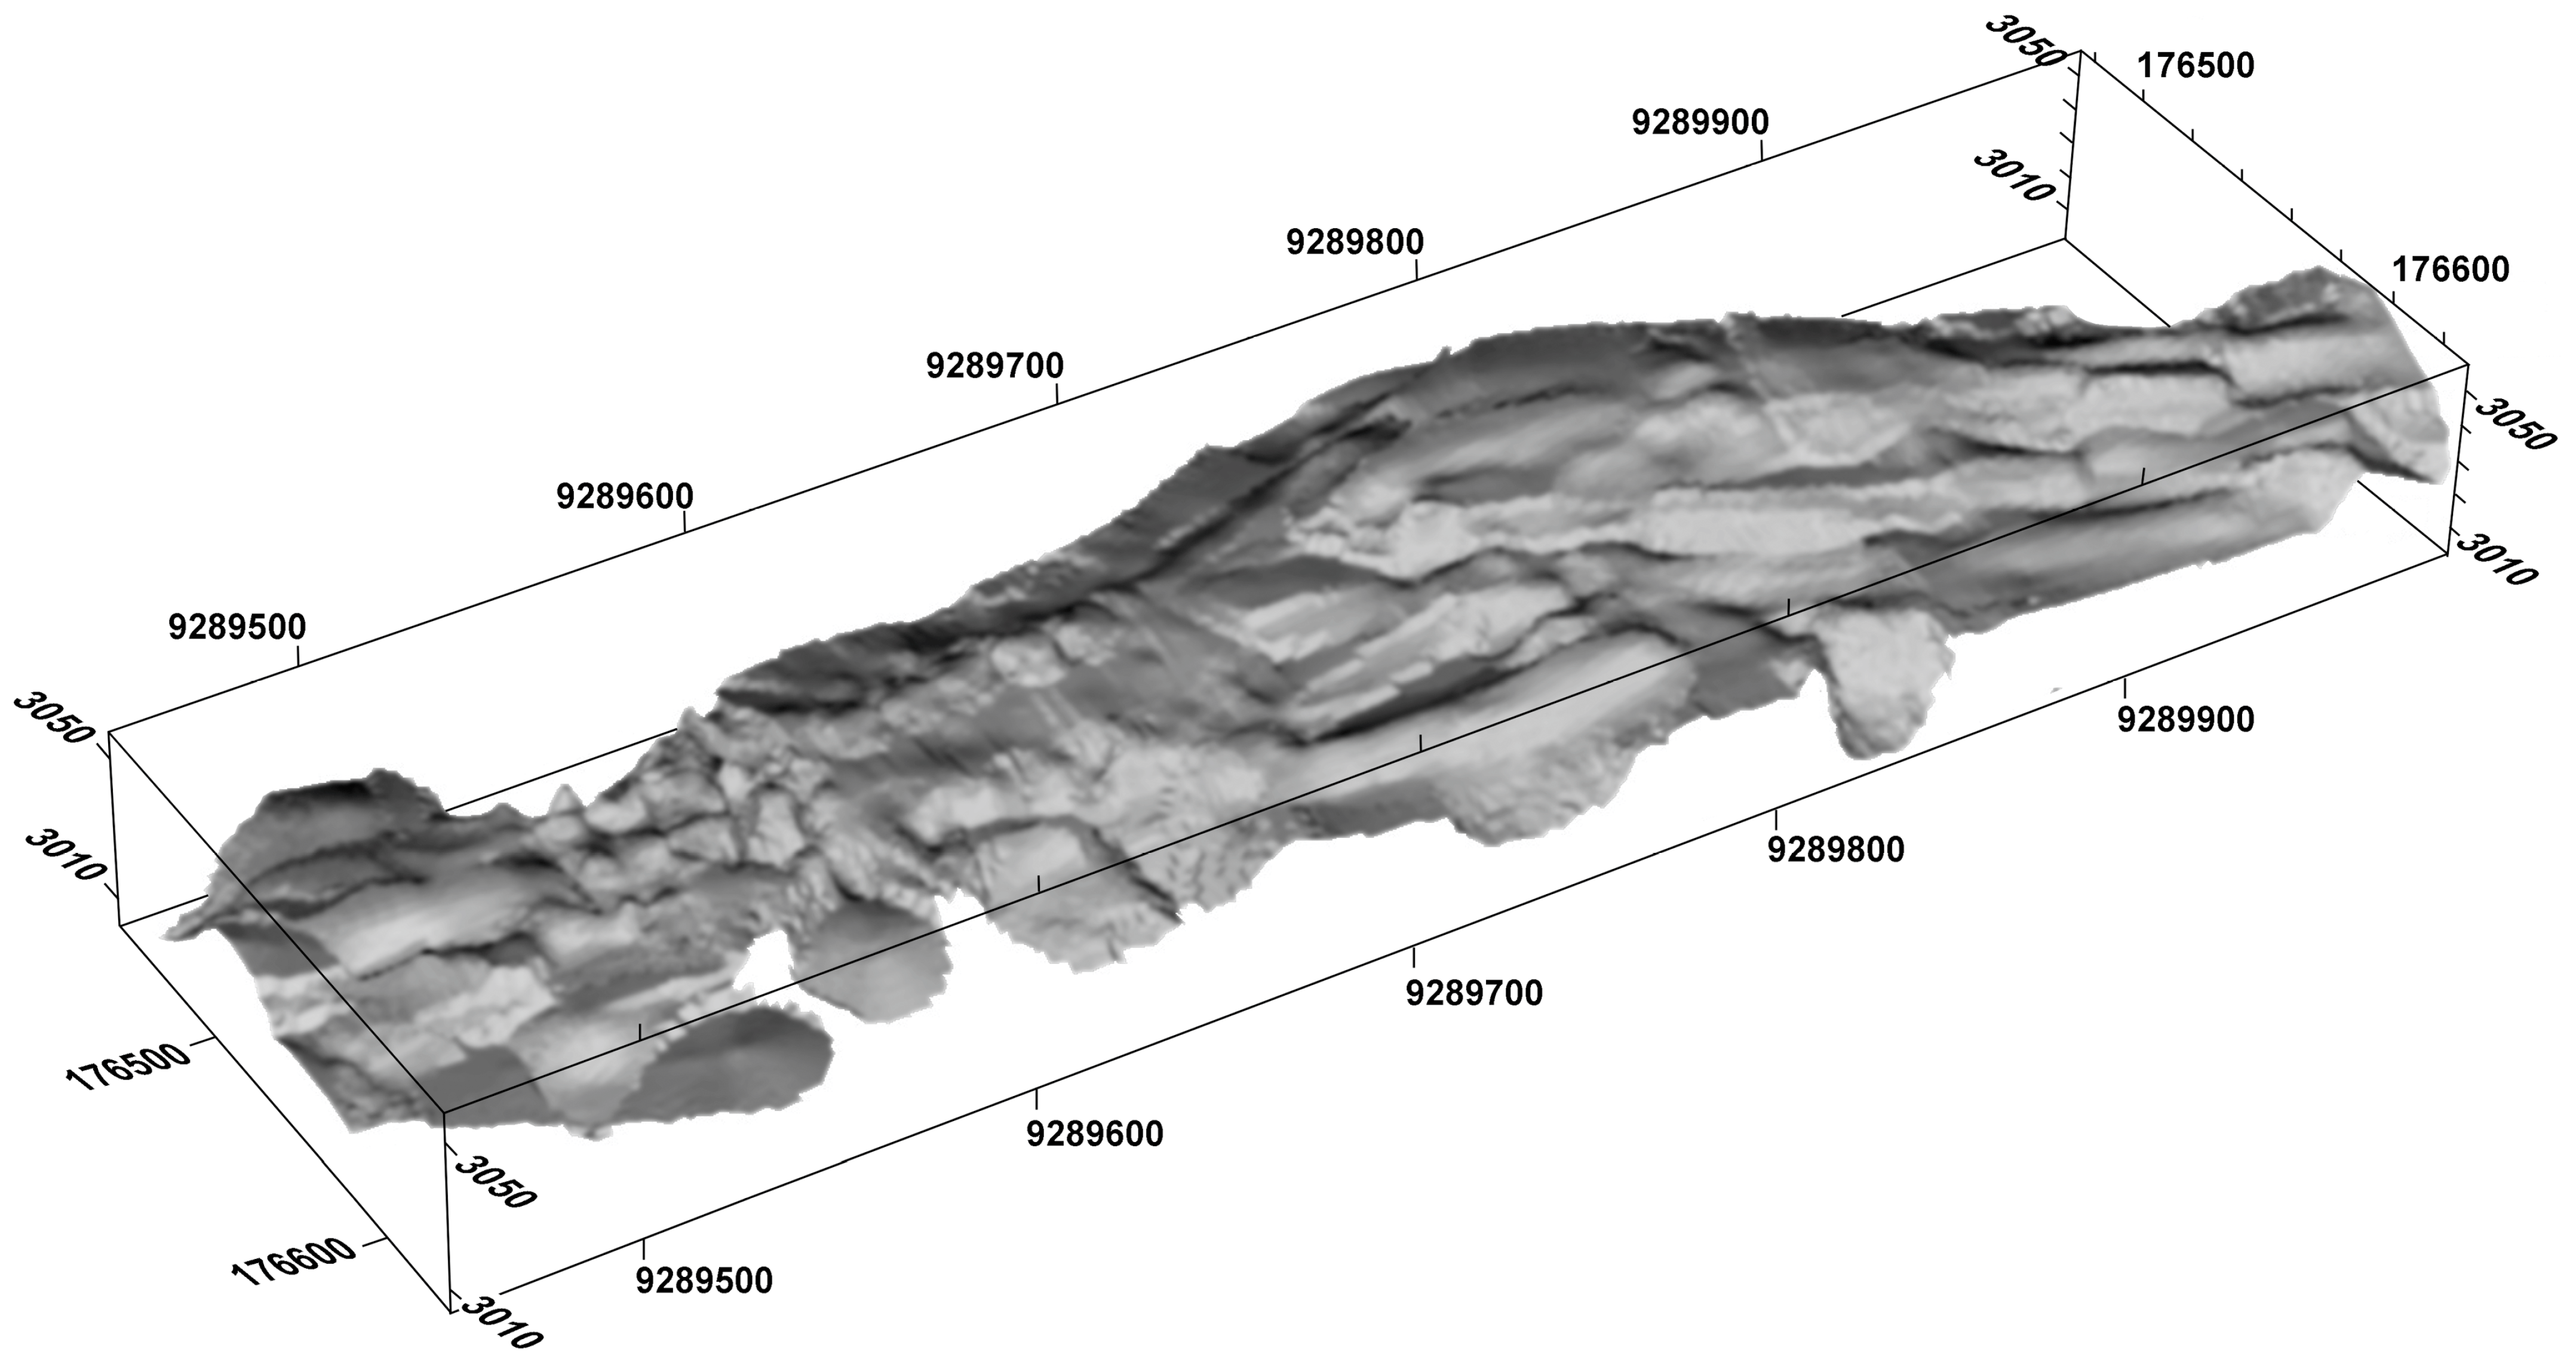
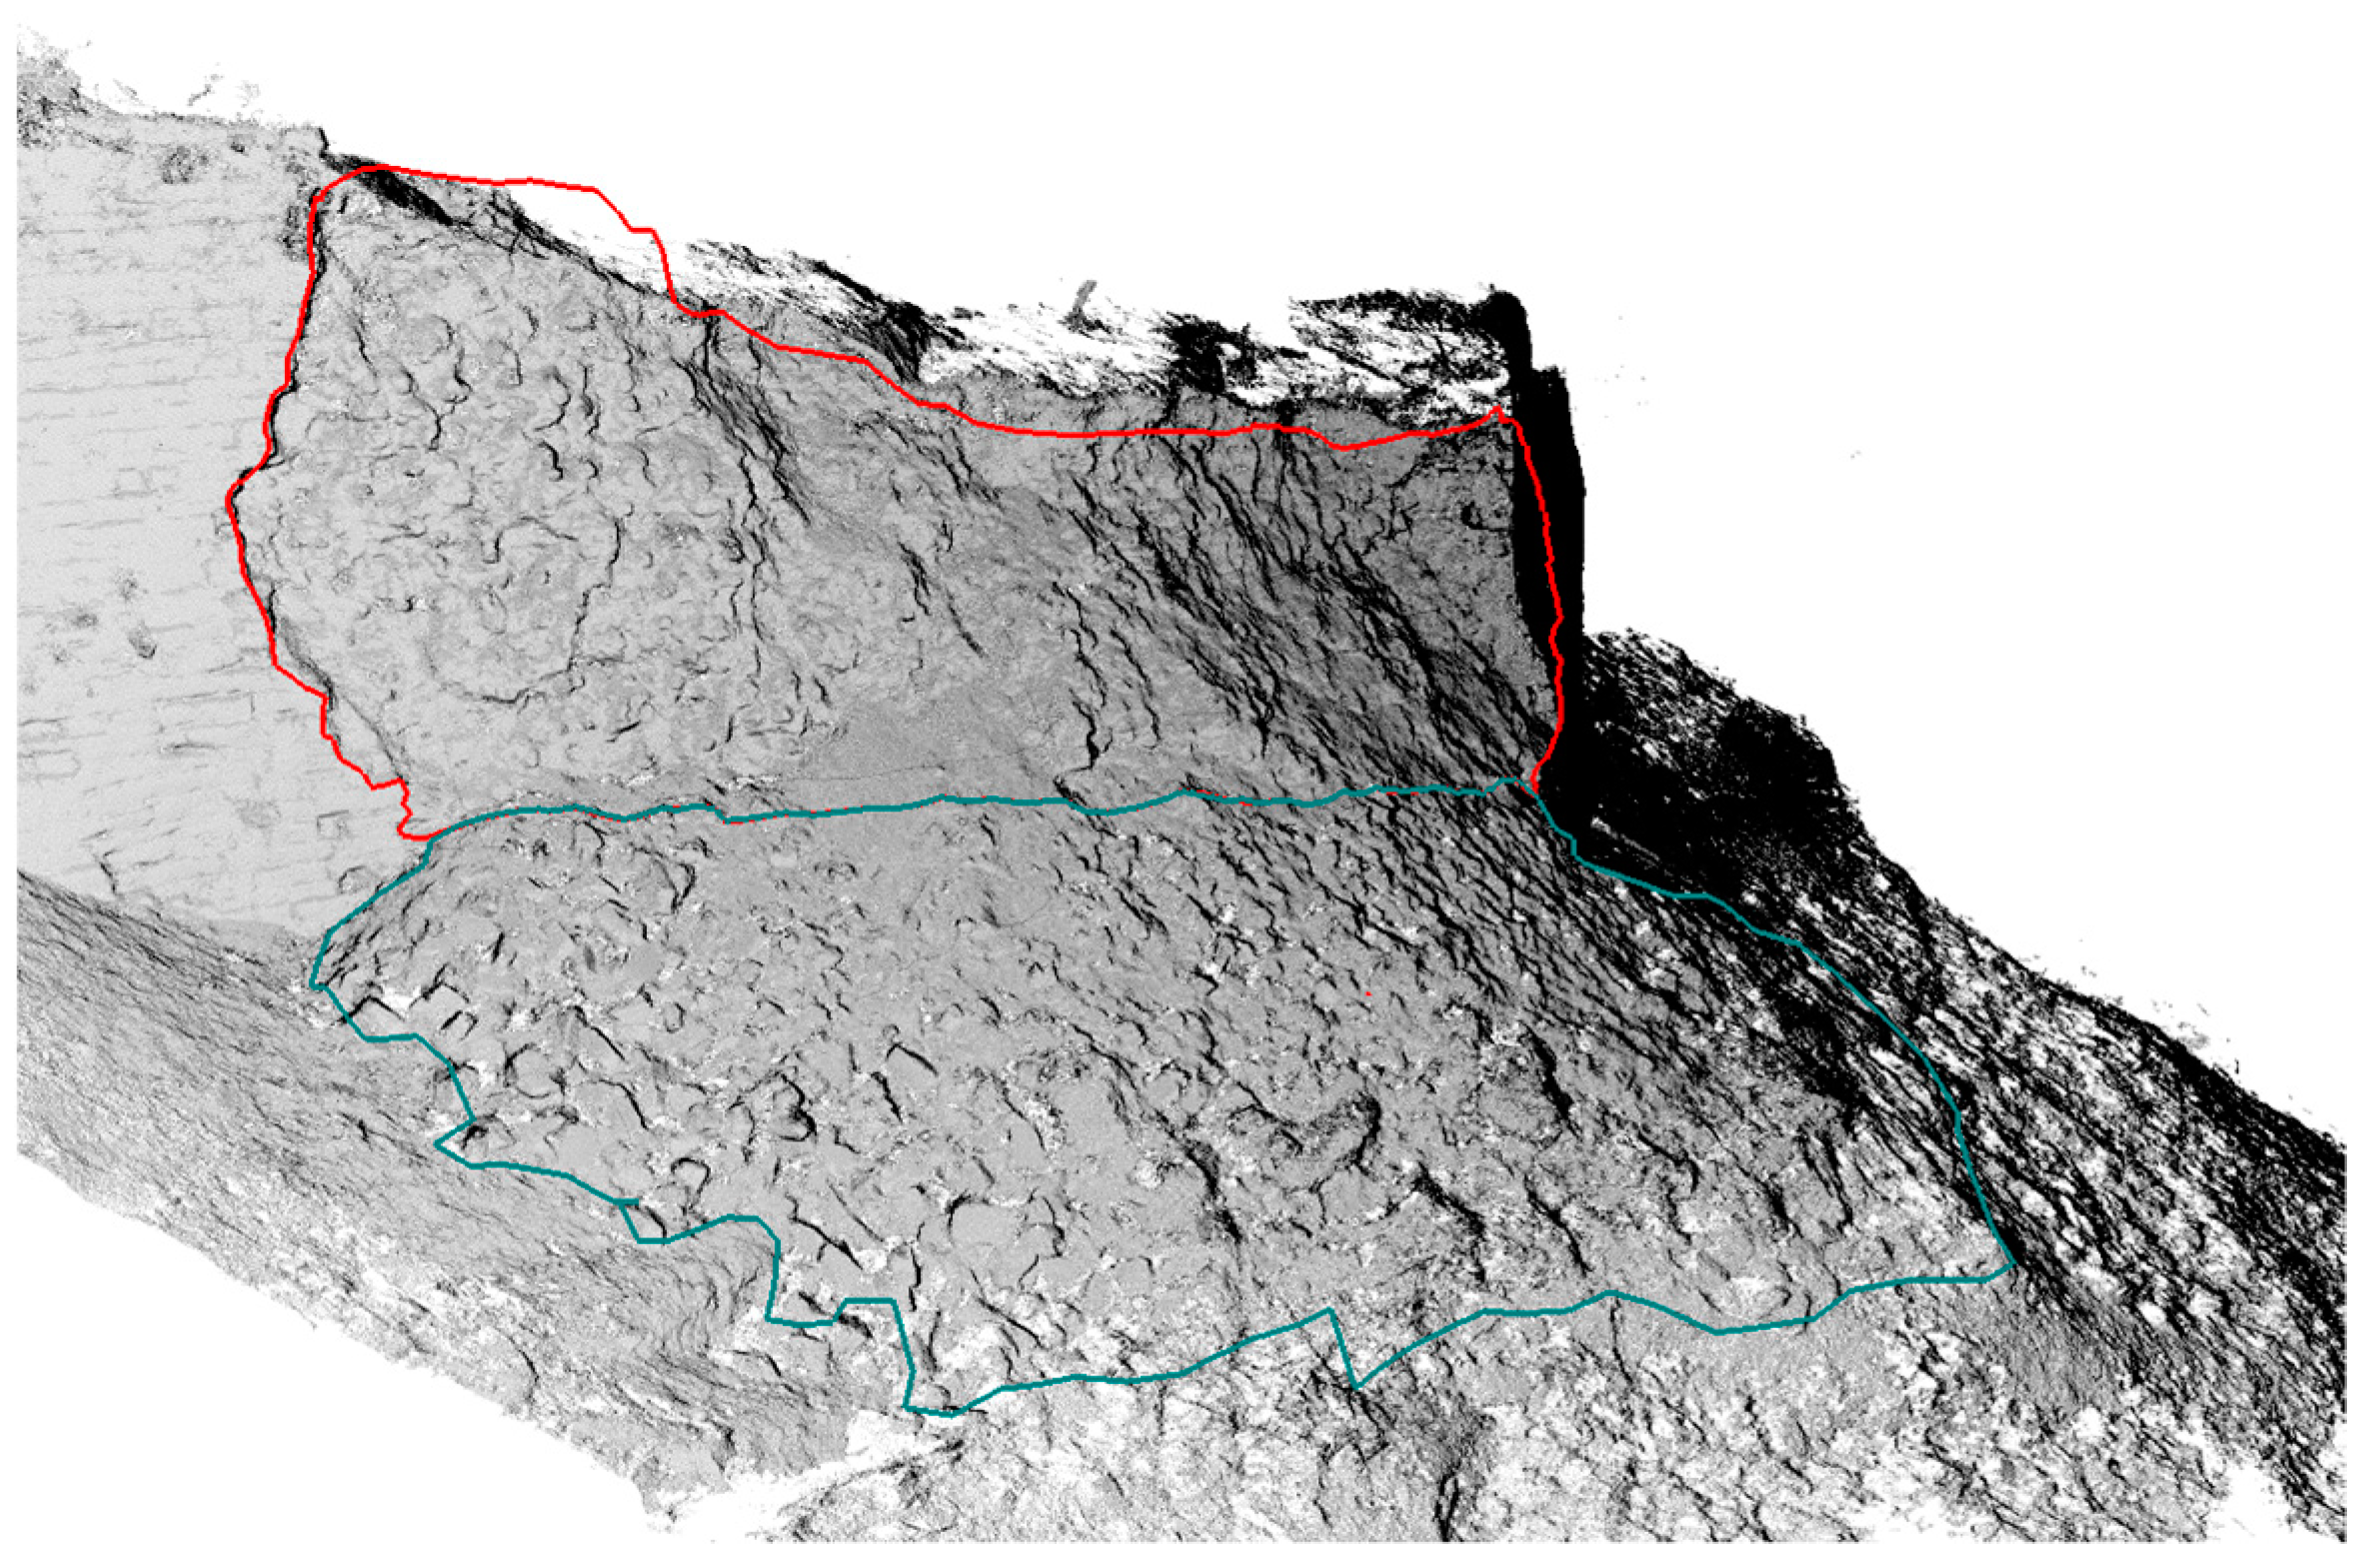
4.5.2. Estimations of the Collapsed Volume

Using integrated TLS and IBM data, Kucera calculated the collapsed part of the perimeter wall of La Fortaleza as an overall mass movement of 466 ± 25 m3 (Figure 27). Using Kościuk’s calculations of the volume of the stone masonry and fallen structure, the fill that slid together with the wall face would have consisted of approximately 273 ± 25 m3.

4.5.3. A Reconstruction of the Pre-Hispanic Sequence of Events in Las Terrazas

La Fortaleza’s surface area above the sequence of 2022 wall collapses labeled Las Terrazas in site plans, is described as terraced and sunken in relation to the Templo Mayor and purportedly lacks additional constructions because of its ritual function [49]. We have already mentioned a pre-Hispanic collapse on the eastern end of this sector where evidence suggests an affected surface area of 210 m2. The signs of destruction recorded on DTMs and photographs indicate that in pre-Hispanic times a collapse greater than that of 2022 affected at least 1250 m3 of the perimeter wall and corresponding fill. Its rebuilding left marked differences between the original and repaired segments (Figure 28).
Above the rebuilt portion of the wall, Las Terrazas lies much lower than the surrounding zones (red, yellow, green colors in Figure 29A). In the higher ground, named here Area I, well-preserved Chachapoya round buildings and one Inka rectangular construction are visible. The upper part of Las Terrazas, Area II (yellow, green, cyan in Figure 29A), shows previously undocumented circular depressions, probably the remains of Chachapoya buildings (Figure 29, 4), and some straight edges with a northwest orientation, perhaps archaeological excavations [71,104]. The steep step between Areas I and II was secured in the past at the northwest corner of Las Terrazas by 1.5 m high retaining walls, to hold the ground under the Inka building (Figure 29A). These observations indicate that this collapse occurred before these Inka renovations.
The angle of the splinter wedge of the 2022 collapse is 57° (Figure 29B, 1), as opposed to the 11° slope of Area II’s surface (Figure 29C, 3), or landslide debris at the foot of the 2022 collapse, accumulated at an angle of 26° (Figure 29B, 2). Therefore, the current slope of 11° in Area II cannot be the result of a landslide. These values reveal a characteristic pattern: the splinter wedge angle in the range of 55 +/− 10 degrees is also visible on other collapses at the site, and the slopes in a range of 10° are typical in many areas. The horizontal extension of the splinter wedge is approximately 4.2 m (Figure 29B).
The lowest zone of Las Terrazas, Area III (blue, navy blue, Figure 29A), lacks traces of earlier buildings. As detailed above, its perimeter wall was once rebuilt. If this indicates that a collapse occurred in the past, and we assume that the split wedge angle was similar, then the horizontal extent of the landslide would be 6.5 m. Thus, its hypothetical margins coincide with the visible ground edge of the deepest part of Area III (Figure 29A). These are probably traces of a collapse that was not fully refilled when the wall was rebuilt.
Area II slopes eastwards at 11°, lowering the possibility of past landslides. But there are numerous imprints of the foundations of circular buildings (Figure 29A, 4). Save for one imprint on the north margin between Area II and Area III, they were sufficiently distant from Area III to not have been swept away by the pre-Hispanic collapse. Thus, they may be interpreted as evidence of the intentional lowering of the terrain that accompanied building demolitions. Contrary to the ritual interpretation of Las Terrazas, this part of the platform was more likely regarded as dangerous and consequently vacated.
The superposition of Inka buildings over dismantled Chachapoya constructions (Figure 29A), differentiated by stratification and stonework, indicates that the renovation of the northwest part of Area II dates to the Inka occupation. The renovations were concentrated on that place, yet a single circular ground imprint on the margin between areas II and III would represent a Chachapoya building affected by the collapse, not a demolition (Figure 29, 4). Thus, the pre-Hispanic collapse might date to pre-Inka times although additional evidence is currently lacking to evaluate this possibility. The lowering of Area II may result from earthworks carried out during Inka construction activity in Pueblo Alto. Some of the fill material possibly removed from Area II (under 5000 m3) could have been used to fill the landslide in Area III (under 1250 m3), and the rest, together with material from the possible demolition of buildings, may have been used in Pueblo Alto. Dating the reconstruction of the perimeter wall after its collapse (Figure 28) is uncertain, although the minimal variation in the stonework between the original and the rebuilt sections suggests a Chachapoya date.
The research described in this section reveals stability problems in the southeastern portion of La Fortaleza since pre-Hispanic times. Despite ancient and contemporary attempts to solve them, structural problems continued up to the present and were an important factor in the collapse of the southern perimeter wall of 2022.

4.6. Problem of Contemporary Repointing of the Perimeter Wall

From a restoration and aesthetic perspective, the past decision to repoint the perimeter wall of La Fortaleza is questionable. By the principles of conservation, modern treatments applied to the historical structure of a wall should use methods and materials similar to the originals, and should not change its visual appearance. Instead, the repointing between blocks on the facades of La Fortaleza resembles modern reinforced river embankments more than the stonework of Kuelap’s builders who used clay-earth mortars.
The grain size curve of the mortars used in contemporary repointing (Figure 30B) differs considerably from the original mortar (Figure 30A) and is closer to clay-loam soils (Figure 30C) than to what is recommended for contemporary buildings (Figure 30E). In the original mortar, 20% of the grains range 5–40 mm, yet this fraction is practically absent in the conservation mortar, with 75% of grains under 5 mm, and half smaller than 0.5 mm. Unlike the original, this composition results in a very tight mortar, which prevents infiltrated rainwater behind the perimeter wall from seeping through. Eliminating unsightly streaks on the face of the wall may have been an aesthetic goal, but the practice led to the accumulation of water behind the wall, as revealed by the differences in water percentage measurements from the mortar samples [71]. As a result, the moist, plasticized fill presses on the perimeter wall. So, it is not surprising that the 2022 collapse occurred on the border between the repointed and the original wall segments (Figure 26C, 3).
The lime in the conservation mortar does strengthen the wall. However, a basic conservation rule is that the mortar should have significantly lower strength than the material originally used to build the wall. Otherwise, an adverse stress distribution occurs, and cracks like those seen in stone blocks at La Fortaleza, are a consequence of this imbalance (Figure 31A).
Considering the aesthetic, restoration, and technical concerns above, we advise implementation of the same conservation methods used at Machu Picchu, where a slightly moist clay-earth mortar is firmly compacted in the joints between the blocks (Figure 31B). However, in the case of the nearly 20-meter-high perimeter walls of La Fortaleza and the harsh precipitation conditions, we recommend that every second vertical joint be left without mortar. This will enable the natural evacuation of rainwater that would accumulate behind the perimeter wall. However, such a solution means consenting to some unsightly stains that will develop on the walls. Proper micro-landscaping atop La Fortaleza, and a well-designed drainage system, would minimize these undesirable effects. The priority should be to keep the walls in good technical condition, while maintaining a historically accurate visual appearance to the degree possible.

5. Conclusions

We have presented evidence that leads us to conclude that the underlying cause of the collapse at La Fortaleza in 2022 was accumulated moisture within the fill enclosed by its perimeter wall. To arrive at this conclusion, we integrated available data from multiple projects, applying various close-range remote sensing and near-surface archaeogeophysical technologies to address the correspondence between surface rainwater runoff and soil moisture, and to identify problematic surface features and locations at greatest risk. In doing so, we arrived at the following specific conclusions:
  • Hydrological studies, confronted with topographical risks and ERT results, confirm that layers lying below both local depressions and main rainwater runoff lines tend to have a higher level of humidity.
  • The resulting risk maps point to several primary flow lines running along perimeter walls that cause the pooling of water directly behind them. Not surprisingly, the 2022 collapse occurred at such a location. Thus, our risk maps can guide interventions to improve La Fortaleza’s structural integrity and permit its sustainable public use.
  • Seismic refraction data indicate that the pressure of groundwater on the perimeter walls is intensified by the unfavorable arrangement of internal layers that are impermeable to water infiltration.
  • Hydrological and deforestation analyses based on satellite images show significant changes in tropical forest vegetation covering La Fortaleza and highlight the urgent need for an in-depth biological study to inform the management of this vegetation. Our analysis suggests that some past efforts to remove vegetation from La Fortaleza could have contributed to the current conservation crisis.
  • The integration of IBM and TLS data facilitates techno-morphological analyses, which provide a better understanding of the perimeter wall structure around the area of the 2022 collapse and shed light on the chronology of events.
  • Analysis of combined data from IBM, TLS, drone LiDAR survey, and ground-truthing identified a pre-Hispanic collapse in the same part of the southern perimeter wall affected in 2022, demonstrating that the adverse conditions in the area of La Fortaleza called Las Terrazas had been present for centuries, and were an important factor in the 2022 collapse.
  • Comparison of IBM, TLS, and drone LiDAR data collected before and after the 2022 collapse allowed us to calculate the volume of fill and stone involved, providing a basis for planning a future restoration.
  • Multitemporal analysis of IBM and TLS data allowed a reconstruction of the arrangement of stone blocks in the collapsed part of the perimeter wall, revealing an alignment between pre-Hispanic repairs, contemporary wall conservation (repointing), and the margins of the 2022 collapse. The association between the boundary of contemporary repointing and the western edge of the collapse suggests that different methods should be used in future conservation, avoiding a mortar that actively prevents rainwater infiltrated into the ground from draining through the perimeter wall.
From these points, we can draw more general conclusions about the causes of the 2022 collapse. In addition to the evidence of pre-Hispanic failure and repairs, and the nature of the interior layers of the platform, the topography of the collapsed section of La Fortaleza is revealing. The most devastating factor triggering slope failures is rainfall infiltration [105,106]. In the collapsed area, unfavorable surface slopes have resulted in the concentration of the main rainwater flowlines along the perimeter wall. In turn, this pattern has caused water to seep into the deeper layers of the fill alongside the wall, and to degrade the angle of natural ground slope—that is, the maximum angle at which the ground stays balanced on a slope. Consequently, the pattern has increased the pressure of the platform’s fill against its perimeter wall.
These adverse subsurface and surface conditions that probably existed over the long history of La Fortaleza, likely worsened because the modern drainage system had ceased to function without regular maintenance. In this case, the outlet of a drainage system that functioned to collect rainwater from Las Terrazas, a surface area of nearly 2000 m2, was placed directly behind the southern perimeter wall, further degrading the angle of natural slope. Water stains on the still-standing parts of walls (Figure 18 and Figure 26B) indicate that the outlet pipe leaked a significant amount of water into this area.
Thus, a conjunction of factors—unfavorable historical, subsurface, and surface conditions for drainage, contemporary repointing with a tight mortar, a failing modern drainage system, and anomalously high rainfall in the weeks prior to the 2022 collapse—led to collapse in this segment of the southern perimeter wall of La Fortaleza. In our view, La Fortaleza faces continued risks that are the result not only of ongoing natural conditions and processes, but also a series of well-intentioned, yet ultimately damaging conservation interventions.
Alongside this diagnostic assessment on a specific site, our study also demonstrates the potential of combining data acquired using various remote sensing technologies, collected by multiple teams on separate projects, to analyze and interpret a complex, multifactorial problem. These tools have allowed us to generate a more complete and nuanced understanding of past and present conservation conditions, as well as risk factors. It is our hope that they might be useful for aiding conservation efforts at other sites located in humid environments, particularly in the midst of increasingly extreme climatic conditions.
Two additional practical suggestions can be highlighted in closing. First, archaeological sites as important as La Fortaleza should be monitored. Currently, one of the most effective methods of site monitoring is to collect high-resolution IBM and TLS data to model site surfaces on a regular basis. These methods provide a relatively efficient way to detect in advance possible structural deformations and plan the necessary interventions. Key sites should also have detailed “stone by stone” documentation prepared by professionals who understand their structures. Carrying out conservation works based on schematic plans can lead to serious mistakes of interpretation and practice. A fitting aphorism would be, “An ounce of prevention is worth a pound of cure”.
Second, for sites located in such difficult conditions, conservation studies should ideally be carried out before tourism infrastructure is developed. In addition, even if previous studies are available, it is not advisable to immediately apply the resulting solutions on a large scale. It is safer to use test areas for experimentation where possible failures will not have dramatic consequences. The Kuelap archaeological complex includes pre-Hispanic sites that could be treated experimentally, so that conservators can develop a full understanding of how to preserve them without inadvertently triggering their deterioration.
Sites located in the Ceja de selva present unique conservation challenges, and more data are required to inform effective management of rainwater infiltration and dense vegetation on their surfaces and walls. Rather than continuing to wage a losing war against the tropical montane rain forest, we must learn to manage it for mutual benefit.

Supplementary Materials

The following supporting information can be downloaded at: https://www.mdpi.com/article/10.3390/rs16061053/s1.

Author Contributions

Conceptualization, I.G. and J.K.; methodology, I.G. and J.K.; investigation, I.G., J.K., W.C., P.V., B.Ć., P.B.D., M.K., N.M., G.R., S.S., J.C. and C.R.; resources, I.G.; writing—original draft preparation, I.G., J.K., W.C. and P.V.; writing—review and editing, I.G., W.C. and P.V.; visualization, I.G., J.K., W.C., B.Ć., P.B.D., M.K., N.M., G.R., S.S. and J.C.; supervision, I.G.; project administration, I.G.; funding acquisition, I.G. All authors have read and agreed to the published version of the manuscript.

Funding

Publication fees, postprocessing of LiDAR data, DTM creation, hydrological, deforestation, and satellite image analysis, risk maps, and fusion of IBM and TLS were funded by Instituto de Investigaciones Arqueologicas (Lima, Peru). Research on background sources and the reconstruction of a sequence of events in the collapsed area was supported by the “US Ambassador’s Fund for Cultural Preservation 2023”. Drone LiDAR data collected by Righetti et al. were supported by MEDS AMSTERDAM. Drone LiDAR data collected by VanValkenburgh et al. were supported by National Geographic Society Grant HJ-044R-17. The collection of TLS data by VanValkenburgh, Kucera, and Rojas was funded by Brown University, with support from the Ludwig Boltzmann Institute for Archaeological Prospection and Virtual Archaeology. Seismic refraction surveys by Mori were contracted by the Ministerio de Cultura del Peru. Some of our analyses and simulations were performed on the Laboratory of 3D Scanning and Modeling at the Department of History of Architecture, Arts and Technology of Wrocław University of Science and Technology, and at the Department of Environmental Protection and Development, Wrocław University of Environmental and Life Sciences. The work also received logistical support from the Centre of Andean Studies (Cusco, Peru).

Data Availability Statement

Data cannot be shared to unauthorized persons because of laws protecting Peruvian cultural heritage. The data presented may be available to researchers who meet the criteria for access to confidential data on request from the corresponding author.

Acknowledgments

Thanks is extended to the Ministry of Culture and J. Bastante, for their assistance with this research. Congresspeople Edward Malaga and Mery Infantes provided invaluable contacts with local authorities. Jindley Vargas, from Frente de Defensa de los Intereses de la Provincia de Chachapoyas, offered logistical support for photogrammetric surveys. Ivan Bardales, mayor of Nuevo Tingo, and Hotel Pumaurco in Chachapoyas gave support in kind. We are grateful for aerial photographs from Gordon Wiltsie and Martin Chumbe and drone photographs from Roger Vigo and Napoleon Vargas. We also wish to thank Stefan and Michaela Ziemendorff for their helpful comments.

Conflicts of Interest

The authors declare no conflicts of interest.

References

  1. Narváez, A. Kuélap: Una ciudad fortificada en los Andes nor-orientales de Amazonas, Perú. Arqueol. Arquit. 1987, 115–142. [Google Scholar]
  2. Ruiz Estrada, A. La Alfarería de Kuelap: Tradición y Cambio; Avqi Ediciones: Lima, Peru, 2009; p. 172. [Google Scholar]
  3. VanValkenburgh, P.; Cushman, K.C.; Castillo Butters, L.J.; Rojas Vega, C.; Roberts, C.B.; Kepler, C.; Kellner, J. Lasers without lost cities: Using drone lidar to capture architectural complexity at Kuelap, Amazonas, Peru. J. Field Archaeol. 2020, 45, S75–S88. [Google Scholar] [CrossRef]
  4. Bandelier, A.F.A. The Indians and Aboriginal Ruins near Chachapoyas in Northern Peru; Ripol Classic: New York, NY, USA, 1907; p. 51. [Google Scholar]
  5. Dionne, H. Indicateurs Géographiques et Culturels de la Culture Chachapoya dans le Secteur de Kuelap: Archéologie Spatiale et Évaluation du Potentiel Archéologique; Université du Québec à Chicoutimi: Chicoutimi, QC, USA, 2021. [Google Scholar]
  6. Righetti, G.; Serafini, S.; Brondi, F.; Church, W.B.; Garnero, G. Survey of a Peruvian Archaeological Site Using LiDAR and Photogrammetry: A Contribution to the Study of the Chachapoya. In Proceedings of the International Conference on Computational Science and Its Applications—ICCSA 2021, Cagliari, Italy, 13–16 September 2021; pp. 613–628. [Google Scholar]
  7. Guengerich, A. Settlement organization and architecture in Late Intermediate Period Chachapoyas, Northeastern Peru. Lat. Am. Antiq. 2015, 26, 362–381. [Google Scholar] [CrossRef]
  8. Mincetur. Sistema de Información Estadística de Turismo. Available online: http://datosturismo.mincetur.gob.pe/appdatosturismo/Content2.html (accessed on 4 August 2023).
  9. Mori, N. Investigaciones Geofísicas Integradas en Sitios Arqueológicos: Caso de Estudio Fortaleza de Kuelap; Universidad Nacional de Ingenieria: Lima, Peru, 2021. [Google Scholar]
  10. Alvarez, J. Estudio Análisis Prospectivo de Seguridad Física en Geotecnia, Geodinámica Externa e Hidrogeología del Acceso 1 y Estructuras Adyacentes; Ministerio de Comercio Exterior y Turismo, Plan COPESCO Nacional, Unidad de Ejecucion de Obras: Lima, Peru, 2017; p. 208. [Google Scholar]
  11. Rodríguez, R.; Giraldo, E.; Cueva, E.; Sánchez, E.; Cornejo, T. Geología del Cuadrángulo de Chachapoyas (13-h); INGEMMET: Lima, Peru, 2012; p. 142. [Google Scholar]
  12. Bonavia, D. The role of the Ceja de Selva in the cultural development of pre-Columbian Peru. In The Inca World: The Development of Pre-Columbian Peru, AD 1000-1534; Minelli, L., Ed.; University of Oklahoma Press: Norman, OK, USA, 2000; pp. 121–131. [Google Scholar]
  13. Young, B.E. Endemic Species Distribution on the Eastern Slope of the Andes in Peru and Bolivia; NatureServe: Arlington, VA, USA, 2007. [Google Scholar]
  14. Young, K.R.; León, B. Peru’s Humid Eastern Montane Forests: An Overview of Their Physical Settings, Biological Diversity, Human Use and Settlement, and Conservation Needs; Centre for Research on the Cultural and Biological Diversity of Andean Rainforests (DIVA): Rønde, Denmark, 1999; pp. 1–97. [Google Scholar]
  15. Young, B.; Young, K.R.; Josse, C. Vulnerability of tropical Andean ecosystems to climate change. In Climate Change and Biodiversity in the Tropical Andes; Herzog, S.K., Martinez, R., Jørgensen, P.M., Tiesse, H., Eds.; Scientific Committee on Problems of the Environment (SCOPE), Inter-American Institute for Global Change Research (IAI): Paris, France, 2011; pp. 170–181. [Google Scholar]
  16. Rehm, E.M.; Feeley, K.J. The inability of tropical cloud forest species to invade grasslands above treeline during climate change: Potential explanations and consequences. Ecography 2015, 38, 1167–1175. [Google Scholar] [CrossRef]
  17. Sales, R.A.; McMichael, C.N.H.; Peterson, L.C.; Stanley, A.; Bennett, I.; Jones, T.E.; Walker, A.S.; Mulhearn, M.; Nelson, A.; Moore, C.; et al. Wet and dry events influenced colonization of a mid-elevation Andean forest. Quat. Sci. Rev. 2024, 327, 108518. [Google Scholar] [CrossRef]
  18. Koschmieder, K. Jucusbamba: Investigaciones Arqueológicas y Motivos Chachapoya en el Norte de la Provincia de Luya, Departamento Amazonas, Perú; Ministerio de Agricultura: Madrid, Spain, 2012. [Google Scholar]
  19. Church, W.; Valle, L. Gran Pajatén y su contexto en el paisaje prehispánico Pataz-Abiseo. In ¿Que Fue Chachapoyas? Aproximaciones Interdisciplinarias en el Estudio de los Andes Nororientales del Peru; Church, W., Guengerich, A., Mauricio, A.C., Eds.; Boletin de Arqueología PUCP; Pontificia Universidad Catolica del Peru: Lima, Peru, 2017; Volume 2, pp. 57–93. [Google Scholar]
  20. Guengerich, A.; Church, W. Una mirada hacia el futuro: Nuevas direcciones en la arqueología de los Andes nororientales. In ¿Que Fue Chachapoyas? Aproximaciones Interdisciplinarias en el Estudio de los Andes Nororientales del Peru; Church, W., Guengerich, A., Mauricio, A.C., Eds.; Boletin de Arqueología PUCP; Pontificia Universidad Catolica del Peru: Lima, Peru, 2017; Volume 2, pp. 313–334. [Google Scholar]
  21. Bush, M.B.; Mosblech, N.A.S.; Church, W. Climate change and the agricultural history of a mid-elevation Andean montane forest. Holocene 2015, 25, 1522–1532. [Google Scholar] [CrossRef]
  22. Åkesson, C.M.; Matthews-Bird, F.; Bitting, M.; Fennell, C.-J.; Church, W.B.; Peterson, L.C.; Valencia, B.G.; Bush, M.B. 2100 years of human adaptation to climate change in the High Andes. Nat. Ecol. Evol. 2020, 4, 66–74. [Google Scholar] [CrossRef]
  23. Vázquez de Espinosa, A. Description of the Indies (c. 1620), Reprint ed.; Smithsonian Institution Press: Washington, DC, USA, 1968; Volume 102, p. 862. [Google Scholar]
  24. Cook, N.D. Demographic Collapse: Indian Peru, 1520–1620; Cambridge University Press: Cambridge, UK, 2004; p. 324. [Google Scholar]
  25. Newell, F.L.; Ausprey, I.J.; Robinson, S.K. Spatiotemporal climate variability in the Andes of northern Peru: Evaluation of gridded datasets to describe cloud forest microclimate and local rainfall. Int. J. Climatol. 2022, 42, 5892–5915. [Google Scholar] [CrossRef]
  26. Lutz, D.A.; Powell, R.L.; Silman, M.R. Four decades of Andean timberline migration and implications for biodiversity loss with climate change. PLoS ONE 2013, 8, e74496. [Google Scholar] [CrossRef] [PubMed]
  27. Mata-Guel, E.O.; Soh, M.C.K.; Butler, C.W.; Morris, R.J.; Razgour, O.; Peh, K.S.H. Impacts of anthropogenic climate change on tropical montane forests: An appraisal of the evidence. Biol. Rev. 2023, 98, 1200–1224. [Google Scholar] [CrossRef]
  28. Ruiz Estrada, A. Sobre las formas de sepultamiento prehispánico en Kuelap, Amazonas. Arqueol. Soc. 2009, 20, 41–56. [Google Scholar] [CrossRef]
  29. Toyne, M.; Narváez, A. A bioarchaeological analysis of burials from Kuelap; an exploration of patterns in morphology and lifestyle. In ¿Que Fue Chachapoyas? Aproximaciones Interdisciplinarias en el Estudio de los Andes Nororientales del Perú; Church, W., Guengerich, A., Mauricio, A.C., Eds.; Boletin de Arqueologia PUCP; Pontificia Universidad Católica del Perú: Lima, Peru, 2017; pp. 159–185. [Google Scholar]
  30. Guengerich, A. La diversidad local frente a la «Cultura Chachapoya» en la arquitectura doméstica. In ¿Que Fue Chachapoyas? Aproximaciones Interdisciplinarias en el Estudio de los Andes Nororientales del Perú; Church, W., Guengerich, A., Mauricio, A.C., Eds.; Boletín de Arqueología PUCP; Pontificia Universidad Católica del Perú: Lima, Peru, 2017; pp. 207–230. [Google Scholar]
  31. Guillén, S.; Narváez, A. Los Chachapoya: La gente de los bosques de las nubes. In Perú Prehispánico: Un Estado de la Cuestión; Castillo, L.J., Mujica, E., Eds.; Colección Qillqa Mayu; Ministerio de Cultura, Dirección Desconcentrada de Cultura de Cusco: Cusco, Peru, 2018; pp. 269–302. [Google Scholar]
  32. Narváez, A. Kuelap: Centro del poder politico y religioso de los Chachapoyas. In Los Chachapoyas; Kaufmann, F., Ed.; Arte y Tesoros del Antiguo Peru; Banco de Credito del Peru: Lima, Peru, 2013; pp. 87–159. [Google Scholar]
  33. Crandall, J.M. El desarrollo espacial de las comunidades Chachapoyas bajo la dominación colonial inka y española. In ¿Que Fue Chachapoyas? Aproximaciones Interdisciplinarias en el Estudio de los Andes Nororientales del Perú; Church, W., Guengerich, A., Mauricio, A.C., Eds.; Boletín de Arqueología PUCP; Pontificia Universidad Católica del Perú: Lima, Peru, 2017; pp. 283–312. [Google Scholar]
  34. Narváez, A. Kuélap Guía de Visita, 2nd ed.; Mincetur: Lima, Peru, 2018. [Google Scholar]
  35. Guengerich, A. The architect’s signature: The social production of a residential landscape at Monte Viudo, Chachapoyas, Peru. J. Anthropol. Archaeol. 2014, 34, 1–16. [Google Scholar] [CrossRef]
  36. Lerche, P. Los Chachapoya y los Simbolos de su Historia; Gayoso: Lima, Peru, 1995; p. 133. [Google Scholar]
  37. Barbieri, C.; Sandoval, J.R.; Valqui, J.; Shimelman, A.; Ziemendorff, S.; Schröder, R.; Geppert, M.; Roewer, L.; Gray, R.; Stoneking, M.; et al. Enclaves of genetic diversity resisted Inca impacts on population history. Sci. Rep. 2017, 7, 17411. [Google Scholar] [CrossRef]
  38. Guevara, E.K.; Palo, J.U.; Översti, S.; King, J.L.; Seidel, M.; Stoljarova, M.; Wendt, F.R.; Bus, M.M.; Guengerich, A.; Church, W.B. Genetic assessment reveals no population substructure and divergent regional and sex-specific histories in the Chachapoyas from northeast Peru. PLoS ONE 2020, 15, e0244497. [Google Scholar] [CrossRef] [PubMed]
  39. Guevara, E.K.; Palo, J.U.; Sajantila, A.; Guillén, S. Explorando dinámicas poblacionales ancestrales en el noreste peruano: Marcadores uniparentales de ADN en los Chachapoyas modernos. In ¿Que Fue Chachapoyas? Aproximaciones Interdisciplinarias en el Estudio de los Andes Nororientales del Peru; Church, W., Guengerich, A., Mauricio, A.C., Eds.; Boletín de Arqueología PUCP; Pontificia Universidad Catolica del Peru: Lima, Peru, 2017; pp. 127–158. [Google Scholar]
  40. Jolkesky, M.P.D.V. Estudo Arqueo-Ecolinguístico das Terras Tropicais Sul-Americanas. Ph.D. Thesis, Universidade de Brasília, Brasília, Brazil, 2016. [Google Scholar]
  41. Valqui, J.; Ziemendorff, M. Vestigios de una lengua originaria en el territorio de la cultura chachapoya. Letras 2016, 87, 5–32. [Google Scholar] [CrossRef]
  42. Ziemendorff, M.; Ziemendorff, S.; Culqui, J.V. Observaciones metodológicas sobre el estudio de lenguas extintas en el nororiente peruano: El caso del chacha. Letras 2023, 94, 16–32. [Google Scholar] [CrossRef]
  43. Culqui, J.J.V.; Ziemendorff, M.; Ziemendorff, S.; Oisel, G. Consideraciones histórico-lingüísticas acerca del topónimo Kuélap. Indiana-Estud. Antropológicos Sobre América Lat. Caribe 2023, 40, 131–154. [Google Scholar]
  44. Urban, M. Linguistic and cultural divisions in pre-Hispanic Northern Peru. Lang. Sci. 2021, 85, 101354. [Google Scholar] [CrossRef]
  45. Toyne, M.; Narváez, A. The Fall of Kuélap: Bioarchaeological Analysis of Death and Destruction on the Eastern Slopes of the Andes. In Embattled Bodies, Embattled Places; Scherer, A.K., Verano, J., Eds.; Dumbarton Oaks Research Library and Collection: Washington, DC, USA, 2014; pp. 341–364. [Google Scholar]
  46. Church, W.; Guengerich, A. La (re)construcción de Chachapoyas a través de la historia e histografía. In ¿Que Fue Chachapoyas? Aproximaciones Interdisciplinarias en el Estudio de los Andes Nororientales del Peru; Church, W., Guengerich, A., Mauricio, A.C., Eds.; Boletin de Arqueologia PUCP; Pontificia Universidad Catolica del Peru: Lima, Peru, 2017; pp. 5–38. [Google Scholar]
  47. Schjellerup, I. Incas and Spaniards in the Conquest of the Chachapoyas: Archaeological and Ethnohistorical Research in the North-Eastern Andes of Peru; Göteborg University, Department of Archaeology: Gothenburg, Sweden, 1997. [Google Scholar]
  48. Espinoza Soriano, W. Los señoríos étnicos de Chachapoyas y la alianza hispano-chacha: Siglos XV–XVI. Rev. Histórica 1967, 30, 224–333. [Google Scholar]
  49. Narváez, A. Kuélap: Una ciudad fortificada en los Andes nor-orientales de Amazonas, Perú. In Arquitectura y Arqueología: Pasado y Futuro de la Construcción en el Perú; Rangel Flores, V., Ed.; Museo Bruning: Chiclayo, Peru, 1988; pp. 115–142. [Google Scholar]
  50. Bradley, R. The Architecture of Kuelap . Ph.D. Thesis, Columbia University, New York, NY, USA, 2005. [Google Scholar]
  51. Arkush, E. Climbing Hillforts and Thinking about Warfare in the Pre-Columbian Andes. In Engaging Archaeology: 25 Case Studies in Research Practice; Silliman, S.W., Ed.; John Wiley & Sons, Inc.: Hoboken, NJ, USA, 2018; pp. 13–22. [Google Scholar]
  52. Arkush, E.; Stanish, C. Interpreting conflict in the ancient Andes: Implications for the archaeology of warfare. Curr. Anthropol. 2005, 46, 3–28. [Google Scholar] [CrossRef]
  53. Keeley, L.H.; Fontana, M.; Quick, R. Baffles and bastions: The universal features of fortifications. J. Archaeol. Res. 2007, 15, 55–95. [Google Scholar] [CrossRef]
  54. Hardoy, J.E. Pre-Columbian Cities; Routledge: London, UK, 2014; p. 640. [Google Scholar]
  55. Raimondi, A. El Perú; Imprenta del Estado, Sociedad Geográfica de Lima: Lima, Peru, 1874; Volume 1. [Google Scholar]
  56. Alayza, J. Expedicion Organizada por el Señor Alayza, Prefecto de Amazonas, á Indicación de la Sociedad Geográfica de Lima, Para Hacer Nuevos Estudios de la Fortaleza de Cuelap. Boletín De La Soc. Geográfica De Lima 1892, II, 153–160. [Google Scholar]
  57. Wertheman, A. Ruinas de la fortaleza de Cuelap. Boletín De La Soc. Geográfica De Lima 1892, II, 147–160. [Google Scholar]
  58. Middendorf, E.W. Peru; Beobachtungen und Studien über das Land und Seine Bewohner Während Eines 25 Jährigen Aufenthalts; R. Oppenheim: Berlin, Germany, 1893. [Google Scholar]
  59. Kieffer, P. Excursion a Cuelap: Departamento de Amazonas—Perú, Fragmentos de las Notas del P. Ph. Kieffer; Libr. Francesa Científica Galland, E. Rosay: Lima, Peru, 1910. [Google Scholar]
  60. Langlois, L. Las ruinas de Cuelap. Boletín Soc. Geográfica Lima 1934, 51, 20–34. [Google Scholar]
  61. Langlois, L. Utcubamba: Investigaciones Arqueológicas en el Valle de Utcubamba (Departamento de Amazonas, Perú); Impr. del Museo Nacional: Lima, Peru, 1939. [Google Scholar]
  62. Reichlen, H.; Reichlen, P. Recherches archéologiques dans les Andes du Haut Utcubamba: Deuxième rapport de la Mission Ethnologique Française au Perou Septentrional. J. Société Américanistes 1950, 39, 219–246. [Google Scholar] [CrossRef]
  63. Horkheimer, H. Algunas consideraciones acerca de la arqueologia en el valle del Utcubamba. In Proceedings of the II Congreso Nacional de Historia del Peru, Lima, Peru, 4–9 August 1958; pp. 71–101. [Google Scholar]
  64. Contreras, J. Historia Clinica de Kuelap; Report to World Monuments Fund Peru: Lima, Peru, 2023; p. 55. [Google Scholar]
  65. Righetti, G.; Serafini, S.; Brondi, F.; Church, W.; Garnero, G. Sotto le Nuvole, sotto la Foresta: Applicazioni Tecnologiche Lidar e di Intelligenza Artificiale per Nuove prospettive nel Sito monumentale di Kuelap-Perú. Archeomatica 2020, 11, 6–13. [Google Scholar]
  66. Barriga, J. Estudio Geofisico: Tomografia Electrica y Sondeo Electrico Vertical; Plan COPESCO: Lima, Peru, 2019; p. 46. [Google Scholar]
  67. Martorana, R.; Capizzi, P.; D’Alessandro, A.; Luzio, D. Comparison of different sets of array configurations for multichannel 2D ERT acquisition. J. Appl. Geophys. 2017, 137, 34–48. [Google Scholar] [CrossRef]
  68. Orellana, E. Prospeccion Geoelectrica en Corriente Continua, 2nd ed.; Ediciones Paraninfo: Madrid, Spain, 1981; Volume 1, p. 578. [Google Scholar]
  69. ALEPH Asociados. Elaboración del Expediente Técnico Para la Intervención del Acceso 1, Bóveda y Estructuras Adyacentes en el Complejo Arqueológico Kuélap, Región Amazonas; Report to Ministerio de Cultura del Peru: Lima, Peru, 2022; p. 19. [Google Scholar]
  70. Mori, N. Contratación de Servicio Para la Determinación de la Estratigrafía del Área Nuclear de la Zona Arqueológica Monumental de Kuélap; Ministerio de Cultura: Lima, Peru, 2023; p. 429. [Google Scholar]
  71. UNESCO. Hoja de Ruta Para la Intervencion Sistematica e Interdisciplinaria Que Conlleve a la Recuperacion y Conservacion Sostenible del Sitio Arqueologico Fortaleza de Kuelap; UNESCO: Lima, Peru, 2022; p. 204. [Google Scholar]
  72. Vilcapoma, O. Informe Tecnico de Levantamiento Lidar: Sitio Arqueologico Kuelap; Report to World Monuments Fund Peru: Lima, Peru, 2023; p. 9. [Google Scholar]
  73. Fawzy, H.E.-D. 3D laser scanning and close-range photogrammetry for buildings documentation: A hybrid technique towards a better accuracy. Alex. Eng. J. 2019, 58, 1191–1204. [Google Scholar] [CrossRef]
  74. Agisoft. Agisoft Metashape User Manual. Professional Edition, Version 2.0. 2023. pp. 31+37–38. Available online: https://www.agisoft.com/pdf/metashape-pro_32_30_en.pdf (accessed on 28 January 2022).
  75. Kościuk, J. Peter Grossmann’s Sense of Field Drawings and Its Legacy. Bulletin de la Société d’Archéologie Copte. 2022. Available online: https://www.academia.edu/95676907/PETER_GROSSMANNS_SENSE_OF_FIELD_DRAWINGS (accessed on 30 December 2023).
  76. Kościuk, J. Architectural Survey and Recording. In Athribis I. General Site Survey; El-Sayed, R., El-Masry, Y., Eds.; Institut Français d’Archéologie Orientale: Cairo, Egypt, 2012; Volume 1, pp. 94–96. [Google Scholar]
  77. Kokalj, Ž.; Zakšek, K.; Oštir, K. Application of sky-view factor for the visualisation of historic landscape features in lidar-derived relief models. Antiquity 2011, 85, 263–273. [Google Scholar] [CrossRef]
  78. Crutchley, S.; Crow, P. The Light Fantastic: Using Airborne Lidar in Archaeological Survey; English Heritage: Swindon, UK, 2010; p. 43. [Google Scholar]
  79. Devereux, B.J.; Amable, G.S.; Crow, P. Visualisation of LiDAR terrain models for archaeological feature detection. Antiquity 2008, 82, 470–479. [Google Scholar] [CrossRef]
  80. Bennett, R.; Welham, K.; Hill, R.A.; Ford, A. A comparison of visualization techniques for models created from airborne laser scanned data. Archaeol. Prospect. 2012, 19, 41–48. [Google Scholar] [CrossRef]
  81. Challis, K.; Kokalj, Z.; Kincey, M.; Moscrop, D.; Howard, A.J. Airborne lidar and historic environment records. Antiquity 2008, 82, 1055–1064. [Google Scholar] [CrossRef]
  82. Zakšek, K.; Oštir, K.; Kokalj, Ž. Sky-view factor as a relief visualization technique. Remote Sens. 2011, 3, 398–415. [Google Scholar] [CrossRef]
  83. Kennelly, P.J.; Stewart, A.J. General sky models for illuminating terrains. Int. J. Geogr. Inf. Sci. 2014, 28, 383–406. [Google Scholar] [CrossRef]
  84. Challis, K.; Forlin, P.; Kincey, M. A generic toolkit for the visualization of archaeological features on airborne LiDAR elevation data. Archaeol. Prospect. 2011, 18, 279–289. [Google Scholar] [CrossRef]
  85. Medina, G. El Drenaje Como Medio de Conservacion de la Fortaleza de Kuelap. Bachelor’s Thesis, Universidad Nacional de Ingenieria, Lima, Peru, 1999. [Google Scholar]
  86. Bengtsson, L.B. Prehistoric Stonework in the Peruvian Andes: A Case Study at Ollantaytambo; Göteborg University: Göteborg, Sweden, 2000; p. 220. [Google Scholar]
  87. Gasparini, G.; Margolies, L. Inca Architecture; Indiana University Press: Bloomington, IN, USA, 1980; p. 350. [Google Scholar]
  88. Protzen, J.-P. Inca quarrying and stonecutting. J. Soc. Archit. Hist. 1985, 44, 161–182. [Google Scholar] [CrossRef]
  89. Protzen, J.-P. Inca stonemasonry. Sci. Am. 1986, 254, 94–105. [Google Scholar] [CrossRef]
  90. Protzen, J.-P. Inca Architecture and Construction at Ollantaytambo; Oxford University Press: New York, NY, USA; Oxford, UK, 1993; p. 303. [Google Scholar]
  91. Protzen, J.-P.; Nair, S. Who taught the Inca stonemasons their skills? A comparison of Tiahuanaco and Inca cut-stone masonry. J. Soc. Archit. Hist. 1997, 56, 146–167. [Google Scholar] [CrossRef]
  92. Protzen, J.-P.; Nair, S. The Stones of Tiahuanaco: A Study of Architecture and Construction; Cotsen Institute of Archaeology Press: Los Angeles, CA, USA, 2013; p. 264. [Google Scholar]
  93. Gavazzi, A. Tecnomorfología de la llaqta inka de Machupicchu. Materiales, métodos y resultados del levantamiento arquitectónico y paisajístico. In Machupicchu. Investigaciones Interdisciplinarias; Astete, F., Bastante, J., Eds.; GD Impactos: Lima, Peru, 2020; Volume 1, pp. 353–381. [Google Scholar]
  94. Kościuk, J.; Bastante, J.M. In a Search for Inca Construction Process Logistics. Case Studies of Four Structures from the Llaqta Machu Picchu. In Machu Picchu in Context: Interdisciplinary Approaches to the Study of Human Past; Ziółkowski, M., Masini, N., Bastante, J.M., Eds.; Springer Nature: Berlin, Germany, 2022; pp. 555–581. [Google Scholar]
  95. Neuner, H.; Holst, C.; Kuhlmann, H. Overview on current modelling strategies of point clouds for deformation analysis. Allg. Vermess.-Nachrichten AVN Z. Für Alle Bereiche Der Geodäsie Und Geoinf. 2016, 123, 328–339. [Google Scholar]
  96. Wojtkowska, M.; Kedzierski, M.; Delis, P. Validation of terrestrial laser scanning and artificial intelligence for measuring deformations of cultural heritage structures. Measurement 2021, 167, 108291. [Google Scholar] [CrossRef]
  97. Lasaponara, R.; Masini, N. MT-InSAR Remote Sensing Technique to Assess Conservation Conditions of Kuelap; Report to World Monuments Fund Peru: Lima, Peru, 2023; p. 43. [Google Scholar]
  98. Ruiz Estrada, A. Los trabajos de limpieza e investigacion arqueologica en Kuelap. In Amazonas: Arqueologia e Historia; Ruiz Estrada, A., Ed.; Universidad Alas Peruanas: Lima, Peru, 2010; pp. 333–350. [Google Scholar]
  99. Fawcett, R. Treatment of vegetation at monuments. In The Conservation of Architectural Ancient Monuments in Scotland. Guidance on Principles; Fawcett, R., Ed.; Historic Scotland, Longmore House, Salisbury Place: Edinburgh, Scotland, 2001; pp. 44–47. [Google Scholar]
  100. Narváez, A. Proyecto Kuelap Informe Final: Noviembre 1985—Marzo 1986; Report to Instituto Nacional de Cultura: Lima, Peru, 1986; p. 98. [Google Scholar]
  101. Benegas, L.; Ilstedt, U.; Roupsard, O.; Jones, J.; Malmer, A. Effects of trees on infiltrability and preferential flow in two contrasting agroecosystems in Central America. Agric. Ecosyst. Environ. 2014, 183, 185–196. [Google Scholar] [CrossRef]
  102. Leiva González, S.; Rodríguez Rodríguez, E.F.; Pollack Vel, L.E.; Briceño Rosario, J.; Jiménez Saldaña, J.; Gayoso Bazán, G.; Saldaña, I.S.; Barrena Gurbillón, M.Á.; Pariente Mondragón, E.; Gosgot Ángeles, W. Diversidad natural y cultural del Complejo Arqueológico Kuélap (provincia Luya, región Amazonas): La fortaleza de los hombres de las nubes. Arnaldoa 2019, 26, 883–930. [Google Scholar]
  103. GoldenSoftware. 2022. Available online: https://www.goldensoftware.com/products/surfer (accessed on 30 December 2023).
  104. Haynes, H. Utilizing Geographic Information Systems to Explore the Mortuary Landscape at Kuelap, Peru. Masters’s Thesis, University of Central Florida, Orlando, FL, USA, 2022. [Google Scholar]
  105. Chatterjee, D.; Murali Krishna, A. Effect of slope angle on the stability of a slope under rainfall infiltration. Indian Geotech. J. 2019, 49, 708–717. [Google Scholar] [CrossRef]
  106. Muenchow, J.; Brenning, A.; Richter, M. Geomorphic process rates of landslides along a humidity gradient in the tropical Andes. Geomorphology 2012, 139, 271–284. [Google Scholar] [CrossRef]
Figure 1. Aerial photograph of La Fortaleza, spring 2000. Associated archaeological sites on the sloping plateau below La Fortaleza were concealed by forest at the time. Copyright Gordon Wiltsie.
Remotesensing 16 01053 g001
Figure 2. Archaeological sectors, including La Fortaleza, within the Kuelap archaeological complex. Redrawn by Kucera with location data from Dionne [5]. UTM Zone 18S, WGS84.
Remotesensing 16 01053 g002
Figure 3. Map of sites in and around the Utcubamba valley and the northern Chachapoyas region. Sites 1–8 are on Peru’s Tentative List of UNESCO World Heritage Sites. 1. Kuelap, 2. La Jalca/Ollape, 3. Yalape, 4. Macro, 5. Cerro Olan, 6. Revash, 7. Karajia, 8. Lake of the Condors, 9. Lamud Urco, 10. Cerro Huancas, 11. Congon (Vilaya), 12. Purumllacta de Cheto, 13. Levanto, 14. Mayno, 15. Monte Viudo, 16. La Joya, 17. Balsas, 18. Cochamba, 19. Pirka-Pirka, 20. Inticancha. UTM Zone 18S, WGS84.
Remotesensing 16 01053 g003
Figure 4. An artistic rendering of La Fortaleza and its main buildings. (1) Circular platform; (2) Main Temple/El Tintero; (3) Access 1; (4) Access 2; (5) Perimeter wall; (6) Access 3; (7) Upper Town/Pueblo Alto; (8) Upper Town Southern Sector; (9) Upper Town Central Sector; (10) Upper Town Northern Sector; (11) The Turret/Torreón. Courtesy of MINCETUR Peru.
Remotesensing 16 01053 g004
Figure 5. Diagram of different data sources and their further processing. Elaborated by Kościuk.
Remotesensing 16 01053 g005
Figure 6. Point clouds and scan positions (red dots) of the 2019 TLS survey. Elaborated by Kucera.
Remotesensing 16 01053 g006
Figure 7. Image-based model (IBM) of the collapsed southern perimeter wall of La Fortaleza. Elaborated by Kucera from photographs by R. Vigo and N. Vargas.
Remotesensing 16 01053 g007
Figure 8. Location of geoelectrical profiles complementing each other. Blue—ALEPH [69]; Red—Mori [9]. Data assembled by Kościuk.
Remotesensing 16 01053 g008
Figure 9. Data flow for proposed Kuelap GIS general plan layers. Elaborated by Kościuk.
Remotesensing 16 01053 g009
Figure 10. Filtered and classified LiDAR data covering La Fortaleza. Data previously reported by Righetti and colleagues [6,65].
Remotesensing 16 01053 g010
Figure 11. Diagram for LiDAR data visualization and hydrological analysis. Elaborated by Kościuk.
Remotesensing 16 01053 g011
Figure 12. Different DTM visualization modes. HS—unidirectional hill-shading (azimuth 315°, vertical 35°); (MHS) multidirectional hill-shading (8 directions, vertical 30°); (SG) slope gradient; (OPEN-POS) openness-positive (search radius 10 pixels, 16 search directions); (HYPSO) 5 cm resolution 3D model colored with elevation data; (VAT) general terrain Archaeological Mixer (sky-view factor, multiplication 25% opacity blending mode; openness-positive, overlay 50% blending mode; slope gradient, luminosity 50% blending mode; analytical hill-shading, normal blending mode 100%). LiDAR data from MEDS. Prepared by Ćmielewski and Kościuk.
Remotesensing 16 01053 g012
Figure 13. Samples of hydrological analyses for the southernmost part of La Fortaleza: (A) slope gradient; (B) local depressions; (C) boundaries of water catchments; (D) rainwater runoff lines. Hydrological analysis by Dąbek; data assembling by Kościuk.
Remotesensing 16 01053 g013
Figure 14. Diagram for comparing ERT data with hydrographic analyses. Elaborated by Kościuk.
Remotesensing 16 01053 g014
Figure 15. ERT LTE 01 profile, plotted against the background of hydrological analysis on a hypsometric map. In the range of 10–90 Ohm*m, the resistivity measurements identify a high concentration of humidity associated to debris formed by limestone blocks and soil. Hydrological analysis by Dąbek; ERT profile by Mori; hypsometry and data assembling by Kościuk. UTM Zone 18S, WGS84.
Remotesensing 16 01053 g015
Figure 16. Geoseismic profile LS-03, representative of La Fortaleza. Elaborated by Mori [70].
Remotesensing 16 01053 g016
Figure 17. Stratigraphic sections of La Fortaleza based on the processing of seismic refraction data. (1) Construction fill; (2) Limestone bedrock; (A) Longitudinal section. (BL) Transversal sections. Data assembling by Mori; redrawn by Kościuk.
Remotesensing 16 01053 g017
Figure 18. Sample of the fusion of digital photogrammetry and TLS data at the southeastern corner of La Fortaleza’s perimeter wall. Blue lines—overlap between TLS and photogrammetric projects; green crosses—ground control points for photogrammetric project. TLS 3D point cloud data from Kucera, VanValkenburgh, and Rojas. Elaborated by Kościuk.
Remotesensing 16 01053 g018
Figure 19. Diagram for detailed plans for reconstruction purposes and restoration recommendations. Elaborated by Kościuk.
Remotesensing 16 01053 g019
Figure 20. Aerial view of La Fortaleza in 1995, indicating some documented episodes of collapse. (A) 10–11 April 2022; (B) Pre-Hispanic collapse and repair; (C) June–July 2023; (D) 1910–1933; (E) 31 March 2013; (F) Date unknown. Photograph by M. Chumbe (1995). Elaborated by Contreras.
Remotesensing 16 01053 g020
Figure 21. 3D model of the surface of the limestone bedrock underneath La Fortaleza. Seismic data and elaboration by Mori. UTM Zone 18S, WGS84.
Remotesensing 16 01053 g021
Figure 22. Deforestation at La Fortaleza: (a) High vegetation extent, 2005; (b) High vegetation extent, 2022; (c) Changes in high vegetation extent between 2005 and 2022. Prepared by Kościuk.
Remotesensing 16 01053 g022
Figure 23. Hydrological analysis based on DTM: (A) local depressions; (B) primary and subsidiary catchments; (C) rainwater flow accumulation lines (the intensity of the colors represents the catchment size from which rainwater is drained); (D) depressions, catchments, and flow lines superimposed on a hill-shaded 3D model; (E) the same as (D) but with the hypsometric model in the background. Prepared by Dąbek and Kościuk. UTM Zone 18S, WGS84.
Remotesensing 16 01053 g023
Figure 24. Precipitation risk maps, with terrain as background: (A) Depressions; (B) Rainwater flow accumulation lines; (C) Terrain with average slope <5%; (D) Accumulated risk. Prepared by Kościuk. UTM Zone 18S, WGS84.
Remotesensing 16 01053 g024
Figure 25. Ground moisture analysis based on Normalized Difference Water Index (NDWI). Primary data source: Sentinel-2 L2A satellite. Prepared by Kościuk.
Remotesensing 16 01053 g025
Figure 26. The area of the perimeter wall collapse on April 2022: (A) the southern perimeter wall after the first collapse of April 10th (Photo: N. Anazco); (B) the same area after the subsequent series of collapses (Photo: R. Vigo); (C) margins of the collapses, TLS data by Kucera, VanValkenburgh, and Rojas, 3D modeling and surface unrolling by Kościuk; (D) techno-morphological study, elaborated by Kościuk; (E) ground view of the collapsed area; (1) collapsed part of the wall; (2) damaged and unstable part of the wall resulting from the 1st collapse on April 10th; (3) part of the wall repointed with modern mortar; (4) part of the repointed wall fallen down in subsequent collapses; (5) margins of technological and/or chronological phases; (6) coursed masonry; (7) uncoursed masonry; (8) leveling layers; (9) patches of irregular masonry; (10) red arrows point to zones of vertical concentration of patches; (11) perimeter wall; (12) collapsed parts of the perimeter wall; (13) main rainwater flow lines; (14) subsidiary rainwater flow lines; (15) minor rainwater flow lines; (16) modern drainage disposing water just behind the perimeter wall. Prepared by Kościuk.
Remotesensing 16 01053 g026
Figure 27. Integrated TLS, ALS, and IBM model of the collapsed perimeter wall (red outline) and corresponding debris (green outline) on the southeastern corner of La Fortaleza, centered on the collapsed area. Prepared by Kucera. Image data courtesy of R. Vigo and N. Vargas.
Remotesensing 16 01053 g027
Figure 28. Evidence of pre-Hispanic collapse and rebuilding on the southeastern perimeter wall. (A) perimeter wall in its original height and condition (notice the original eaves at the top of the wall); (B) partially rebuilt perimeter wall, with stonework different from (A); (C) drop in wall height between original (A) and rebuilt (B) sections, Figure 18; (C,D) zig-zagging vertical margin between the original (A) and rebuilt (B) perimeter wall sections; (D,E) horizontal margin, or leveling layer, between the original (A) and rebuilt (B) perimeter wall sections; (F) rebuilt perimeter wall, with conservation mortar added by repointing. Prepared by Ghezzi; photograph by Church (2007).
Remotesensing 16 01053 g028
Figure 29. The region of the April 2022 collapse in the southeast corner of La Fortaleza: (A) hypsometric plan; (B) profile B-B (data by Kucera); (C) profile C-C; (1) collapsed part of the perimeter wall; (2) horizontal extent of the April 2022 collapse; (3) horizontal extent of hypothetical pre-Hispanic collapse and its northern extension; (4) ground imprints from dismantled or destroyed circular buildings; (5) profile locations; (6) preserved surface of the platform; (7) splinter wedge; (8) loose landslide debris; (9) slope inclination angles. Elaborated by Kościuk. UTM Zone 18S, WGS84.
Remotesensing 16 01053 g029
Figure 30. Grain size curves of mortar samples from La Fortaleza (source data UNESCO [71]); (A) original mortar; (B) average of conservation mortars; (C) typical curves of sandy-clay soil and loam-clay soil; (D) typical curves of sandy-clay soil and sandy-gravel soil; (E) typical curves recommended for contemporary construction mortars. Elaborated by Kościuk.
Remotesensing 16 01053 g030
Figure 31. (A) Cracks (red arrows) in the stone blocks of the perimeter wall observed in 2022; (B) Machu Picchu, an example of repointing a wall using clay-earth mortar. Photos by Kościuk.
Remotesensing 16 01053 g031
Disclaimer/Publisher’s Note: The statements, opinions and data contained in all publications are solely those of the individual author(s) and contributor(s) and not of MDPI and/or the editor(s). MDPI and/or the editor(s) disclaim responsibility for any injury to people or property resulting from any ideas, methods, instructions or products referred to in the content.

