Article

Downscaling Land Surface Temperature Derived from Microwave Observations with the Super-Resolution Reconstruction Method: A Case Study in the CONUS

1
Department of Geography and Geoinformation Science, George Mason University, Fairfax, VA 22030, USA
2
NOAA/STAR/SMCD, College Park, MD 20740, USA
*
Author to whom correspondence should be addressed.
Remote Sens. 2024, 16(5), 739; https://doi.org/10.3390/rs16050739
Submission received: 27 December 2023 / Revised: 8 February 2024 / Accepted: 16 February 2024 / Published: 20 February 2024
(This article belongs to the Special Issue Big Earth Data for Climate Studies)

Abstract

:
Optical sensors cannot penetrate clouds and can cause serious missing data problems in optical-based Land Surface Temperature (LST) products. Under cloudy conditions, microwave observations are usually utilized to derive the land surface temperature. However, microwave sensors usually have coarse spatial resolutions. High-Resolution (HR) LST data products are usually desired for many applications. Instead of developing and launching new high-resolution satellite sensors for LST observations, a more economical and practical way is to develop proper methodologies to derive high-resolution LSTs from available Low-Resolution (LR) datasets. This study explores different algorithms to downscale low-resolution LST data to a high resolution. The existing regression-based downscaling methods usually require simultaneous observations and ancillary data. The Super-Resolution Reconstruction (SRR) method developed for traditional image enhancement can be applicable to high-resolution LST generation. For the first time, we adapted the SRR method for LST data. We specifically built a unique database of LSTs for the example-based SRR method. After deriving the LST data from the coarse-resolution passive microwave observations, the AMSR-E at 25 km and/or AMSR-2 at 10 km, we developed an algorithm to downscale them to a 1 km spatial resolution with the SRR method. The SRR downscaling algorithm can be implemented to obtain high-resolution LSTs without auxiliary data or any concurrent observations. The high-resolution LSTs are validated and evaluated with the ground measurements from the Surface Radiation (SURFRAD) Budget Network. The results demonstrate that the downscaled microwave LSTs have a high correlation coefficient of over 0.92, a small bias of less than 0.5 K, but a large Root Mean Square Error (RMSE) of about 4 K, which is similar to the original microwave LST, so the errors in the downscaled LST could have been inherited from the original microwave LSTs. The validation results also indicate that the example-based method shows a better performance than the self-similarity-based algorithm.

1. Introduction

Land surface temperature (LST) is a fast response variable that can provide valuable information for soil moisture conditions and vegetation stress, indicating significant changes in the hydrosphere, atmosphere, and biosphere [1,2]. High-resolution LSTs are desired in many applications, such as urban heat island effect studies [3,4,5,6,7], hazard assessments, soil moisture estimations [8,9,10], derivation of evapotranspiration (ET) [11,12,13,14], and drought monitoring [15,16,17].
Under clear conditions, good-quality LSTs can be derived from optical sensors [18,19,20,21,22,23,24,25,26]. But, optical sensors cannot penetrate clouds and, thus, can lead to a lot of missing LST data under cloudy conditions. Meanwhile, microwave (MW) sensors can penetrate non-raining clouds: thus, under cloudy conditions, LSTs are usually derived from microwave observations [27,28,29,30,31,32,33,34,35,36,37,38]. Recently, integrating LSTs from optical and microwave observations has made it possible to obtain spatial continuous LSTs under all sky conditions [38,39,40,41,42]. However, microwave sensors usually have a lower spatial resolution than optical sensors.
Traditional methods to improve the spatial resolution of sensors have high costs. Hence, downscaling coarse-resolution data from existing sensors is more economical and practical. There are mainly three approaches for remote sensing data downscaling [43]: (1) regression approaches that are the most straightforward and commonly used; (2) the Area to Point Prediction (ATPP) that downscales the input coarse-resolution variables via interpolations [44]; and (3) super-resolution reconstructions introduced by Nasrollahi and Moeslund [45]. Nasrollahi and Moeslund [45] summarized most SRR approaches used in different fields. Recently, Super-Resolution Reconstruction (SRR) has become a promising resolution-enhancement technique used to obtain high-resolution images from low-resolution images [45]. The main idea of the method is to use the available low-resolution image(s) to reconstruct high-resolution image(s).
Most LST downscaling research focuses on the statistical downscaling of thermal satellite data (often known as thermal sharpening). Kustas et al. [46] presented a simple, generalized Thermal sHARPening (TsHARP) algorithm using functional relationships between LST and the Normalized Difference Vegetation Index (NDVI) developed at a coarser Thermal Infrared (TIR) pixel resolution, and then applied this at a finer shortwave resolution. Gao et al. [47] applied a data mining sharpener approach designed for applications over widely varying landscapes to enhance the TsHARP results, considering the relation between temperature and reflectance. Therefore, a single variable was added to the models, such as emissivity [6,48], and an LST predictor set (vegetation indexes, albedo, emissivity, land cover, slope, etc.) [49,50]. The selection of auxiliary datasets (such as vegetation or topographic indices) as well as the generation and application of an empirical model are critical for deriving high-resolution LSTs. Moreover, the effectiveness is limited when auxiliary data and predictable data are not well-correlated (such as the NDVI and LST on an irrigation ground) [51]. The statistical downscaling methods can perform better when carried out with localization strategies [50], such as the Geographically Weighted Regression (GWR) model [38,52]. Recently, machine learning and data mining techniques, such as the Support Vector Machine (SVM) [3], machine learning [53], and random forest regression [54,55], have been applied to LST downscaling. A stepwise downscaling method was also developed to improve the GWR method and downscale LSTs derived from the AMSR-E to the same resolution as MODIS [56].
In recent years, the SRR method for remote sensing images has mainly focused on multi-temporal image sequences [57,58] or multi-angle data [59]. However, multi-temporal satellite images can be obtained over different periods; thus, the atmosphere/surface condition or the imaging scenes can change rapidly, even over the same scene. Multi-angles, usually also obtained multi-temporally (shorter time difference), might not have the required scene at a certain time, or the sensors might not be available, and the spatial resolution of different angle images is different; the nadir image resolution is hard to match accordingly [60]. What is more, for all of the successful applications of multi-angle imagery, the accurate registration of multiple-view images, which at times are also multi-temporal, is a prerequisite.
In our research about LST derivations under all sky conditions [38], LSTs derived from an optical sensor under clear conditions were integrated with LSTs derived from microwave observations under cloudy conditions, and the GWR method was applied to downscale microwave-based LSTs to the same resolution as TIR-based LSTs. In this study, the super-resolution method was used to downscale LSTs derived from microwave observations, LSTs from the AMSR-E at 25 km were downscaled to the same 1 km resolution as MODIS LSTs, and LSTs from the AMSR-2 at 10 km were downscaled to the same resolution as the GOES LST (4 km before GOES-16 and 1 km after GOES-16).
The microwave LST datasets used in this study are described in the next section. Section 3 describes the SRR methodology for multiple images or single-image downscaling. Section 4 presents the downscaling results and the evaluation results against the ground-based measurements. The last section summarizes the results obtained in this study and discusses their application perspectives.

2. Materials

2.1. Satellite Data

In this study, brightness temperature data from the Advanced Microwave Scanning Radiometer for the Earth Observing System (AMSR-E) at a NASA-processed resolution of 25 km [61,62], and the second Advanced Microwave Scanning Radiometer (AMSR-2) at a resampled 10 km resolution [63] processed by the Japan Aerospace Exploration Agency were used to derive LSTs with the algorithms developed by Sun et al. (2019) [38].
The MODIS level 3 monthly emissivity product [21] at a 0.05° spatial resolution [64] was used to estimate the broadband emissivity.
The study area covered the Continental United States (CONUS: 25~50°N; −125~−70°W). The AMSR-E data in 2008, the AMSR-2 data in 2015, and the MODIS emissivity data in 2008 and 2015 were used.

2.2. In Situ Data

The Surface Radiation Budget Network (SURFRAD) ground observations were used to validate and evaluate the downscaled LSTs derived from microwave measurements. The surface upwelling and downwelling radiative fluxes from the SURFRAD observations can be converted to LSTs by using the following equation [38]:
T s = F ( 1 ε b ) F ε b σ 1 4
where σ is the Stefan–Boltzmann constant, F is the surface upwelling longwave radiative flux, F is the surface downwelling longwave radiative flux, and εb is the surface broadband emissivity, which can be derived from the spectral emissivity by using a narrow-to-broadband conversion with Equation (2):
ε b = 0.2122 ε 29 + 0.3859 ε 31 + 0.4029 ε 32
where ε29, ε31, and ε32 are the spectral emissivity values at MODIS bands 29, 31, and 32, respectively.

3. Methods

In our previous research, we tested both stationary and non-stationary-based LST downscaling algorithms [38]. The TsHARP technique is a popular LST stationary downscaling approach that has been studied till recently. The Geographically Weighted Regression (GWR) is a widely used non-stationary approach. LST data derived from microwaves (AMSR-E: 25 km) were downscaled to a fine spatial resolution as MODIS at 1 km, with the help of the MODIS LST along with other selected auxiliary data. The Normalized Difference Vegetation Index (NDVI) data and Digital Elevation Model (DEM) were used as auxiliary data. The daily NDVI data were derived from MODIS at a 0.05-degree grid [65]. Since elevation can play an important role in the distribution of LSTs, as indicated by Peng et al. [66], LSTs usually decrease with increasing elevation. The elevation data can be obtained from the National Elevation Dataset (NED) [67] at a resolution of 100 m and downsampled to a coarse resolution (25 km and 1 km here) via a bi-cubic interpolation.
Figure 1 demonstrates the GWR outperformed the TsHARP algorithm, and the overall results are similar to MODIS LST. Based on this research, the GWR method was chosen to obtain gap-free spatial continuous LSTs over the continental United States from the AMSR-E observations at a 25 km resolution in 2008 and 10 km AMSR-2 LSTs in 2015 [38].
However, the existence of another concurrent high-resolution image as well as other auxiliary data are needed for both the TsHARP and the GWR methods. The AMSR-E has full coverage (Figure 1b) while, in some places, MODIS (Figure 1a) has no valid data due to clouds, which makes the downscaled AMSR-E LST (Figure 1c,d) lack data in areas with MODIS missing values due to clouds. These missing values limit the wide applications of high-resolution microwave LSTs. For example, the Atmosphere–Land Exchange Inverse (ALEXI) model [14] requires two morning LSTs as inputs, while there is no high-resolution data available at this time, so the LSTs cannot be downscaled using these regression-based methods. Thus, in this study, we introduced the SRR to solve the missing-value problem in the high-resolution LSTs obtained with the regression-based downscaling algorithms.
The SRR can be categorized into two methods: multi-image super-resolution (MISR) and single-image super-resolution (SISR).
The MISR method is a classical solution that deals with image sequences for the same scene (often caused by shifts), and high-resolution details are usually recovered by subpixel realignments. The fundamental point behind this method is that several images from the same area can often be obtained in satellite applications. Firstly, this method works with the assumption that subpixel shifts from each other are different, i.e., it stops working when the identic images are input. Secondly, multiple low-resolution images should be captured for the same scene, i.e., these observations have no significant changes. For the multi-image super-resolution method, in this study, two primary methods—the Maximum Likelihood Estimator (ML) and the Projection onto Convex Sets (POCS)—were applied to downscale LSTs.
The SISR method mainly includes three types. (1) Interpolation-based SISR. This methodology has been extensively studied. Usually, this approach cannot recover lost or degraded high-frequency components during the low-resolution sampling process [68] and creates blurry or over-smoothed edges for the reconstructed high-resolution image. (2) Reconstruction-based SISR. The prior knowledge of an observation model that maps the high-resolution images from the low-resolution images. This method is numerically limited to a scaling factor of two [68]. (3) Database-driven-based SISR. This learns the correspondence between high-resolution- and low-resolution-image patches from a database. Further detailed information is provided later.
Let x and y denote the sequences of high-resolution and low-resolution images, respectively. The commonly used image can be modeled as:
y k = 1 Z B j M k x j + N j        
where Z is a downsampling operator, B is a blurring function, M is a motion factor, and N is an additive noise. Subscript j, k stands for the image frame number, 1 j, k t, and t is the total frame number of images.
Shen et al. (2009) [58] also considered the photometric effects of the zenith angle and atmosphere by adding a linear system with the gain and offset of the photometric parameters into Equation (3). Let A be the degradation factor. The classic image restoration model (Equation (3)) can be simplified as:
y = A x + n          
The resolution enhancement thus becomes the solution for defining A, where n represents the noise vector.

3.1. Multi-Image SRR

3.1.1. The ML-Based SRR

We explored two popular multi-image SRRs here, namely, the ML and POCS. The likelihood was the reverse process of possibilities. The Maximum Likelihood (ML) finds the most likely solution for the observations by maximizing the conditional Probability Density Function (PDF) of p{y|x}.
Assuming that the low-resolution LST images, x, are uniform, and the data are geographically corrected (no motion estimation is required), the ML-SR reconstruction can be simplified as:
x ^ M L = a r g m i n x y A x 2  
The pseudo-inverse result to x and equating to zero gives:
x ^ M L = ( A T A ) 1 A T y  
Irani and Peleg [69] proposed a simplified algorithm that iteratively minimizes simulation errors convolved with a Back-Projection Function (BPF). We adapted their idea here. Firstly, an initial solution for the desired high-resolution image was estimated via a simple interpolation. Most studies take the average of upscaled low-resolution images, y k . We noticed that, when choosing the latest LST as the initial image, the ring effect makes the image too blurry and noisy. So, for a low-resolution image set, { y 0 ,   y 1 ,   ,   y t }, we averaged image frame, y i , to set it as the initial image:
y 0 = A x ¯ + n
The error between y 0 and y is corrected by back-projecting to x   until it meets the pre-defined requirement.
x i + 1 = x i + k h b p f S y ^ k y k ,     i = 0 , , t  
where h b p f is the back-projection kernel, S is the upsampling operator, and y ^ k is the simulated k-th low-resolution frame from the current high-resolution estimation, and k is a low-resolution pixel influenced by a high-resolution pixel.
The solution of BPF depends on the initialization and the selection of a back-projection kernel. It affects how much the errors for low-resolution images contribute to the next high-resolution guess. In this study, we assume that the effect is a Gaussian random process, n is an estimate of the super-resolved image, y ^ , and the total probability of an observed low-resolution image, y k   k = 1 , , t , t   i s   t h e   t o t a l   n u m b e r   o f   l o w     r e s o l u t   i o n i m a g e s , is:
p y k x = 1 2 π e x p y ^ k y k 2 2 σ 2
The choice of standard deviation σ is imperative, and a higher σ value creates smoother edges.

3.1.2. The POCS-Based SRR

The POCS method is an alternative iterative approach to incorporate prior knowledge about a solution into the reconstruction process. Let C i i = 1 , , m be a closed convex set that satisfies a certain property. The POCS uses prior knowledge to obtain the solution, and to find an intersection convex set, C s ( C s = i 1 m C i ) , by alternating projections. Such a process can be described as:
x n + 1 = P m P m 1 P 2 P 1 x 0 R
where   x 0 is an initial point and P i i = 1 , , m is the projection operator that projects each x to the convex sets, C i [68]. The prior knowledge, R, can be added to this equation to define the convex sets and projection algorithm.
The key to the POCS method is to solve a constrained optimization problem [70]. With the geographically corrected data, we assume that yK denotes the observed kth low-resolution images. The estimated low-resolution image is regarded as the image degenerated from the high-resolution image through the degrading function, h:
y k = w w h n x n      
where h is also called the Point Spread Function (PSF), due to the undersampling of low-resolution images, and we assume the degrading process via Gaussian blurring with blurring level (standard deviation) σ, and w is the PSF radius.
Define δ = c σ as a threshold that represents the observation confidence; c is a positive constant. x n is the ideal high-resolution image. Trussell and Civanlar [71] described the procedure as follows: if the residual r = y ^ k y k is in the threshold range, then x n remains the same; if r is outside the threshold range, then x n is increased or decreased until it reaches the near-zero value. During this process, a constant threshold, s, was used to constrain the convergence speed of the iterative process. The projection y k of an arbitrary x n onto C s can be given as:
P x n = x n + s r + δ h n ,   r < δ 0                                 ,     δ r δ     s r δ h n ,           r > δ
A new projector is determined in each restriction step and the successive convex sets converge at an intersection point to obtain the final solution [72]. The POCS utilizes the dominant spatial domain observation model. Many studies integrate the spatial and frequency domains to decrease the edge oscillation phenomena [70,73]. In this study, the sharp edges of LST images were not required, and we employed the POCS only in the space domain.

3.2. Single-Image Super Resolution (SISR)

Prior information is required so that a single image can be reconstructed. Such prior information is available either in the explicit form of an energy function defined on the image class, or in the implicit form of example images leading to example-based super resolutions.
In this section, we explore the SRR algorithms with external and internal databases. External database-driven super-resolution maps of high-resolution images were learned from a large database of low-resolution–high-resolution-image pairs, which we called the example-based method in this study. Internal database-driven super-resolution map high-resolution images created by exploiting similarities within the images are referred to as the self-similarity-based method.

3.2.1. The Example-Based Method

Freeman et al. [74] were one of the first scientists to propose example-based SRR approaches. Such approaches are patch-based, and each patch pair is connected through an image model (Equation (10)). The patterns between high-resolution and low-resolution images can be learned from patch examples, and a statistical model that aims to find patch reoccurrences is applied to a single low-resolution image to predict high-resolution images.
Ever since the example-based SISR method has been proposed and tested, further studies have been conducted [74,75], with a primary focus on natural images. Nasrollahi and Moeslund [45] reported the databases that were built for satellite and aerial imagery [76]. To obtain high-resolution LSTs, a specific database for LST image patches should be created, along with alleviating the data complexity and a simple prediction function.
During the training phase, 5000 available images of MODIS 1 km LSTs (cloud pixels < 10%, size N*N) were chosen from different regions and times from 2007 to 2008. We degraded each of the images to make the corresponding low-resolution datasets (size M*M, where N = 2,3,4,5*M). Note that N = 2*M means we blurred and subsample half of the high-resolution pixels from each dimension, thus the final low-resolution pixels were a quarter of high-resolution pixels. The factor that represents the desired scale should remain the same in one database.
Following Freeman et al. [74], we assumed that high-resolution–low-resolution image patches were independent, and normalized the image patches to increase the efficiency of the training set.
The bicubic spline interpolation was applied to the low-resolution images, and only the differences between high-resolution and low-resolution images were stored in the database. Moreover, we filtered out the lowest-frequency components since the most necessary prediction details were the highest-spatial-frequency components in this case [74]. Figure 2 presents an example of training imagery: select a region with cloud pixels < 10% (Figure 2b) from one MODIS 1 km cloud-free LST observation (Figure 2a), fill the empty gap by the bicubic spline interpolation to obtain a full-coverage high-resolution image (Figure 2c), and then obtain a low-resolution image (Figure 2d) by the nearest upscaling from Figure 2c.
While predicting the high-resolution LSTs, we performed the nearest interpolation on the low-resolution patch, and then this low-resolution patch was compared with low-resolution patches in the database. When matches are found, we generated a set of candidate estimates.
Similar to Freeman et al. [74], the Markov network was used to probabilistically model the spatial relationships between the patches. Based on learning, we can obtain the matrix of transition probability Ψ between high-resolution patches, as well as the matrix of transition probability ϕ between high-resolution and low-resolution patches. For a given low-resolution image, y, scan this with a small window (of size M), so that the corresponding position in the Markov network for each patch, as well as the relation between high-resolution patches, can be found; then, we added the high-frequency component to make the final estimation. The probability of a high-resolution patch can be given as:
p x y = 1 C ( i , j N s ( i ) ) Ψ i j x i , x j i ϕ i x i , y j
where C is a normalization constant, x i is the observed high-resolution patch at node i, and y j is the observed low-resolution patch at node j. NS (i) stands for the 8-connected neighbors of the pixel location, i.   Ψ and ϕ are specified as:
Ψ i j x i , x j = e x p x ^ i x ^ j β 2 σ 2
ϕ i x i , y j = e x p x ^ i y i 2 2 σ 2
σ is a noise parameter, β is used here to weigh the costs [77]. β > 1 favors a strong edge over small edges; β < 1 creates smoother edges. Belief propagation was used to find the best solution for Equation (14) from the candidate set. Four times iterations of the algorithm were used, which was sufficient according to Freeman et al. [74].
Sufficiency and predictability are the key success factors for this method [75]. With this specifically built LST database, the possibility of finding similar training data in the database was greatly enhanced.

3.2.2. The Self-Similarity Method

Example-based methods assume that missing high-resolution details can be learned and inferred from low-resolution images and a representative training set. To perform this, a large and representative database of high-resolution–low-resolution-image pairs, as well as mapping methods, were the two key factors to consider. Such a method has disadvantages: (1) the requirement of a large and various dataset; (2) the database might not be able to fully cover the missing high-frequency details; (3) the rich image structural information is not exploited; and (4) various learning algorithms can cause uncertainties [78]. Glasner et al. [79] combined the example-based super-resolution and self-similarity methods by exploiting patch recurrences within and across image scales without an external database. Nature images have self-similarity, which means that high-resolution and low-resolution patches in a single image tend to redundantly recur within the image at varying scales [79]. A possible way to avoid the use of training images was proposed in Huang [80], where they found patch recurrences in a single image with a pixel re-alignment similar to the example-based super-resolution method. This method builds an internal training set from the image pyramid itself. So, in this study, we also generated image patch pairs of one single frame instead of training an extrinsic set of images.

4. Results

4.1. Multiple-Image Downscaling

Two examples are shown in Figure 3 to demonstrate the results from the ML and POCS methods. The high-resolution LSTs corresponding to the low-resolution LSTs in Figure 4a (1:30 PM, 14 February 2008) were derived. Since only two images were presented to reconstruct high-resolution LSTs, both the ML and POCS downscaling levels were very limited. As mentioned before, due to the ringing effect, we averaged the images as the initial plane.
If two images are similar, like Figure 3a,b1, both the ML (Figure 3c1) and POCS (Figure 3d1) show good performances and can be used to downscale LSTs. However, when the two LST observations are different, like in Figure 3a,b2, the ML method (Figure 3c2) cannot reproduce the same or similar situations for the original coarse-resolution LST (Figure 3a) very well; instead, it provides a result more like an average LST of the two input observations (Figure 3a,b2). The POCS, under the same situation, demonstrates better results (Figure 3d2). The better performance of the POCS could be due to the sorting method initialization, where the original low-resolution LST is an input; thus, the result is closer to the original LST. However, the problem with the POCS method is the ringing effects [81], which are obvious in both Figure 3d1,d2. As for the Gaussian kernel, the standard deviation, σ, was set to 400 to obtain a smoother edge. Overall, such methods could be useful for slow-changing satellite images, like land cover type.

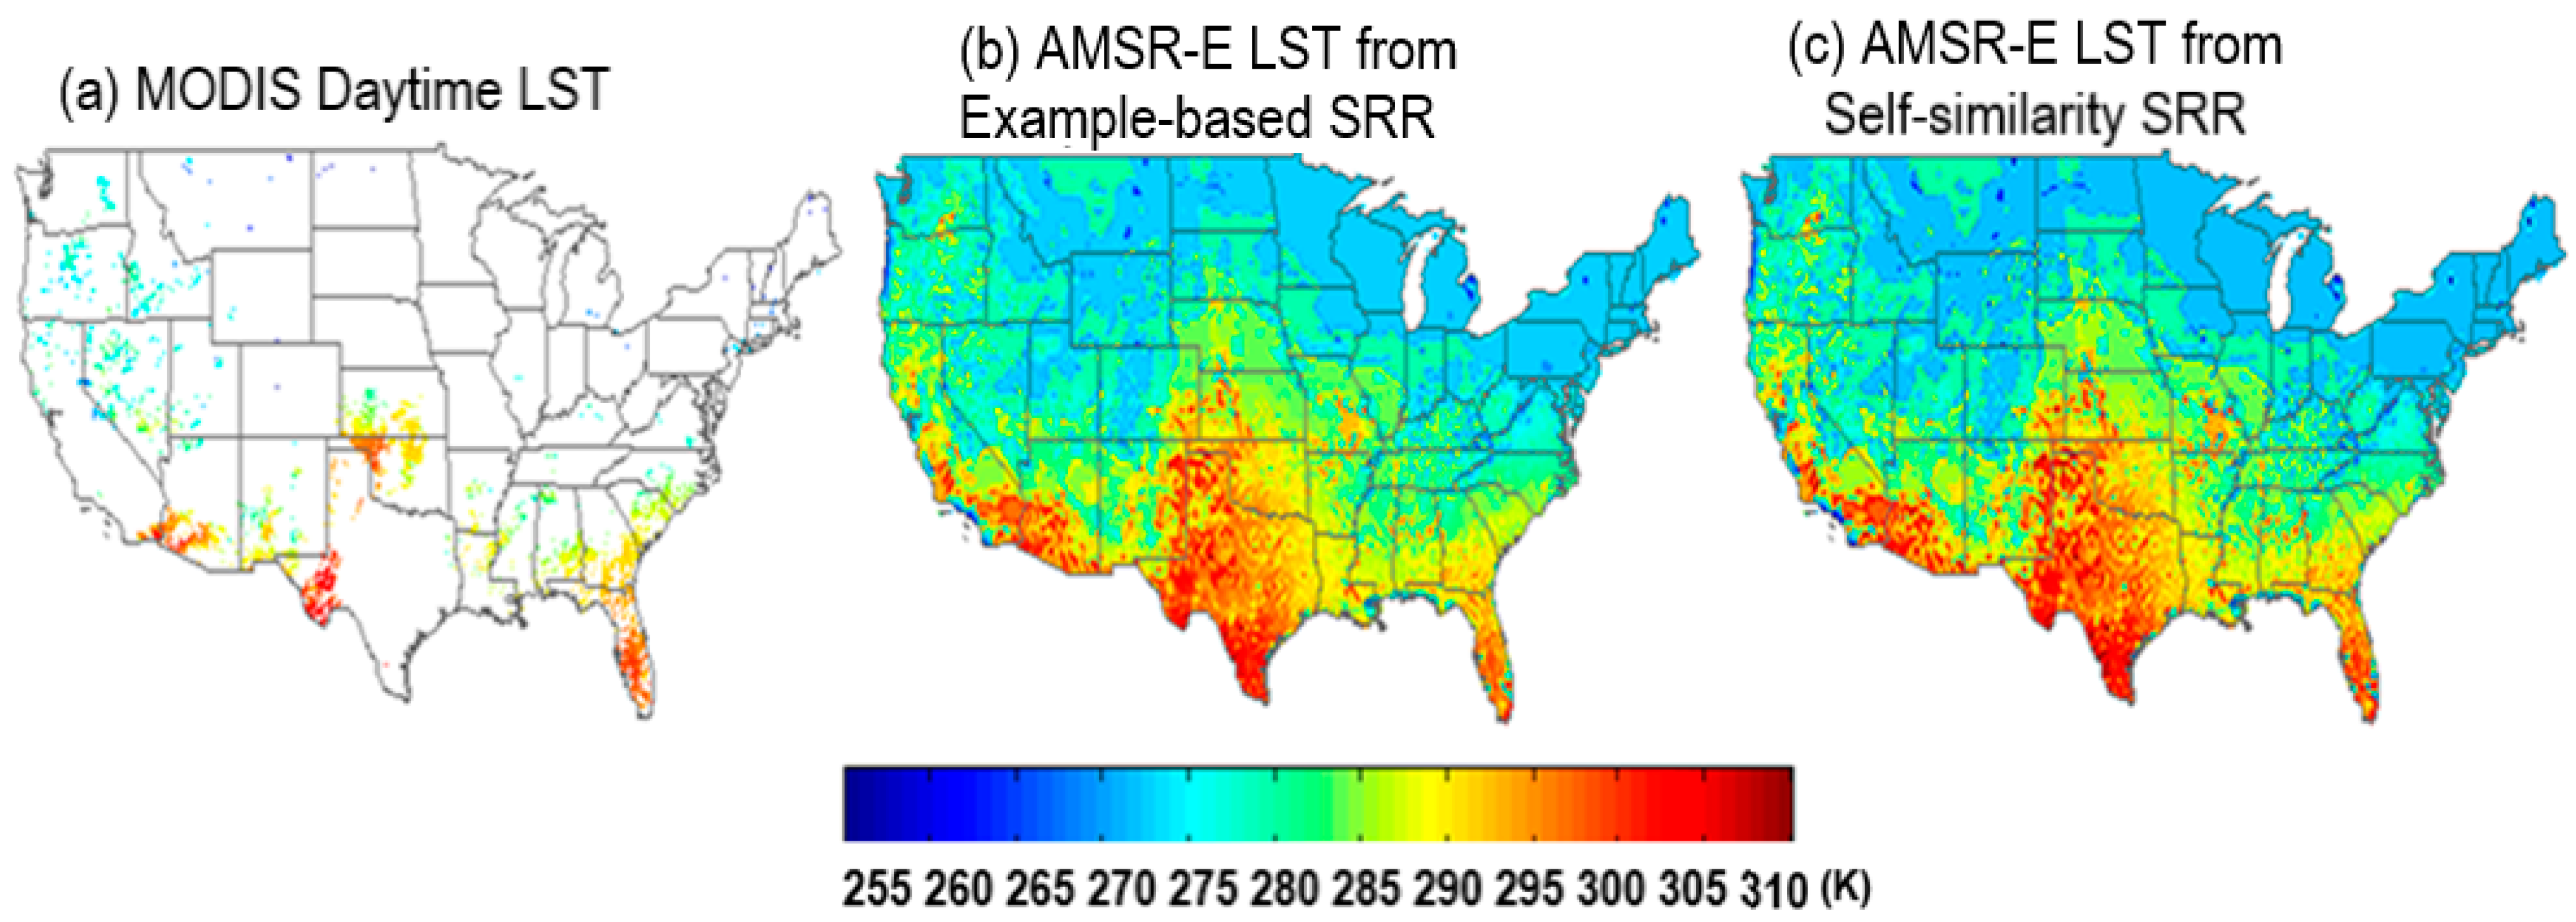
4.2. Single-Image Downscaling

The single-image SRR method was applied to the previous example shown in Figure 4. Figure 3a is the original image, with a coarse resolution of 25 km; an example-based SRR and self-similarity-based SRR were applied separately to obtain a high-resolution LST at a 1 km resolution. σ was also set to 400. As shown in Figure 4, to derive high-resolution LSTs corresponding to Figure 3a, both the example-based SRR and self-similarity-based SRR can reproduce similar patterns to the original coarse-resolution LST image (Figure 3a).
As shown in Figure 5, the LST is obtained from the AMSR-2 descending data; the GWR cannot be applied because there are no concurrent satellite observations. With the SRR method introduced in this study, the LST can be downscaled to 1 km. Since the example-based database used in this study was built especially for LSTs, compared with other databases for images, the example-based SRR developed in this study should work specifically for LST downscaling.
In this study, examples using the SRR single-image downscaling method are shown in Figure 6 and Figure 7, AMSR-E LSTs are downscaled from 25 km to 1 km (the same as the MODIS), and LSTs from the AMSR-2 are downscaled from 10 km to 4 km (the same as the GOES).
Given the original MODIS LST observations (Figure 6a) and GOES LSTs 1.5 h after sunrise (Figure 7a), the gap-free LSTs at the 1 km spatial-resolution observations could be derived (Figure 6b,c and Figure 7b,c). Figure 6b and Figure 7b are the high-resolution LSTs at a 1 km resolution obtained from the AMSR-E 25 km LSTs (Figure 6b) and AMSR-2 10 km LSTs with the example-based SRR method. Figure 6c and Figure 7c are high-resolution LSTs derived from the AMSR-E and AMSR-2 with the self-similarity-based SRR method. These results demonstrate that the SRR can help improve the spatial resolution of LSTs derived from the coarse-resolution passive microwave observations.

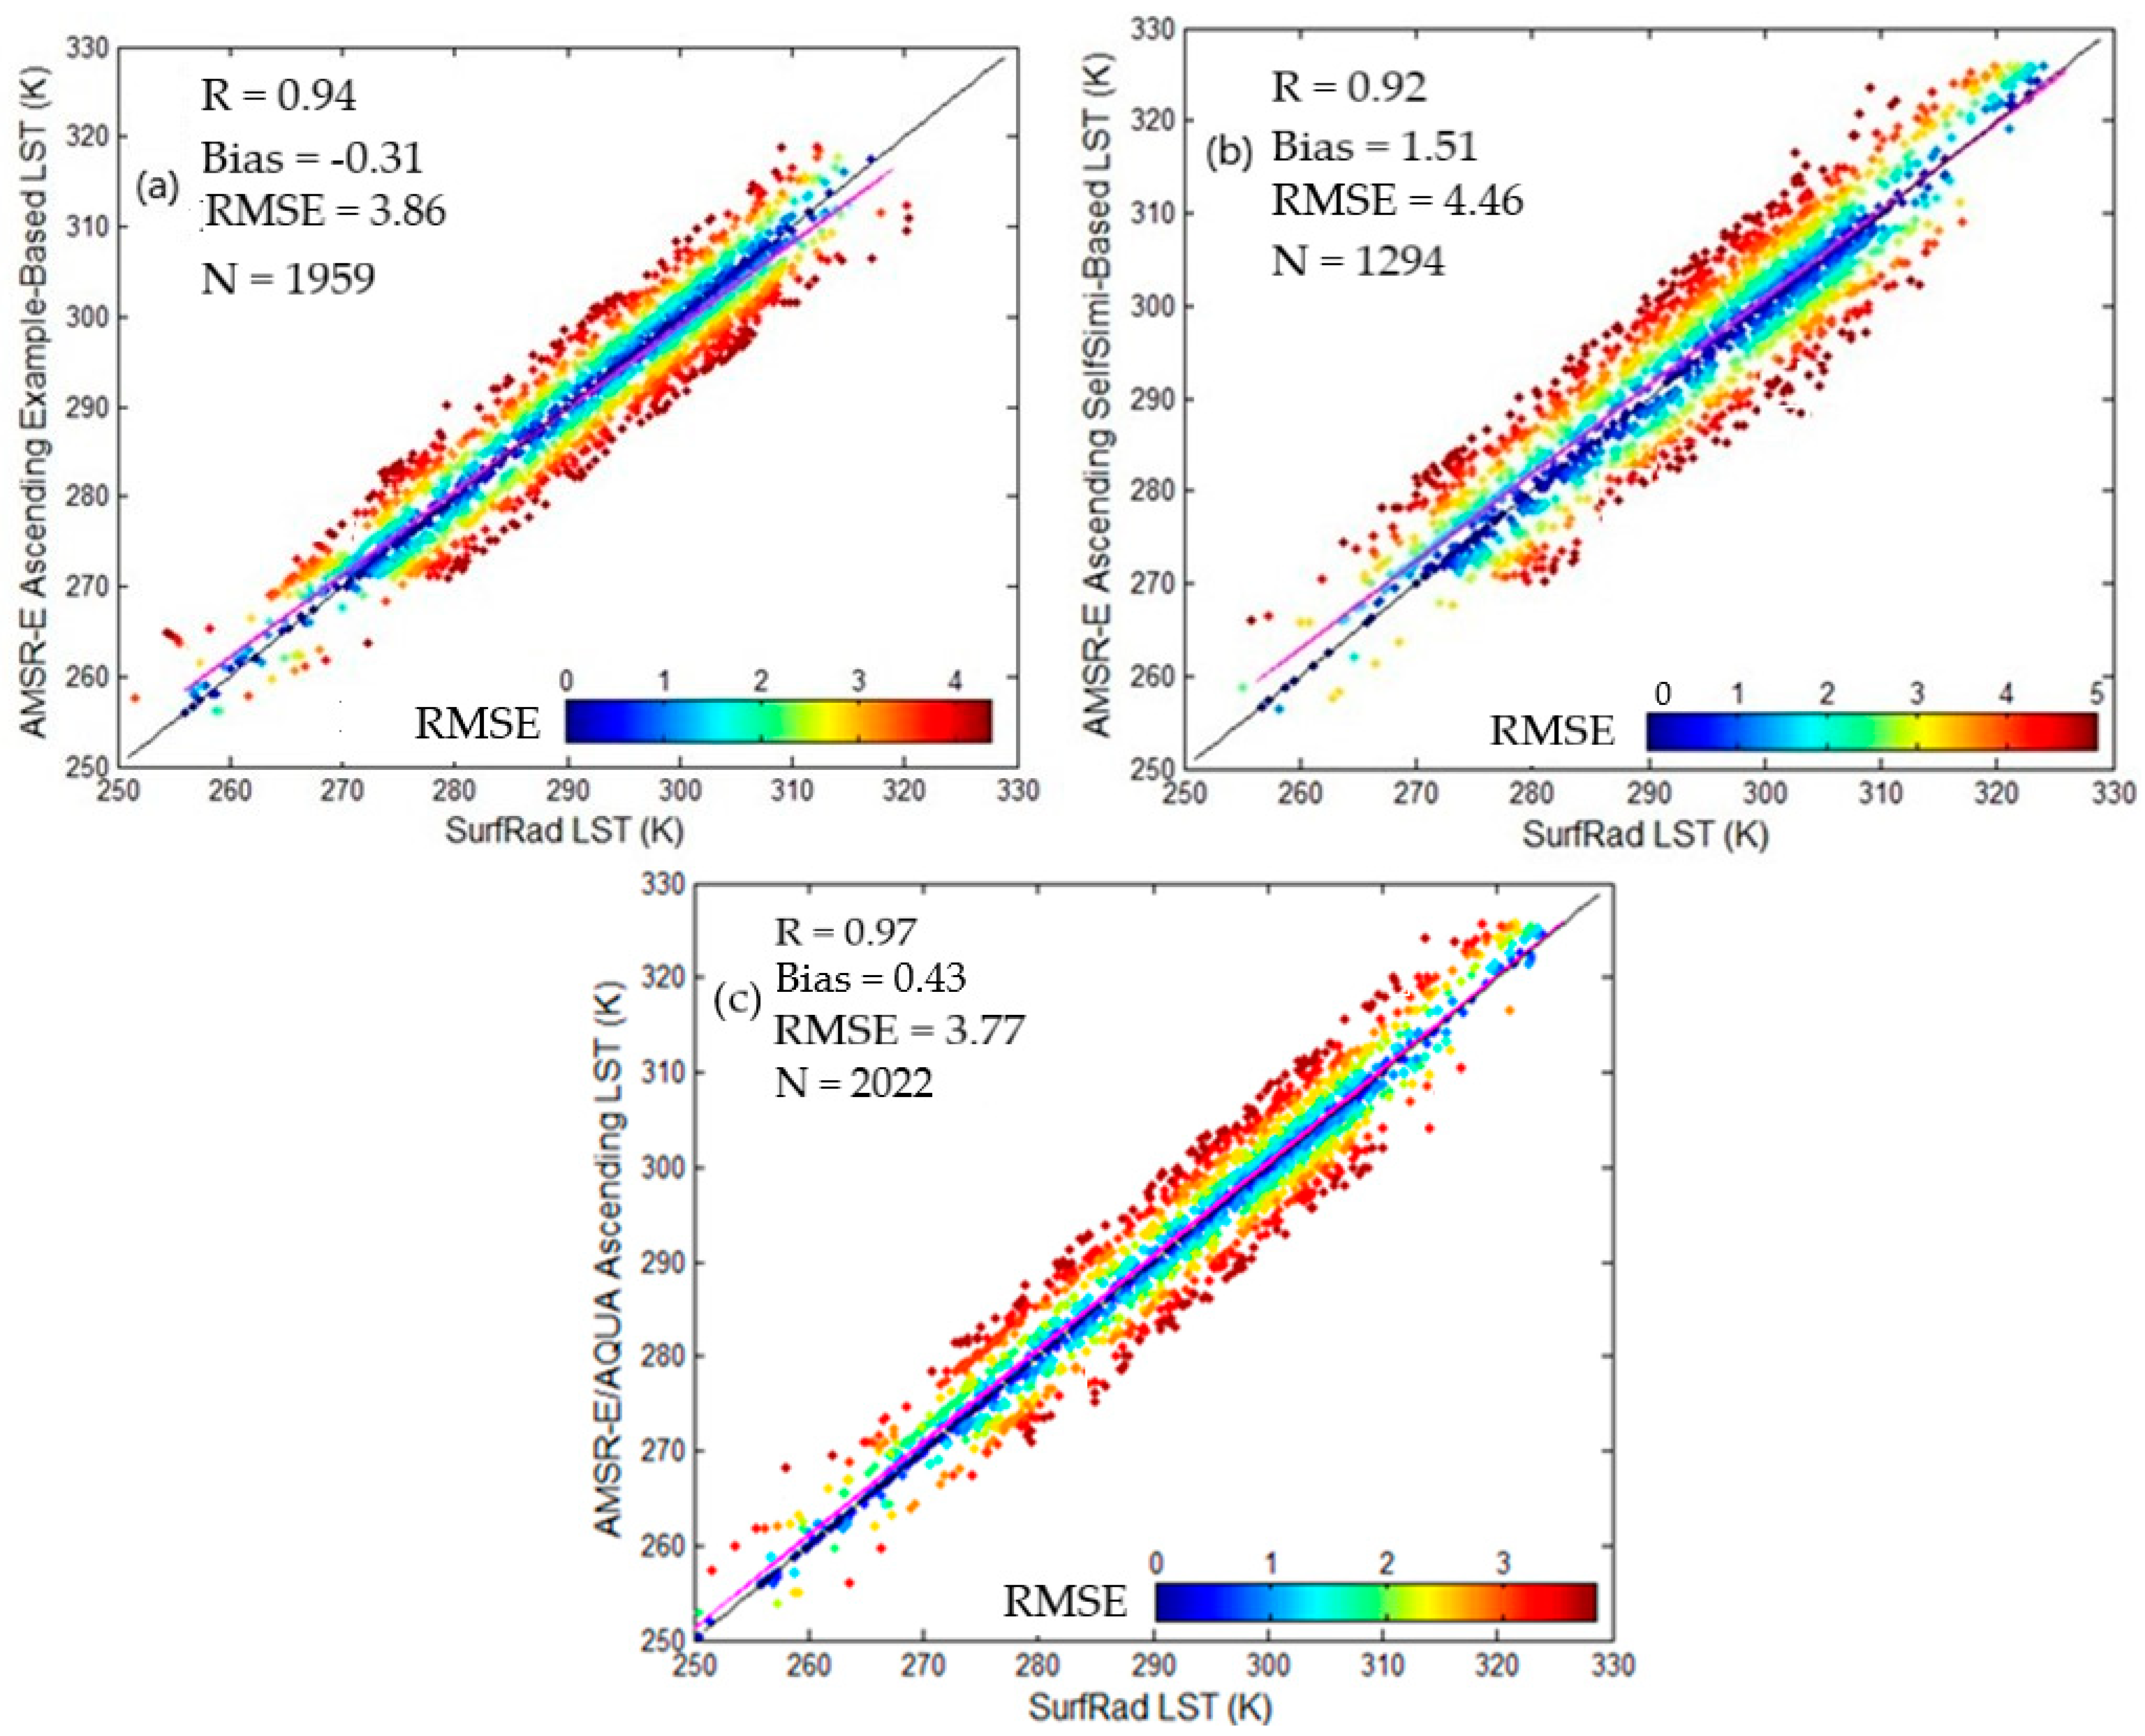
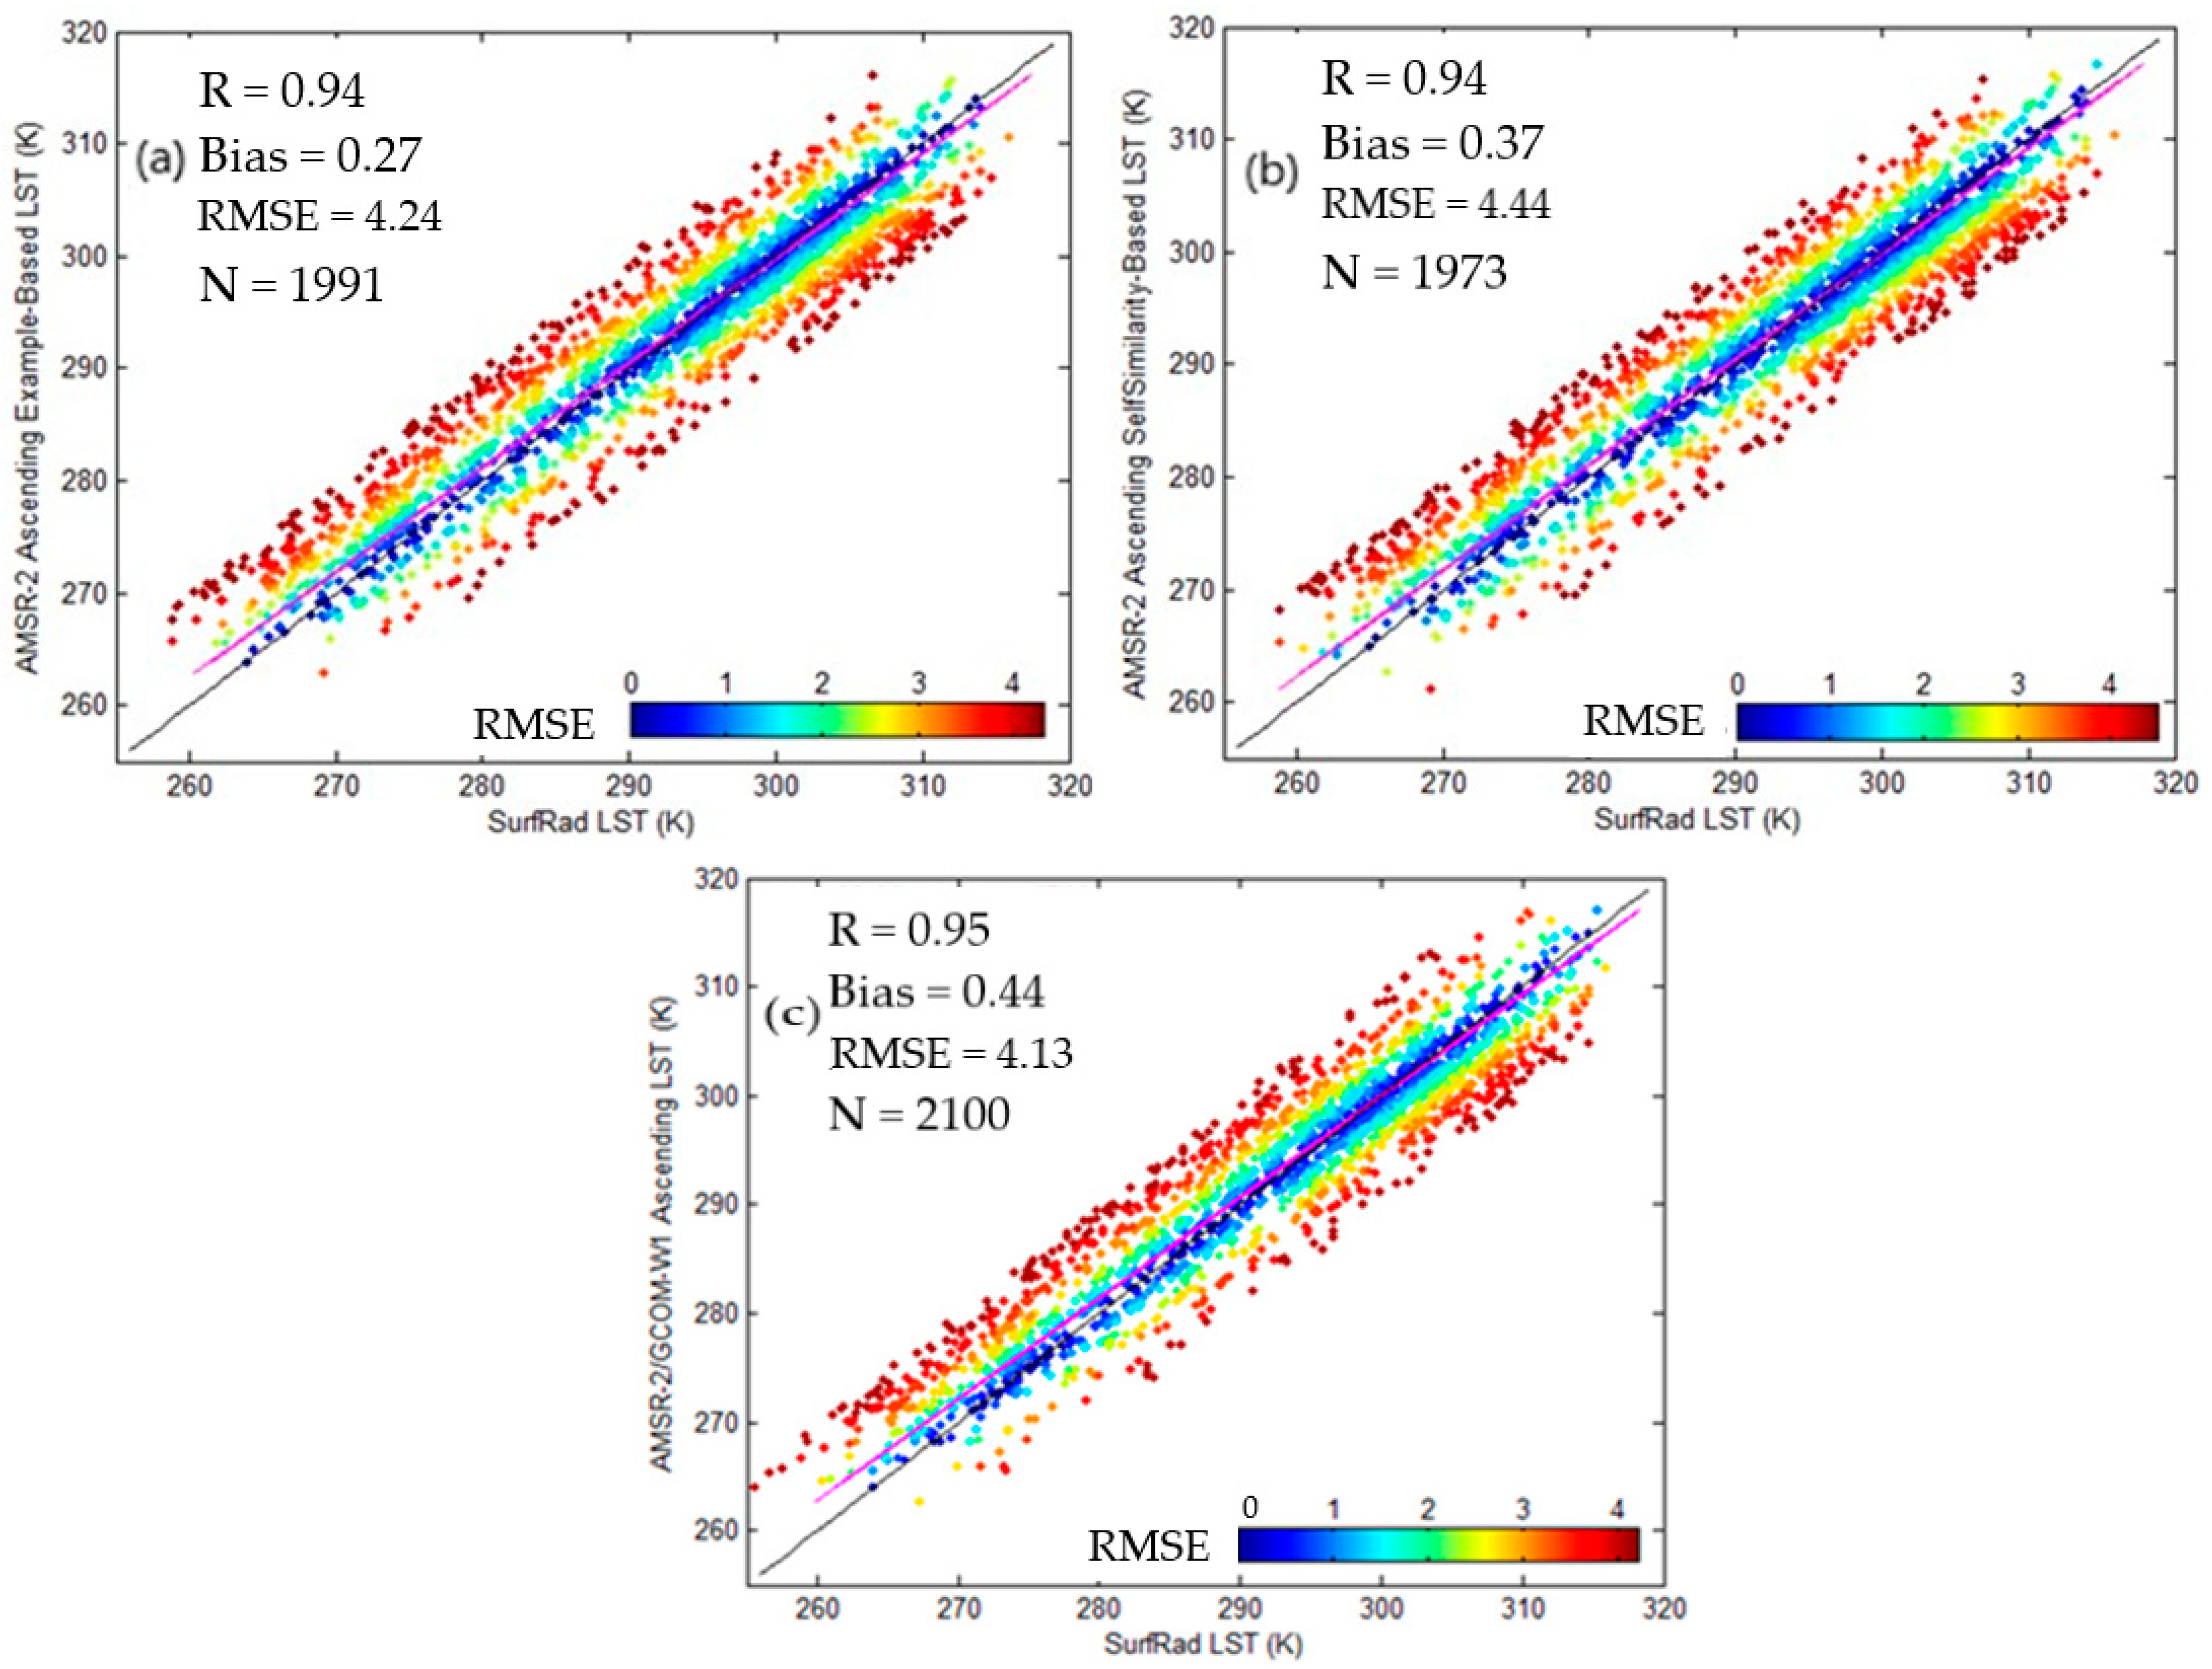
4.3. Results from the Validation against Ground Observations

The LSTs (1 km) obtained from the proposed example-based and self-similarity-based algorithms were validated against the ground observations. Figure 8 presents the AMSR-E LSTs compared with SURFRAD observations in 2008. For AMSR-E LSTs downscaled from the example-based method, the correlation is 0.94, the bias is −0.31 K, and the Root Mean Square Error (RMSE) is 3.86 K, while for the AMSR-E LSTs downscaled from the self-similarity-based method, the correlation is 0.92, the bias is 1.51 K, and the RMSE is 4.46 K. Compared with the original coarse-resolution AMSR-E LSTs, the correlation is 0.97, the bias is 0.43 K, and the RMSE is 3.77 K. The example-based method is better than the self-similarity-based method. Figure 9 presents the AMSR-2 LSTs compared with SURFRAD observations in 2015. For the AMSR-2 LSTs downscaled from the example-based method, the correlation is 0.94, the bias is 0.27 K, and the RMSE is 4.24 K, while for the AMSR-2 LSTs downscaled from the self-similarity-based method, the correlation is 0.94, the bias is 0.37 K, and the RMSE is 4.44 K. Compared with the original coarse-resolution AMSR-2 LSTs, the correlation is 0.95, the bias is 0.44 K, and the RMSE is 4.13 K. The results also indicate that, in general, the downscaled microwave LSTs have an RMSE of about 4 K. This error is similar to the original coarse-resolution microwave-based LSTs, as shown in Figure 8c and Figure 9c; so, the errors in the downscaled LSTs could have been inherited from the original microwave LSTs. The validation results from both the AMSR-E and AMSR-2 indicate the example-based method outperforms the self-similarity-based algorithm.

5. Discussion

Under clear-sky conditions, LSTs can be derived from optical sensors, such as the MODIS and GOES, with a reasonable quality [18,19,20,21,22,23,24,25,26]. However, a lot of areas (more than 60%) in the MODIS LST examples show missing data because of cloud contamination [41]. Under cloudy conditions, LSTs can be retrieved from passive microwave sensors, like the AMSR-E and AMSR-2, as they can penetrate non-rainy clouds, but the spatial resolution of passive microwave sensors is usually much more coarse than optical sensors.
In this study, the super-resolution technique was applied to downscale the LSTs derived from passive microwave sensors, such as the AMSR-E and AMSR-2, to the same spatial resolution as the optical LST products. With this new technology, further improvements can help to enhance the spatial resolution of LSTs derived from microwave measurements. With the method proposed here, spatial continuous LSTs on a daily basis can be obtained from passive microwave observations at the same spatial resolution as optical-based LSTs. The main objective of this study was to develop new methods to obtain spatial continuous LSTs under cloudy conditions. It is expected that daily LSTs with continuous spatial distributions obtained in this way can help soil moisture, surface-sensible and latent heat fluxes, evapotranspiration (ET), and drought index, like the Evaporative Stress Index (ESI), estimations on a daily basis under all sky conditions, and benefit future drought monitoring outcomes and improve urban heat island and environment studies.
The super-resolution technique can be implemented to obtain high-resolution LSTs without auxiliary data or any concurrent observations, while the existence of other concurrent high-resolution images as well as other auxiliary data are needed for other downscaling algorithms. When using other algorithms for LST downscaling, the selection of auxiliary datasets (such as vegetation or topographic indices) is critical for deriving high-resolution LSTs; if the auxiliary data and predictable data are not well-correlated (such as the NDVI and LST on an irrigation field), the effectiveness is limited.
Validations or evaluations of the downscaled microwave LSTs against ground observations were conducted. The validation results for both downscaled AMSR-E and AMSR-2 LSTs indicate the example-based method outperforms the self-similarity-based algorithm.

6. Conclusions

As clouds obscure thermal infrared LST observations, microwave sensors can penetrate most non-rainy clouds and observe the Earth’s surface. Therefore, under cloudy conditions, LSTs can be derived from passive microwave sensors, but usually at a coarse spatial resolution. In this study, the super-resolution method was applied to downscale LSTs derived from the microwave AMSR-E and AMSR-2 observations to the same spatial resolutions as the thermal MODIS and GOES LST products. In this way, daily spatial continuous LSTs can be obtained from coarse-resolution microwave observations at the same spatial resolution as thermal LST products. The downscaled LSTs with super-resolution techniques were validated against ground observations from the SURFRAD networks. The results indicate that, in general, downscaled microwave LSTs have an RMSE of about 4 K. This error is similar to the original microwave LSTs, so the errors in the downscaled LSTs could have been inherited from the original microwave LSTs. The validation results also indicate the example-based method outperforms the self-similarity-based algorithm.

Author Contributions

Conceptualization, Y.L. and D.S.; methodology, Y.L.; software, Y.L.; validation, Y.L., D.S. and X.Z.; formal analysis, Y.L.; investigation, Y.L. and D.S.; resources, X.Z.; data curation, Y.L.; writing—original draft preparation, Y.L.; writing—review and editing, D.S.; visualization, Y.L. and D.S.; supervision, D.S., X.Z., C.Y., P.H. and J.J.Q.; project administration, D.S., X.Z. and C.Y.; funding acquisition, X.Z. and D.S. All authors have read and agreed to the published version of the manuscript.

Funding

This research was funded by NOAA STAR through the NSF I/UCRC Grant for Spatiotemporal Thinking, Computing, and Applications (1841520).

Data Availability Statement

The data reported in this paper are presented in, archived in, or available from the GES DISC of NASA (https://disc.gsfc.nasa.gov/, accessed on 20 January 2024) and the CLASS of NOAA (https://www.avl.class.noaa.gov/, accessed on 20 January 2024).

Acknowledgments

The contents are solely the opinions of the authors and do not constitute a statement of policy, decision, or position on behalf of NOAA or the US Government. We thank the reviewers for their helpful and constructive comments to help us improve this paper.

Conflicts of Interest

The authors declare no conflicts of interest.

References

  1. Kustas, W.; Anderson, M. Advances in thermal infrared remote sensing for land surface modeling. Agric. For. Meteorol. 2009, 149, 2071–2081. [Google Scholar] [CrossRef]
  2. Anderson, M.C.; Norman, J.M.; Kustas, W.P.; Houborg, R.; Starks, P.J.; Agam, N. A thermal-based remote sensing technique for routine mapping of land-surface carbon, water and energy fluxes from field to regional scales. Remote Sens. Environ. 2008, 112, 4227–4241. [Google Scholar] [CrossRef]
  3. Keramitsoglou, I.; Kiranoudis, C.T.; Weng, Q. Downscaling Geostationary Land Surface Temperature Imagery for Urban Analysis. IEEE Trans. Geosci. Remote Sens. 2013, 10, 1253–1257. [Google Scholar] [CrossRef]
  4. Voogt, J.A.; Oke, T.R. Thermal remote sensing of urban climates. Remote Sens. Environ. 2003, 86, 370–384. [Google Scholar] [CrossRef]
  5. Estoque, R.C.; Murayama, Y. Monitoring surface urban heat island formation in a tropical mountain city using Landsat data (1987–2015). ISPRS J. Photogramm. Remote Sens. 2017, 133, 18–29. [Google Scholar] [CrossRef]
  6. Stathopoulou, M.; Cartalis, C. Downscaling AVHRR land surface temperatures for improved surface urban heat island intensity estimation. Remote Sens. Environ. 2009, 113, 2592–2605. [Google Scholar] [CrossRef]
  7. Hu, L.Q.; Brunsell, N.A. The impact of temporal aggregation of land surface temperature data for surface urban heat island (SUHI) monitoring. Remote Sens. Environ. 2013, 134, 162–174. [Google Scholar] [CrossRef]
  8. Leng, P.; Song, X.; Li, Z.L.; Ma, J.; Zhou, F.; Li, S. Bare surface soil moisture retrieval from the synergistic use of optical and thermal infrared data. Int. J. Remote Sens. 2014, 35, 988–1003. [Google Scholar] [CrossRef]
  9. Carlson, T. An overview of the ’triangle method’ for estimating surface evapotranspiration and soil moisture from satellite imagery. Sensors 2007, 7, 1612–1629. [Google Scholar] [CrossRef]
  10. Chauhan, N.S.; Miller, S.; Ardanuy, P. Spaceborne soil moisture estimation at high resolution: A microwave-optical/IR synergistic approach. Int. J. Remote Sens. 2003, 24, 4599–4622. [Google Scholar] [CrossRef]
  11. Lu, J.; Tang, R.; Tang, H.; Li, Z.L. Derivation of daily evaporative fraction based on temporal variations in surface temperature, air temperature, and net radiation. Remote Sens. 2013, 5, 5369–5396. [Google Scholar] [CrossRef]
  12. Anderson, M.C.; Kustas, W.P.; Alfieri, J.G.; Gao, F.; Hain, C.; Prueger, J.H.; Evett, S.; Colaizzi, P.; Howell, T.; Chavez, J.L. Mapping daily evapotranspiration at Landsat spatial scales during the BEAREX’08 field campaign. Adv. Water Resour. 2012, 50, 162–177. [Google Scholar] [CrossRef]
  13. Anderson, M.C.; Norman, J.M.; Mecikalski, J.R.; Otkin, J.A.; Kustas, W.P. A climatological study of evapotranspiration and moisture stress across the continental United States based on thermal remote sensing: 2. Surface moisture climatology. J. Geophys. Res. Atmos. 2007, 112, D11. [Google Scholar] [CrossRef]
  14. Anderson, M.C.; Norman, J.M.; Mecikalski, J.R.; Otkin, J.A.; Kustas, W.P. A climatological study of evapotranspiration and moisture stress across the continental United States based on thermal remote sensing: 1. Model formulation. J. Geophys. Res. Atmos. 2007, 112, D10. [Google Scholar] [CrossRef]
  15. Wang, P.X.; Li, X.W.; Gong, J.Y.; Song, C. Vegetation temperature condition index and its application for drought monitoring. In Proceedings of the IEEE International Geoscience and Remote Sensing Symposium 2001, Sydney, Australia, 9–13 July 2001; pp. 141–143. [Google Scholar]
  16. Wan, Z.M.; Wang, P.X.; Li, X.W. Using MODIS land surface temperature and normalized difference vegetation index products for monitoring drought in the southern Great Plains, USA. Int. J. Remote Sens. 2004, 25, 61–72. [Google Scholar] [CrossRef]
  17. Lorenz, D.J.; Otkin, J.A.; Svoboda, M.; Hain, C.R.; Anderson, M.C.; Zhong, Y. Predicting the US Drought Monitor (USDM) using precipitation, soil moisture, and evapotranspiration anomalies, part II: Intraseasonal drought intensification forecasts. J. Hydrometeorol. 2017, 18, 1963–1982. [Google Scholar] [CrossRef]
  18. Pinheiro, A.C.T.; Mahoney, R.; Privette, J.L.; Tucker, C.J. Development of a daily long term record of NOAA-14 AVHRR land surface temperature over Africa. Remote Sens. Environ. 2006, 103, 153–164. [Google Scholar] [CrossRef]
  19. Wan, Z.; Dozier, J. Land-surface temperature measurement from space: Physical principles and inverse modeling. IEEE Trans. Geosci. Remote Sens. 1989, 27, 268–278. [Google Scholar]
  20. Wan, Z.; Dozier, J. A generalized split-window algorithm for retrieving land-surface temperature from space. IEEE Trans. Geosci. Remote Sens. 1996, 34, 892–905. [Google Scholar]
  21. Wan, Z.; Li, Z. A physics-based algorithm for retrieving land-surface emissivity and temperature from EOS/MODIS data. IEEE Trans. Geosci. Remote Sens. 1997, 35, 980–996. [Google Scholar]
  22. Li, H.; Sun, D.; Yu, Y.; Wang, H.; Liu, Y.; Liu, Q.; Du, Y.; Wang, H.; Cao, B. Evaluation of the VIIRS and MODIS LST products in an arid area of Northwest China. Remote Sens. Environ. 2015, 142, 111–121. [Google Scholar] [CrossRef]
  23. Sun, D.; Pinker, R.T. Estimation of land surface temperature from a Geostationary Operational Environmental Satellite (GOES-8). J. Geophys. Res. 2003, 108, D11. [Google Scholar] [CrossRef]
  24. Sun, D.; Pinker, R.T.; Basara, J.B. Land surface temperature estimation from the next generation of Geostationary Operational Environmental Satellites: GOES M-Q. J. Appl. Meteorol. Climatol. 2004, 43, 363–372. [Google Scholar] [CrossRef]
  25. Sun, D.; Yu, Y.; Yang, H.; Liu, Q.; Shi, J. Inter-comparison of land surface temperature retrieved from GOES-East, GOES-West, and MODIS. Int. J. Digit. Earth 2013, 8, 476–494. [Google Scholar] [CrossRef]
  26. Sun, D.; Yu, Y.; Fang, L.; Liu, Y. Toward an operational land surface temperature algorithm for GOES. J. Appl. Meteor. Climatol. 2013, 52, 1974–1986. [Google Scholar] [CrossRef]
  27. McFarland, M.J.; Miller, R.L.; Neale, C.M.U. Land surface temperature derived from the SSM/I passive microwave brightness temperatures. IEEE Trans. Geosci. Remote Sens. 1990, 28, 839–845. [Google Scholar] [CrossRef]
  28. Davis, D.; Chen, Z.; Nwang, H.N.; Tsang, L.; Njoku, E. Solving inverse problems by Bayesian iterative inversion of a forward model with applications to parameter mapping using SMMR remote sensing data. IEEE Trans. Geosci. Remote Sens. 1995, 33, 1182–1193. [Google Scholar] [CrossRef]
  29. Njoku, E.G. Surface Temperature Estimation over Land Using Satellite Microwave Radiometry; CRC Press: Boca Raton, FL, USA, 1993; pp. 1–28, Chapter 93-0446. [Google Scholar]
  30. Basist, A.; Grody, N.C.; Peterson, T.C.; Williams, C.N. Using the special sensor microwave/imager to monitor land surface temperatures, wetness, and snow cover. J. Appl. Meteor. 1998, 37, 888–911. [Google Scholar] [CrossRef]
  31. Njoku, E.G.; Li, L. Retrieval of land surface parameters using passive microwave measurements at 6 to 18 GHz. IEEE Trans. Geosci. Remote Sens. 1999, 37, 79–93. [Google Scholar] [CrossRef]
  32. Holmes, T.R.H.; de Jeu, R.A.M.; Owe, M.; Dolman, A.J. Land surface temperature from Ka band (37 GHz) passive microwave observations. J. Geophys. Res. 2009, 114, D04113. [Google Scholar] [CrossRef]
  33. André, C.; Ottlé, C.; Royer, A.; Maignan, F. Land surface temperature retrieval over circumpolar Arctic using SSM/I–SSMIS and MODIS data. Remote Sens. Environ. 2015, 162, 1–10. [Google Scholar] [CrossRef]
  34. Prigent, C.; Jimenez, C.; Aires, F. Toward “all weather,” long record, and real-time land surface temperature retrievals from microwave satellite observations. J. Geophys. Res. Atmos. 2016, 121, 5699–5717. [Google Scholar] [CrossRef]
  35. Ermida, S.L.; DaCamara, C.C.; Trigo, I.F.; Pires, A.C.; Ghent, D.; Remedios, J. Modelling directional effects on remotely sensed land surface temperature. Remote Sens. Environ. 2017, 190, 56–69. [Google Scholar] [CrossRef]
  36. Mao, K.B.; Shi, J.C.; Li, Z.L. A physics-based statistical algorithm for retrieving land surface temperature from AMSR-E passive microwave data. Sci. China Ser. D Earth Sci. 2007, 50, 1115–1120. [Google Scholar] [CrossRef]
  37. Mao, K.; Shi, J.; Tang, H.; Guo, Y.; Qiu, Y. A neural-network technique for retrieving land surface temperature from AMSR-E passive microwave data. In Proceedings of the IEEE International Geoscience and Remote Sensing Symposium 2007, Barcelona, Spain, 23–27 July 2007; pp. 4422–4425. [Google Scholar]
  38. Sun, D.; Li, Y.; Zhan, X.; Houser, P.; Yang, C.; Chiu, L.; Yang, R. Land surface temperature derivation under all sky conditions through integrating AMSR-E/AMSR-2 and MODIS/GOES observations. Remote Sens. 2019, 11, 1704. [Google Scholar] [CrossRef]
  39. Kou, X.; Jiang, L.; Bo, Y.; Yan, S.; Chai, L. Estimation of land surface temperature through blending MODIS and AMSR-E data with the Bayesian maximum entropy method. Remote Sens. 2016, 8, 105. [Google Scholar] [CrossRef]
  40. Duan, S.-B.; Li, Z.-L.; Leng, P. A framework for the retrieval of all-weather land surface temperature at a high spatial resolution from polar-orbiting thermal infrared and passive microwave data. Remote Sens. Environ. 2017, 195, 107–117. [Google Scholar] [CrossRef]
  41. Zhang, X.; Zhou, J.; Göttsche, F.-M.; Zhan, W.; Liu, S.; Cao, R. A method based on temporal component decomposition for estimating 1-km all-weather land surface temperature by merging satellite thermal infrared and passive microwave observations. IEEE Trans. Geosci. Remote Sens. 2019, 7, 4670–4691. [Google Scholar] [CrossRef]
  42. Xu, S.; Cheng, J.; Zhang, Q. Reconstructing all-weather land surface temperature using the Bayesian maximum entropy method over the tibetan plateau and heihe river basin. IEEE J. Sel. Top. Appl. Earth Obs. Remote Sens. 2019, 12, 3307–3316. [Google Scholar] [CrossRef]
  43. Atkinson, P.M. Downscaling in remote sensing. Int. J. Appl. Earth Obs. Geoinf. 2013, 22, 106–114. [Google Scholar] [CrossRef]
  44. Jin, Y.; Ge, Y.; Wang, J.; Heuvelink, G.B.M.; Wang, L. Geographically Weighted Area-to-Point Regression Kriging for Spatial Downscaling in Remote Sensing. Remote Sens. 2018, 10, 579. [Google Scholar] [CrossRef]
  45. Nasrollahi, K.; Moeslund, T.B. Super-resolution: A comprehensive survey. Mach. Vis. Appl. 2014, 25, 1423–1468. [Google Scholar] [CrossRef]
  46. Kustas, W.P.; Norman, J.M.; Anderson, M.C.; French, A.N. Estimating subpixel surface temperatures and energy fluxes from the vegetation index-radiometric temperature relationship. Remote Sens. Environ. 2003, 85, 429–440. [Google Scholar]
  47. Gao, F.; Kustas, W.; Anderson, M. A data mining approach for sharpening thermal satellite imagery over land. Remote Sens. 2012, 4, 3287–3319. [Google Scholar] [CrossRef]
  48. Inamdar, A.K.; French, A. Disaggregation of GOES land surface temperatures using surface emissivity. Geophys. Res. Lett. 2009, 36, 1–5. [Google Scholar] [CrossRef]
  49. Essa, W.; Verbeiren, B.; van der Kwast, J.; Van de Voorde, T.; Batelaan, O. Evaluation of the DisTrad thermal sharpening methodology for urban areas. Int. J. Appl. Earth Obs. Geoinf. 2012, 19, 163–172. [Google Scholar] [CrossRef]
  50. Zakšek, K.; Oštir, K. Downscaling land surface temperature for urban heat island diurnal cycle analysis. Remote Sens. Environ. 2012, 117, 114–124. [Google Scholar] [CrossRef]
  51. Sun, D.; Kafatos, M. Note on the NDVI-LST relationship and the use of temperature-related drought indices over North America. Geophys. Res. Lett. 2007, 34, L24406. [Google Scholar] [CrossRef]
  52. Duan, S.; Li, Z. Spatial downscaling of MODIS land surface temperatures using geographically weighted regression: Case study in northern China. IEEE Trans. Geosci. Remote Sens. 2016, 54, 6458–6469. [Google Scholar] [CrossRef]
  53. Li, W.; Ni, L.; Li, Z.; Duan, S.B.; Wu, H. Evaluation of machine learning algorithms in spatial downscaling of MODIS land surface temperature. IEEE J. Sel. Top. Appl. Earth Obs. Remote Sens. 2019, 12, 2299–2307. [Google Scholar] [CrossRef]
  54. Hutengs, C.; Vohland, M. Downscaling land surface temperatures at regional scales with random forest regression. Remote Sens. Environ. 2016, 178, 127–141. [Google Scholar] [CrossRef]
  55. Yang, Y.; Cao, C.; Pan, X.; Li, X.; Zhu, X. Downscaling land surface temperature in an arid area by using multiple remote sensing indices with random forest regression. Remote Sens. 2017, 9, 789. [Google Scholar] [CrossRef]
  56. Zhang, Q.; Wang, N.; Cheng, J.; Xu, S. A Stepwise Downscaling Method for Generating High-Resolution Land Surface Temperature from AMSR-E Data. IEEE J. Sel. Top. Appl. Earth Obs. Remote Sens. 2020, 13, 5669–5681. [Google Scholar] [CrossRef]
  57. Akgun, T.; Altunbasak, Y.; Mersereau, R.M. Super-resolution reconstruction of hyperspectral images. IEEE Trans. Image Process 2005, 14, 1860–1875. [Google Scholar] [CrossRef] [PubMed]
  58. Shen, H.; Ng, M.K.; Li, P.; Zhang, L. Super-resolution reconstruction algorithm to MODIS remote sensing images. Comput. J. 2009, 52, 90–100. [Google Scholar] [CrossRef]
  59. Zhang, H.; Zeyu Yang, Z.; Zhang, L.; Shen, H. Super-Resolution Reconstruction for Multi-Angle Remote Sensing Images Considering Resolution Differences. Remote Sens. 2014, 6, 637–657. [Google Scholar] [CrossRef]
  60. Galbraith, A.E.; Theiler, J.; Thome, K.J.; Ziolkowski, R.W. Resolution enhancement of multilook imagery for the multispectral thermal imager. IEEE Trans. Geosci. Remote Sens. 2005, 43, 1964–1977. [Google Scholar] [CrossRef]
  61. Kawanishi, T.; Sezai, T.; Ito, Y.; Imaoka, K.; Takeshima, T.; Ishido, Y.; Shibata, A.; Miura, M.; Inahata, H.; Spencer, R.W. The Advanced Microwave Scanning Radiometer for the Earth Observing System (AMSR-E), NASDA’s contribution to the EOS for global energy and water cycle studies. IEEE Trans. Geosci. Remote Sens. 2003, 41, 184–194. [Google Scholar] [CrossRef]
  62. McCabe, M.F.; Gao, H.; Wood, E.F. Evaluation of AMSR-E-derived soil moisture retrievals using ground-based and PSR airborne data during SMEX02. J. Hydrometeorol. 2005, 6, 864–877. [Google Scholar] [CrossRef]
  63. Japan Aerospace Exploration Agency. GCOM-W1 “SHIZUKU” Data Users Handbook; Tsukuba Space Center, Japan Aerospace Exploration Agency: Ibaraki, Japan, 2013. [Google Scholar]
  64. Hulley, G.C.; Hook, S.J. Intercomparison of versions 4, 4.1 and 5 of the MODIS Land Surface Temperature and Emissivity products and validation with laboratory measurements of sand samples from the Namib desert, Namibia. Remote Sens. Environ. 2009, 113, 1313–1318. [Google Scholar] [CrossRef]
  65. Huete, A.; Justice, C.; van Leeuwen, W. MODIS Vegetation Index (MOD13). 1999. Available online: https://modis.gsfc.nasa.gov/data/atbd/atbd_mod13.pdf (accessed on 20 January 2024).
  66. Peng, X.; Wu, W.; Zheng, Y.; Sun, J.; Hu, T.; Wang, P. Correlation analysis of land surface temperature and topographic elements in Hangzhou, China. Sci. Rep. 2020, 10, 10451. [Google Scholar] [CrossRef] [PubMed]
  67. Gesch, D.; Oimoen, M.; Greenlee, S.; Nelson, C.; Steuck, M.; Tyler, D. The national elevation dataset. Photogramm. Engineer. Remote Sens. 2002, 68, 5–11. [Google Scholar]
  68. Park, S.C.; Park, M.K.; Kang, M.G. Super-resolution image reconstruction: A technical overview. IEEE Signal Process. Mag. 2003, 20, 21–36. [Google Scholar] [CrossRef]
  69. Irani, M.; Peleg, S. Improving resolution by image registration. CVGIP Graph. Models Image Process. 1991, 53, 231–239. [Google Scholar] [CrossRef]
  70. Shen, W.; Fang, L.; Chen, X.; Xu, H. Projection onto Convex Sets Method in Space-Frequency Domain for Super Resolution. J. Comput. 2014, 9, 1959–1966. [Google Scholar] [CrossRef]
  71. Trussell, H.; Civanlar, M. The feasible solution in signal restoration. IEEE Trans. Acoust. Speech Signal Process. 1984, 32, 201–212. [Google Scholar] [CrossRef]
  72. Aguena, M.L.; Mascarenhas, N.D. Multispectral image data fusion using POCS and super-resolution. Comput. Vis. Image Underst. 2006, 102, 178–187. [Google Scholar] [CrossRef]
  73. Tekalp, A.M.; Ozkan, M.K.; Sezan, M.I. High-resolution image reconstruction from lower-resolution image sequences and space-varying image restoration. In Proceedings of the ICASSP-92: 1992 IEEE International Conference on Acoustics, Speech, and Signal Processing, San Francisco, CA, USA, 23–26 March 1992; Volume 3, pp. 169–172. [Google Scholar]
  74. Freeman, W.T.; Jones, T.R.; Pasztor, E.C. Example-based super-resolution. IEEE Comput. Graph. Appl. 2002, 22, 56–65. [Google Scholar] [CrossRef]
  75. Kim, K.I.; Kwon, Y. Example-based learning for single-image super-resolution. In Joint Pattern Recognition Symposium; Springer: Berlin/Heidelberg, Germany, 2008. [Google Scholar]
  76. Said, E.H.; Homaifar, A.; Grossberg, M. Creating virtual sensors using learning based super-resolution and data fusion. In Proceedings of the 2009 IEEE Aerospace Conference, Big Sky, MT, USA, 7–14 March 2009; pp. 1–9. [Google Scholar]
  77. Kim, C.; Choi, K.; Ra, J.B. Improvement on learning-based super-resolution by adopting residual information and patch reliability. In Proceedings of the 2009 16th IEEE International Conference on Image Processing (ICIP), Cairo, Egypt, 7–10 November 2009; pp. 1197–1200. [Google Scholar]
  78. Yang, C.Y.; Huang, J.B.; Yang, M.H. Exploiting self-similarities for single frame super-resolution. In Lecture Notes in Computer Science, Proceedings of the Asian Conference on Computer Vision, Queenstown, New Zealand, 8–12 November 2010; Springer: Berlin/Heidelberg, Germany, 2010. [Google Scholar]
  79. Glasner, D.; Bagon, S.; Irani, M. Super-Resolution from a Single Image. In Proceedings of the 2009 IEEE 12th International Conference on Computer Vision, Kyoto, Japan, 29 September–2 October 2009. [Google Scholar] [CrossRef]
  80. Huang, J.B.; Singh, A.; Ahuja, N. Single image super-resolution from transformed self-exemplars. In Proceedings of the IEEE Conference on Computer Vision and Pattern Recognition, Boston, MA, USA, 7–12 June 2015; pp. 5197–5206. [Google Scholar]
  81. Nasonov, A.V.; Krylov, A.S. Scale-space method of image ringing estimation. In Proceedings of the 2009 16th IEEE International Conference on Image Processing (ICIP), Cairo, Egypt, 7–10 November 2009; pp. 2793–2796. [Google Scholar]
Figure 1. Spatial distributions of (a) MODIS LST, (b) AMSR-E LST, (c) TsHARP, and (d) GWR downscaled LSTs for an image at the same time on 2 October 2008. The legend represents LSTs in Kelvin (K).
Remotesensing 16 00739 g001
Figure 2. An example of training data. (a) MODIS 1 km LSTs; (b) the selected region for the high-resolution version of the image; (c) bicubic spline interpolation for the full-coverage high-resolution image; (d) the low-resolution version of the image. The legend color scale is for LSTs in Kelvin (K).
Remotesensing 16 00739 g002
Figure 3. Spatial distributions of (a) AMSR-E LST around 1:30 PM on 14 February 2008, (b1) AMSR-E-based LST on previous day around 1:30 PM, (c1) the ML downscaled LST based on (a,b1), (d1) the POCS downscaled LST based on (a,b1); (b2) AMSR-E LST on the same day but at a different time at around 10:30 AM, (c2) the ML downscaled LST based on (a,b2), and (d2) the POCS downscaled LST based on (a,b2). The legend represents LSTs in Kelvin (K).
Remotesensing 16 00739 g003
Figure 4. An example for high-resolution LSTs on 14 February 2008 using different SRR methods: (a) example-based method; (b) self-similarity-based method. The color scale represents LSTs in Kelvin (K).
Remotesensing 16 00739 g004
Figure 5. An example of different super-resolution methods: (a) the original low-resolution image (10 km), (b) the corresponding high-resolution LST derived from the example-based method, and (c) the high-resolution LST derived from the self-similarity-based method. The data are the AMSR-2 LSTs during the descending pass at nighttime on 9 August 2015. The legend represents LSTs in Kelvin (K).
Remotesensing 16 00739 g005
Figure 6. An example for the final downscaled high-resolution AMSR-E LSTs derived from (b) example-based SRRs and (c) self-similarity SRRs, compared with the MODIS LSTs obtained during daytime (a) on 8 December 2008. The legend represents LSTs in Kelvin (K).
Remotesensing 16 00739 g006
Figure 7. The final high-resolution AMSR-2 LSTs obtained from the example-based SRR method (b) and the self-similarity-based SRR method (c), compared with the GOES LSTs at 1.5 h after sunrise (a) on 29 March 2015. The legend represents LSTs in Kelvin (K).
Remotesensing 16 00739 g007
Figure 8. Scatter plots of the AMSR−E LST vs. SURFRAD observations in 2008 during the daytime: (a) LSTs derived from the example-based SRR and (b) LSTs derived from the self-similarity-based SRR, compared with the original low-resolution AMSR−E LSTs (c). Bias refers to the Mean Bias Error (MBE) or accuracy, the RMSE is for the Root Mean Square Error, R represents the Pearson’s correlation coefficient, N represents the sample number. The black diagonal line refers to the 1:1 line; the pink line is for the least squares fit line. The legend represents the RMSE in Kelvin (K).
Remotesensing 16 00739 g008
Figure 9. Scatter plots of the AMSR-2 LST vs. SURFRAD observations in 2015 during the daytime: (a) LSTs obtained from the example-based SRR method and (b) LSTs obtained from the self-similarity-based SRR method, compared with the original low-resolution AMSR-2 LST data (c). Bias refers to the Mean Bias Error (MBE) or accuracy, the RMSE is for the Root Mean Square Error, R represents Pearson’s correlation coefficient, and N represents the sample number. The black diagonal line refers to the 1:1 line; the pink line is for the least squares fit line. The legend represents the RMSE in Kelvin (K).
Remotesensing 16 00739 g009
Disclaimer/Publisher’s Note: The statements, opinions and data contained in all publications are solely those of the individual author(s) and contributor(s) and not of MDPI and/or the editor(s). MDPI and/or the editor(s) disclaim responsibility for any injury to people or property resulting from any ideas, methods, instructions or products referred to in the content.

