Article

Hybrid 3D Reconstruction of Indoor Scenes Integrating Object Recognition

1
College of Electronic and Information Engineering, Nanjing University of Aeronautics and Astronautics, Nanjing 211106, China
2
Key Laboratory of Radar Imaging and Microwave Photonics, Ministry of Education, Nanjing University of Aeronautics and Astronautics, Nanjing 211106, China
3
College of Computer Science and Technology, Nanjing University of Aeronautics and Astronautics, Nanjing 211106, China
*
Author to whom correspondence should be addressed.
Remote Sens. 2024, 16(4), 638; https://doi.org/10.3390/rs16040638
Submission received: 18 December 2023 / Revised: 6 February 2024 / Accepted: 7 February 2024 / Published: 8 February 2024
(This article belongs to the Special Issue Point Cloud Processing with Machine Learning)

Abstract

:
Indoor 3D reconstruction is particularly challenging due to complex scene structures involving object occlusion and overlap. This paper presents a hybrid indoor reconstruction method that segments the room point cloud into internal and external components, and then reconstructs the room shape and the indoor objects in different ways. We segment the room point cloud into internal and external points based on the assumption that the room shapes are composed of some large external planar structures. For the external, we seek for an appropriate combination of intersecting faces to obtain a lightweight polygonal surface model. For the internal, we define a set of features extracted from the internal points and train a classification model based on random forests to recognize and separate indoor objects. Then, the corresponding computer aided design (CAD) models are placed in the target positions of the indoor objects, converting the reconstruction into a model fitting problem. Finally, the indoor objects and room shapes are combined to generate a complete 3D indoor model. The effectiveness of this method is evaluated on point clouds from different indoor scenes with an average fitting error of about 0.11 m, and the performance is validated by extensive comparisons with state-of-the-art methods.

Graphical Abstract

1. Introduction

Indoor 3D models exhibit considerable potential for various applications, such as indoor positioning, architectural design, and augmented reality. In the past few decades, extensive research has been dedicated to the automated 3D reconstruction of indoor models [1,2,3,4]. In comparison to images, 3D point clouds exhibit superior capabilities in representing object geometry, position, and supplementary information. Nevertheless, the reconstruction of complete indoor scenes from imperfect point clouds, characterized by inherent noise and incompleteness, remains a persistent challenge.
For most artificial buildings, the outer surfaces of the rooms typically exhibit flat geometries, which help to represent them as a composition of primitive surfaces (e.g., planes, spheres, cylinders, etc.) [2,5,6]. The modeling methods that rely on geometric elements or specific patterns are highly beneficial in the field of building modeling [7,8]. Conversely, interior scenes are inherently more complex due to the variety and irregularity of objects within them, presenting challenges for 3D reconstruction.
In recent years, researchers have been exploring the use of deep neural networks to reconstruct scenes that involve occlusion relationships. Some approaches extend 2D convolutional neural networks (CNNs) to the 3D domain and represent scenes using voxel or truncated signed distance function (TSDF) grids [9]. However, the majority of 3D convolution are computationally expensive, leading to inefficiency in processing. Subsequently, researchers have shifted their focus to directly learn object meshes at the semantic-instance level from point clouds and attempt to reconstruct real-world objects directly from point clouds [10,11]. However, such methods frequently encounter difficulties in accurately reconstructing thin structures.
In this work, we provide a novel method for hybrid indoor reconstruction, which reconstructs the room shape using intersecting faces and the indoor objects using CAD model fitting, as shown in Figure 1. We assume that the scale of the external structure of rooms is usually large, while the internal objects are relatively small and complex. Using different methods for those two types of scenes can handle their differences. Our method combines the robustness of geometric primitives’ approach to data and the advantages of being able to effectively overcome missing data, with the comprehensive and accurate results of instance segmentation reconstruction. Specifically, the point cloud of a room is segmented into internal and external components, and our method employs distinct reconstruction strategies for different components. For external reconstruction, the polygonal nature of room shapes is explored to identify appropriate combinations of intersecting faces. This allows us to generate lightweight room models. Conversely, for internal reconstruction, we further segment the indoor points to separate individual objects, such as chairs, tables, etc. The corresponding CAD models of the objects are then placed at their detected locations and oriented according to the internal orientations of the components of the objects. In summary, the main contributions of this work are three-fold:
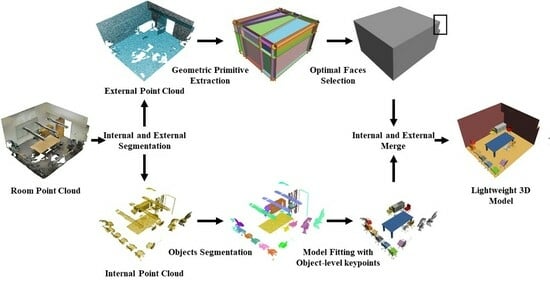
  • We provide a divide-and-conquer reconstruction method based on object-level features to generate models including indoor objects and room shapes from point clouds. We segment the room point cloud into internal and external for reconstruction, respectively, and the reconstruction is carried out in light of the geometric primitive of intersecting faces.
  • The proposed method takes the reconstruction of external point cloud as a binary labeling problem. We seek for an appropriate combination of intersecting faces to obtain a lightweight and manifold polygonal surface model for room shapes.
  • The method uses instance segmentation to assist in modeling individual indoor objects. We design a random forest classifier to recognize objects using shape features, spatial features, statistical features, and proprietary features. The reconstruction problem is approached as a model fitting problem, wherein object-level key points are extracted and subsequent optimization is performed to minimize the distance between corresponding key points, thus accurately placing the CAD models in target positions.
Figure 1. The hybrid 3D reconstruction method generates a lightweight compact indoor model containing both indoor objects and room shapes.
Remotesensing 16 00638 g001
The paper follows the following structure. Section 2 provides a concise overview of the related work. The main methods are presented in Section 3. Section 4 outlines the experimental setup and examines the obtained results. Section 5 presents the conclusions and provides recommendations for future research.

2. Related Work

There are various ways to obtain indoor 3D point clouds, such as RGB-D scanners [11,12,13], photogrammetry, and light detection and ranging (LiDAR) technologies [14]. Automated reconstruction of building models from point clouds is an intensive and challenging research topic. One issue is the presence of noise or outliers in the collected data. In addition, occlusions can lead to incomplete representations of objects. Pintore et al. [15] reviewed the state-of-the-art of indoor scene reconstruction in recent years and found that indoor scene reconstruction methods mainly focus on the following two aspects: boundary surface reconstruction and indoor object detection and reconstruction. The former finds geometries that border room shapes (walls, ceilings, floors, and other permanent structures), while the latter identifies objects in a room to reconstruct their shapes.
Some data-driven methods could directly obtain mesh models using either explicit or implicit modeling methods. However, the reconstruction results typically comprise numerous triangles, and they are susceptible to erroneous and incomplete data. Data-driven methods have become increasingly popular in indoor scene modeling using visual images, but there has been limited exploration in 3D point cloud inputs. These methods effectively learn hidden relationships from the available data, thereby acquiring prior knowledge that can be leveraged to enhance robustness when handling damaged inputs and infer missing information from incomplete data [15,16]. Due to the large amount of data and high-resolution requirements in scenes restricted by 3D point clouds, the data volume from scanning a single room can reach up to 10 million points, and multiple scans are often required to reconstruct a complete room. Therefore, data-driven methods using 3D point cloud have significant limitations that remain to be addressed.
On the other hand, the pattern-driven methods involve the use of specific patterns or models to fit and represent the structures of a building. In the following two sub-sections, we aim to present two primary perspectives for analyzing these methods: one that relies on geometric primitives, and the other that employs instance segmentation.

2.1. Geometric Primitive-Based Modeling

Geometric primitives are commonly used to fit man-made objects for reconstruction. Schnabel et al. [17] introduce a technique that employs RANdom SAmple Consensus (RANSAC) strategy to extract fundamental primitives such as planes, spheres, cylinders, and cones from point clouds. Based on the extracted geometric primitives, Li et al. [7] and Lin et al. [18] involve decomposing the point cloud and fitting segmented building blocks together to create rough building models. Cheng et al. [1] propose a method that involves projecting 3D point clouds onto 2D and extracting indoor structural information from the resulting 2D images. However, due to the complex and occlusion-rich nature of indoor scenes, this projection-based method is not suitable for representing indoor instance objects.
Topological structure of rooms is of great significance for building information models (BIMs). Ai et al. [19] propose a method for reconstructing indoor models based on the spatial relationships between internal structures, but it may lose many finer details. Considering that many buildings are designed with cube-shaped structures, Wei et al. [20] and Li et al. [7] use the Manhattan hypothesis to extract the simplified models of the building from point clouds. Although these types of models are concise, it may overlook certain intricate details.
Slicing-based methods can be used to deal with imperfect data through the use of a divide-and-conquer strategy [21,22]. These methods divide the 3D space into polyhedral cells based on the supporting planes of the identified planar primitives. These cells are made up of polygonal faces. This partitioning approach transforms the reconstruction process into a labeling problem, where the objective is to assign labels of either “inside” or “outside” to the polyhedral cells, or alternatively to label other primitives. However, a key drawback of slicing-based methods is the limited scalability of their data structure. Nan and Wonka [23] offer a solution for generating lightweight reconstruction results by selecting the optimal subset of planar shapes through binary linear optimization. This method is primarily suitable for objects consisting mainly of planar faces, such as building surfaces. Thus, it is inadequate for complex indoor scenes that involve numerous non-planar objects. Nevertheless, the concept of using geometric primitives to represent the relationship between faces and transforming a reconstruction into an optimization problem has inspired our work. We adopted the divide-and-conquer strategy, which uses the method of plane fitting for the outer surfaces of the room and uses the method of CAD fitting for internal objects. In this way, the approach makes full use of geometric primitives to fit the outer surfaces of the room without being affected by complex objects inside.

2.2. Instance Segmentation-Based Modeling

Instance segmentation-based modeling goes beyond geometry fitting, as it aims to provide more semantic information by segmenting each point in the point cloud into distinct object instances. Instance segmentation-based modeling methods are capable of identifying the positions and shapes of objects, even in the presence of incomplete data.
During the early years, manual feature-based classification methods played a central role in this field. The approaches involve manually identifying and defining specific features or structures of interest within the data. These features may be manually selected and constructed based on the structures, shapes, distributions, and other properties of the point clouds. They may include information such as coordinates, normal vectors, curvature, color, density of points, and various descriptors extracted based on local or global geometric properties [12]. Han et al. [8] introduce the use of Markov Random Fields to compute local descriptors of points as manual features. Hedau et al. [24] propose an advanced indoor scene object classifier based on texture information and the 3D bounding box geometry of objects in the surroundings. Cui et al. [25] introduce an automatic semantic operator that combines visibility analysis and physical constraints of structural elements to provide semantic descriptions of indoor point clouds. Nan et al. [26] train a random forest classifier with handcrafted features to recognize indoor chairs, and then they perform model fitting on segmented point clouds.
Deep learning-based segmentation methods have been extended to process 3D point clouds in recent years. These methods usually require training a deep neural network on a large amount of labeled data to learn the representation of the classes. Qi et al. [10] and Qi et al. [27] make significant impacts on the field of deep feature reconstruction of point clouds. They are widely used in semantic segmentation and instance segmentation [28,29]. Jiang et al. [30] propose a two-branch network that predicts semantic labels and offsets. They then use a point clustering method based on original and moving sets of coordinates to segment instance objects. He et al. [31] introduce dynamic convolution for 3D instance segmentation. They also develop a small and efficient transformer to capture long-range dependencies and high-level interactions among point samples. However, one drawback of deep feature-based reconstruction methods is that the extracted features lack interpretability and they require a substantial training dataset.
For the reasons outlined above, we utilize handcrafted features to train a random forest classifier using indoor point clouds as input, enabling end-to-end indoor object detection results. The advantage of our method is its ability to efficiently perform instance segmentation and 3D reconstruction within a few minutes. Each point in the point cloud is assigned to a specific object instance, allowing for a better understanding and analysis of the scene.

3. Method

The pipeline of the proposed algorithm is shown in Figure 2. Our method utilizes 3D point clouds of single rooms as input and generates a lightweight model with indoor objects and room shapes. We propose an improved RANSAC method that incorporates K-nearest neighbor (KNN) for the extraction of planar shapes and the segmentation of internal and external components. To reconstruct the room shape model, our method efficiently extracts planes and selects candidate faces based on their geometric properties of the pairwise intersections of planes. Considering that detected planar segments may contain unnecessary elements due to noise, outliers, and missing data, we improve these planar segments by iteratively merging planar pairs and fitting new planes. By applying binary optimization, we assemble the accurate room shape model using the optimal subset of planar faces. For indoor object modeling, we adopt an instance segmentation technique. Firstly, a random forest classifier is trained to segment each point into distinct object instances. Subsequently, the corresponding CAD models of instances are accurately positioned at the target locations, effectively transforming the reconstruction problem into a model fitting problem. Finally, the room shape model and the indoor object models are combined to yield an accurate representation of the indoor scene.

3.1. Internal and External Segmentation

The method takes the indoor point cloud P as input. As the room shape is relatively clear, complex indoor objects pose a more challenging task. To reduce the influence of complex objects on the reconstruction and improve the efficiency of the algorithm, we segment the overall point cloud room into two parts: the internal point cloud P i n consisting of the indoor objects, and the external point cloud P e x consisting of the room shape. This segmentation enables us to perform separate reconstruction tasks on each part.
We follow the piecewise planarity assumption that the room shape consists of piecewise planar subspaces, and hence a room can be geometrically represented as a polyhedron. In this case, the term “objects” refers to the movable parts in the environment (usually furniture) and thus does not belong to the building structure.
Compared with the point cloud of indoor objects, the point cloud of room shape contains more points ( n u m ( P e x ) > n u m ( P i n ) ), and a significant portion of these points are presented as large planes (walls, roof, and ground). We use KNN to improve the RANSAC-based algorithm for plane extraction, and we obtain some planes S = s i , where s i is a set of points whose distances are smaller than a threshold ε to a plane, as shown in Algorithm 1. Specifically, instead of randomly sampling 3 points to form a plane, we use a neighborhood distance-based strategy to select the 3 points. A single point is randomly sampled and the k-d tree is constructed to select k nearest neighbors, where we choose k = 10 . Among these neighbors, two points that are sufficiently distant from the initially sampled point are selected to establish a plane. This strategy is intended to accurately and efficiently extract the plane in the point cloud.
Then, we select the plane containing the most points in the planes as the output. Considering the presence of large planar objects like tables in the room, observations have shown that these planes typically exhibit lower centroids. To minimize the likelihood of incorrect segmentation, we utilize the altitude of the centroids as a criterion for discarding these planes. The above steps are repeated until the number of points of the extracted plane is less than a certain threshold; therefore, we obtain a set of planes P e x = S i . After we have extracted all the large planes, these planes are denoted as the external and the remaining points as the internal. The result is shown in Figure 3.
Algorithm 1 Internal and External Segmentation
Require: point cloud P = p 1 , p 2 , , p n
1:tree ← kdtree(P)
2:while
3:index_0 ← rand(sizeof(P))
4:for k = 1 to 10 do
5:index_k ← RecoverNeighborhood(tree)
6:end for
7:plane ← FitPlane(index_0, index_9, index_10)
8:for i = 1 to n do
9:if distance(pi, plane) ≤ ε then
10:S ← Pushback(pi)
11:end if
12:end for
13:if Num(S) ≥ threshold and centroid(S) ≥ centroid_threshold then
14:Pex ← Pushback(S)
15:P ← Erase(P, S)
16:else
17:    if Size(P) ≤ size_threshold then
18:        Pin ← Pushback(P)
19:        break
20:    else
21:continue
22:end if
23:end if
24:end while

3.2. Room Shape Reconstruction

After some planes have been extracted from external point clouds, the room shape will be reconstructed based on these external planes. Inspired by Polyfit [23], we choose the candidate faces according to the geometric properties of the pairwise intersections of planes. After that, we formulate the reconstruction of the external point cloud as a binary labeling problem, and then select the optimal subset by binary optimization to assemble the room shape model.

3.2.1. Candidate Face Extraction

To generate the faces that make up the room shape, we first crop the planes by the oriented bounding box (OBB) of the point cloud, and then obtain candidate faces by pairwise intersections. We use a simple cube-structured data as an example, as shown in Figure 4. Two faces intersect on edge e , which divides them into 4 candidate faces. The right figure is the result of extracted candidate planes.
As depicted in Figure 4, the proposed method may introduce redundant faces. For instance, using a cube as an illustration, the original cube possesses 6 faces. However, upon applying the method, a total of 30 faces might be obtained (each edge e will add two subsidiary faces 12 × 2 + 6 ). If redundant planes are generated by the RANSAC algorithm, this number will be much higher. It is worth noting that these subsidiary faces are not supported by the points of the origin point cloud; therefore, they can be easily discarded in the following selection. It is evident that among the four faces that share an edge e, the model should be composed of faces ① and ② rather than ① and ③, signifying their non-coplanarity. This information serves as a basis for formulating the face constraints utilized in the selection of the constituent manifold and watertight model.

3.2.2. Optimal Faces Selection

After generating a candidate set of faces in the previous steps, our next objective is to select an optimal subset from that set, which will form a reasonable reconstruction model. The set of faces is denoted as F = f i 1 i N f , where N f is the number of the candidate faces. Then, we define a data fitting cost E f and a geometric structure energy cost E g to form the optimization objective function.
(1) Data fitting. Considering the fitting quality and confidence of the plane to the point cloud [23,32], the data fitting cost E f is defined as follows:
E f = 1 1 N p i = 0 N f k i · s u p p f i
s u p p f = p , f | d i s t p , f < ε 1 d i s t p , f ε · c o n f p
c o n f p = 1 3 i = 1 3 1 3 λ i 3 λ i 1 + λ i 2 + λ i 3 · λ i 2 λ i 1
where N p represents the total number of points in point cloud P . N f denotes the total number of detected faces. The variable k i indicates whether a candidate face f i is chosen ( k i = 1 ) or not ( k i = 0 ). The term s u p p f i takes into account the distance from a point to a plane and the notion of a certain confidence level. The Euclidean distance from a point p to the candidate face f is denoted as d i s t p , f . Only points with distances less than ε are considered. The confidence term c o n f p is determined by examining p in the definition of the local covariance matrix. The eigenvalues of the covariance matrix at scale i are represented by λ i 1 λ i 2 λ i 3 . The quality of fitting a tangent plane in the local neighborhood at p can be assessed using the expression 1 3 λ i 3 / λ i 1 + λ i 2 + λ i 3 . A value close to 0 indicates a poor point distribution, while a value of 1 suggests a perfect plane fitting. The uniformity of point sampling in the local neighborhood at p is measured by λ i 2 / λ i 1 . The value of this eigenvalue ratio ranges from 0 to 1, with 0 representing a perfect line distribution and 1 corresponding to a uniform disk distribution.
A small value of the data fitting cost E f means that the reconstruction model is more inclined to choose the faces that are close to the input point.
(2) Geometric structure. Considering that the room is composed of horizontal and vertical shapes, such as the roof and floor are horizontal, and the walls are vertical; therefore, in this context, we define the geometric structure energy cost E g as follows:
E g = 1 1 N f i = 0 N f k i · g e o m f i · g e o m f i 1
g e o m f = a v e r a g e p , f | d i s t p , f < ε 1 d i s t p , f ε · v e r t p
v e r t p = 1 2 · a n g l e e 0 , e z π
where g e o m f is similar to s u p p f in Equation (2) and a v e r a g e · means taking the average. The term v e r t p refers to the measure of verticality of face with range [0,1], and the boundary values 0 and 1 correspond to parallel and vertical, respectively. As mentioned before, we want to select the face close to the boundary value. Moreover, e z is the unit vector along the Z-axis, and e 0 is the largest eigenvector of the 3D structure tensor C of a given point p within its neighborhood N k × d . The 3D structure tensor C is defined in a manner similar to Hackel et al. [33] and Weinmann et al. [34]:
C = 1 k i = 1 k p i p ^ p i p ^ T
where p ^ = arg p min i = 1 k p i p is the centroid of N .
A small geometric structure cost E g makes the reconstruction model more inclined to choose large horizontal and vertical planes.
(3) Optimization. Candidate faces have been obtained through pairwise intersections, as depicted in Figure 4. It is important to note that the desired property of manifold and watertight model is characterized by the condition that each edge connects only two adjacent faces. This is exemplified by the connections between faces ① and ②, ② and ③, and ③ and ④ in Figure 4. Employing the aforementioned energy terms, we can formulate the final optimization function for face selection as follows:
min K     λ f · E f + λ g · E g s . t .       j N e i k j = 2     o r     0 , 1 j N e k i 0 ,   1 , 1 i N f
where K denotes the variables k j and k i , j N e i k j denotes the number of faces connected by edge e i , where we constrain those 0 or 2 faces of an edge which are selected. N e denotes the number of edges in the candidate plane. We use Gurobi [35] to solve this optimization function. The results of processing are shown in Figure 5.

3.3. Indoor Object Reconstruction

For the indoor objects, we perform instance segmentation by training a classifier based on the random forest theory, and then design a model fitting method according to the geometric prior of the objects. The CAD models are placed on positions of the segmented instances, forming the models of indoor objects.

3.3.1. Objects Segmentation

The indoor objects segmentation method consists of feature extraction and supervised segmentation.
(1) Feature extraction. The first step involves defining a comprehensive set of descriptive features. Within this context, it is customary to employ the spatial coordinates of adjacent points to establish a 3D structure tensor [36,37], as utilized in our application of geometric structure energy term in room shape reconstruction (refer to Equation (7)). Notably, man-made objects possess distinctive architectural traits. For instance, a chair typically presents a vertical backrest and a horizontal cushion, typically forming an angle between 90 and 120 degrees. Similarly, a table is identified by its broad, horizontal surface, often exhibiting a relatively elevated centroid position (external components have been excluded from consideration).
In our method, we establish the definition of geometric features by leveraging the principles of the 3D structure tensor. Additionally, we augment the approach with a region growing process, which has been demonstrated to enhance both the accuracy of instance segmentation outcomes and the computational efficiency. Notably, the inclusion of the region growing procedure endows our method with robustness against missing data and noise. Our features are derived from the design of a 3D structure tensor, representing advanced geometric characteristics. Taking a chair as an example, as long as we can extract both the backrest and seat planes from the input point cloud data, our method can identify the chair. This is because our proprietary chair feature is specifically designed based on the angle formed by the backrest and seat. Further information regarding the defined features can be found in Table 1.
In Table 1, λ 1 > λ 2 > λ 3 , which are the eigenvalues of the 3D structure tensor derived from Equation (7). As the nomenclature suggests, the first term of the shape feature represents the structure of plane, while the subsequent measures encapsulate distinct shape properties.
The derivation of the spatial features relies on point-based calculations, employing the centroid point of the 3D structure tensor as the basis for computing the 3D geometric properties. Moreover, p i z denotes the Z-axis value of the i -th point in the neighborhood. Additionally, we employ the concept of region growing in our approach, where the seed point for the region growing process is determined as the farthest point within a predefined threshold distance. This selected point serves as the center point for deriving the next 3D structure tensor. Leveraging the effectiveness of region growing as a segmentation algorithm, the approach seamlessly integrates the segmentation process with the classifier.
The statistical features are primarily defined by the associated eigenvectors of the 3D structure tensor, where the eigenvalues are ordered as e 0 > e 1 > e 2 . Moreover, e z denotes the unit vector in the Z-axis direction, and β can take on the values of 1 or 2. Notably, the first and second moments of the eigenvectors and unit Z-vectors derived from the 3D structure tensor play a pivotal role in the classification of crease edges and occlusion boundaries [38].
Proprietary features provide an optional selection of features tailored to different objects. B h , B w , and B d correspond to the height, width, and depth of the oriented bounding box (OBB), respectively. The notation P i · represents the coordinate value along a specific axis for the i -th point, while B · represents one of the values from B h , B w , or B d . For example, if we consider the horizontal face of a chair, P i · would specifically denote the P i z , and B · would specifically denote the B h . Furthermore, N f _ p denotes the total number of points contained within the selected face.
(2) Supervised segmentation. We combine base generic features, including shape features, spatial features, and statistical features, with proprietary feature validation. This process involves two stages: coarse segmentation followed by fine segmentation.
Initially, a pre-training phase is conducted, where a set of random forest decision-makers is trained using the aforementioned features except for the proprietary features. Subsequently, predictive segmentation is performed on the input point cloud, resulting in coarse segmented labels. It is important to note that our labels are point specific, which means that every point in the point cloud will get a label. However, it is possible that points belonging to the same object may have different labels after coarse segmentation. To address this issue, we utilize proprietary features to perform fine segmentation. For each object identified during the coarse segmentation step, we incorporate proprietary features and retrain the model. The objective of the fine segmentation process is to minimize the final label error rate associated with each object, thereby enhancing the overall accuracy and consistency.
The illustration of supervised segmentation is shown in Figure 6, and the result of the complete indoor scene segmentation is shown in Figure 7.

3.3.2. Model Fitting

Matching CAD models with scanned point clouds of the objects is an extremely challenging problem. The inconsistent scale of different data is an important issue. Avetisyan et al. [39] propose a novel 3D convolutional neural network and introduce the Scan2CAD dataset as input, consisting of both scan data and CAD data, to generate corresponding heat maps. These heat maps are further reconstructed into CAD models and aligned in the input scene using a 9DoF pose optimization algorithm. Li and Lafarge [40] propose a method for globally registering multi-model geometric data with varying scales. Their method incorporates scale estimation as part of a continuous optimization problem based on distance fields during the refinement step, eliminating the need for initial scale estimation.
Inspired by their work, we approach the reconstruction problem as a model fitting problem, wherein object-level key points are extracted and subsequent optimization is performed to minimize the distance between corresponding key points, thus accurately placing the CAD model in target position.
Different from conventional registration methods that rely on substantial large overlaps between the source and target, our approach utilizes CAD models as the source data and extract salient object-level key points for matching. Specifically, we select Scan2CAD as the CAD model library. On the other hand, the target data consist of point clouds obtained through RGBD or LiDAR sensors.
Despite the lack of direct correlation between the source and target data, which may encompass significant disparities in scale, the two types of data possess a shared semantic label. Given this premise, we define a concept of object-level key points, which are the two endpoints of a line segment formed by the intersections of faces. These object-level key points exhibit remarkable accuracy and exceptional robustness, specifically tailored to successfully handle indoor scenes characterized by a high degree of occlusion.
To ensure the accuracy and reliability of our methodology, we perform separate preprocessing steps for both the CAD models and point clouds. Given that the CAD model is constructed offline, it is crucial to minimize any potential uncertainties associated with it. Consequently, we adopt the assumption that the frontal face of the CAD model aligns with the positive direction of the X-axis, while the top face aligns with the positive direction of the Z-axis. Following this, we extract the face intersection lines and subsequently employ OBB for segmentation. The endpoints of these line segments serve as our object-level key points. To determine the scale of each object, we calculate it based on the length of the corresponding line segment:
p t 0 p t 1 2 = s p s 0 p s 1 2
where p t 0 and p t 1 are the two endpoints of the line segment of the target, while p s 0 and p s 1 are the two endpoints of the line segment of the source. The variable s denotes the scale. · 2 represents the calculation of the Euclidean distance (L2 norm) between two points.
However, it should be noted that the matching between these key points is not inherently unique (as shown in Figure 8, middle). To address this ambiguity, our method achieves a distinct and reliable matching by defining the direction vector of the line segments. Firstly, we calculate the centroids of both the source and target objects. Subsequently, we determine a vector, denoted as v 1 , from the midpoint of the line segment to the centroid. In order to enforce a direction constraint, we adjust the face normal vector by considering the angle between the face normal vector and v 1 . This adjustment aligns the face normal vector towards the desired direction, which is indicated by the constraint. We denote the horizontal face as f 1 , the vertical plane as f 2 , and the direction of the cross product of f 1 and f 2 as the direction of the line segment we defined.
The method may produce ambiguous solutions with two pairs of corresponding object-level key points, as illustrated in Figure 8 (middle). Initially, we considered using the centroids as the third pair of corresponding points. However, due to the presence of numerous occlusion relationships in the indoor context, the centroids may be unstable, as depicted in Figure 9. As an alternative, we leverage the angle between the normal vectors of the corresponding faces between the point cloud and the CAD model to constrain the matching. As illustrated in Figure 8 (right), α and β are the angles that we described.
Upon successfully matching the two pairs of corresponding key points, as illustrated in Figure 8 (right), we proceed to fit the model to the target object. This fitting process involves the optimization of minimizing the angle between the corresponding faces. By minimizing this angle, we aim to enhance the alignment and congruence between the source and target objects, thereby achieving a more accurate and reliable model fit.
min θ     1 k i = 1 k a n g l e v r i , v t i
where k is the number of corresponding faces, v r i is the normal vector of the i-th face of the source point cloud, and v t i is the normal vector of the i-th plane of the target point cloud.

4. Results and Discussion

In this work, we tested our method on the open-source dataset S3DIS of Stanford University [13], along with the LiDAR point cloud collected by Leica BLK360, and the CAD models are chosen from Scan2CAD [39]. The majority of objects featured in our test dataset predominantly consist of furniture items, such as chairs, tables, cabinets, and sofas. These objects represent typical examples encountered in indoor environments. Our method is implemented in C++. To conduct our experiments, we utilized a DELL Inspiron 3910 computer equipped with Samsung 16 GB RAM and an intel Core i5-12400 4 GHz CPU (DELL, Nanjing, China).

4.1. Qualitative Comparisons

4.1.1. Object Reconstruction

We demonstrate the good separation of the room point cloud into two parts, i.e., room shapes and indoor objects, in Figure 3. Figure 6 and Figure 7 demonstrate the ability of our method for effective instance segmentation in complex scenes.
We compare our method with Polyfit [23], Polyfit with Bbox, and RfD-Net [11]. We focus our analysis on four specific object categories: chairs, tables, cabinets, and sofas. Although more complex objects are not explicitly considered in our evaluation, we believe that the insights gained from this subset of objects provide valuable foundational knowledge for future research and application development. To illustrate the performance of our method across varying scene complexities, we present qualitative test results in Figure 10, utilizing the S3DIS dataset. These results showcase the effectiveness and robustness of our approach under different environmental conditions and object arrangements.
The reconstruction outcome of Polyfit [23] is heavily reliant on the quality of the extracted facets. In particular, when confronted with indoor scenes containing numerous occlusions, Polyfit encounters challenges in achieving an ideal model reconstruction. To partially mitigate the impact of occlusion, we augment the object’s Bbox to facilitate the extraction of facets. This augmentation compensates to some extent for the influence posed by occlusion. In contrast, RfD-Net [11] is a state-of-the-art neural network-based approach. It extracts object semantics and shapes from sparse point clouds and performs instance segmentation at the same time. Subsequently, they use a jump propagation module to bridge global object localization and local shape prediction. It is noteworthy that the accuracy of RfD-Net’s results heavily relies on the dataset used for training. On the contrary, our method not only considers the inherent information embedded within the point cloud itself but also incorporates object-level information derived from geometric features. As demonstrated in Figure 10, our method excels in providing enhanced details and producing lightweight models compared to other approaches

4.1.2. Scene Reconstruction

Due to the fact that Polyfit and Polyfit (Bbox) do not have the function of overall scene reconstruction, in order to enable a fair comparison, we first manually separate the targets, and then reconstruct the individual objects by the Polyfit [23] methods. RfD-Net [11] is an end-to-end neural network model, and we reproduced its method, but it does not reconstruct the room shape surface.
The experimental results are shown in Figure 11. All the results show that our method maintains a visually appealing room model and reasonable object placement at different complex scenes.

4.1.3. The Effect of Occlusion

We explored the robustness of our method in reconstructing indoor scene objects under varying levels of occlusion, as depicted in Figure 12. Results were obtained for occlusion levels of 0%, 50%, 75%, and 90%, indicating that our method successfully reconstructed indoor objects across different levels of occlusion. We also conducted tests in more extreme environments. Since our method relies on intersecting faces, it works efficiently as long as at least two key surface sources can be extracted from the occluded point cloud.

4.2. Quantitative Comparisons

4.2.1. Scene Completeness

Table 2 shows the information of each scene in Figure 11, including the number of points, the number of points with the largest object, and the total number of objects. Additionally, we evaluate the completeness of the reconstructed scene by assessing the number of objects present in the reconstructed models, as shown in Table 3. The completeness of the reconstructed scene showcases the ability of the algorithm to faithfully restore the real indoor environment to its maximum extent. We find that in some scenes, the number of objects in the reconstructed model of data-driven method RfD-Net [11] is more than the ground truth. By combining the results of the above qualitative analysis shown in Figure 11, it can be observed that RfD-Net may have multiple reconstruction objects for a certain single object, such as a table with two or more reconstruction results. Figure 13 shows the confusion matrices of different methods for the object classification results. To ensure fairness, we define objects that are not reconstructed in Polyfit [23], Polyfit (Bbox), and RfD-Net [11] (data-driven), which is identified as clutter. It can be observed that our method has achieved favorable results in object classification.
Rooms 1–5 in our study are sourced from the Stanford large-scale 3D indoor spaces (S3DIS) dataset, which is a large-scale dataset specifically designed for indoor scene segmentation and recognition. The S3DIS dataset used in our study consists of six large indoor areas from three different architectural styles, encompassing 11 room categories, 271 rooms, and over 200 million points, containing typical indoor objects such as desks, chairs, bookshelves, and sofas.
Room 6 is the conference room data captured using a BLK360 LiDAR scanner, with a total of 13 scans resulting in a combined raw point cloud of over 200 million points. Due to the extensive processing time required by our method, we performed down sampling to bring its point count to a level comparable to the S3DIS dataset, resulting in approximately 2 million points after down sampling.
The Scan2CAD dataset comprises multiple CAD models from various industries and application domains. This dataset offers researchers and developers a rich resource of CAD data. For our testing purposes, we have selected a set of classic CAD models that closely resemble the shapes of objects in our test data. We have included one model from each category. Figure 14 shows some CAD models we selected.

4.2.2. Fitting Error

A frequently used metric for evaluating the quality of model results involves calculating the root mean square (RMS) of surface fitting errors. These errors represent the perpendicular distances between points and their nearest facets within the model. The visualization of these errors is represented as a pseudo-color image in Figure 15, where the color bar depicts the error magnitude. Our method consistently achieves an average fitting error of less than 0.11 m across the experimental trials involving the aforementioned six rooms.
According to the results of comparative analysis, it is observed that within the entire scene involving room shape reconstruction, the elements responsible for large errors pertain to unclassified or unsegmented point clouds, such as the doors depicted in Figure 15. We perform a separate error analysis for the objects shown in Figure 10, as illustrated in Figure 16. These results distinctly illustrate the promising level of accuracy achieved by our method in terms of object fitting. The detailed results are shown in Table 4 and Table 5. The single object RMS of Polyfit [23] is better than ours, because Polyfit fits planes from the point cloud and selects the optimal subset to form the final reconstruction result, and these facets already have small RMS errors with the point cloud. However, due to occlusions in the point cloud, the results reconstructed using Polyfit also show missing regions, as shown in Figure 10, while our method can be completely restored.

4.2.3. Efficiency

The execution time for each step of our method is presented in Table 6 and the largest object reconstruction time is shown in Table 7. We note that our method achieves efficient completion of both classification and reconstruction tasks within a few minutes. However, it is important to highlight that Polyfit [23] exhibits a relatively longer reconstruction time, particularly in the case of objects with a large number of planes. The runtime remains longer even after implementing Bbox optimization. The data-driven method RfD-Net [11] is not comparable due to its long training time.

4.3. Exploring Complex Scenes

We assessed the performance of our method in complex scenarios, characterized by irregular shapes, occlusion, clutter, and noise. The reconstruction results, as illustrated in Figure 17, demonstrate that our method produces satisfactory overall scene reconstructions (left image) and accurate fitting of interior objects. However, there are instances where objects are not fully reconstructed, such as scene 1 where three chairs are present but our reconstruction only shows two due to the missing cushion of the third chair. Additionally, there may be overlapping between nearby objects, like the table and bookcase in scene 2, which appear merged due to the selected subset of intersecting patches for the exterior facade reconstruction. Nevertheless, our method successfully captures the original poses of interior objects and preserves the original concave–convex details of the exterior facades in complex scenes.

5. Conclusions and Future Work

In this work, we propose a new approach for the reconstruction of indoor environments, seamlessly blending indoor object models with the room shapes. We have demonstrated the capabilities of our approach through the integration of the point cloud segmentation, classification, and model fitting techniques. The suggested divide-and-conquer strategy deals with room shapes and indoor objects separately with respect to varying point density. The CAD model fitting method facilitates the computation of precise indoor object reconstruction. Extensive experimentation has showcased the efficacy of our proposed methodology, successfully completing classification and reconstruction steps within minutes, significantly enhancing the efficiency of the reconstruction process without compromising on quality.
Our method has limitations as it relies on extracting plane information from the original point cloud. If there are significant omissions in the original point cloud, or if we are unable to extract the correct planes, our method may fail and produce inaccurate results. Future considerations include addressing potential errors or inconsistencies between CAD models and point clouds, which would aid the algorithm in automatically selecting and aligning with the point cloud from Scan2CAD. As the extraction and screening of geometric primitives pose considerable computational challenges, a future improvement will focus on optimizing this process to elevate the efficiency and performance of the approach.

Author Contributions

Conceptualization, M.L. (Mingfan Li) and M.L. (Minglei Li); methodology, M.L. (Mingfan Li) and M.L. (Minglei Li); software, M.L. (Mingfan Li); validation, M.L. (Mingfan Li); formal analysis, M.L. (Mingfan Li), L.X. and M.L. (Minglei Li); investigation, M.L. (Mingfan Li) and M.L. (Minglei Li); resources, M.L. (Minglei Li) and M.W.; data curation, M.L. (Minglei Li); writing—original draft preparation, M.L. (Mingfan Li) and M.L. (Minglei Li); writing—review and editing, M.L. (Mingfan Li), M.L. (Minglei Li) and M.W.; visualization, M.L. (Mingfan Li); supervision, M.L. (Minglei Li); project administration, M.L. (Minglei Li); funding acquisition, M.L. (Minglei Li). All authors have read and agreed to the published version of the manuscript.

Funding

This work was funded by the National Natural Science Foundation of China: Grant 42271343.

Data Availability Statement

The data that support the findings of this study are available on request from the corresponding author.

Conflicts of Interest

The authors declare no conflicts of interest.

References

  1. Cheng, D.; Zhang, J.; Zhao, D.; Chen, J.; Tian, D. Automatic Extraction of Indoor Structural Information from Point Clouds. Remote Sens. 2021, 13, 4930. [Google Scholar] [CrossRef]
  2. Oesau, S.; Lafarge, F.; Alliez, P. Indoor Scene Reconstruction Using Feature Sensitive Primitive Extraction and Graph-cut. ISPRS J. Photogramm. Remote Sens. 2014, 90, 68–82. [Google Scholar] [CrossRef]
  3. Tran, H.; Khoshelham, K. A Stochastic Approach to Automated Reconstruction of 3D Models of Interior Spaces from Point Clouds. ISPRS Ann. Photogramm. Remote Sens. Spatial Inf. Sci. 2019, IV-2/W5, 299–306. [Google Scholar] [CrossRef]
  4. Xiong, H.; Ma, W.; Zheng, X.; Gong, J.; Abdelalim, D. Indoor Scene Texturing Based on Single Mobile Phone Images and 3D Model Fusion. Int. J. Digit. Earth 2019, 12, 525–543. [Google Scholar] [CrossRef]
  5. Tran, H.; Khoshelham, K. Procedural Reconstruction of 3D Indoor Models from LiDAR Data Using Reversible Jump Markov Chain Monte Carlo. Remote Sens. 2020, 12, 838. [Google Scholar] [CrossRef]
  6. Li, M.; Nan, L.; Liu, S. Fitting Boxes to Manhattan Scenes Using Linear Integer Programming. Int. J. Digit. Earth 2016, 9, 806–817. [Google Scholar] [CrossRef]
  7. Li, M.; Nan, L.; Smith, N.G.; Wonka, P. Reconstructing Building Mass Models from UAV Images. Comput. Graph. 2016, 54, 84–93. [Google Scholar] [CrossRef]
  8. Han, J.; Rong, M.; Jiang, H.; Liu, H.; Shen, S. Vectorized Indoor Surface Reconstruction from 3D Point Cloud with Multistep 2D Optimization. ISPRS J. Photogramm. Remote Sens. 2021, 177, 57–74. [Google Scholar] [CrossRef]
  9. Dai, A.; Qi, C.R.; Nießner, M. Shape Completion Using 3D-Encoder-Predictor CNNs and Shape Synthesis. In Proceedings of the 2017 IEEE Conference on Computer Vision and Pattern Recognition (CVPR), Honolulu, HI, USA, 21–26 July 2017. [Google Scholar]
  10. Qi, C.; Su, H.; Mo, K.; Guibas, L.J. PointNet: Deep Learning on Point Sets for 3D Classification and Segmentation. In Proceedings of the 2017 IEEE Conference on Computer Vision and Pattern Recognition (CVPR), Honolulu, HI, USA, 21–26 July 2017. [Google Scholar]
  11. Nie, Y.; Hou, J.; Han, X.; Nießner, M. RfD-Net: Point Scene Understanding by Semantic Instance Reconstruction. arXiv 2021, arXiv:2011.14744. [Google Scholar]
  12. Lai, K.; Bo, L.; Ren, X.; Fox, D. A Large-Scale Hierarchical Multi-View RGB-D Object Dataset. In Proceedings of the 2011 IEEE International Conference on Robotics and Automation, Shanghai, China, 9–13 May 2011. [Google Scholar]
  13. Armeni, I.; Sener, O.; Zamir, A.R.; Jiang, H.; Brilakis, I.; Fischer, M.; Savarese, S. 3D Semantic Parsing of Large-Scale Indoor Spaces. In Proceedings of the IEEE Conference on Computer Vision and Pattern Recognition, Las Vegas, NV, USA, 26 June–1 July 2016; pp. 1534–1543. [Google Scholar]
  14. University of Zurich. UZH 3D Dataset. 2014. Available online: https://www.ifi.uzh.ch/en/vmml/research/datasets.html (accessed on 1 December 2023).
  15. Pintore, G.; Mura, C.; Ganovelli, F.; Fuentes-Perez, L.; Pajarola, R.; Gobbetti, E. State-of-the-art in Automatic 3D Reconstruction of Structured Indoor Environments. Comput. Graph. Forum 2020, 39, 667–699. [Google Scholar] [CrossRef]
  16. Wang, T.; Wang, Q.; Ai, H.; Zhang, L. Semantics-and-Primitives-Guided Indoor 3D Reconstruction from Point Clouds. Remote Sens. 2022, 14, 4820. [Google Scholar] [CrossRef]
  17. Schnabel, R.; Wahl, R.; Klein, R. Efficient RANSAC for Point-Cloud Shape Detection. Comput. Graph. Forum 2007, 26, 214–226. [Google Scholar] [CrossRef]
  18. Lin, H.C.; Gao, J.; Zhou, Y.; Lu, G.; Ye, M.; Zhang, C.; Liu, L.; Yang, R. Semantic Decomposition and Reconstruction of Residential Scenes from LiDAR Data. ACM Trans. Graph. 2013, 32, 66. [Google Scholar] [CrossRef]
  19. Ai, M.; Li, Z.; Shan, J. Topologically Consistent Reconstruction for Complex Indoor Structures from Point Clouds. Remote Sens. 2021, 13, 3844. [Google Scholar] [CrossRef]
  20. Wei, J.; Wu, H.; Yue, H.; Jia, S.; Li, J.; Liu, C. Automatic Extraction and Reconstruction of A 3D Wireframe of An Indoor Scene from Semantic Point Clouds. Int. J. Digit. Earth 2023, 16, 3239–3267. [Google Scholar] [CrossRef]
  21. Chauve, A.L.; Labatut, P.; Pons, J.-P. Robust Piecewise-Planar 3D Reconstruction and Completion from Large-Scale Unstructured Point Data. In Proceedings of the 2010 IEEE Conference on Computer Vision and Pattern Recognition (CVPR), San Francisco, CA, USA, 13–18 June 2010. [Google Scholar]
  22. Mura, C.; Mattausch, O.; Pajarola, R. Piecewise-Planar Reconstruction of Multi-Room Interiors with Arbitrary Wall Arrangements. Comput. Graph. Forum 2016, 35, 179–188. [Google Scholar] [CrossRef]
  23. Nan, L.; Wonka, P. PolyFit: Polygonal Surface Reconstruction from Point Clouds. In Proceedings of the 2017 IEEE International Conference on Computer Vision (ICCV), Venice, Italy, 22–29 October 2017. [Google Scholar]
  24. Hedau, V.; Hoiem, D.; Forsyth, D.A. Thinking Inside the Box: Using Appearance Models and Context Based on Room Geometry. In Proceedings of the European Conference on Computer Vision (ECCV), Heraklion, Greece, 5–11 September 2010. [Google Scholar]
  25. Cui, Y.; Li, Q.; Yang, B.; Xiao, W.; Chen, C.; Dong, Z. Automatic 3-D Reconstruction of Indoor Environment with Mobile Laser Scanning Point Clouds. IEEE J. Sel. Top. Appl. Earth Observ. Remote Sens. 2019, 12, 3117–3130. [Google Scholar] [CrossRef]
  26. Nan, L.; Xie, K.; Sharf, A. A Search-Classify Approach for Cluttered Indoor Scene Understanding. ACM Trans. Graph. 2012, 31, 137. [Google Scholar] [CrossRef]
  27. Qi, C.; Yi, L.; Su, H.; Guibas, L.J. PointNet++: Deep Hierarchical Feature Learning on Point Sets in a Metric Space. arXiv 2017, arXiv:1706.02413. [Google Scholar] [CrossRef]
  28. Liu, C.; Furukawa, Y. MASC: Multi-scale Affinity with Sparse Convolution for 3D Instance Segmentation. arXiv 2019, arXiv:1902.04478. [Google Scholar] [CrossRef]
  29. Liu, Y.; Fan, B.; Xiang, S.; Pan, C. Relation-Shape Convolutional Neural Network for Point Cloud Analysis. In Proceedings of the 2019 IEEE Conference on Computer Vision and Pattern Recognition (CVPR), Long Beach, CA, USA, 15–20 June 2019. [Google Scholar]
  30. Jiang, L.; Zhao, H.; Shi, S.; Liu, S.; Fu, C.-W.; Jia, J. PointGroup: Dual-Set Point Grouping for 3D Instance Segmentation. In Proceedings of the 2020 IEEE/CVF Conference on Computer Vision and Pattern Recognition (CVPR), Seattle, WA, USA, 13–19 June 2020. [Google Scholar]
  31. He, T.; Shen, C.; van den Hengel, A. DyCo3D: Robust Instance Segmentation of 3D Point Clouds through Dynamic Convolution. In Proceedings of the 2021 IEEE Conference on Computer Vision and Pattern Recognition (CVPR), Nashville, TN, USA, 20–25 June 2021. [Google Scholar]
  32. Nan, L.; Sharf, A.; Zhang, H.; Cohen-Or, D.; Chen, B. SmartBoxes for Interactive Urban Reconstruction. ACM Trans. Graph. 2010, 29, 93–103. [Google Scholar] [CrossRef]
  33. Hackel, T.; Wegner, J.D.; Schindler, K. Fast Semantic Segmentation of 3D Point Clouds with Strongly Varying Density. ISPRS Ann. Photogramm. Remote Sens. Spat. Inf. Sci. 2016, 3, 177–184. [Google Scholar] [CrossRef]
  34. Weinmann, M.; Jutzi, B.; Mallet, C. Geometric Features and Their Relevance for 3D Point Cloud Classification. ISPRS Ann. Photogramm. Remote Sens. Spat. Inf. Sci. 2017, 4, 157–164. [Google Scholar] [CrossRef]
  35. Gurobi. Gurobi Optimization. Available online: http://www.gurobi.com/ (accessed on 25 December 2022).
  36. Jutzi, B.; Gross, H. Nearest Neighbor Classification on Laser Point Clouds to Gain Object Structures from Buildings. ISPRS Int. Arch. Photogramm. Remote Sens. Spat. Inf. Sci. 2009, 38, 65–70. [Google Scholar]
  37. Demantké, J.; Mallet, C.; David, N.; Vallet, B. Dimensionality-Based Scale Selection in 3D Lidar Point Clouds. ISPRS Int. Arch. Photogramm. Remote Sens. Spat. Inf. Sci. 2012, 38, 97–102. [Google Scholar] [CrossRef]
  38. Thomas, H.; Deschaud, J.-E.; Marcotegui, B.; Goulette, F.; Le Gall, Y. Semantic Classification of 3D Point Clouds with Multiscale Spherical Neighborhoods. In Proceedings of the 2018 International Conference on 3D Vision (3DV), Verona, Italy, 5–8 September 2018. [Google Scholar]
  39. Avetisyan, A.; Dahnert, M.; Dai, A.; Savva, M.; Chang, A.X.; Nießner, M. Scan2CAD: Learning CAD Model Alignment in RGB-D Scans. arXiv 2019, arXiv:1811.11187. [Google Scholar] [CrossRef]
  40. Li, M.; Lafarge, F. Planar Shape-Based Registration for Multi-Modal Geometry. In Proceedings of the British Machine Vision Conference, Online, 30 August–2 September 2021. [Google Scholar]
Figure 2. The pipeline of the proposed algorithm, encompassing room shape reconstruction and indoor object modeling.
Remotesensing 16 00638 g002
Figure 3. Illustration of the internal and external segmentation: (a) input point cloud; (b) external points; (c) internal points.
Remotesensing 16 00638 g003
Figure 4. Candidate face extraction.
Remotesensing 16 00638 g004
Figure 5. Pipeline: (a) input point cloud; (b) planar segments; (c) candidate faces; (d) reconstructed model; (e) reconstructed model (other view); the first row is Polyfit [23] results, and the second row is our improved results.
Remotesensing 16 00638 g005
Figure 6. Illustration of the supervised segmentation: (a) input point cloud; (b) coarse segmentation; (c) fine segmentation; (d) ground truth. Yellow represents table, red represents cabinet, and green represents chair.
Remotesensing 16 00638 g006
Figure 7. Result of the complete indoor scene segmentation: (a) input; (b) output; (c) ground truth. The different colors here represent the different entities obtained through segmentation.
Remotesensing 16 00638 g007
Figure 8. Object-level key points extraction and matching.
Remotesensing 16 00638 g008
Figure 9. Comparison of centroid instability under different occlusions.
Remotesensing 16 00638 g009
Figure 10. Qualitative results of object reconstruction: (a) input data; (b) Polyfit; (c) Polyfit (Bbox); (d) RfD-Net (data-driven); (e) ours.
Remotesensing 16 00638 g010
Figure 11. Qualitative results of scene reconstruction: (a) input data; (b) Polyfit [23]; (c) Polyfit (Bbox); (d) RfD-Net [11] (data-driven); (e) ours.
Remotesensing 16 00638 g011
Figure 12. Reconstruction results with different degrees of occlusion: (a) 0%; (b) 50%; (c) 75%; (d) 90%.
Remotesensing 16 00638 g012
Figure 13. The confusion matrices of object classification results using different methods.
Remotesensing 16 00638 g013
Figure 14. The CAD models we used from Scan2CAD dataset.
Remotesensing 16 00638 g014
Figure 15. Illustration of the model fitting error. The color bar depicts the error magnitude. (af) are different rooms.
Remotesensing 16 00638 g015
Figure 16. Illustration of the model fitting error for a single object. The color bar depicts the error magnitude. (ac) is chair, (d) is cabinet, (e) is table, (f) is sofa.
Remotesensing 16 00638 g016
Figure 17. The more complex scene experiments of the S3DIS dataset.
Remotesensing 16 00638 g017
Table 1. Feature definition.
Feature ClassFeaturesDefinitions
Shape featuresPlanarity P λ = λ 2 λ 3 λ 1
Anisotropy A λ = λ 1 λ 3 λ 1
Eigenentropy E λ = i = 1 3 λ i · ln λ i
Change in Curvature C λ = λ 3 λ 1 + λ 2 + λ 3
Spatial featuresLongest Distance within Neighborhood D N = arg max i k p i p
Local Point Density k 4 3 π D N 3
Average Height within Neighborhood H a v e _ N = 1 k i = 1 k p i z
Statistical featuresAbsolute Moment (×2) A m = 1 k p p ^ , e z β
Vertical Moment (×6) V m = 1 k p p ^ , e i β ,   i 0,1 , 2
Proprietary featuresOriented Bounding Box Height–Size Ratio R o b b _ h = B h B w · B d
Object Face and Corresponding Parallel OBB Face Axis–Size Ratio R a x i s = 1 N f _ p i = 0 N f _ p P i · B ·
Angle between Object Faces (Chair) A c h a i r = F h o r , F v e r
Table 2. Information for the room example shown in Figure 11.
Scenes in Figure 11PointsPoints of the Largest ObjectObject
Number
Room 11,136,61735,62715
Room 22,314,63421,16133
Room 31,266,99034,32520
Room 41,138,11615,22123
Room 51,067,70929,52314
Room 62,065,83433,06016
Table 3. Objects number in the reconstructed model. Bold is better.
Scenes in Figure 11Polyfit [23]Polyfit (Bbox)RfD-Net [11]
(Data-Driven)
Ours
Room 113 (−2)13 (−2)12 (−3)13 (−2)
Room 225 (−8)30 (−3)19 (−14)30 (−3)
Room 315 (−5)17 (−3)21 (+1)17 (−3)
Room 417 (−6)21 (−2)5 (−18)21 (−2)
Room 511 (−3)12 (−2)9 (−5)12 (−2)
Room 613 (−3)14 (−2)15 (−1)14 (−2)
Table 4. Model fitting errors of internal objects (m). Bold is better.
Scenes in Figure 11Polyfit [23]Polyfit (Bbox)RfD-Net [11]
(Data-Driven)
Ours
Room 10.110.110.070.05
Room 20.340.090.100.11
Room 30.290.210.120.05
Room 40.020.020.280.06
Room 50.050.050.090.03
Room 60.440.380.220.04
Table 5. Model fitting error for a single object (m). Bold is better.
Objects in Figure 10Polyfit [23]Polyfit (Bbox)RfD-Net [11]
(Data-Driven)
Ours
Chair 1 in 1st row0.020.020.050.04
Chair 2 in 2nd row0.020.020.050.04
Chair 3 in 2nd row0.010.010.060.03
Table in 3rd row0.100.100.280.02
Cabinet in 4th row0.530.480.490.02
Sofa in 5th row0.010.010.110.03
Table 6. Computational efficiency of each step.
Scenes in Figure 11Scene
Segmentation (s)
Room Shape
Reconstruction (s)
Instance
Segmentation (s)
Model Fitting (s)
Room 18.5435.882.61205.45
Room 223.6269.367.28381.08
Room 39.1240.382.80254.99
Room 46.5440.022.05265.06
Room 55.1433.862.48186.92
Room 610.8043.044.94406.23
Table 7. The largest object reconstruction (s). Bold is better.
Scenes in Figure 11PolyfitPolyfit (Bbox)Ours
Room 1409.47179.2439.87
Room 2288.5599.2213.60
Room 3563.45117.4439.91
Room 4168.7897.3313.67
Room 5352.49156.6533.71
Room 6388.64161.7637.40
Disclaimer/Publisher’s Note: The statements, opinions and data contained in all publications are solely those of the individual author(s) and contributor(s) and not of MDPI and/or the editor(s). MDPI and/or the editor(s) disclaim responsibility for any injury to people or property resulting from any ideas, methods, instructions or products referred to in the content.

