
Spatiotemporal Analysis of the Interactions between Ecosystem Services in Arid Areas and Their Responses to Urbanization and Various Driving Factors

Abstract
:1. Introduction
2. Materials and Methods
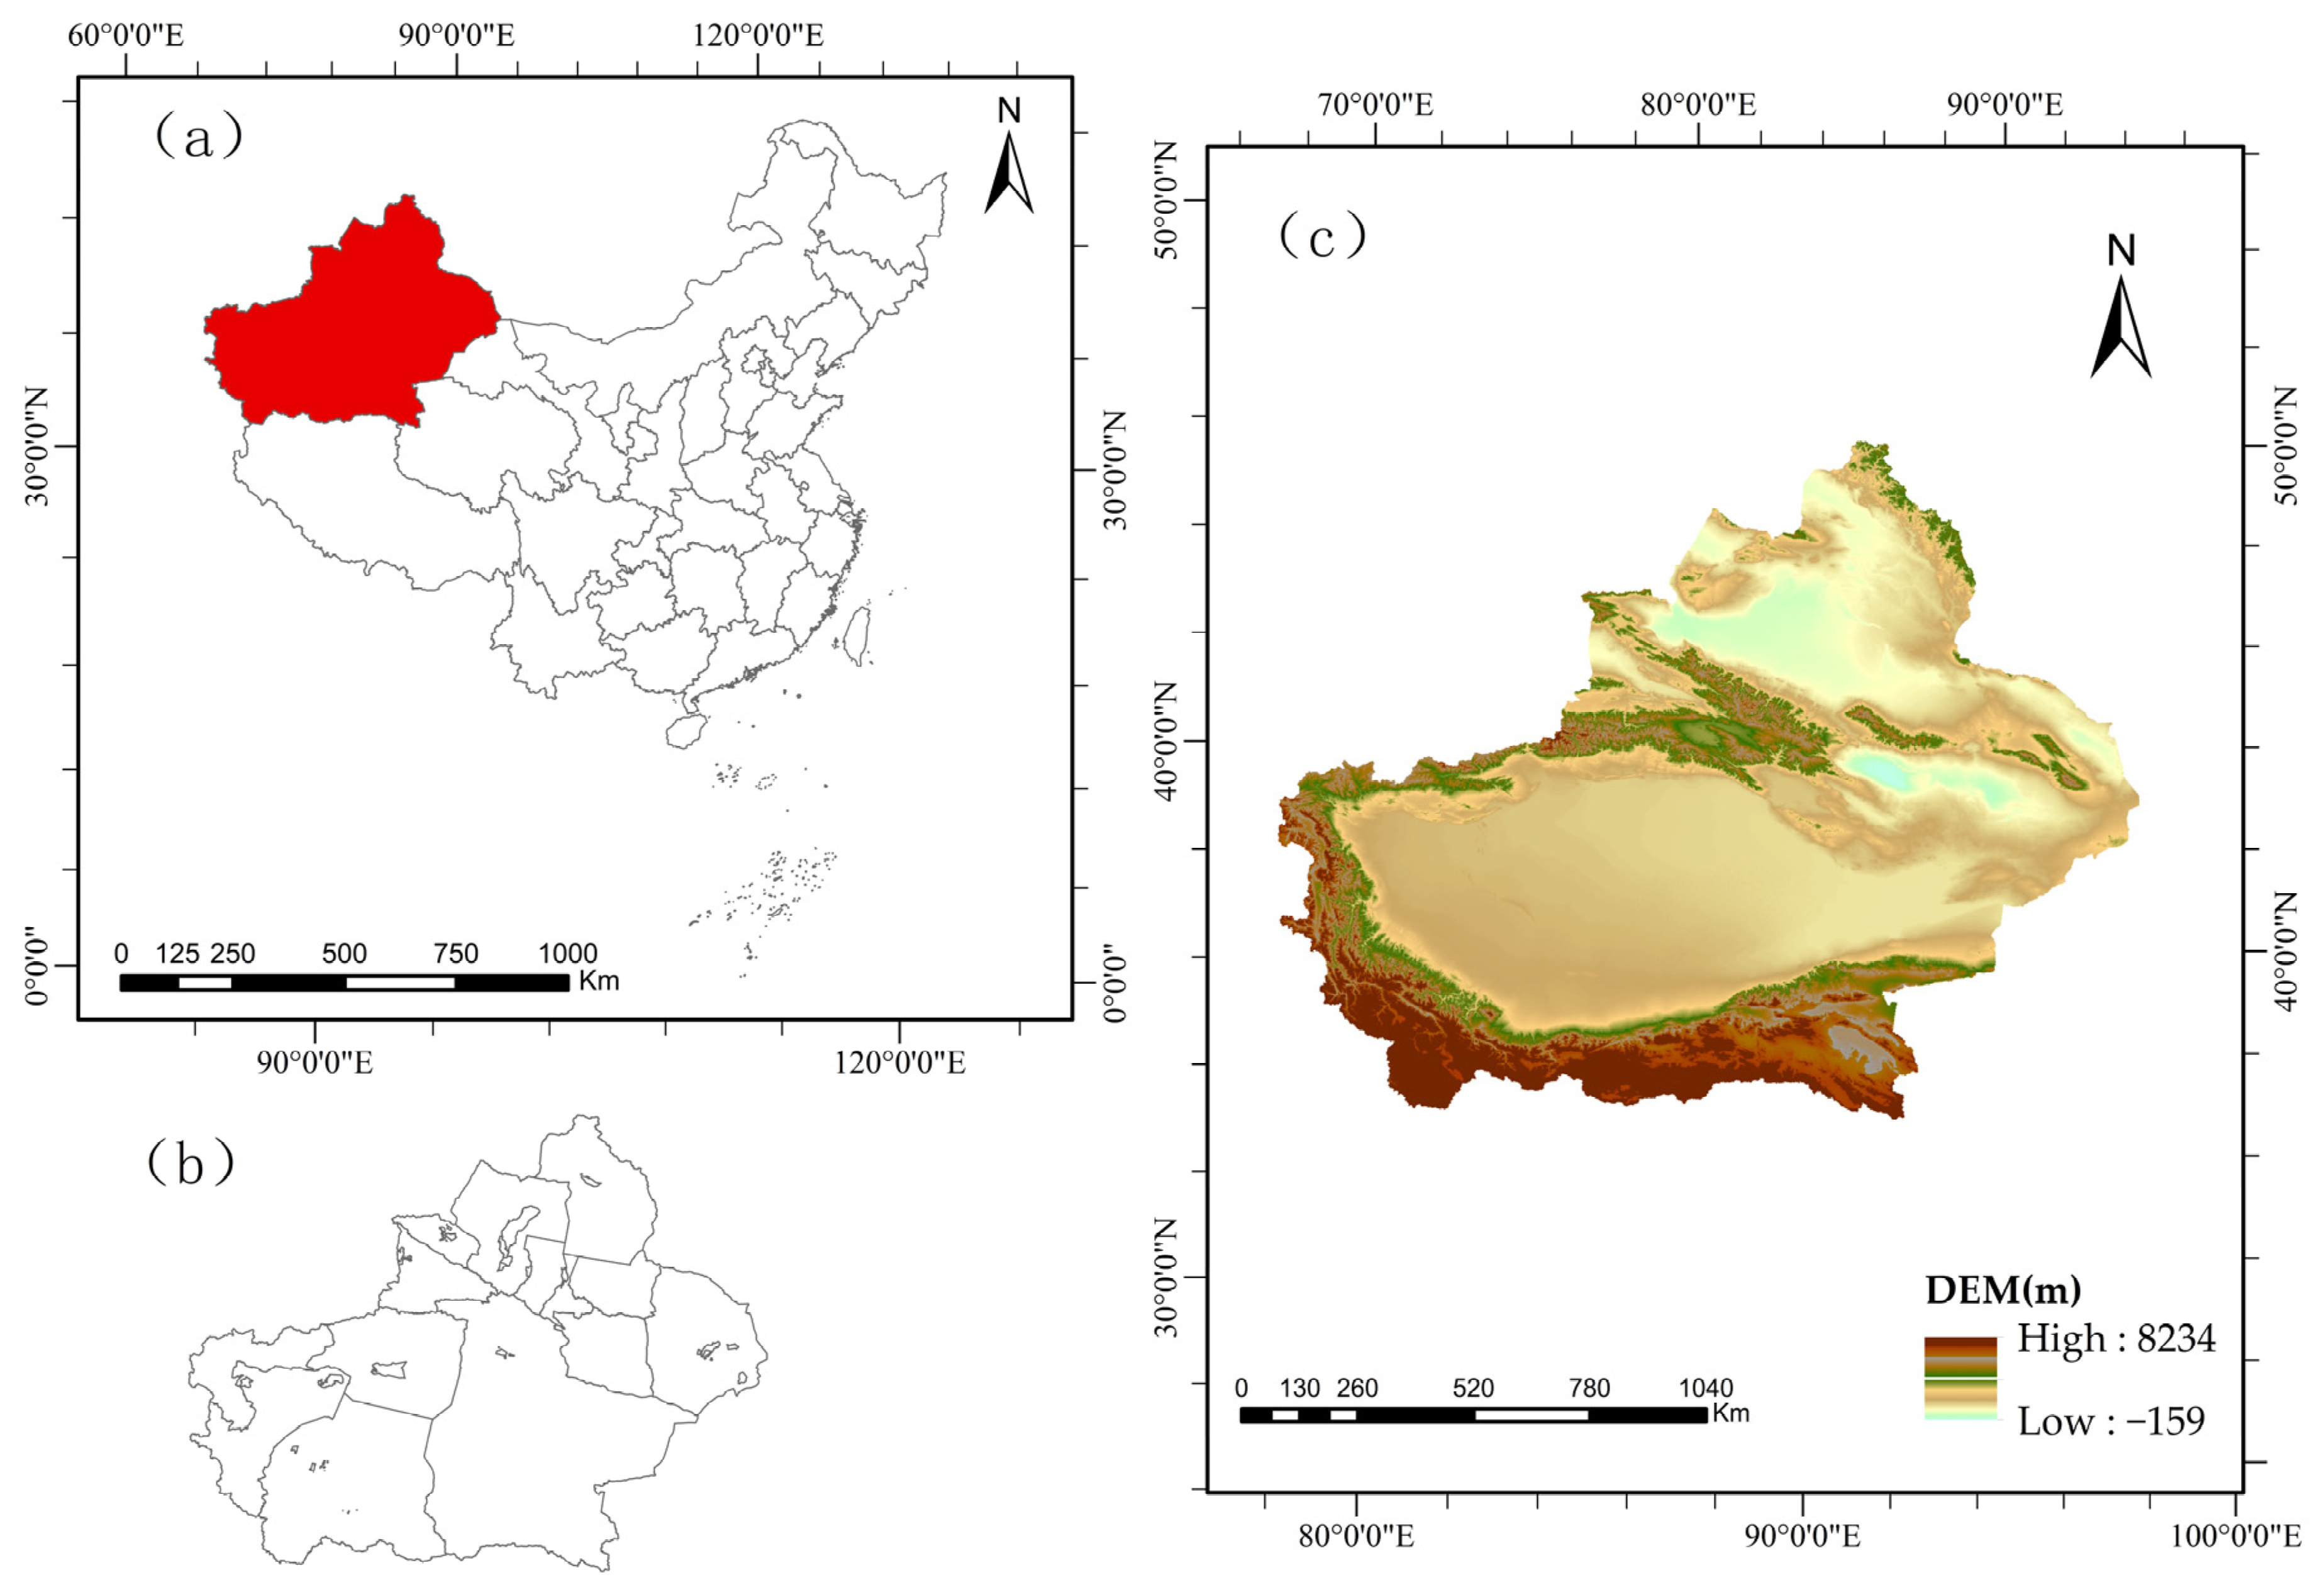
2.1. Study Area
2.2. Data
- (1)
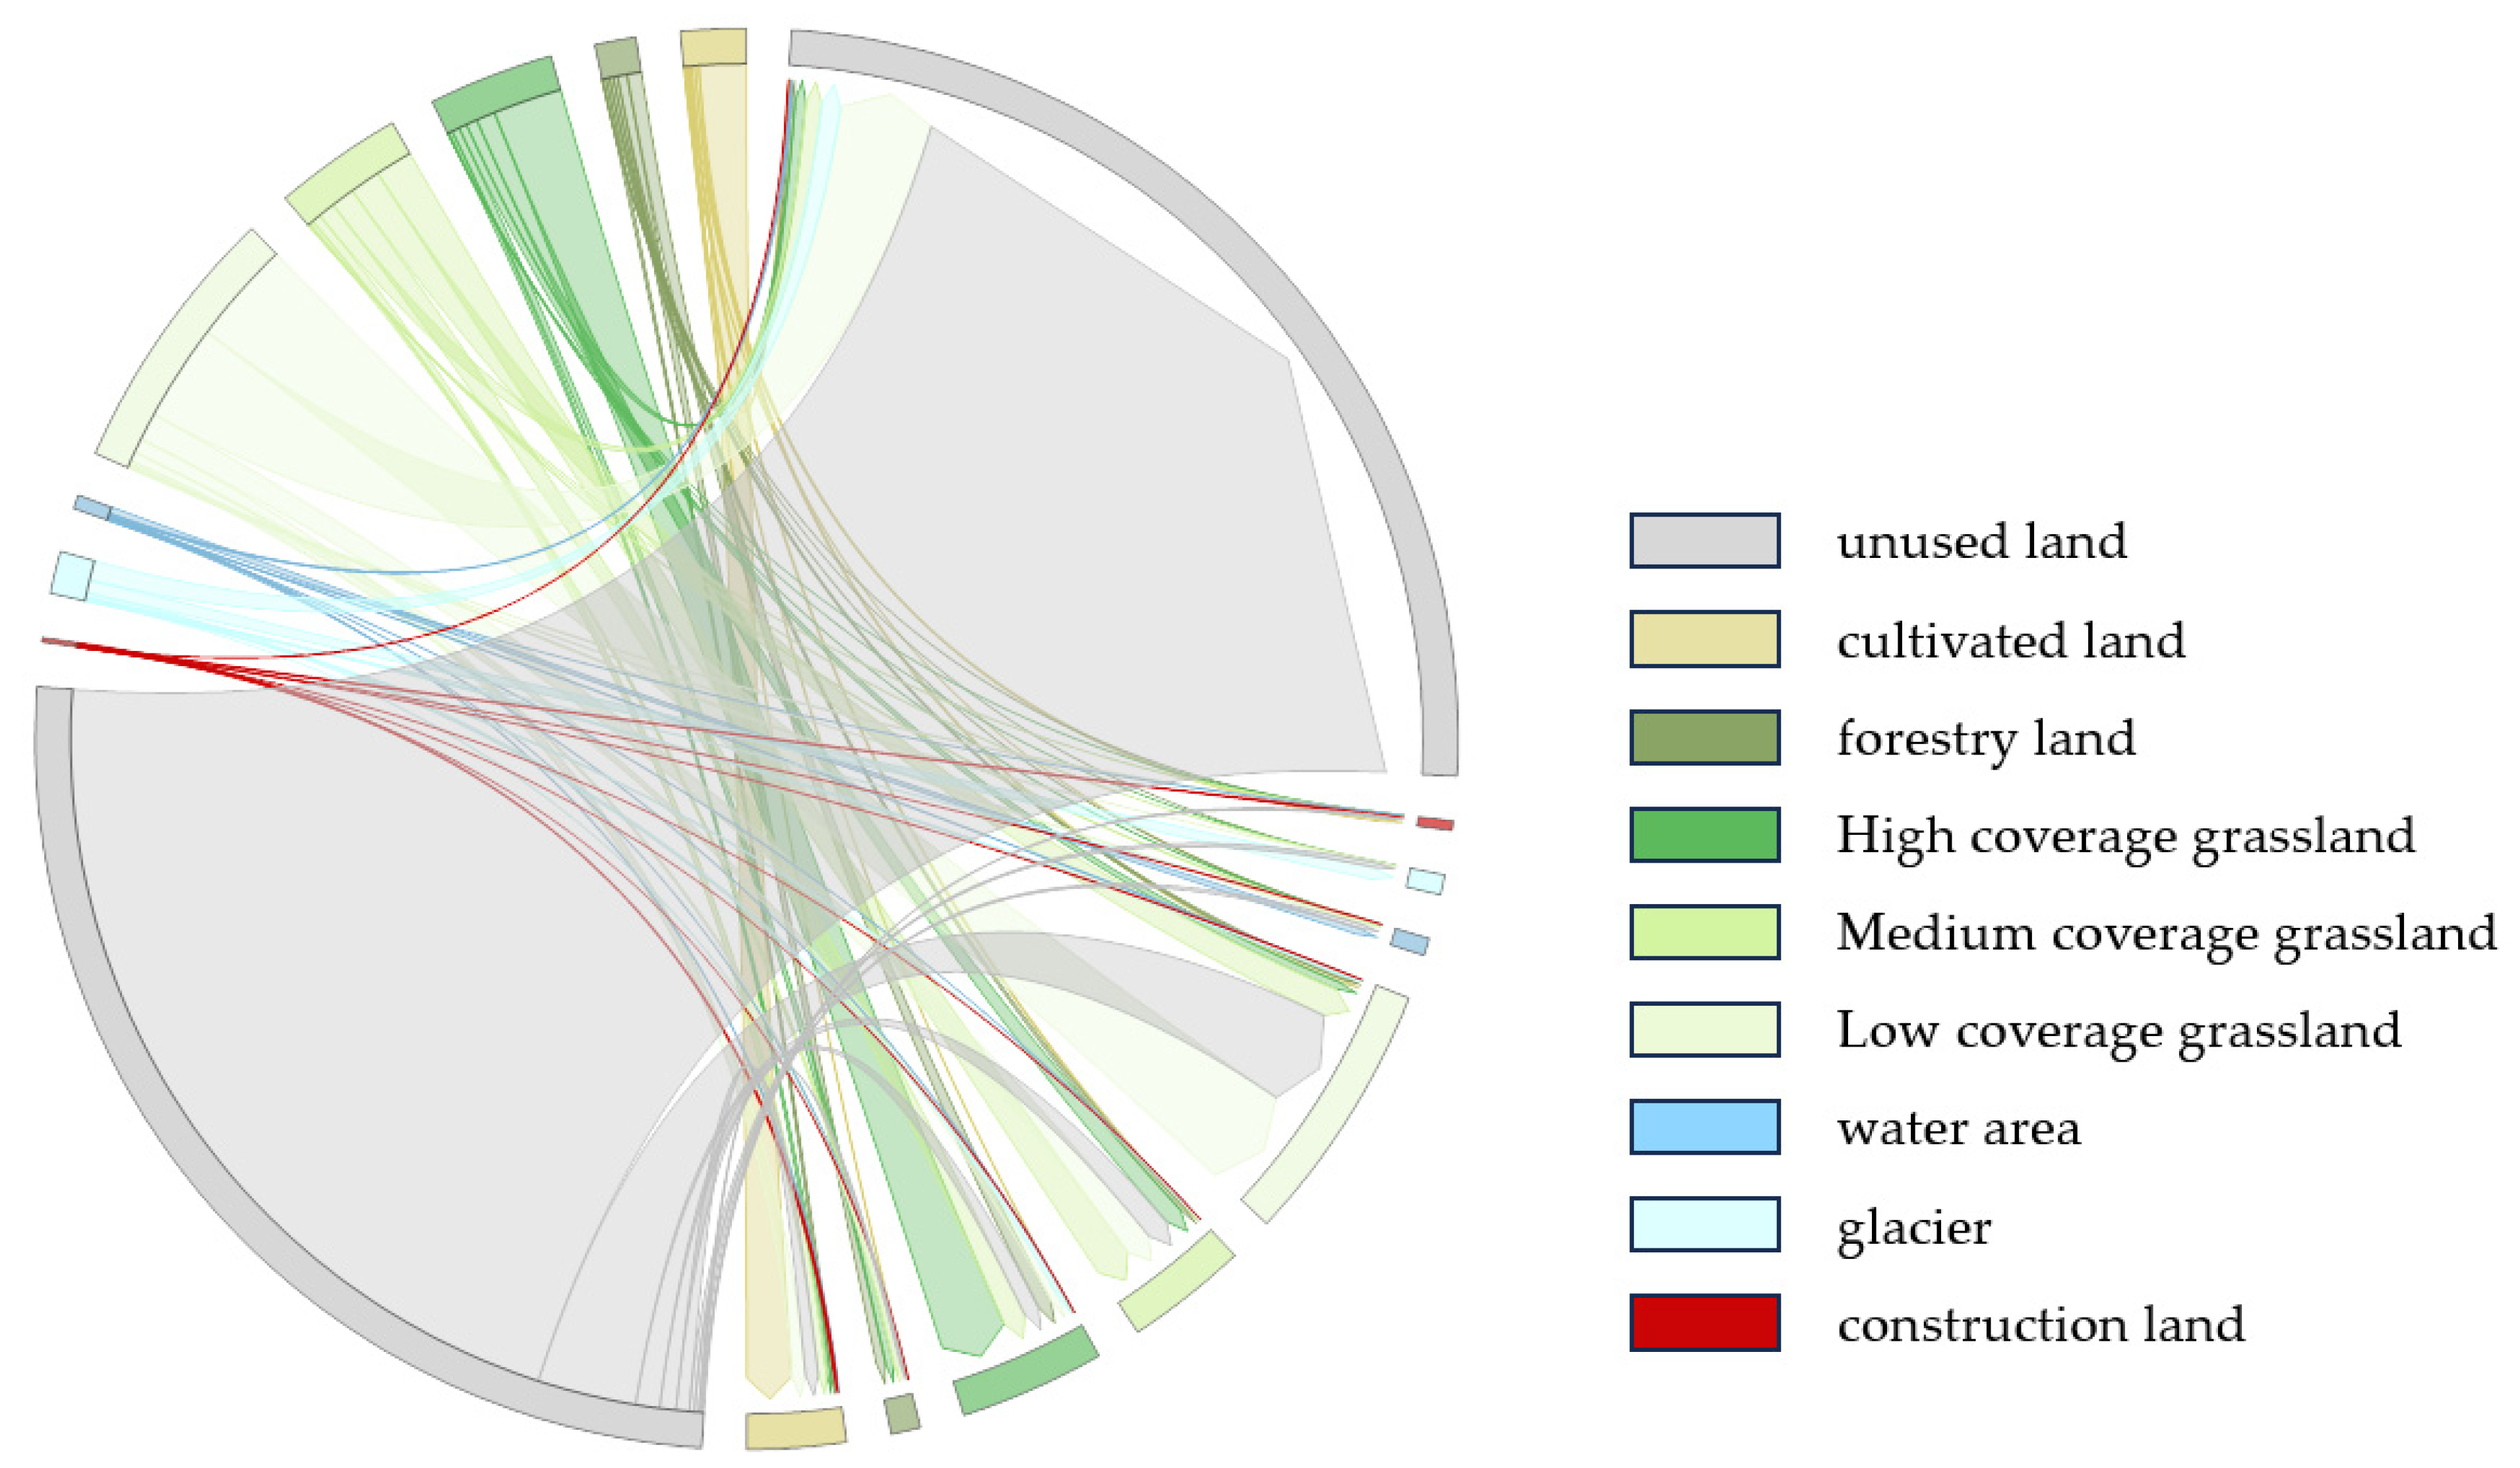
- Land use data from the Chinese Academy of Sciences Resource and Environment Science and Data Center (RESDC) (https://www.resdc.cn/ (accessed on 13 April 2023)) from 2000 to 2020 are issued every five years. According to the actual situation of the research area, the secondary classification data will be reclassified into the following nine categories: cultivated land (CR), forestry land (FR), high-coverage grassland (HGS), medium-coverage grassland (MGS), low-coverage grassland (LGS), water area (WA), glacier (GL), CL, and unused land (UL).
- (2)
- GDP and population (POP) data are from the Chinese Academy of Sciences (RESDC) (https://www.resdc.cn/ (accessed on 9 June 2023)).
- (3)
- The temperature and precipitation grid data are sourced from the National Earth System Science Data Center and are in a NetCDF (.nc) format with a spatial resolution of 1 km. These data need to be converted into grid data in ArcGIS (ArcGIS Pro 3.0.0).
- (4)
- The digital elevation model (DEM) data are from a geospatial data cloud platform with a spatial resolution of 1 km.
- (5)
- The NDVI data include a MODIS13Q1 dataset synthesized and downloaded through the GEE platform with a spatial resolution of 1 km.
- (6)
- Soil data (https://www.fao.org/ (accessed on 19 April 2023)), including soil texture, soil sand content, silt content, clay content, organic carbon content, and root depth, were collected using the World Soil Database (HWSD)-based World Soil Dataset (v1.2) with a resolution of 1 km.
- (7)
- The evapotranspiration and net primary productivity (NPP) data were taken from the MOD17A1 dataset on NASA with a resolution of 500 m.
- (8)
- POI data were sourced from Baidu and Gaode.

| Data | Time | Resolution | Data Sources |
|---|---|---|---|
| Land use/land cover (LULC) data | 2000~2020 | 1 km | Resource and Environment Science and Data Center (http://www.resdc.cn/, accessed on 13 April 2023) |
| DEM | 2020 | 1 km | Geospatial Data Cloud (http://www.gscloud.cn, accessed on 24 April 2023) |
| Normalized difference vegetation index (NDVI) | 2000~2020 | 1 km | GEE |
| NPP | 2000~2020 | 500 m | NASA |
| Temperature | 2000~2020 | 1 km | National Earth System Science Data Center, National Science & Technology Infrastructure of China (http://www.geodata.cn/, accessed on 23 April 2022) |
| Precipitation | 2000~2020 | 1 km | National Earth System Science Data Center, National Science & Technology Infrastructure of China (http://www.geodata.cn/, accessed on 23 April 2023) |
| Evapotranspiration | 2000~2020 | 500 m | NASA |
| Soil data | 2020 | 1 km | Harmonized World Soil Database (HWSD) (https://www.fao.org/, accessed on 19 April 2023) |
| GDP | 2000~2019 | 1 km | Resource and Environment Science and Data Center (http://www.resdc.cn/, accessed on 9 June 2023) |
| POP | 2000~2019 | 1 km | Resource and Environment Science and Data Center (http://www.resdc.cn/, accessed on 9 June 2023) |
| POI | 2012~2022 | \ | Baidu, GaoDe |
| Social statistical data | 2000~2020 | \ | https://tjj.xinjiang.gov.cn/, accessed on 24 April 2023 |
2.3. ES Evaluation
2.4. Trade-Offs and Synergy Analysis among Ecosystem Services
2.5. MGWR Model Trade-Offs and Synergistic Spatial Analysis
2.6. Geographical Detector Model Spatial Analysis
2.7. Comprehensive Evaluation of the Urbanization Level
2.8. Threshold Analysis of the Impact of Urbanization on Ecosystem Services
3. Results
3.1. Land Use Changes
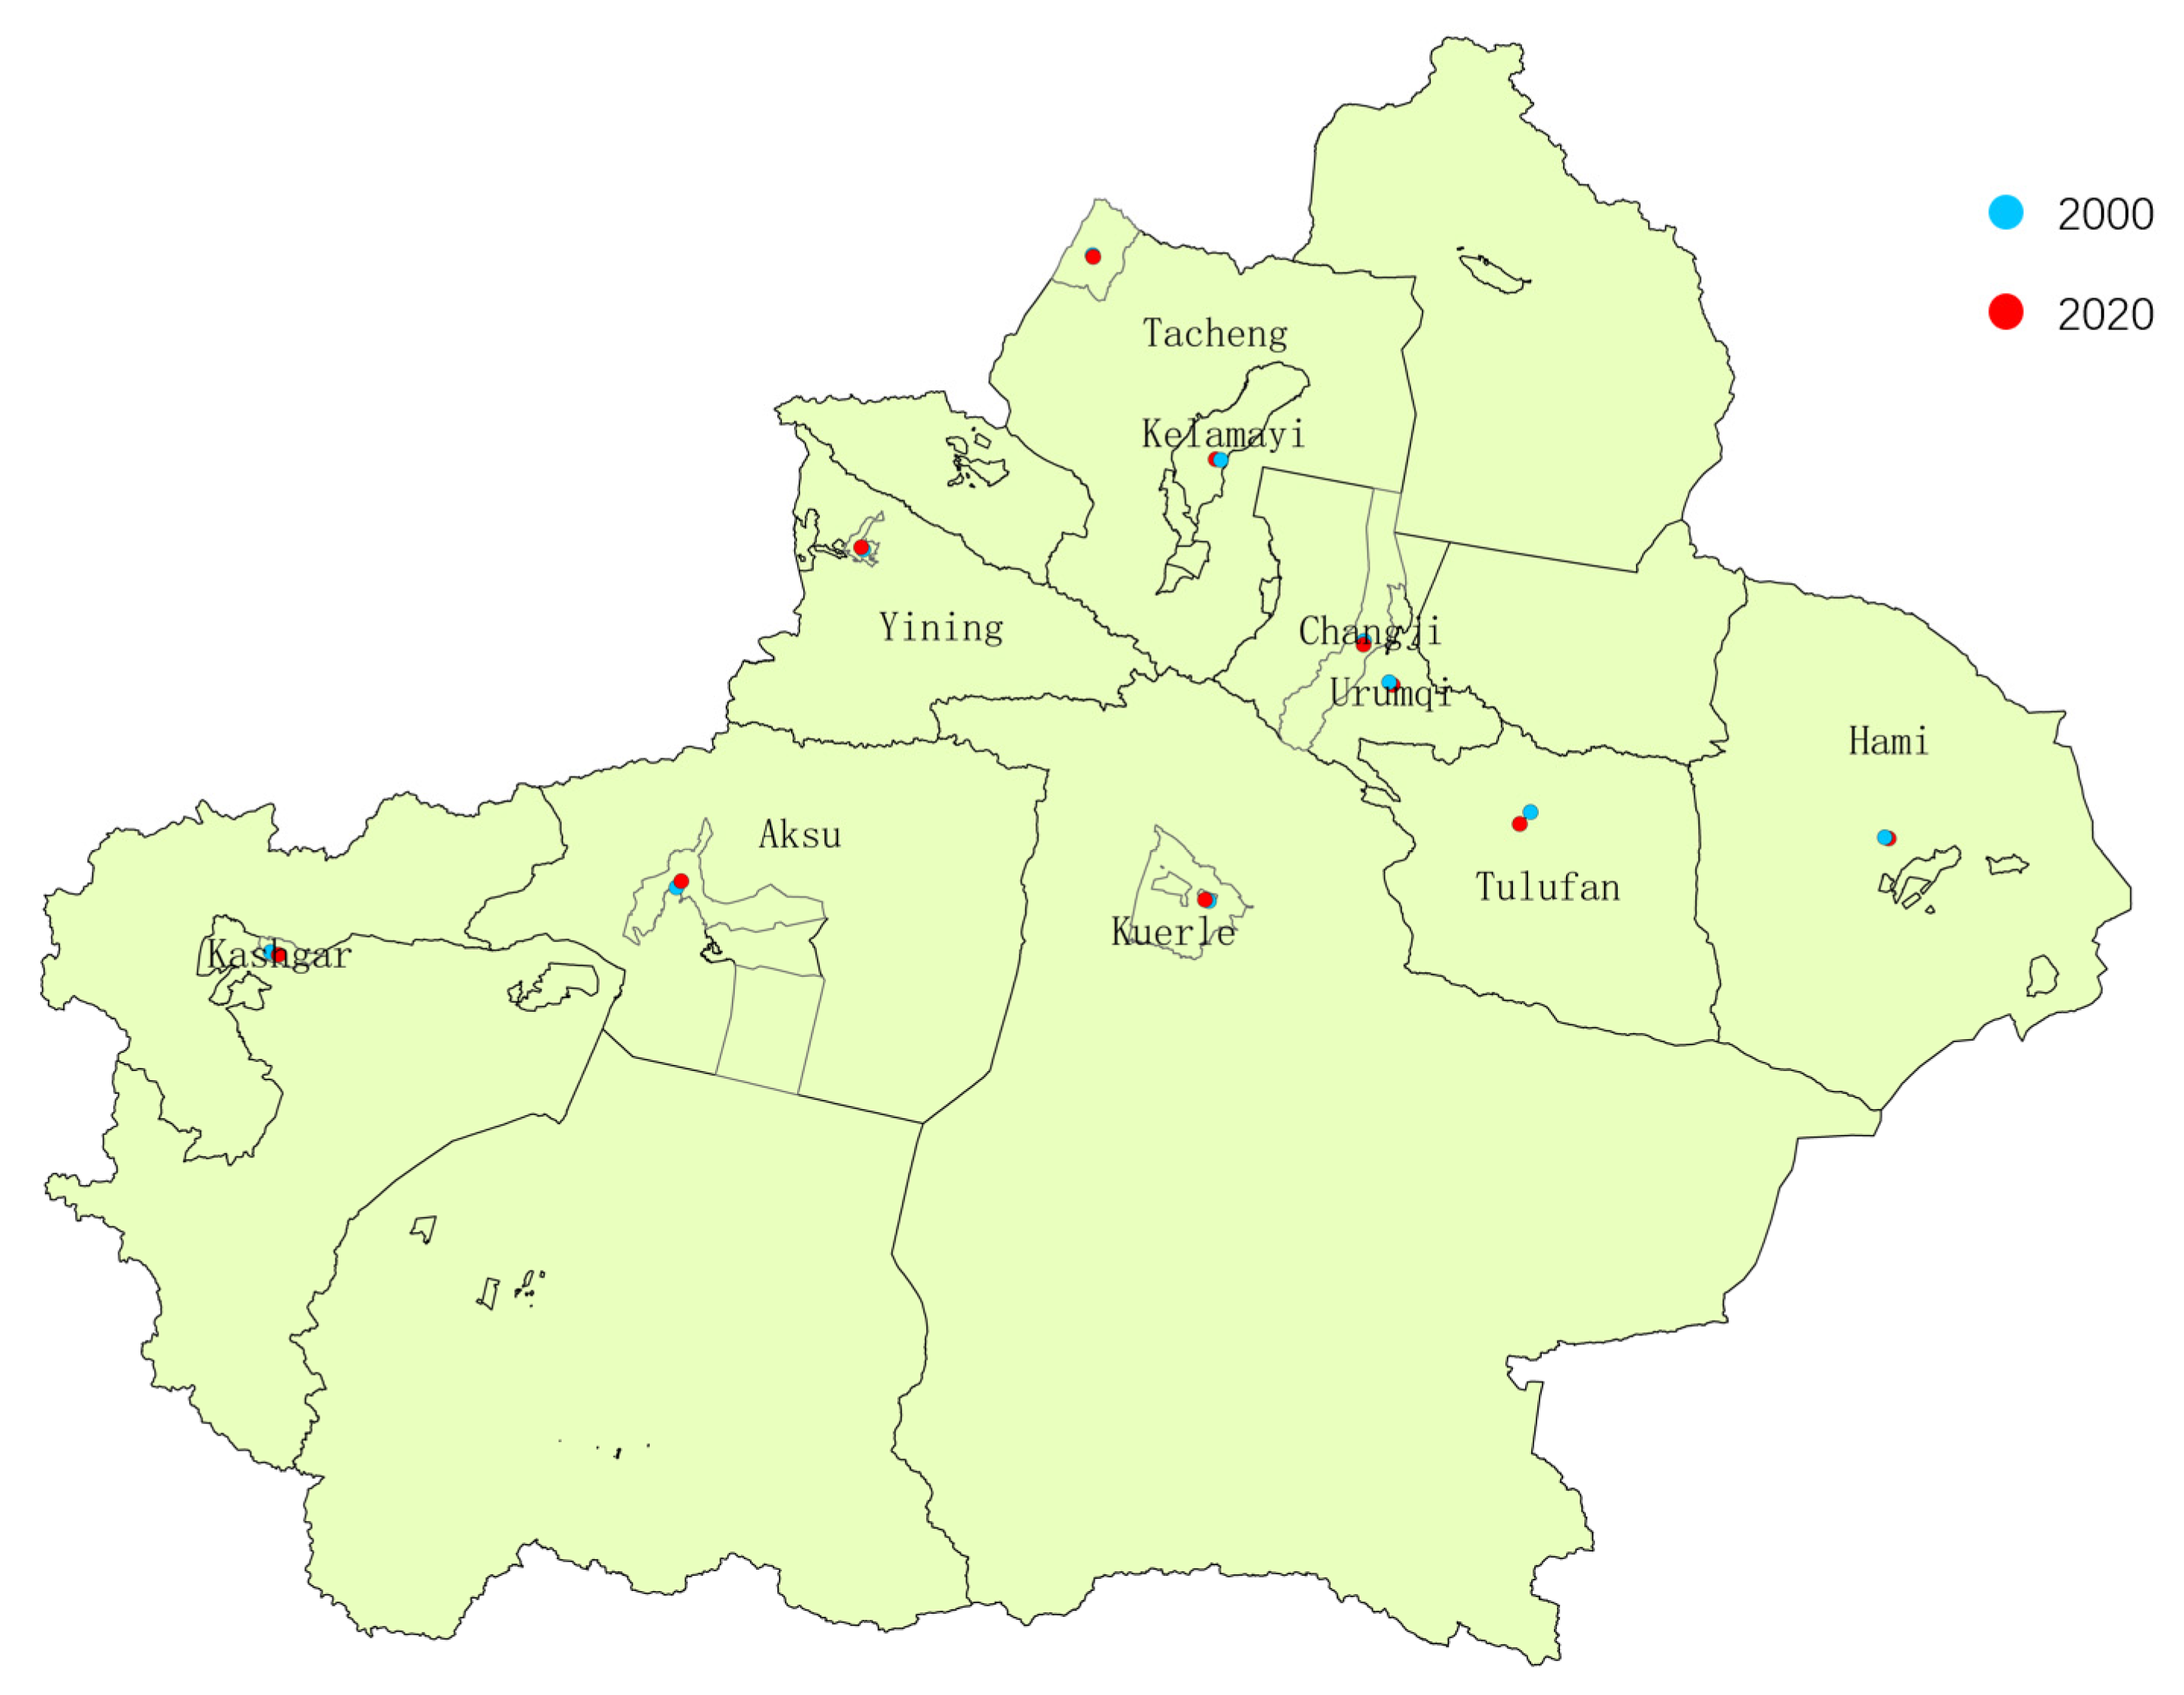
3.2. Relocation of Construction Land Center in Xinjiang
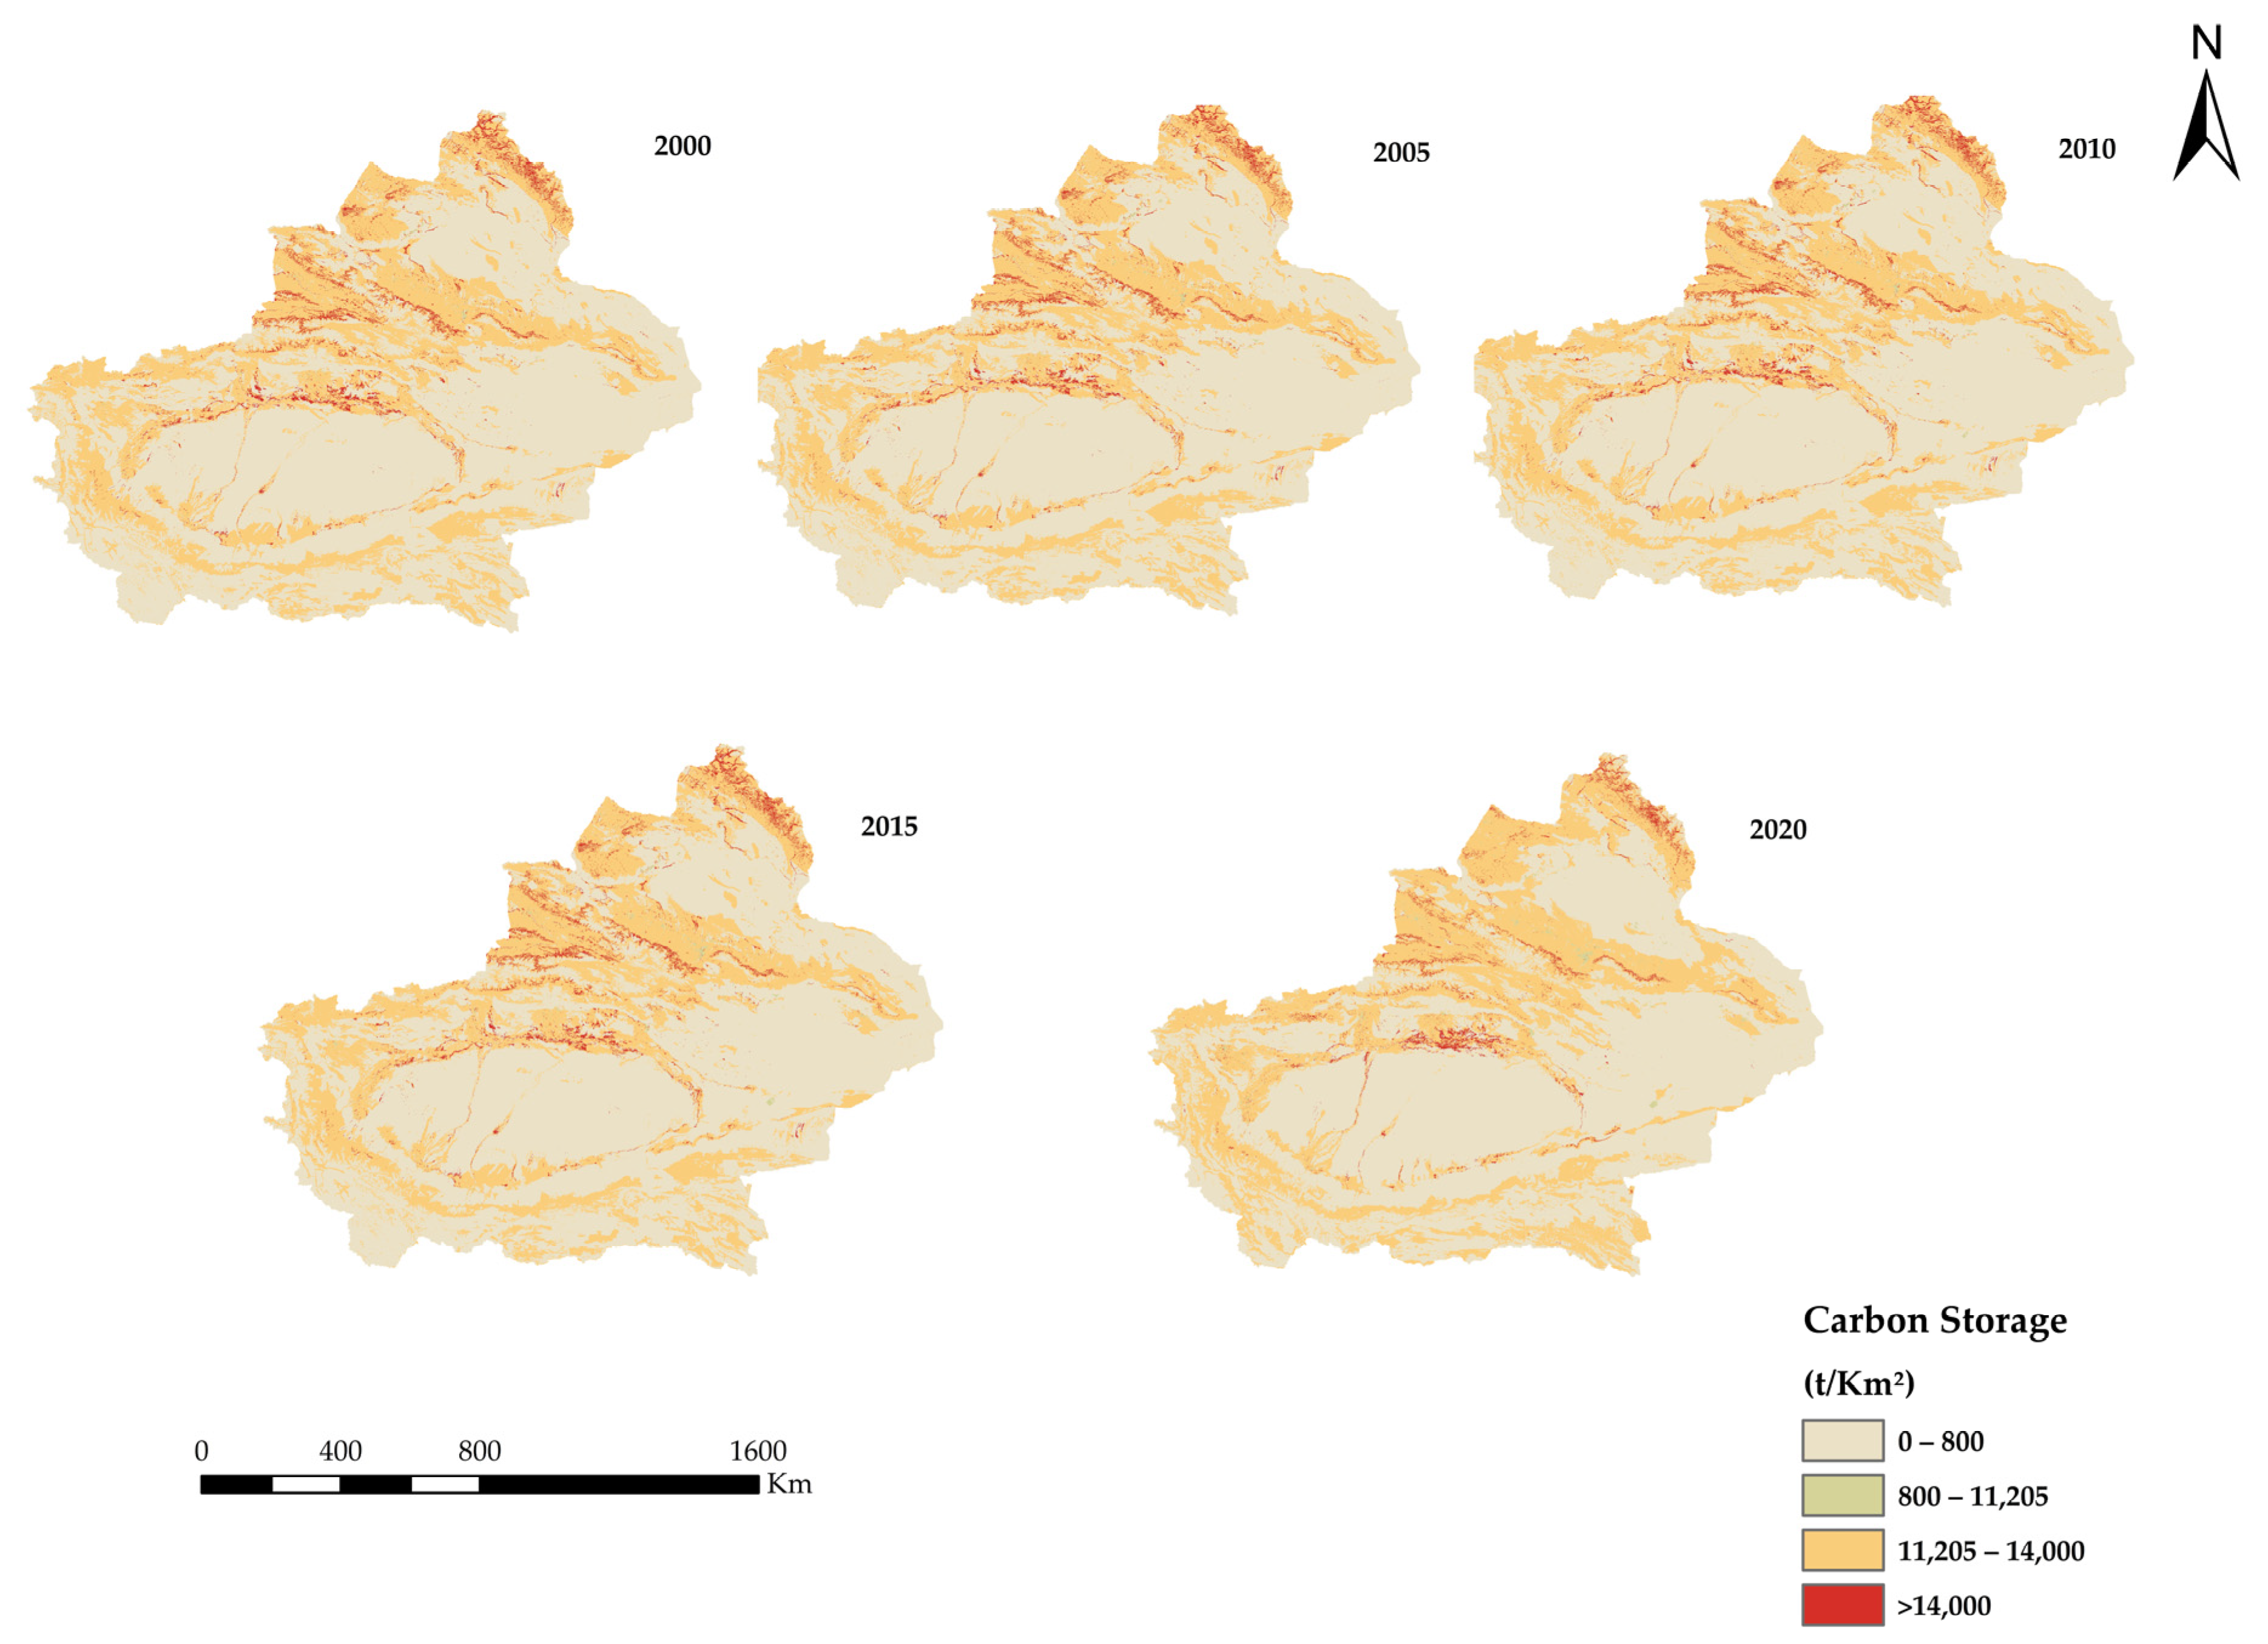
3.3. Spatial Patterns and Temporal Changes in Ecosystem Services in Xinjiang
- (1)
- Carbon storage
- (2)
- Habitat quality
- (3)
- Water yield
- (4)
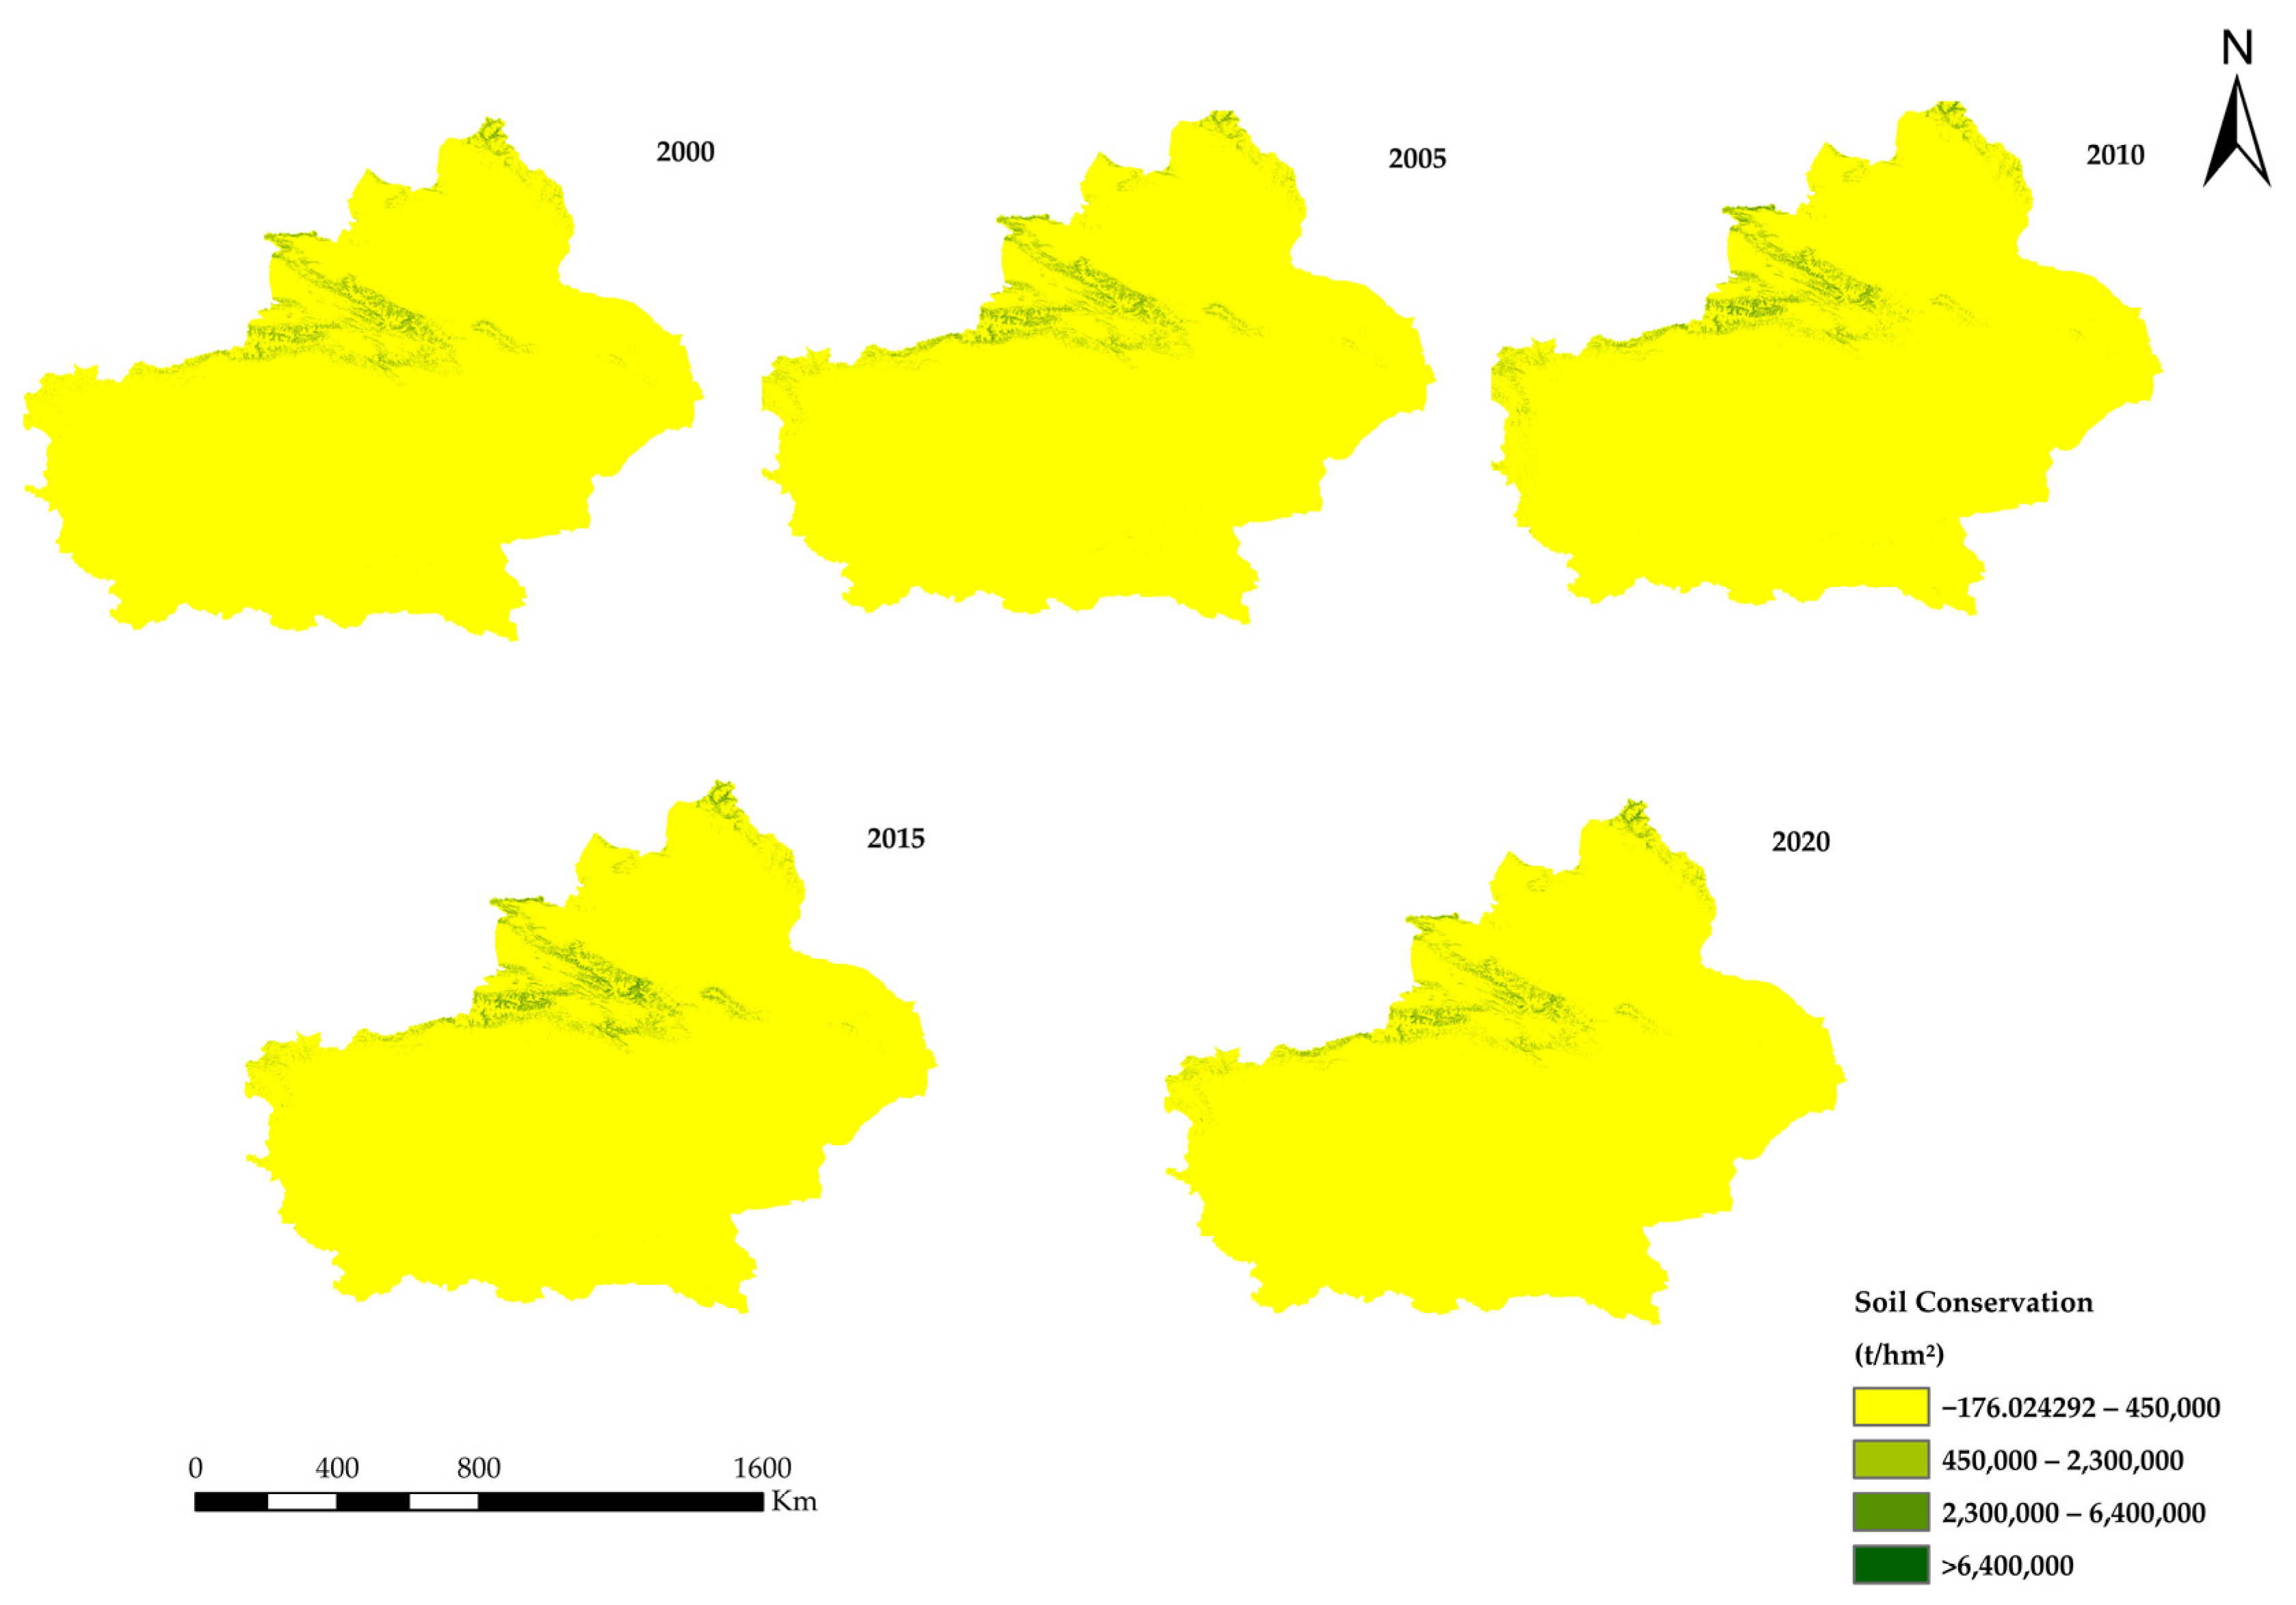
- Soil conservation
- (5)
- Carbon sequestration and oxygen production
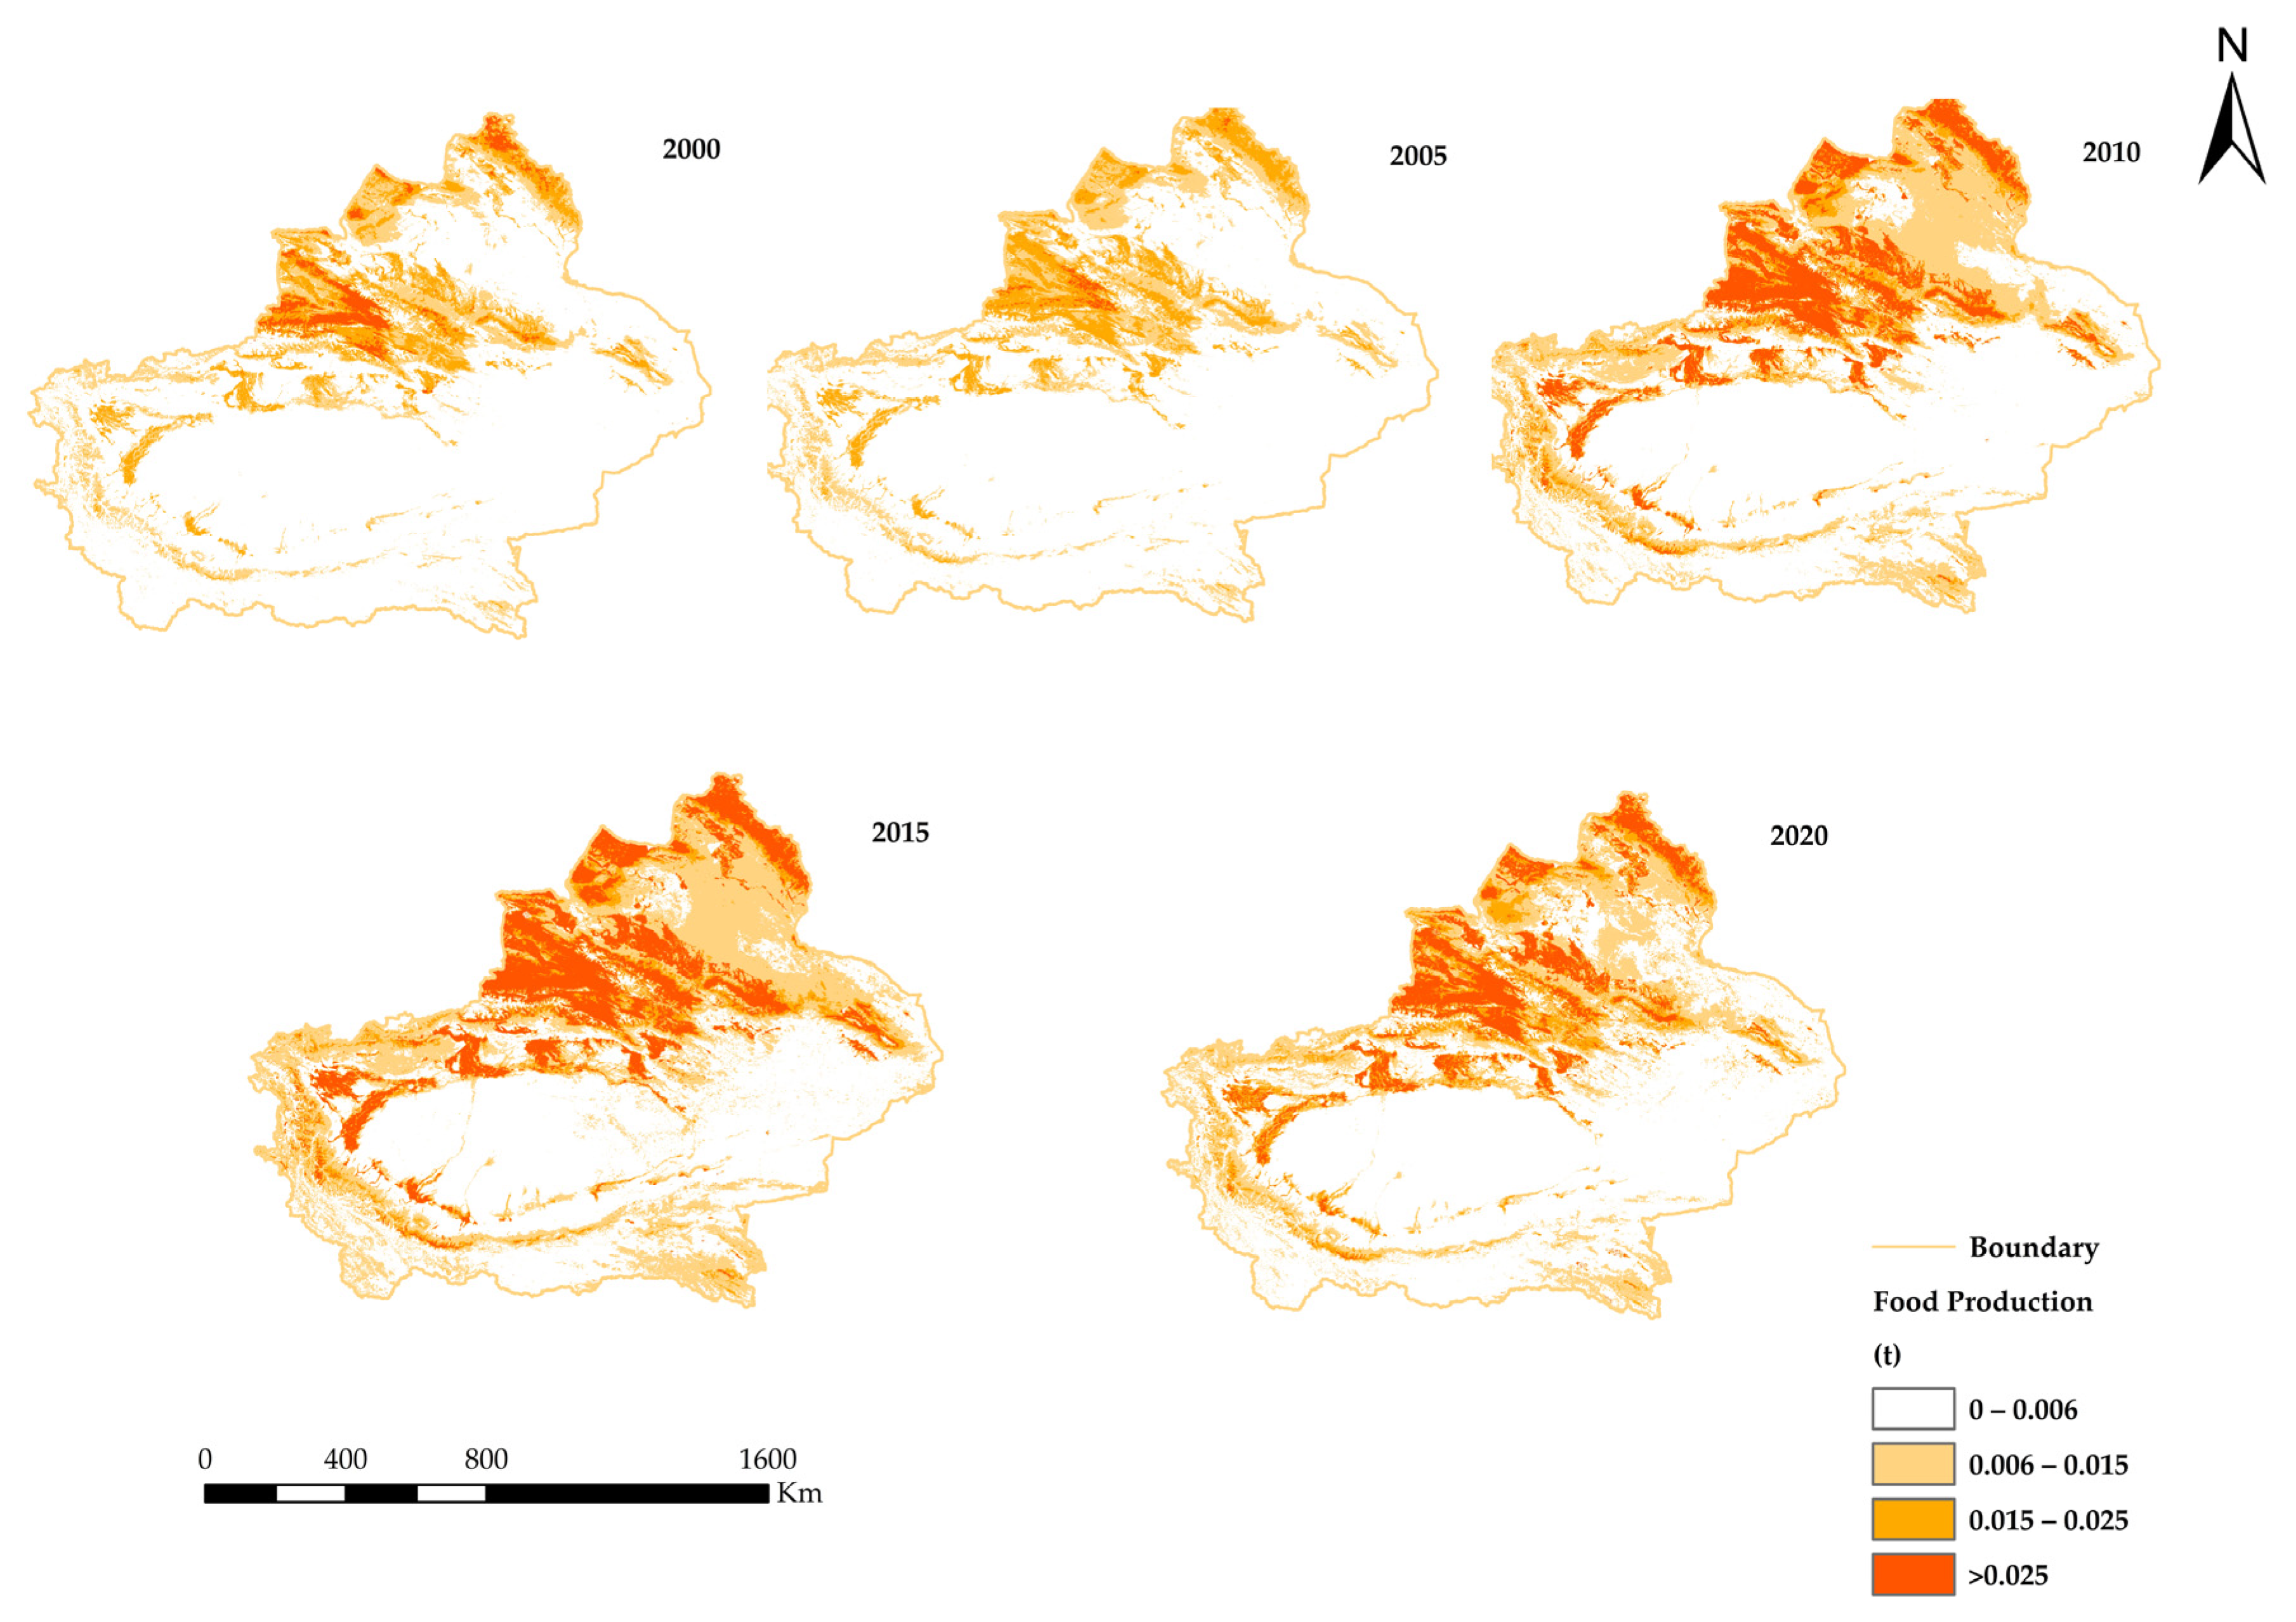
- (6)
- Food production
3.4. Spatial and Temporal Analysis of Ecosystem Service Trade-Offs and Synergies in Xinjiang
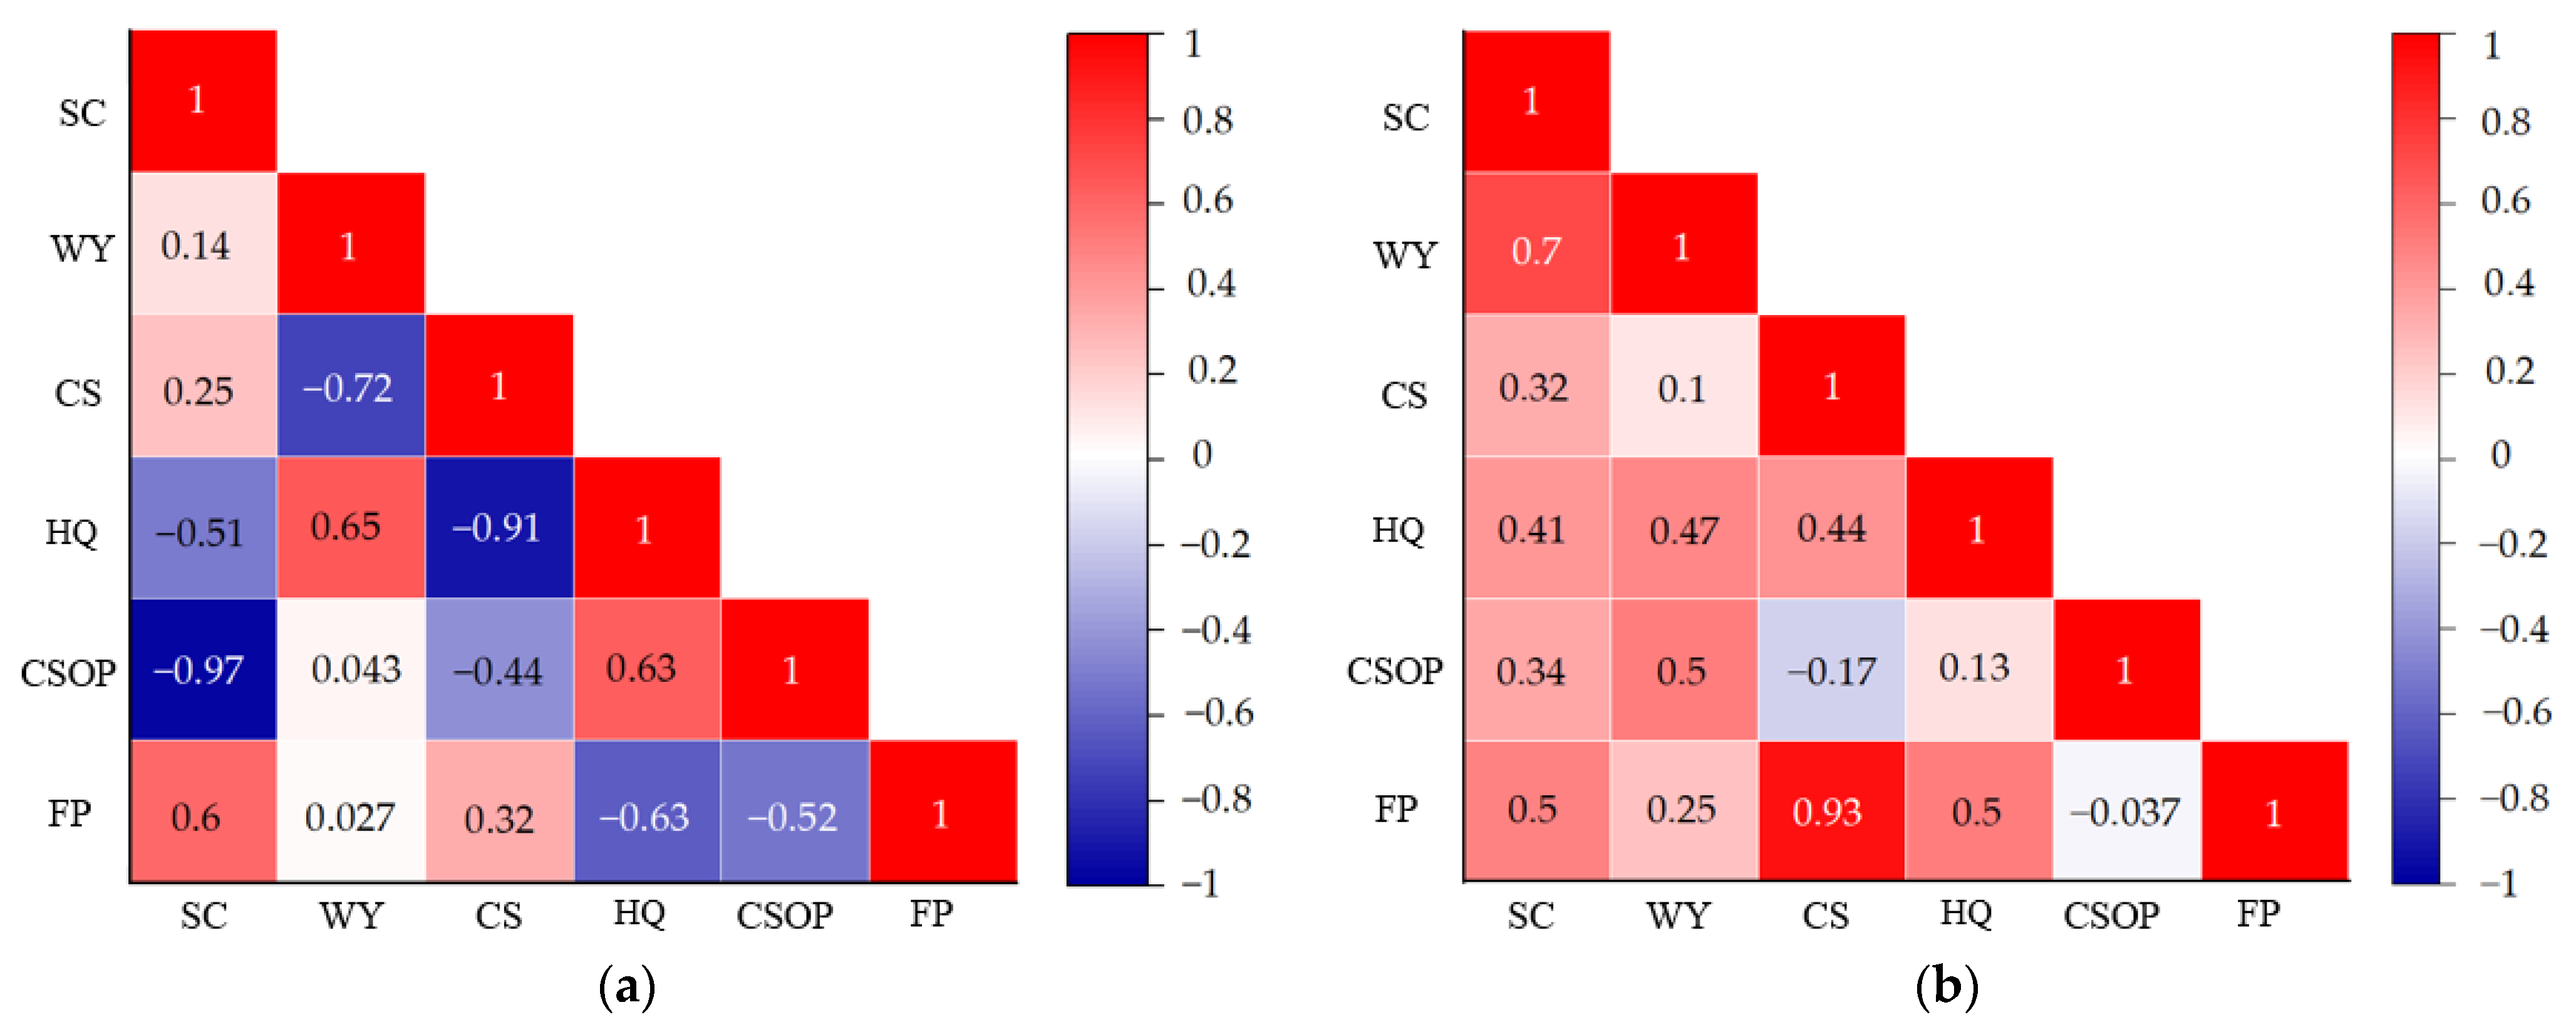
3.4.1. Spatial Distribution of Ecosystem Service Trade-Offs and Synergies in Xinjiang in 2000 and 2020
3.4.2. Temporal Changes in Ecosystem Service Trade-Offs and Synergies in Xinjiang from 2000 to 2020
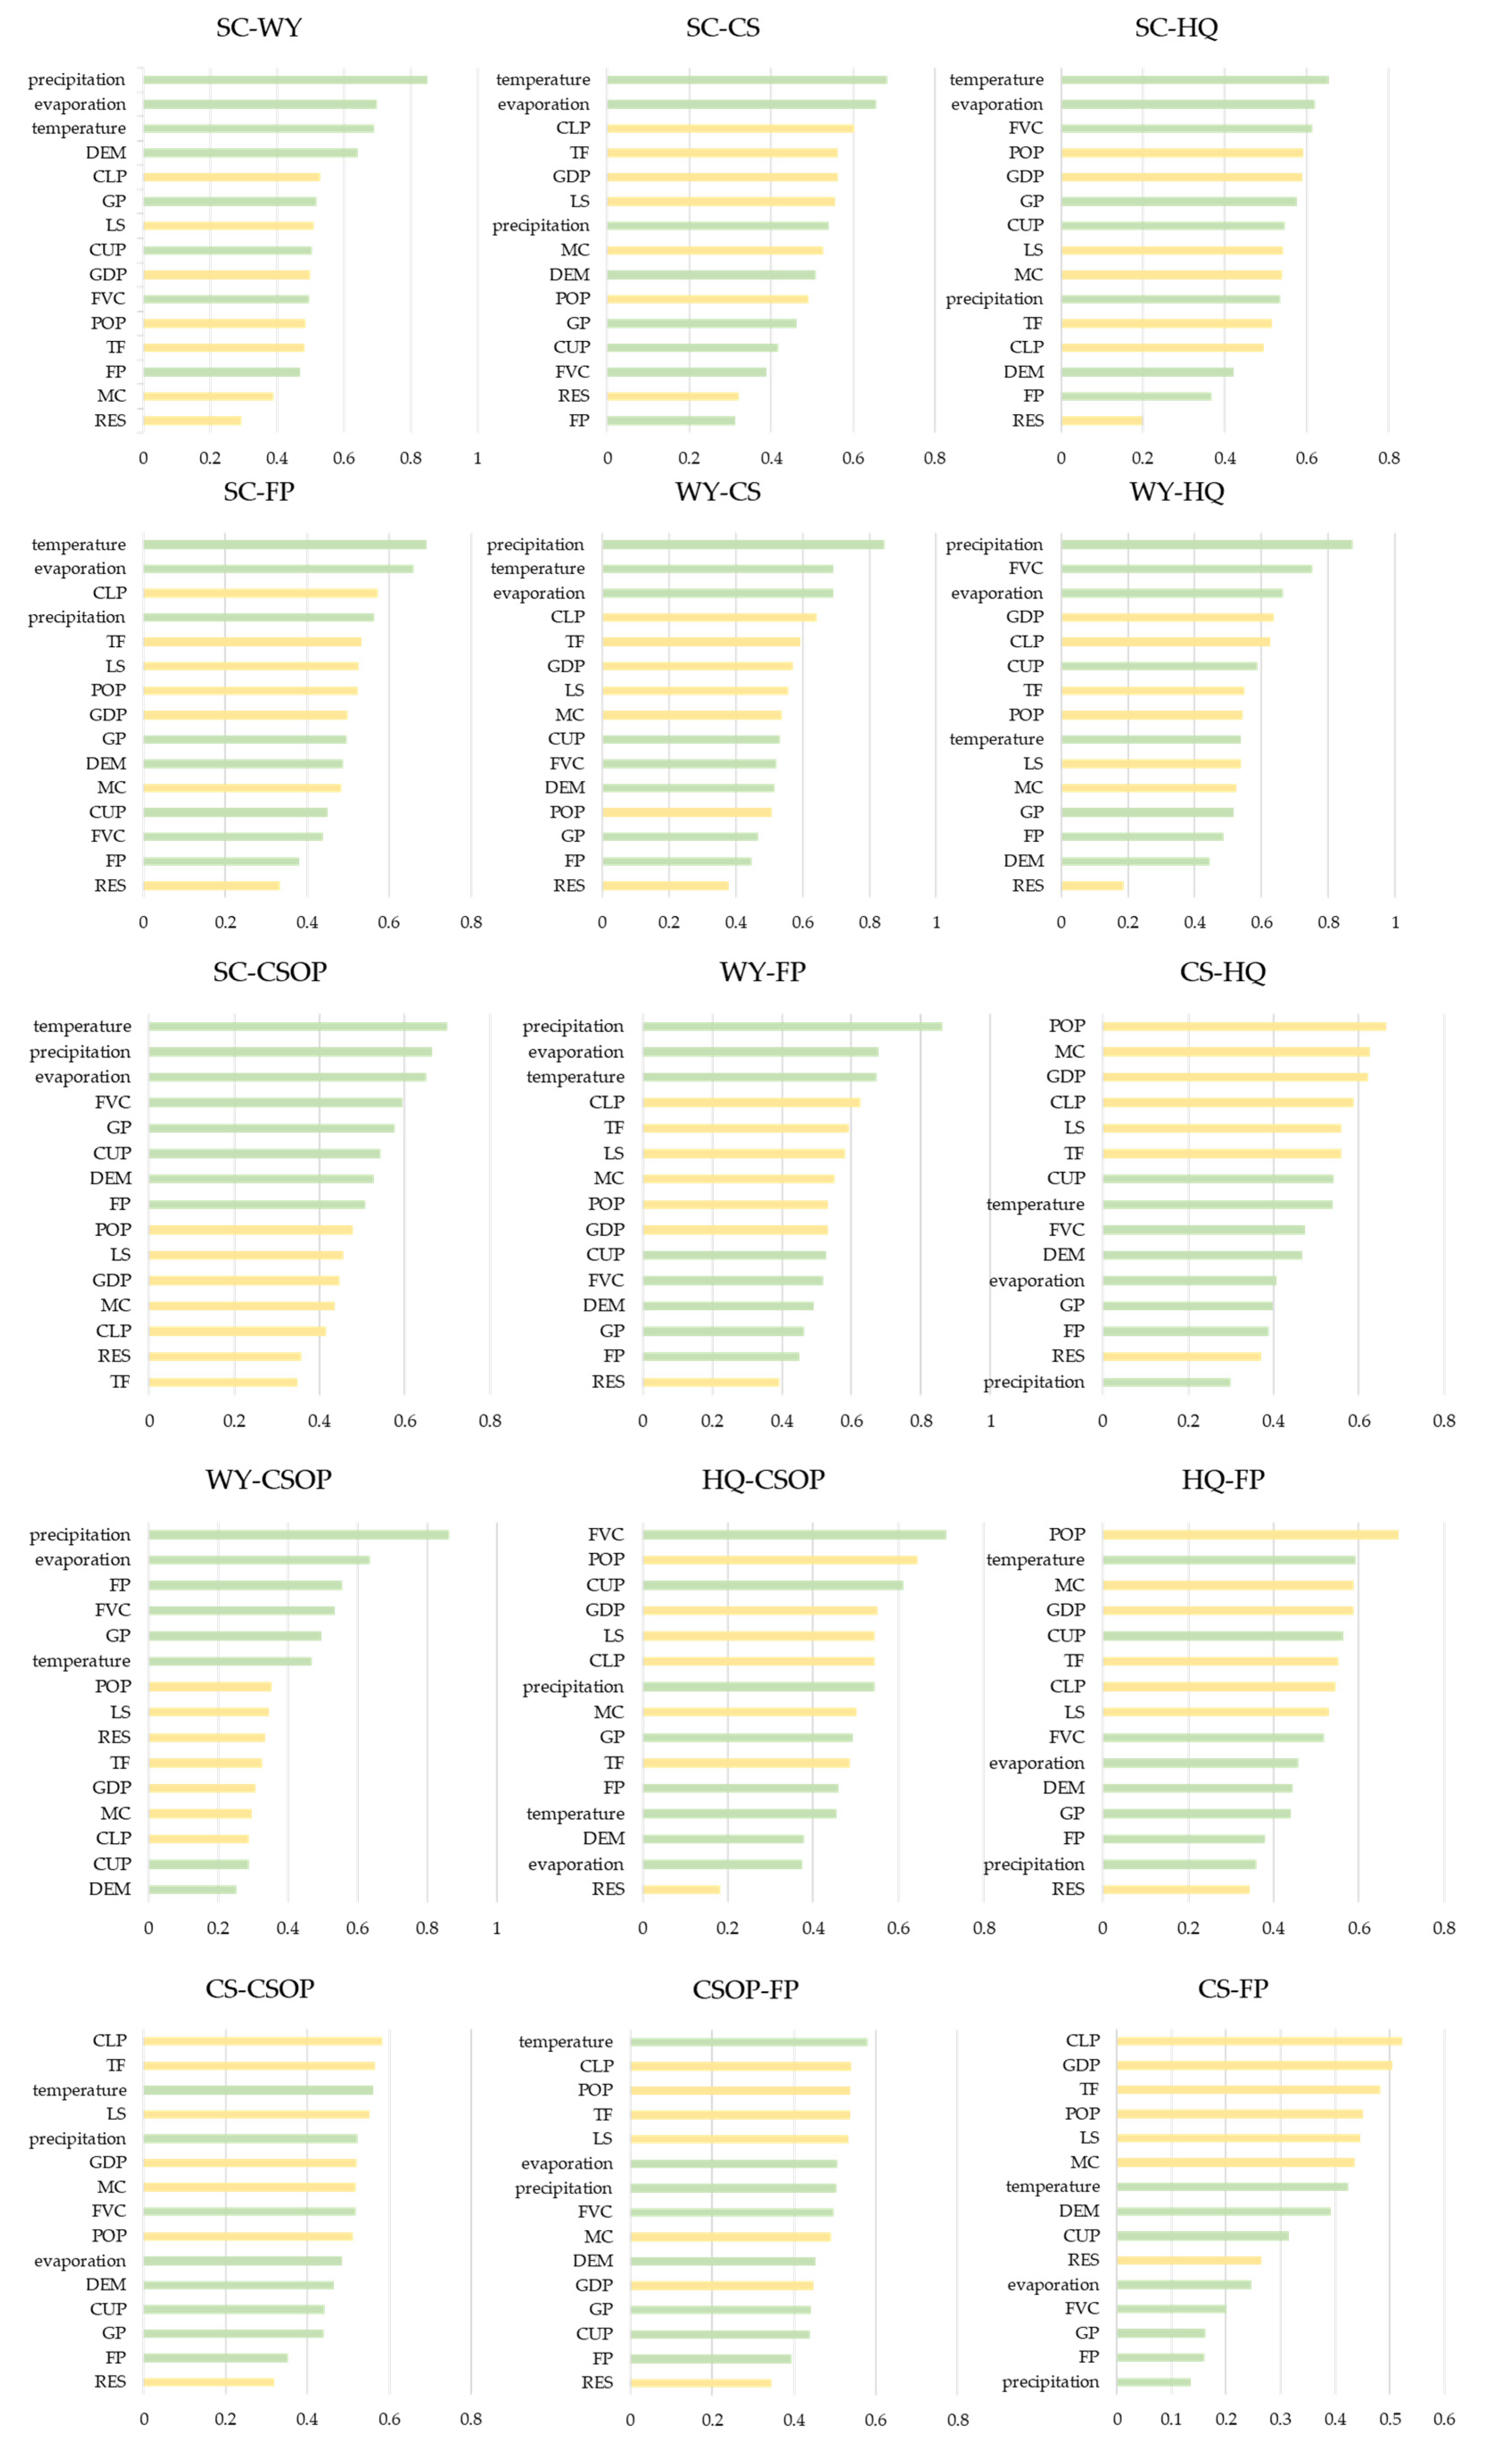
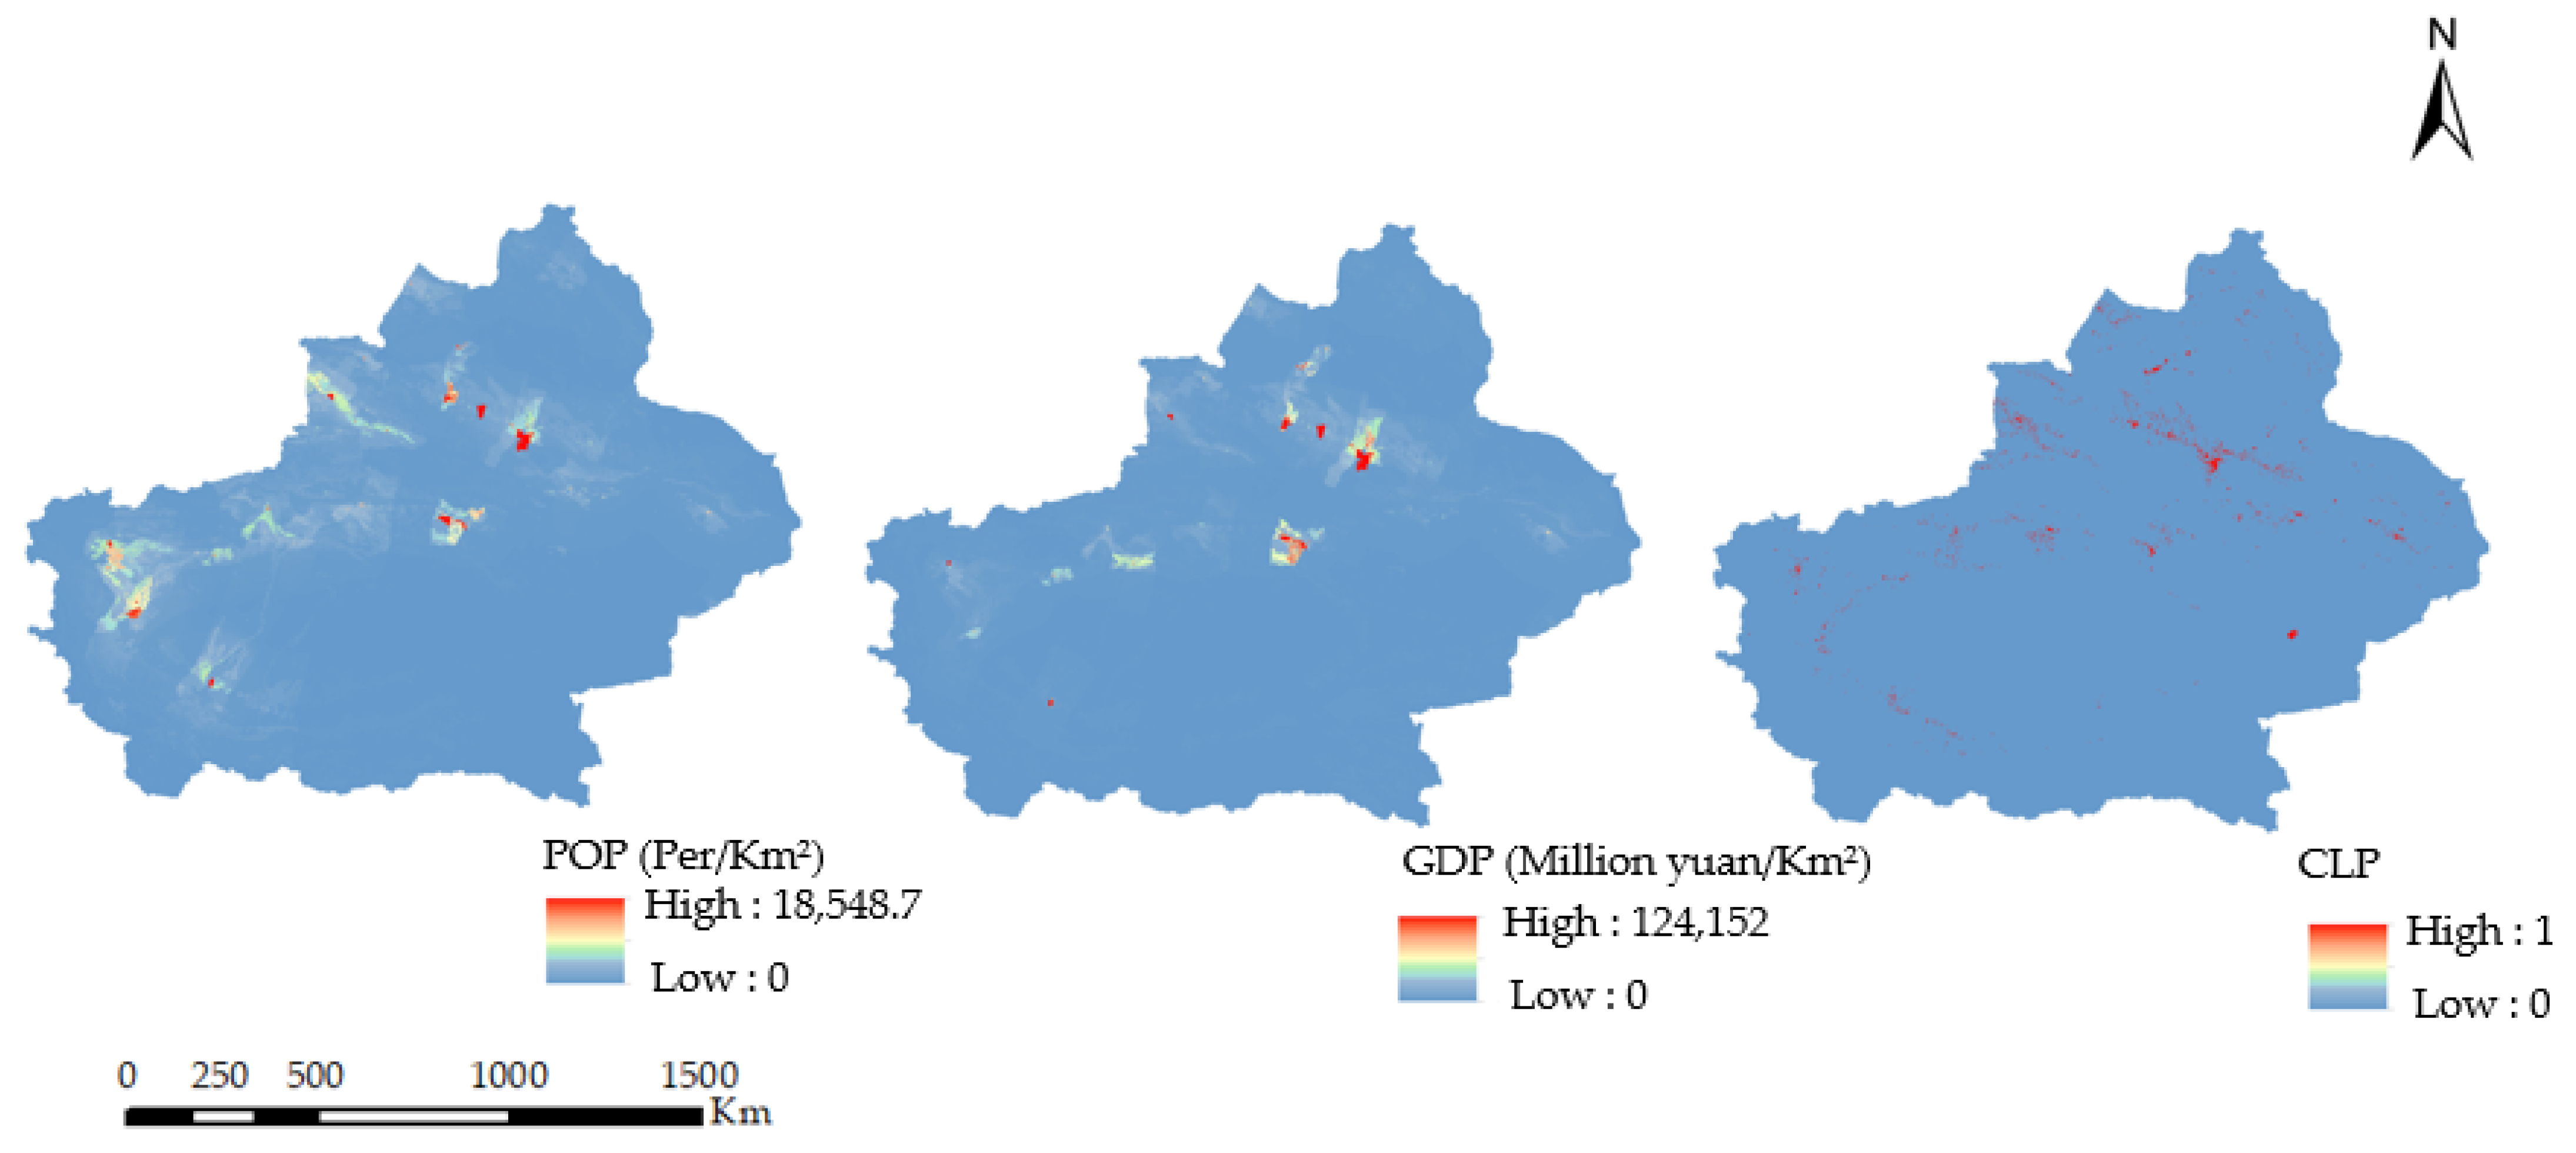
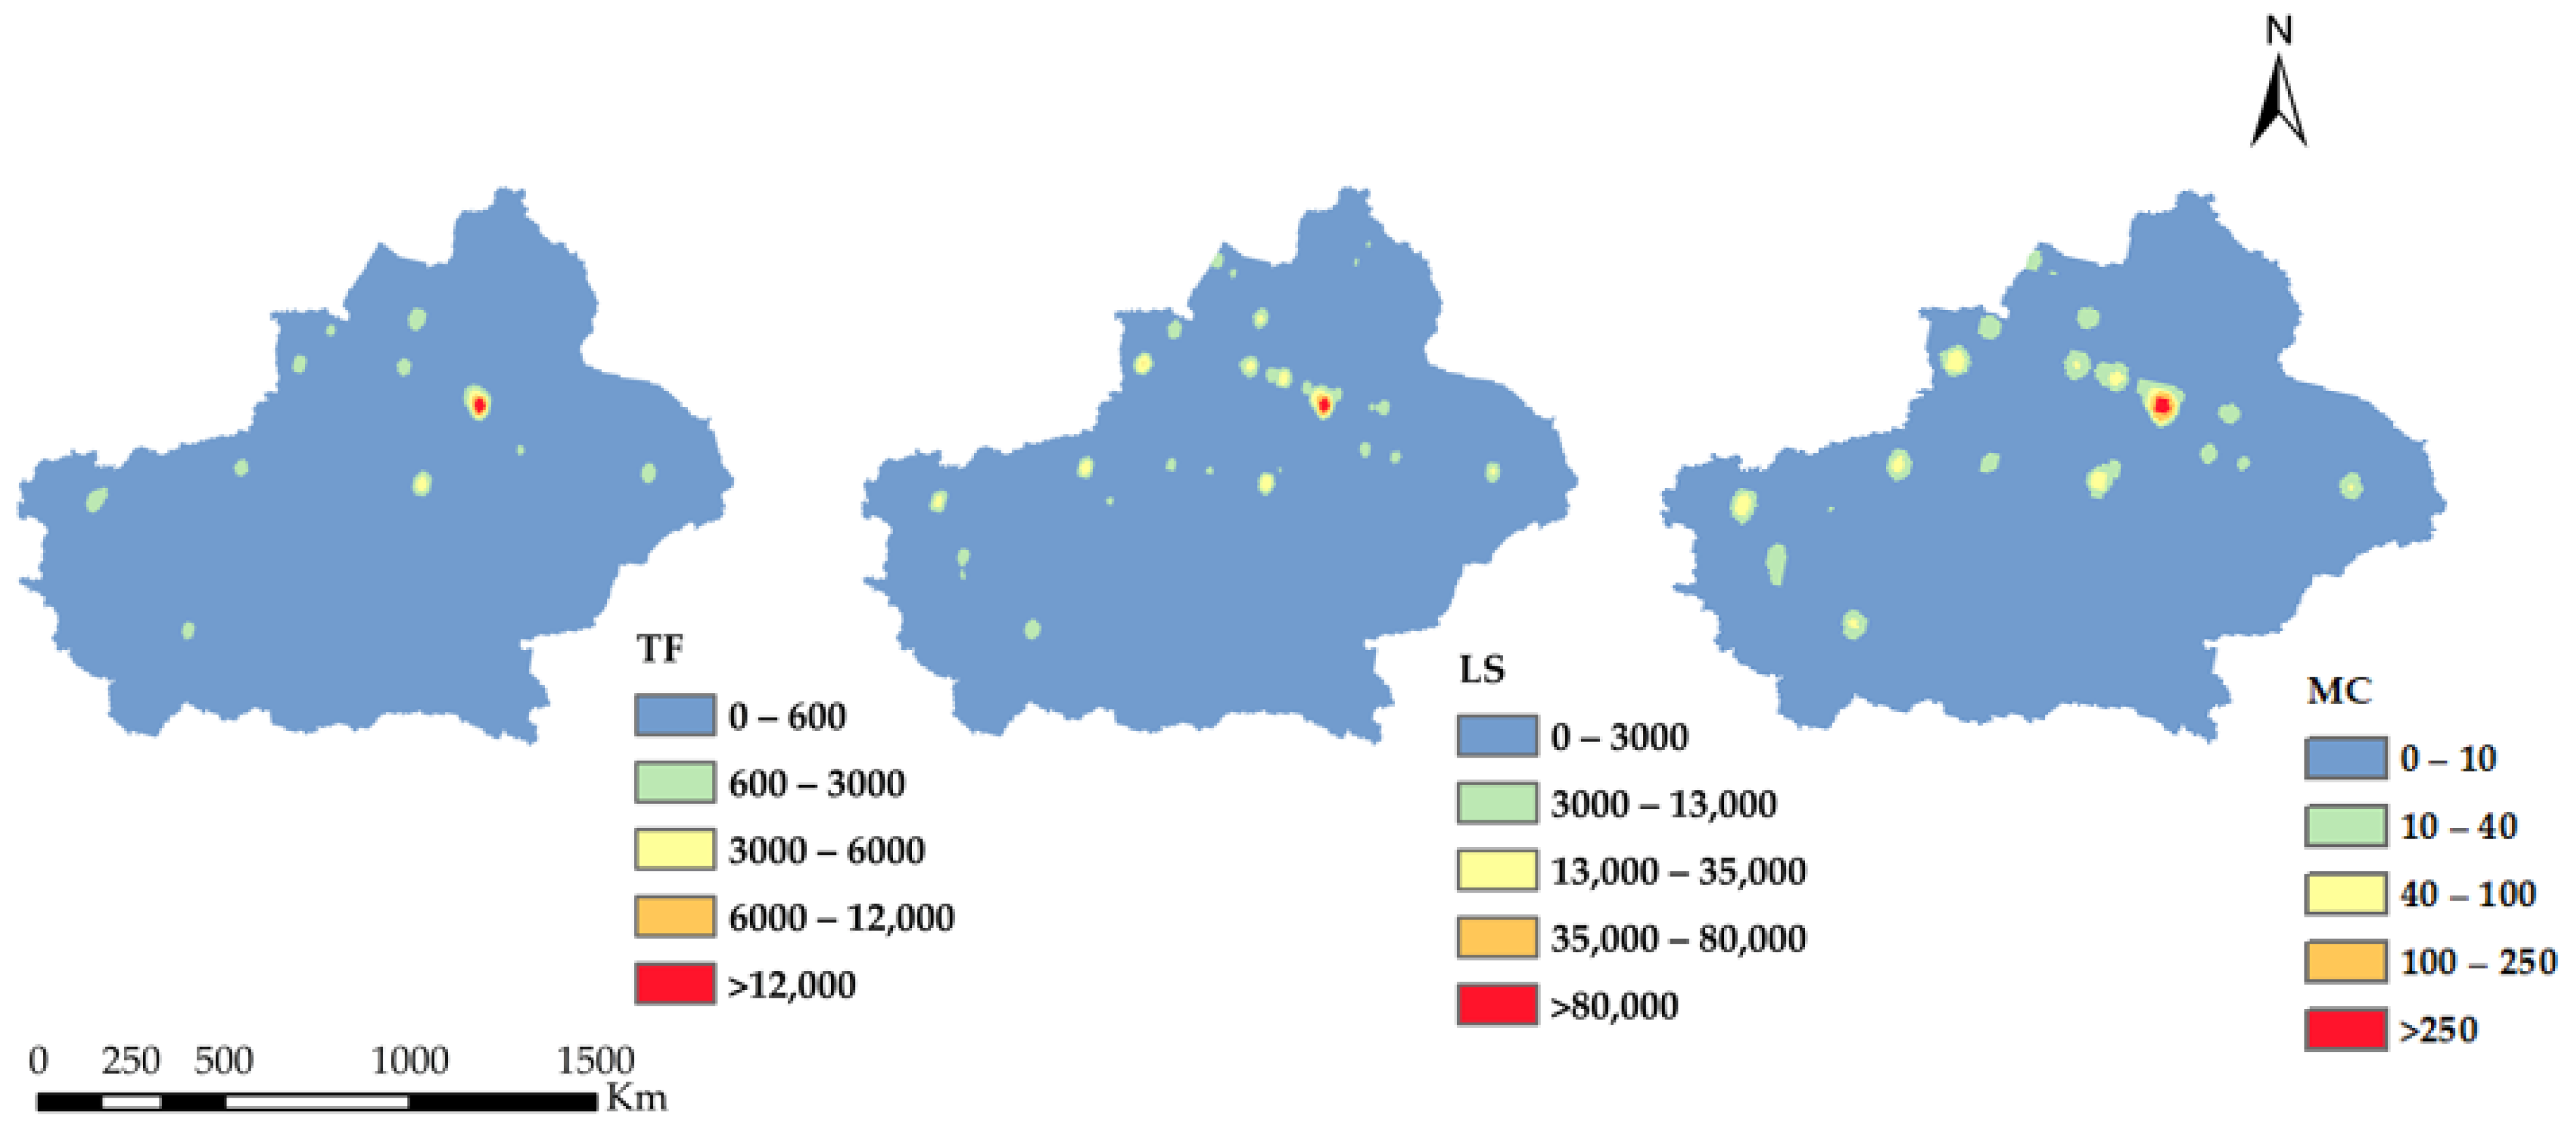
3.5. Analysis of Driving Factors
3.6. Comprehensive Evaluation of the Spatial Patterns of Urbanization Levels
3.7. Thresholds for the Impact of Urbanization on Ecosystem Services
4. Discussion
4.1. Spatiotemporal Analysis of ES and ES Pair Trade-Offs and Synergies
4.2. ES and ES Analysis of Trade-Offs, Synergistic Urbanization, and Multiple Drivers
5. Conclusions
Author Contributions
Funding
Data Availability Statement
Conflicts of Interest
References
- Schild, J.E.M.; Vermaat, J.E.; de Groot, R.S.; Quatrini, S.; van Bodegom, P.M. A global meta-analysis on the monetary valuation of dryland ecosystem services: The role of socio-economic, environmental and methodological indicators. Ecosyst. Serv. 2018, 32, 78–89. [Google Scholar] [CrossRef]
- Shoba, P.; Ramakrishnan, S.S. Modeling the contributing factors of desertification and evaluating their relationships to the soil degradation process through geomatic techniques. Solid Earth 2016, 7, 341–354. [Google Scholar] [CrossRef]
- Ajaj, Q.M.; Pradhan, B.; Noori, A.M.; Jebur, M.N. Spatial Monitoring of Desertification Extent in Western Iraq using Landsat Images and GIS. Land Degrad. Dev. 2017, 28, 2418–2431. [Google Scholar] [CrossRef]
- Ding, H.; Xingming, H. Spatiotemporal change and drivers analysis of desertification in the arid region of northwest China based on geographic detector. Environ. Chall. 2021, 4, 100082. [Google Scholar] [CrossRef]
- Chen, B.; Jing, X.; Liu, S.; Jiang, J.; Wang, Y. Intermediate human activities maximize dryland ecosystem services in the long-term land-use change: Evidence from the Sangong River watershed, northwest China. J. Environ. Manag. 2022, 319, 115708. [Google Scholar] [CrossRef]
- HF, Z. Spatial scale characteristics of ecosystem services. Chin. J. Appl. Ecol. 2007, 26, 1432–1437. [Google Scholar] [CrossRef]
- Fu, B.; Forsius, M.; Liu, J. Ecosystem services: Climate change and policy impacts editorial overview. Curr. Opin. Environ. Sustain. 2013, 5, 1–3. [Google Scholar] [CrossRef]
- Fu, B.; Wang, S.; Su, C.; Forsius, M. Linking ecosystem processes and ecosystem services. Curr. Opin. Environ. Sustain. 2013, 5, 4–10. [Google Scholar] [CrossRef]
- Ouyang, Z.; Zheng, H.; Xiao, Y.; Polasky, S.; Liu, J.; Xu, W.; Wang, Q.; Zhang, L.; Xiao, Y.; Rao, E.; et al. Improvements in ecosystem services from investments in natural capital. Science 2016, 352, 1455–1459. [Google Scholar] [CrossRef]
- Xie, G.; Li, W.; Xiao, Y.; Zhang, B.; Lu, C.; An, K.; Wang, J.; Xu, K.; Wang, J. Forest ecosystem services and their values in Beijing. Chin. Geogr. Sci. 2010, 20, 51–58. [Google Scholar] [CrossRef]
- Lu, N.; Wang, M.; Ning, B.; Yu, D.; Fu, B. Research advances in ecosystem services in drylands under global environmental changes. Curr. Opin. Environ. Sustain. 2018, 33, 92–98. [Google Scholar] [CrossRef]
- Dai, E.F.; Wang, X.L.; Zhu, J.J.; Xi, W.M. Quantifying ecosystem service trade-offs for plantation forest management to benefit provisioning and regulating services. Ecol. Evol. 2017, 7, 7807–7821. [Google Scholar] [CrossRef]
- Mouchet, M.A.; Lamarque, P.; Martín-López, B.; Crouzat, E.; Gos, P.; Byczek, C.; Lavorel, S. An interdisciplinary methodological guide for quantifying associations between ecosystem services. Glob. Environ. Change 2014, 28, 298–308. [Google Scholar] [CrossRef]
- Dittrich, A.; Seppelt, R.; Václavík, T.; Cord, A.F. Integrating ecosystem service bundles and socio-environmental conditions—A national scale analysis from Germany. Ecosyst. Serv. 2017, 28, 273–282. [Google Scholar] [CrossRef]
- Gao, J.; Zuo, L. Revealing ecosystem services relationships and their driving factors for five basins of Beijing. J. Geogr. Sci. 2021, 31, 111–129. [Google Scholar] [CrossRef]
- Raudsepp-Hearne, C.; Peterson, G.D.; Bennett, E.M. Ecosystem service bundles for analyzing tradeoffs in diverse landscapes. Proc. Natl. Acad. Sci. USA 2010, 107, 5242–5247. [Google Scholar] [CrossRef] [PubMed]
- Rodríguez, J.P.; Beard, T.D.; Bennett, E.M.; Cumming, G.S.; Cork, S.J.; Agard, J.; Dobson, A.P.; Peterson, G.D. Trade-offs across Space, Time, and Ecosystem Services. Ecol. Soc. 2006, 11, 28. [Google Scholar] [CrossRef]
- Spake, R.; Lasseur, R.; Crouzat, E.; Bullock, J.M.; Lavorel, S.; Parks, K.E.; Schaafsma, M.; Bennett, E.M.; Maes, J.; Mulligan, M.; et al. Unpacking ecosystem service bundles: Towards predictive mapping of synergies and trade-offs between ecosystem services. Glob. Environ. Change 2017, 47, 37–50. [Google Scholar] [CrossRef]
- Xu, J.; Wang, S.; Xiao, Y.; Xie, G.; Wang, Y.; Zhang, C.; Li, P.; Lei, G. Mapping the spatiotemporal heterogeneity of ecosystem service relationships and bundles in Ningxia, China. J. Clean. Prod. 2021, 294, 126216. [Google Scholar] [CrossRef]
- Raudsepp-Hearne, C.; Peterson, G.D. Scale and ecosystem services: How do observation, management, and analysis shift with scale—Lessons from Québec. Ecol. Soc. 2016, 21, 16. [Google Scholar] [CrossRef]
- Zhang, C.; Bai, Y.; Yang, X.; Gao, Z.; Liang, J.; Chen, Z. Scenario analysis of the relationship among ecosystem service values—A case study of Yinchuan Plain in northwestern China. Ecol. Indic. 2022, 143, 109320. [Google Scholar] [CrossRef]
- Yang, S.; Zhao, W.; Liu, Y.; Wang, S.; Wang, J.; Zhai, R. Influence of land use change on the ecosystem service trade-offs in the ecological restoration area: Dynamics and scenarios in the Yanhe watershed, China. Sci. Total Environ. 2018, 644, 556–566. [Google Scholar] [CrossRef] [PubMed]
- Peng, L.; Chen, T.; Deng, W.; Liu, Y. Exploring ecosystem services trade-offs using the Bayesian belief network model for ecological restoration decision-making: A case study in Guizhou Province, China. Ecol. Indic. 2022, 135, 108569. [Google Scholar] [CrossRef]
- Zhang, Z.; Liu, Y.; Wang, Y.; Liu, Y.; Zhang, Y.; Zhang, Y. What factors affect the synergy and tradeoff between ecosystem services, and how, from a geospatial perspective? J. Clean. Prod. 2020, 257, 120454. [Google Scholar] [CrossRef]
- McDonald, R.I.; Mansur, A.V.; Ascensão, F.; Colbert, M.l.; Crossman, K.; Elmqvist, T.; Gonzalez, A.; Güneralp, B.; Haase, D.; Hamann, M.; et al. Research gaps in knowledge of the impact of urban growth on biodiversity. Nat. Sustain. 2020, 3, 16–24. [Google Scholar] [CrossRef]
- Zhang, H.; Deng, W.; Zhang, S.; Peng, L.; Liu, Y. Impacts of urbanization on ecosystem services in the Chengdu-Chongqing Urban Agglomeration: Changes and trade-offs. Ecol. Indic. 2022, 139, 108920. [Google Scholar] [CrossRef]
- Lyu, R.; Zhang, J.; Xu, M.; Li, J. Impacts of urbanization on ecosystem services and their temporal relations: A case study in Northern Ningxia, China. Land Use Policy 2018, 77, 163–173. [Google Scholar] [CrossRef]
- Yang, M.; Gao, X.; Siddique, K.H.M.; Wu, P.; Zhao, X. Spatiotemporal exploration of ecosystem service, urbanization, and their interactive coercing relationship in the Yellow River Basin over the past 40 years. Sci. Total Environ. 2023, 858, 159757. [Google Scholar] [CrossRef] [PubMed]
- Gong, J.; Liu, D.; Zhang, J.; Xie, Y.; Cao, E.; Li, H. Tradeoffs/synergies of multiple ecosystem services based on land use simulation in a mountain-basin area, western China. Ecol. Indic. 2019, 99, 283–293. [Google Scholar] [CrossRef]
- Pradhan, P.; Costa, L.; Rybski, D.; Lucht, W.; Kropp, J.P. A Systematic Study of Sustainable Development Goal (SDG) Interactions. Earth’s Future 2017, 5, 1169–1179. [Google Scholar] [CrossRef]
- Zhang, W.; Yang, D.; Huo, J. Studies of the Relationship between City Size and Urban Benefits in China Based on a Panel Data Model. Sustainability 2016, 8, 554. [Google Scholar] [CrossRef]
- Toms, J.D.; Lesperance, M.L. Piecewise Regression: A Tool for Identifying Ecological Thresholds. Ecology 2003, 84, 2034–2041. [Google Scholar] [CrossRef]
- Peng, J.; Tian, L.; Liu, Y.; Zhao, M.; Hu, Y.; Wu, J. Ecosystem services response to urbanization in metropolitan areas: Thresholds identification. Sci. Total Environ. 2017, 607–608, 706–714. [Google Scholar] [CrossRef] [PubMed]
- Fang, L.; Wang, L.; Chen, W.; Sun, J.; Cao, Q.; Wang, S.; Wang, L. Identifying the impacts of natural and human factors on ecosystem service in the Yangtze and Yellow River Basins. J. Clean. Prod. 2021, 314, 127995. [Google Scholar] [CrossRef]
- Chen, F.; Shahrajabian, M.H. The status quo of desertification and the prevention strategy in Xinjiang. J. Food Agric. Environ. 2013, 11, 1025–1032. [Google Scholar]
- He, K.; Wu, S.; Yang, Y.; Wang, D.; Zhang, S.; Yin, N. Dynamic changes of land use and oasis in Xinjiang in the last 40 years. Arid. Land Geogr. 2018, 41, 1333–1340. [Google Scholar]
- Brunsdon, C.; Fotheringham, A.S.; Charlton, M.E. Geographically Weighted Regression: A Method for Exploring Spatial Nonstationarity. Geogr. Anal. 1996, 28, 281–298. [Google Scholar] [CrossRef]
- Wang, Y.; Dai, E.; Ge, Q.; Zhang, X.; Yu, C. Spatial heterogeneity of ecosystem services and their trade-offs in the Hengduan Mountain region, Southwest China. Catena 2021, 207, 105632. [Google Scholar] [CrossRef]
- Deng, C.; Liu, J.; Nie, X.; Li, Z.; Liu, Y.; Xiao, H.; Hu, X.; Wang, L.; Zhang, Y.; Zhang, G.; et al. How trade-offs between ecological construction and urbanization expansion affect ecosystem services. Ecol. Indic. 2021, 122, 107253. [Google Scholar] [CrossRef]
- Xiao, J.; Song, F.; Su, F.; Shi, Z.; Song, S. Quantifying the independent contributions of climate and land use change to ecosystem services. Ecol. Indic. 2023, 153, 110411. [Google Scholar] [CrossRef]
- Leh, M.D.K.; Matlock, M.D.; Cummings, E.C.; Nalley, L.L. Quantifying and mapping multiple ecosystem services change in West Africa. Agric. Ecosyst. Environ. 2013, 165, 6–18. [Google Scholar] [CrossRef]
- Jerath, M.; Bhat, M.; Rivera-Monroy, V.H.; Castañeda-Moya, E.; Simard, M.; Twilley, R.R. The role of economic, policy, and ecological factors in estimating the value of carbon stocks in Everglades mangrove forests, South Florida, USA. Environ. Sci. Policy 2016, 66, 160–169. [Google Scholar] [CrossRef]
- Li, J.; Zhou, Z.X. Natural and human impacts on ecosystem services in Guanzhong—Tianshui economic region of China. Environ. Sci. Pollut. Res. 2016, 23, 6803–6815. [Google Scholar] [CrossRef]
- Kuri, F.; Murwira, A.; Murwira, K.S.; Masocha, M. Predicting maize yield in Zimbabwe using dry dekads derived from remotely sensed Vegetation Condition Index. Int. J. Appl. Earth Obs. Geoinf. 2014, 33, 39–46. [Google Scholar] [CrossRef]
- Huang, L.; Zhu, P.; Cao, W. The impacts of the Grain for Green Project on the trade-off and synergy relationships among multiple ecosystem services in China. Acta Ecol. Sin. 2021, 41, 1178–1188. [Google Scholar] [CrossRef]
- Xia, H.; Yuan, S.; Prishchepov, A.V. Spatial-temporal heterogeneity of ecosystem service interactions and their social-ecological drivers: Implications for spatial planning and management. Resour. Conserv. Recycl. 2023, 189, 106767. [Google Scholar] [CrossRef]
- Wang, J.; Xu, C. Geodetector: Principle and prospective. Acta Geogr. Sin. 2017, 72, 116–134. [Google Scholar] [CrossRef]
- Wang, J.-F.; Zhang, T.-L.; Fu, B.-J. A measure of spatial stratified heterogeneity. Ecol. Indic. 2016, 67, 250–256. [Google Scholar] [CrossRef]
- Bai, X.; Shi, P.; Liu, Y. Society: Realizing China’s urban dream. Nature 2014, 509, 158–160. [Google Scholar] [CrossRef] [PubMed]
- Peng, J.; Shen, H.; Wu, W.; Liu, Y.; Wang, Y. Net primary productivity (NPP) dynamics and associated urbanization driving forces in metropolitan areas: A case study in Beijing City, China. Landsc. Ecol. 2016, 31, 1077–1092. [Google Scholar] [CrossRef]
- Ouyang, X.; Tang, L.; Wei, X.; Li, Y. Spatial interaction between urbanization and ecosystem services in Chinese urban agglomerations. Land Use Policy 2021, 109, 105587. [Google Scholar] [CrossRef]
- Reheman Rukeya, K.A.; Halmurat, A.; Duolat, X.; Xu, J. Research on the Temporal and Spatial Evolution of Habitat Quality in Urban Agglomeration on the Northern Slope of Tianshan Mountains Based on InVEST Model. J. Ecol. Rural. Environ. 2022, 38, 1112–1121. [Google Scholar] [CrossRef]
- Zeng-yun, Z.; Kasimu, A. Spatial-temporal evolution of habitat quality in Yili Valley based on geographical detector and its influencing factors. Chin. J. Ecol. 2020, 39, 3408–3420. [Google Scholar] [CrossRef]
- Tang, J.; Zhou, L.; Dang, X.; Hu, F.; Yuan, B.; Yuan, Z.; Wei, L. Impacts and predictions of urban expansion on habitat quality in the densely populated areas: A case study of the Yellow River Basin, China. Ecol. Indic. 2023, 151, 110320. [Google Scholar] [CrossRef]
- Pan, Y.; Birdsey, R.A.; Fang, J.; Houghton, R.; Kauppi, P.E.; Kurz, W.A.; Phillips, O.L.; Shvidenko, A.; Lewis, S.L.; Canadell, J.G.; et al. A Large and Persistent Carbon Sink in the World’s Forests. Science 2011, 333, 988–993. [Google Scholar] [CrossRef]


| Ecosystem Service | Description | Methodology | Abbreviation |
|---|---|---|---|
| Soil conservation [38] | Soil conservation capacity of ecosystems | Sediment retention model of InVEST | SC |
| Water yield [39,40] | The yield of annual water | Water yield model of InVEST | WY |
| Habitat quality [41] | Measuring the rank of biodiversity under ecosystem services | Habitat quality model of InVEST | HQ |
| Carbon storage [42] | Carbon storage in ecosystems | Carbon storage and sequestration of InVEST | CS |
| Carbon sequestration and oxygen production [43] | Oxygen production capacity of ecosystems | Photosynthesis equation | CSOP |
| Food production [44,45] | Production of major food crops | Linear relationship between grain output and NDVI | FP |
| SC | WY | CS | HQ | CSOP | FP | |
|---|---|---|---|---|---|---|
| DEM | 0.29227093 | 0.09805016 | 0.30521217 | 0.16274507 | 0.03629018 | 0.25955970 |
| FVC | 0.11420168 | 0.20083537 | 0.10395276 | 0.38963397 | 0.31083433 | 0.09009719 |
| GP | 0.38886371 | 0.34621870 | 0.11161103 | 0.28184590 | 0.17174145 | 0.10766714 |
| CUP | 0.20728609 | 0.03905918 | 0.28282993 | 0.43934529 | 0.07684186 | 0.25121471 |
| FP | 0.17997718 | 0.36477716 | 0.10283935 | 0.22964929 | 0.19541321 | 0.07579300 |
| Precipitation | 0.32343631 | 0.78952211 | 0.03339138 | 0.15918269 | 0.35250877 | 0.05520211 |
| Temperature | 0.60696058 | 0.38043973 | 0.36547877 | 0.21161995 | 0.09277204 | 0.35984316 |
| Evaporation | 0.51831635 | 0.56665973 | 0.16431279 | 0.17129962 | 0.14807312 | 0.16392041 |
| CLP | 0.16854432 | 0.06561134 | 0.49980733 | 0.37356051 | 0.03295991 | 0.42997689 |
| GDP | 0.17806914 | 0.04164061 | 0.46716935 | 0.44373716 | 0.03002953 | 0.38099433 |
| POP | 0.21310473 | 0.06412670 | 0.42374081 | 0.47789360 | 0.06145802 | 0.40439412 |
| RES | 0.06549166 | 0.02550635 | 0.23813468 | 0.02312526 | 0.06067181 | 0.21536051 |
| TF | 0.12750583 | 0.07104539 | 0.46016631 | 0.34070411 | 0.03854383 | 0.44465324 |
| LS | 0.12271040 | 0.0692059 | 0.42371470 | 0.36571853 | 0.07013113 | 0.3975418 |
| MC | 0.12406081 | 0.0202449 | 0.41971044 | 0.39918103 | 0.04997951 | 0.38226244 |
Disclaimer/Publisher’s Note: The statements, opinions and data contained in all publications are solely those of the individual author(s) and contributor(s) and not of MDPI and/or the editor(s). MDPI and/or the editor(s) disclaim responsibility for any injury to people or property resulting from any ideas, methods, instructions or products referred to in the content. |
© 2024 by the authors. Licensee MDPI, Basel, Switzerland. This article is an open access article distributed under the terms and conditions of the Creative Commons Attribution (CC BY) license (https://creativecommons.org/licenses/by/4.0/).
Share and Cite
Qiu, Z.; Guan, Y.; Zhou, K.; Kou, Y.; Zhou, X.; Zhang, Q. Spatiotemporal Analysis of the Interactions between Ecosystem Services in Arid Areas and Their Responses to Urbanization and Various Driving Factors. Remote Sens. 2024, 16, 520. https://doi.org/10.3390/rs16030520
Qiu Z, Guan Y, Zhou K, Kou Y, Zhou X, Zhang Q. Spatiotemporal Analysis of the Interactions between Ecosystem Services in Arid Areas and Their Responses to Urbanization and Various Driving Factors. Remote Sensing. 2024; 16(3):520. https://doi.org/10.3390/rs16030520
Chicago/Turabian StyleQiu, Ziyun, Yunlan Guan, Kefa Zhou, Yanfei Kou, Xiaozhen Zhou, and Qing Zhang. 2024. "Spatiotemporal Analysis of the Interactions between Ecosystem Services in Arid Areas and Their Responses to Urbanization and Various Driving Factors" Remote Sensing 16, no. 3: 520. https://doi.org/10.3390/rs16030520