Article

Refining ICESAT-2 ATL13 Altimetry Data for Improving Water Surface Elevation Accuracy on Rivers

1
Commonwealth Scientific and Industrial Research Organisation (CSIRO) Environment, Canberra, ACT 2601, Australia
2
College of Urban and Environmental Sciences, Northwest University, Xi’an 710127, China
3
Commonwealth Scientific and Industrial Research Organisation (CSIRO) Environment, Brisbane, QLD 4102, Australia
*
Author to whom correspondence should be addressed.
Remote Sens. 2024, 16(10), 1706; https://doi.org/10.3390/rs16101706
Submission received: 2 February 2024 / Revised: 1 May 2024 / Accepted: 7 May 2024 / Published: 11 May 2024

Abstract

:
The application of ICESAT-2 altimetry data in river hydrology critically depends on the accuracy of the mean water surface elevation (WSE) at a virtual station (VS) where satellite observations intersect solely with water. It is acknowledged that the ATL13 product has noise elevations of the adjacent land, resulting in biased high mean WSEs at VSs. Earlier studies have relied on human intervention or water masks to resolve this. Both approaches are unsatisfactory solutions for large river basins where the issue becomes pronounced due to many tributaries and meanders. There is no automated procedure to partition the truly representative water height from the totality of the along-track ICESAT-2 photon segments (portions of photon points along a beam) for increasing precision of the mean WSE at VSs. We have developed an automated approach called “auto-segmentation”. The accuracy of our method was assessed by comparing the ATL13-derived WSEs with direct water level observations at 10 different gauging stations on 37 different dates along the Lower Murray River, Australia. The concordance between the two datasets is significantly high and without detectable bias. In addition, we evaluated the effects of four methods for calculating the mean WSEs at VSs after auto-segmentation processing. Our results reveal that all methods perform almost equally well, with the same R2 value (0.998) and only subtle variations in RMSE (0.181–0.189 m) and MAE (0.130–0.142 m). We also found that the R2, RMSE and MAE are better under the high flow condition (0.999, 0.124 and 0.111 m) than those under the normal-low flow condition (0.997, 0.208 and 0.160 m). Overall, our auto-segmentation method is an effective and efficient approach for deriving accurate mean WSEs at river VSs. It will contribute to the improvement of ICESAT-2 ATL13 altimetry data utility on rivers.

1. Introduction

Satellite altimetry is one of the most powerful measurement techniques for solving the major challenges in river hydraulic characterisation, such as water depth, channel bathymetry, flow velocity and discharge [1,2,3,4,5]. It can be used to measure water surface elevation (WSE) directly by calculating the time it takes for the emitted signal to travel to the ground and back to the satellite sensor [6]. Overall, it provides an enhanced spatio-temporal coverage, reducing the time and cost of data collection compared to traditional in situ measurements.
Satellite altimetry sensors operate in visible and infrared wavelengths (LiDAR altimeters) or at radar wavelengths (radar altimeters). Radar sensors include ALtiKa on the SARAL satellite [7], Poseidon-3 on Jason-2 [8], Poseidon-3B on Jason-3 [9,10] and RA-2 on ENVISAT [11,12]. The more advanced radar altimeters include Synthetic Aperture Radar (SAR) techniques such as the SAR Interferometric Radar Altimeter (SIRAL) sensor on the CryoSat-2 satellite [13,14], the Synthetic Aperture Radar Altimeter (SRAL) instrument on Sentinel-3 [15,16] and Poseidon-4 on Sentinel-6 [17,18]. All these radar sensors have a relatively high temporal resolution but low spatial resolution, although the recently launched Surface Water and Ocean Topography (SWOT) instrument, with a spatial resolution of 50 m, may prove useful once data become available. LiDAR sensors which are still in operation include ICESAT-2 (Ice, Cloud and Land Elevation Satellite 2; [19]) and GEDI (Global Ecosystem Dynamics Investigation; [20]). Both have a relatively high spatial resolution but low temporal resolution. The footprint of a LiDAR altimeter is significantly smaller, typically tens of metres, compared to a radar altimeter, of the order of ~300 m in the along-track direction for SAR altimeters to tens of kilometres for the standard radar altimeters. This allows its along-track separation of unique data points to be much closer. Thus, the LiDAR altimeter can detect steep changes in the surface elevation with higher accuracy than a radar altimeter. It offers a great potential to regional river hydraulic and hydrological studies.
Originally designed for snow and ice monitoring, the spaceborne ICESAT−2 [21] carrying a LiDAR sensor named the Advanced Topographic Laser Altimeter System (ATLAS) was launched by NASA (National Aeronautics and Space Administration) in 2018. In contrast to the radar sensors, ICESAT-2 has a 91-day repeat cycle, but a much better spatial coverage with denser tracks and much finer spatial resolutions. Its ground track observations consist of three pairs of strong and weak LiDAR beams (90 m pair spacing) with a high spatial sampling density along the track (70 cm interval). The footprint is approximately 17 m in diameter. Thus, ICESAT-2 has a much finer spatial resolution than radar altimeters. This advance makes it feasible to measure the WSE on rivers with a higher degree of accuracy [22,23].
ATL13 (Jasinski et al., 2020) is one of the Level 3a ICESAT-2 data products. It provides regular measurements (footprints intersecting with inland water bodies, or for each transacted water body) of water height (same as WSE) at a river cross-section called a virtual station (VS). It has been successfully applied to many inland water studies [24,25,26]. Dandabathula and Rao (2020) [27] validated the ATL13 data product with 46 observations made with near real-time gauged data for 15 reservoirs/water bodies. Their results indicated that the heights of surface water level, computed from strong and weak beams, had a relative variation of 0.05 to 0.10 m. Xiang et al. (2021) [28] found that ICESAT-2 satellite observations were of high accuracy when compared to measurements over the Great Lakes and in the Mississippi River. The root mean squared error (RMSE) of water level retrievals averaged 0.06 m and 0.12 m on the lakes and river, respectively. Coppo Frias et al. (2023) [29] conducted river hydraulic modelling with ICESAT-2 for water surface elevation. They achieved better results (RMSE of 0.41 m at a reduced computational cost) than full 1D hydrodynamic models. Frappart et al. (2021) [30] demonstrated a strong potential of ICESAT-2 for water level monitoring after evaluating its performance on Swiss lakes. They obtained good results with an RMSE lower than 0.06 m and R higher than 0.95 when compared to in situ water levels. An almost constant bias (0.42 ± 0.03 m) was also found. In general, ATL13 data validation and applications are notably more successful on lakes/reservoirs with wide water surfaces, rather than rivers where relatively narrow widths exacerbate the existing issues. These issues are presented as data noises generated from producing the ATL13 product.
ATL13 reports inland water heights processed as segments. Each segment contains a minimum of approximately 100 signal photons to ensure the accurate characterization of the water surface. As such, the segments vary in length from approximately 30 m to 200 m (averaging about 100 m). Sometimes, there is a possibility that a few land photons at the edge of the water body may be incorrectly included in a segment as water photons, thereby contributing to a larger (and erroneous) mean WSE at a VS. The false inclusion leads to larger errors of mean WSEs of VSs on rivers than on (wider) lakes/reservoirs where the inclusion of fewer land values has a smaller effect. These uncertainties have been identified by the data provider as known issues, arising from inconsistent water masks, and inclusion of the land area adjacent to water bodies (https://nsidc.org/sites/default/files/icesat2_atl13_known_issues_v003_aug2020.pdf, accessed on 1 October 2023). The inclusion of this noise in the dataset could hamper the accurate application of ATL13 data, i.e., the calculation of mean WSEs at VSs, on rivers.
The ATL13 product does not include a flag indicating the likelihood of a body edge segment (or photon) being water (true) or land (false). There seems no way to know a priori if all photons at a VS are totally on the river or not. Thus, there is a need to select only the water-representative photons at each VS. This procedure can be implemented through properly splitting photon segments along a beam based on the fact that all photons are associated with a segment ID (a seven-digit number identifying the along-track geolocation segment number a photon belongs to). We name this separation processing “segmentation”. The process seems straightforward but can be imperfect in the case of multiple VS distributions close to each other along a single beam, such as the adjacent water channels in the special case of river meanders. Previous studies, especially those on lakes/reservoirs, either used visual selection based on the WSE relative to a segment more included inside the water body, or applied a water mask to exclude segments outside the water body [31,32,33]. The segmentation processing of rivers is more difficult mainly for two reasons. Firstly, the river mask/buffer is often unavailable or imprecise. In areas of braided or high-density river channels, it often includes adjacent or cross low-lying flat land areas to accommodate low and high conditions. Thus, it unavoidably yields processed heights outside of the actual extent of the water body on the sides of a river, especially during low flow. Secondly, it is too time-consuming to manually split VSs in large river basins, or regionally or globally, where there are many rivers with lots of tributaries and meanders. Consequently, the calculation of correct mean WSE values at VSs on such rivers remains compromised. There is a lack of a rigorous and automatic approach to the derivation of a single mean WSE value with reduced uncertainty at a VS.
Therefore, the aim of this study is to achieve improvements in the mean WSE accuracy at each VS by removing the inherent errors and systematic bias caused by the inclusion of land outliers from the ATL13 dataset. Our objectives are twofold: Firstly, to develop an automated method for selecting photon points wholly located on the water surface at a VS through effective beam/track segmentation (hereinafter referred to as “auto-segmentation”). Secondly, to explore the effect of different approaches to calculating the mean WSE value at a VS after the auto-segmentation processing. We evaluated the accuracy of automating the mean WSE estimation at selected VSs through a comparison with water level observations from nearby ground gauging stations. These are important steps towards the accurate retrieval of hydraulic parameters, such as river depth, which are often unobserved or unobservable at relevant spatial scales.

2. Study Area and Data
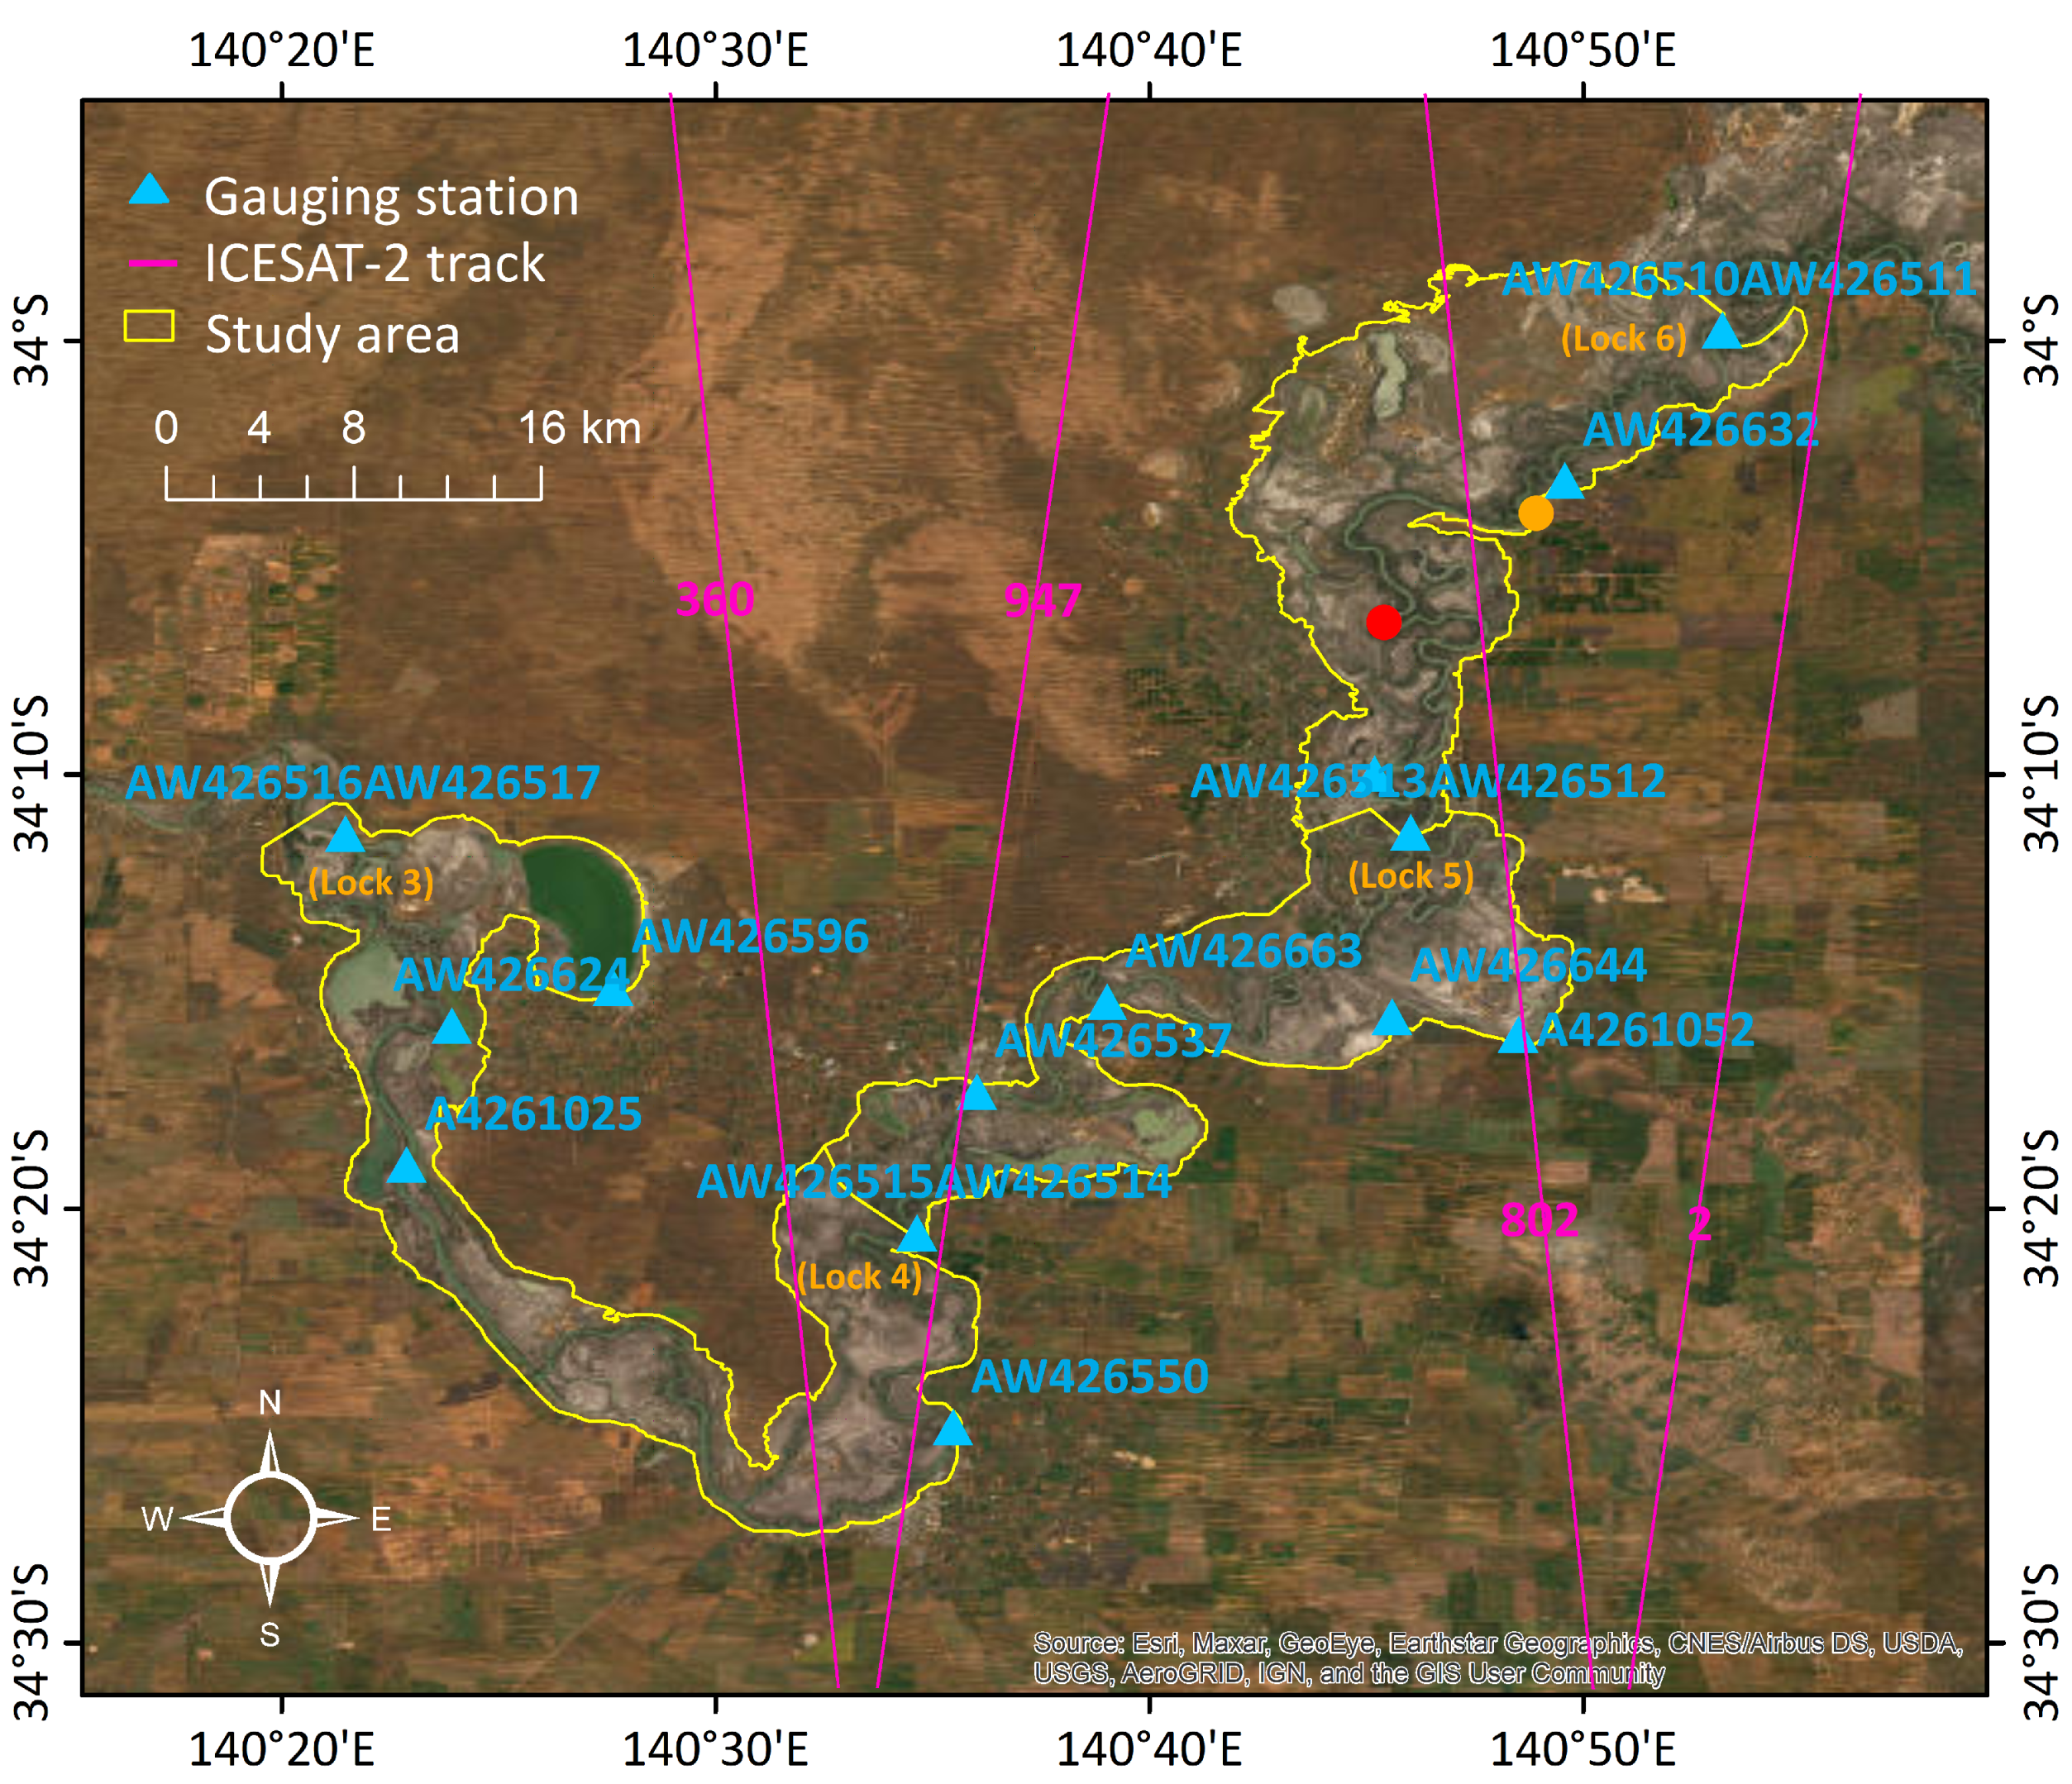
2.1. Study Area

The Murray River is Australia’s longest river (2508 km in length; https://www.ga.gov.au/scientific-topics/national-location-information/landforms/longest-rivers, accessed on 1 October 2023). It begins in the southeastern Alps, drains the western side of the Great Dividing Range, and then meanders northwest across inland plains, forming the border between the states of New South Wales and Victoria. The Murray River finally flows via South Australia (SA) with its mouth in the Southern Ocean. Our focus is on the low-gradient main channel of the Lower Murray River in SA. This part of the river has a complex channel system providing the most challenging test of our proposed method. The river is highly regulated with numerous structures including weirs and locks constructed along the channel. Our study area starts upstream near Weir and Lock No. 6 at Murtho, and ends at Weir and Lock No. 3 at Overland Corner (Figure 1). The river length is approximately 153.2 km, and the catchment area is about 646.5 km2. There is no distinct rainy season, and the mean annual rainfall is very low (about 300 mm/year). High flow generally occurs between August and October. However, stream flow is not representative of local rainfall due to high regulation. There are a total of 14 hydrological gauging stations distributed along this portion of the river. Figure 1 shows the locations of 10 selected stream gauges with water level data coincident with the satellite overpass for comparison.

2.2. Data Sources

Our data came from two sources. ICESAT-2 ATL13 altimetry data were collected from NASA’s OPENALTIMETRY (downloaded from https://openaltimetry.org on 16 September 2023, or https://openaltimetry.earthdatacloud.nasa.gov on 10 October 2023). These WSE datasets were captured from 4 tracks in the study area, covering the period from October 2018 to the present (Figure 1). Each point in the dataset is associated with a WSE value, a segment ID and a quality flag (QF) ranging from 1 to 7. The QF values indicate poor (QF equals 1) to high (QF equals 7) quality. We filtered out those of low quality (QF equals 1, 2 and 3) and kept those of medium to high qualities (QF equals 4, 5, 6 and 7). As a result, 4241 out of 50,158 data points (about 5% of the total) were removed during data preprocessing.
WSE data associated with hydrological gauging stations were available on 37 discrete dates at 10 locations, resulting in good temporal and spatial coverage, as well as representing both high and low flow conditions in the study area. Observed daily mean water level (or storage level) timeseries data at the gauges were acquired from the Australian Government Bureau of Meteorology (downloaded from http://www.bom.gov.au/waterdata on 30 September 2023). All data are reported as orthometric height above the WGS84 ellipsoid in metres.

3. Methods

The methodology has two parts: development of the auto-segmentation method to extract altimetry segments at VSs using Python, and then derivation of the mean WSE at each VS along the Lower Murray River using different methods. A flowchart (Figure 2) details the four steps of the auto-segmentation approach. The performance of this approach was evaluated through a comparison between the derived mean WSEs and the water level observations at 10 hydrological gauging stations and 37 VSs.

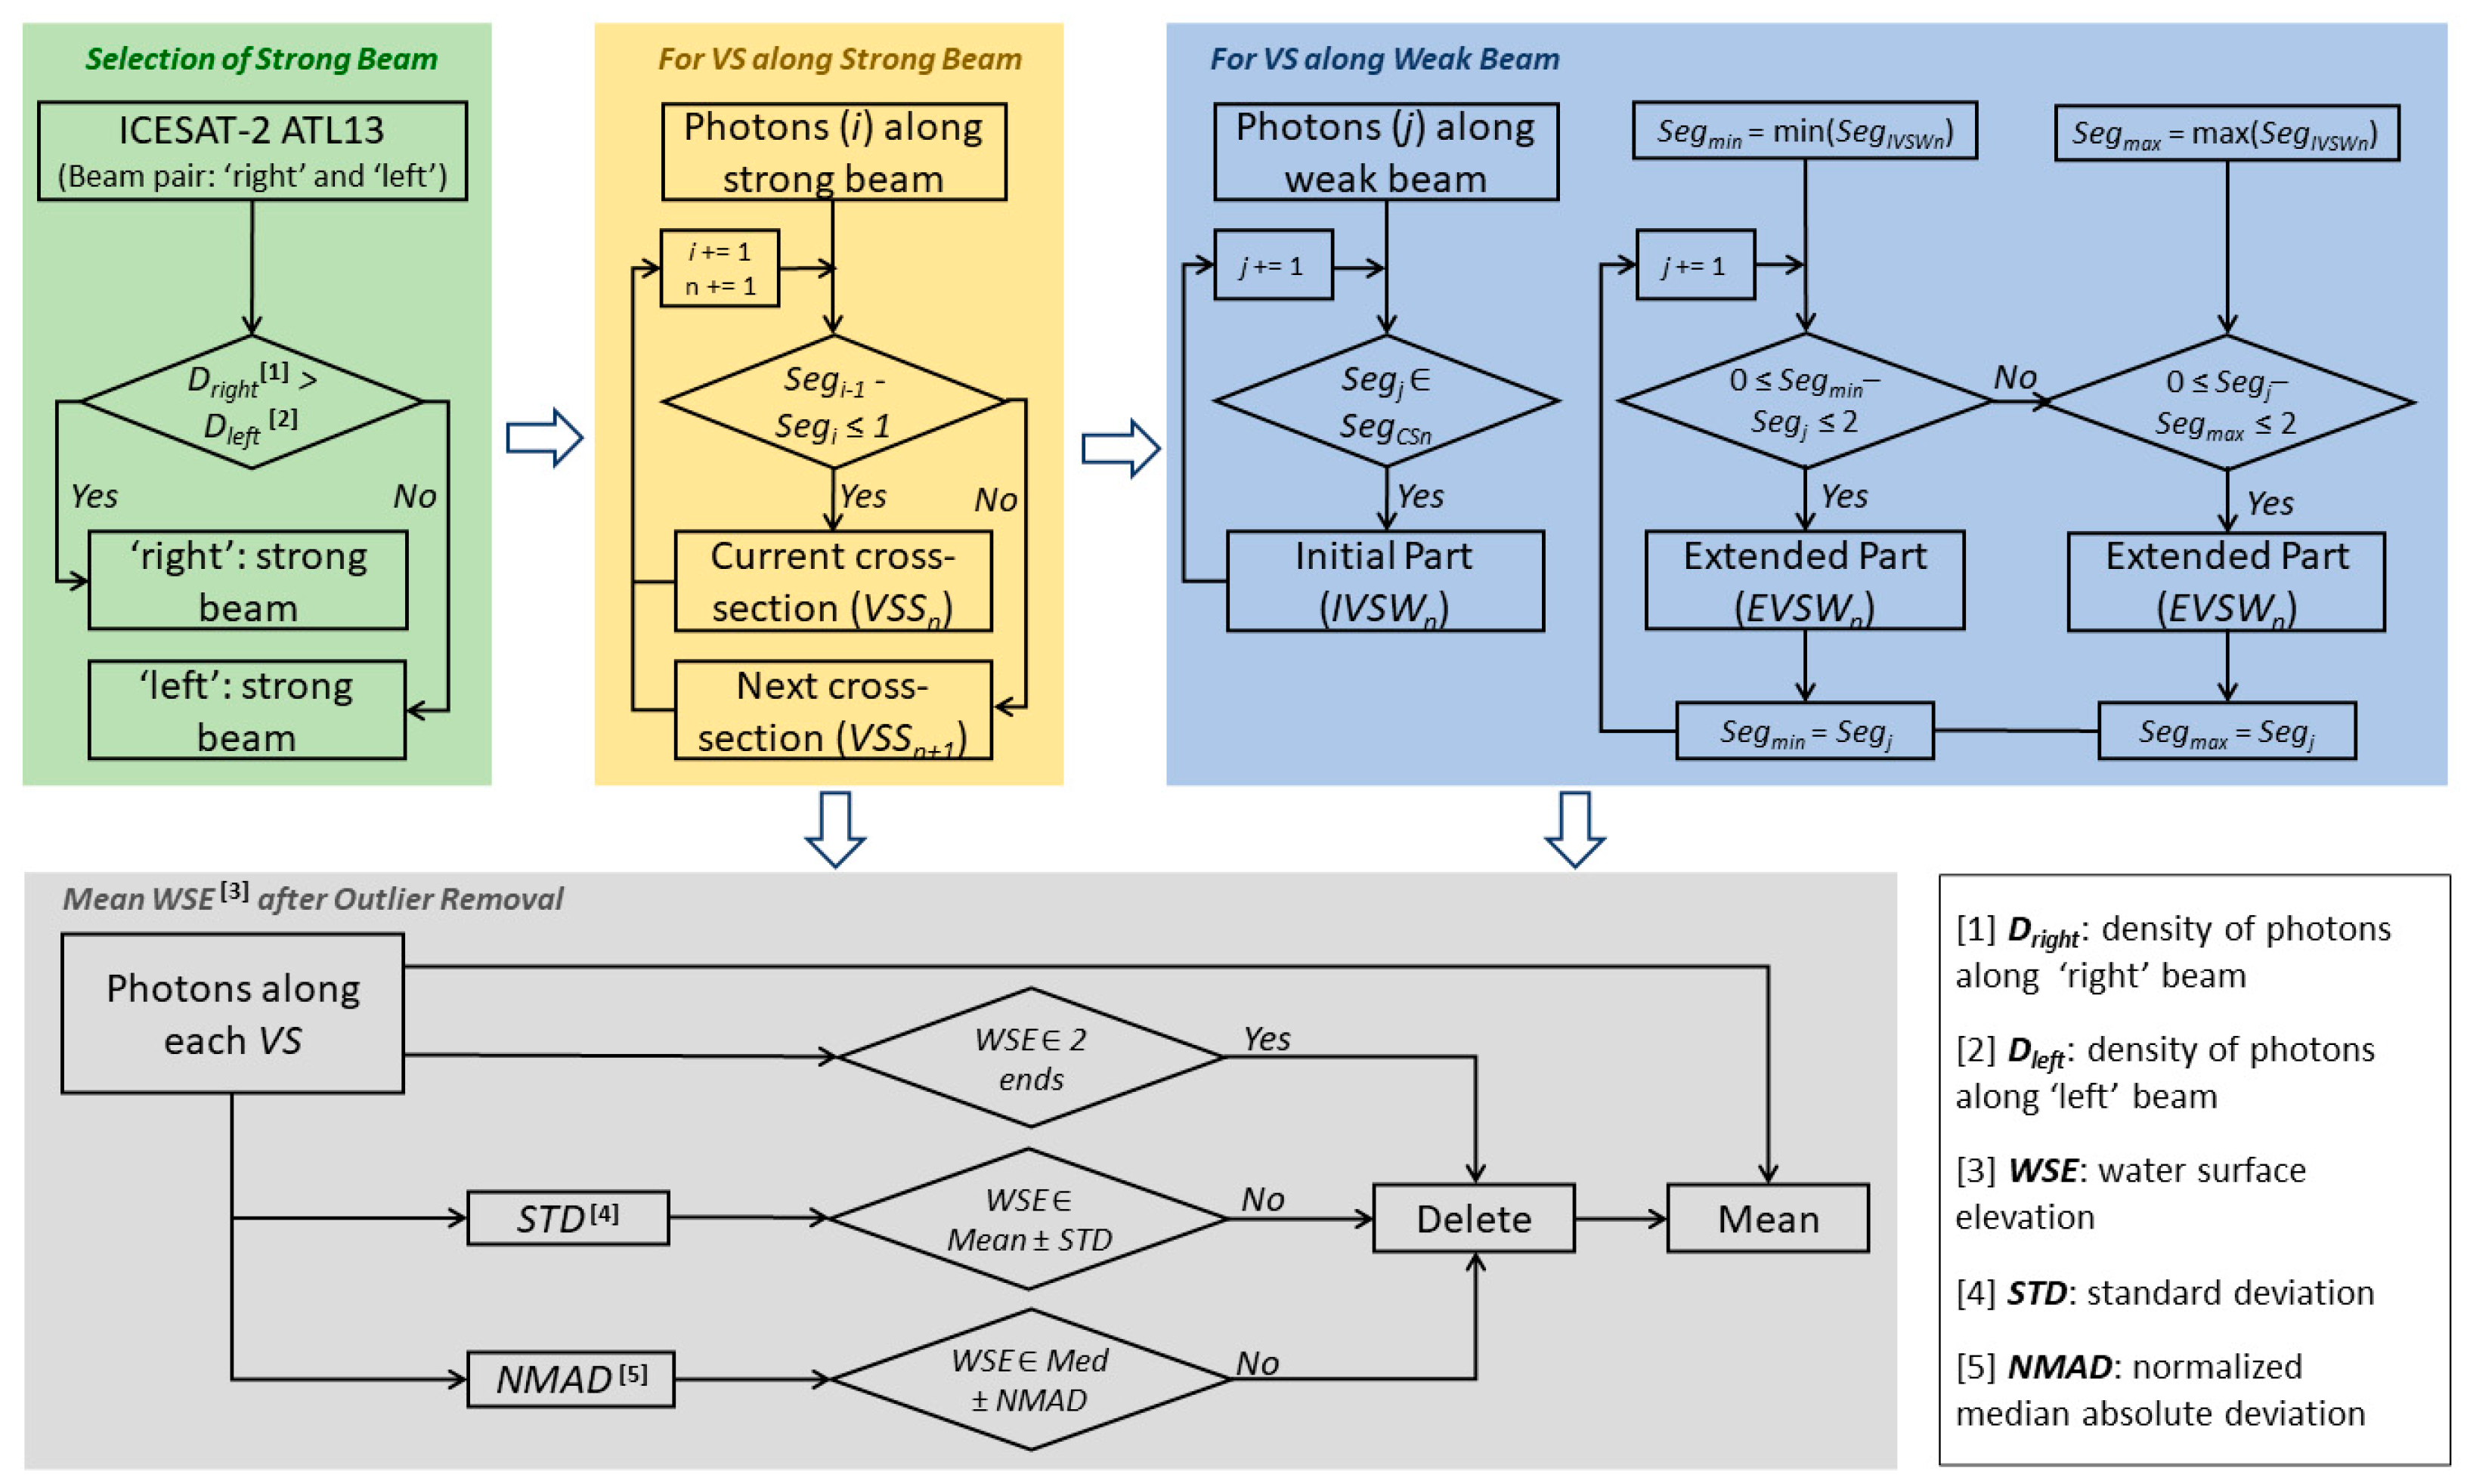
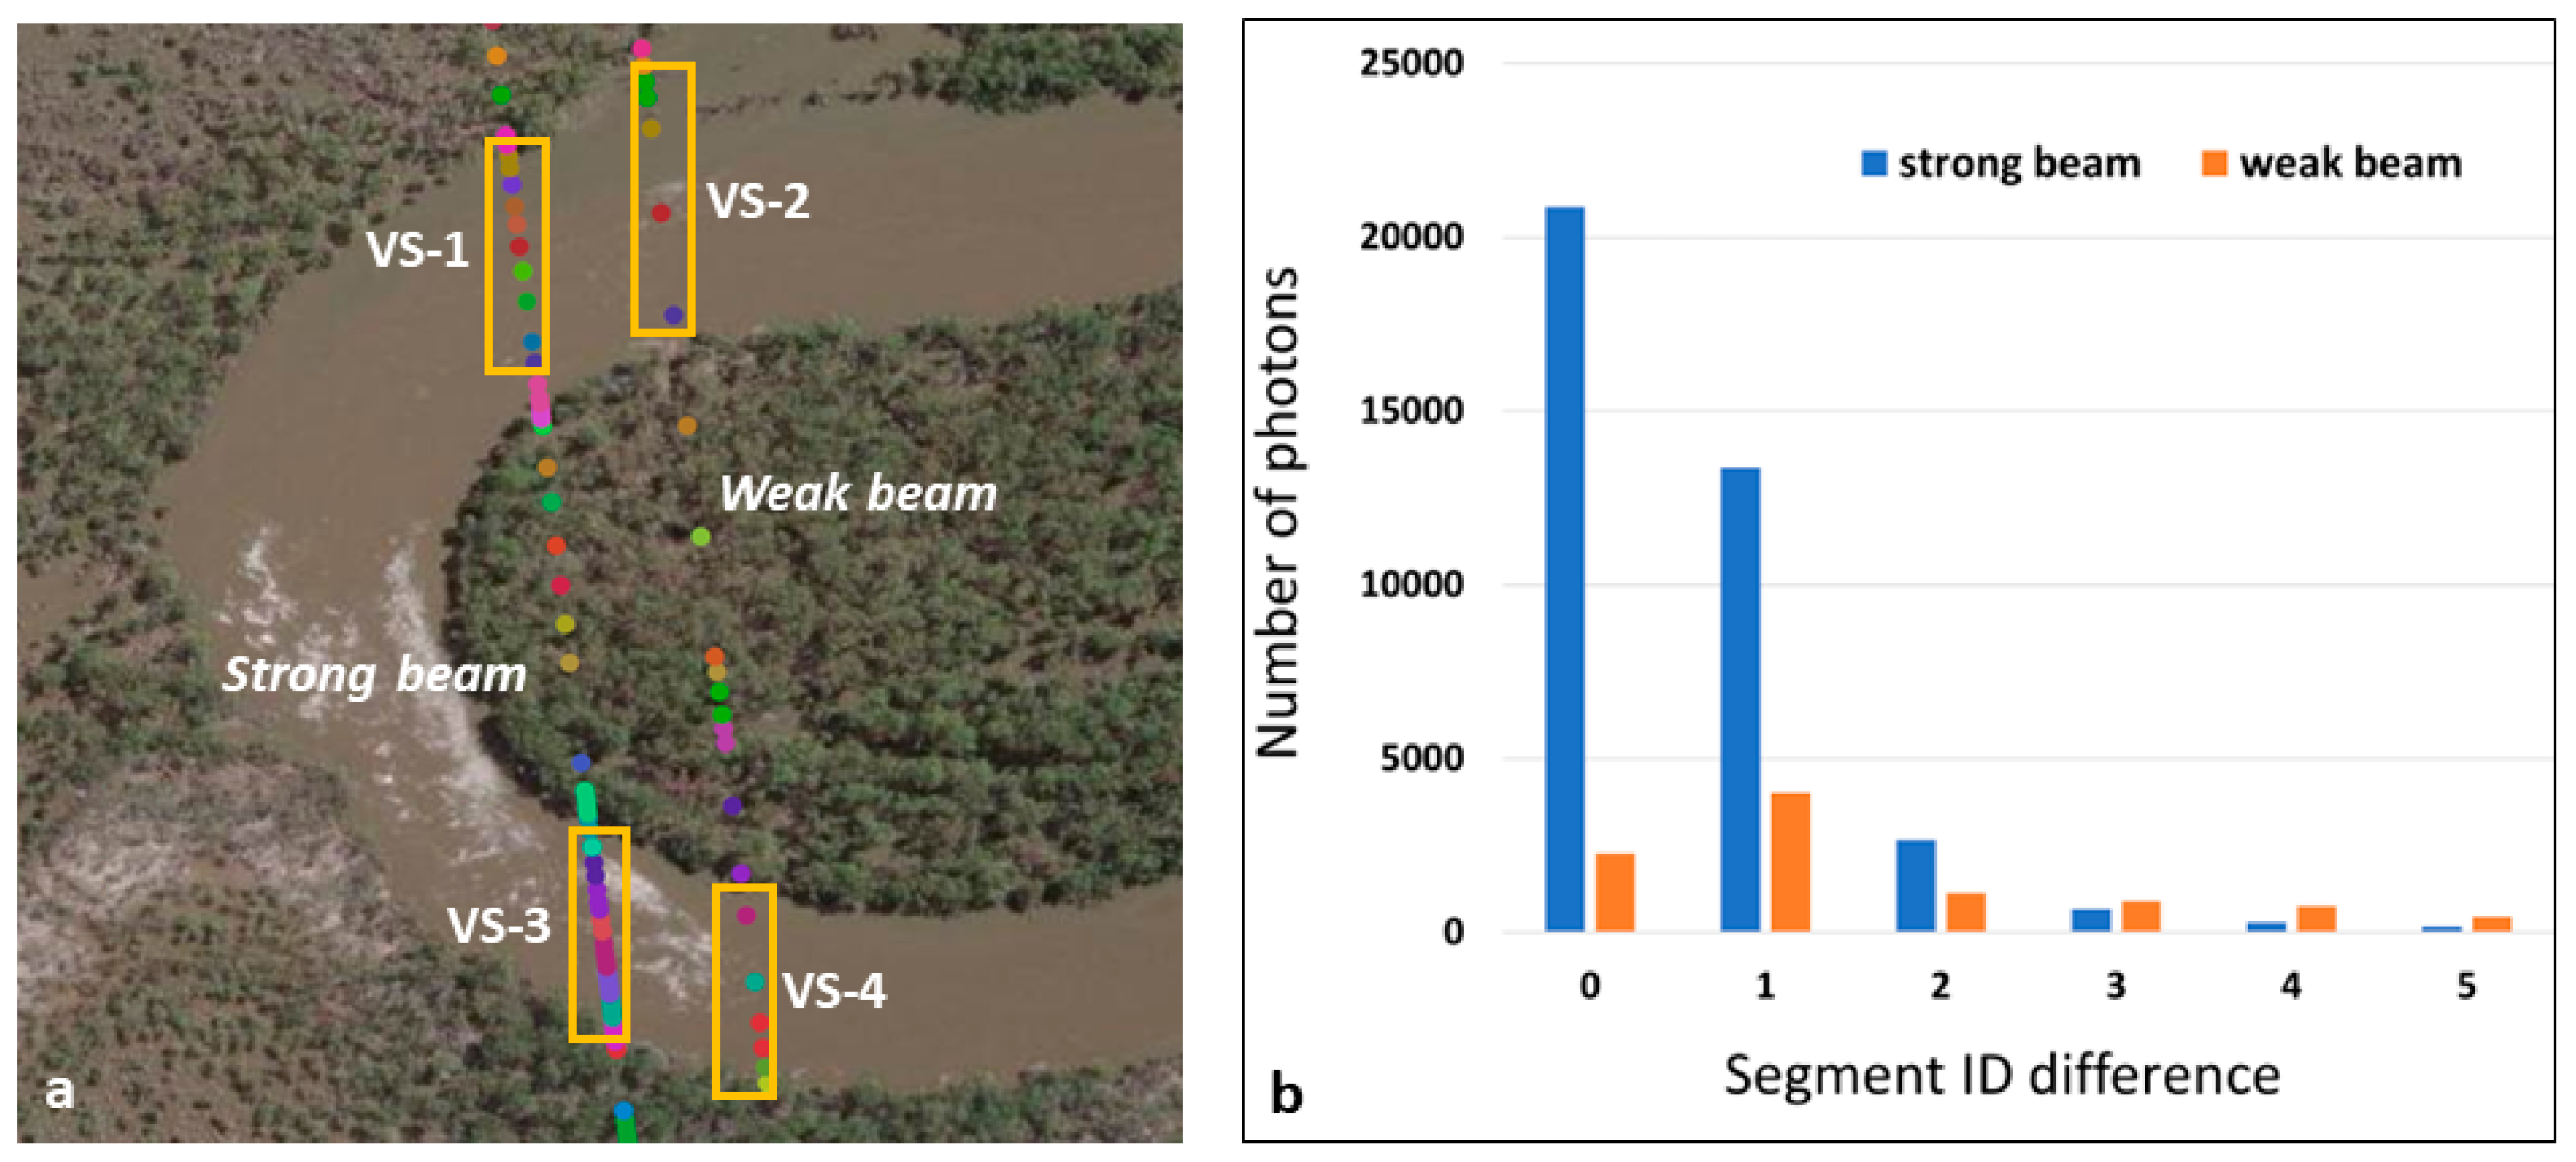
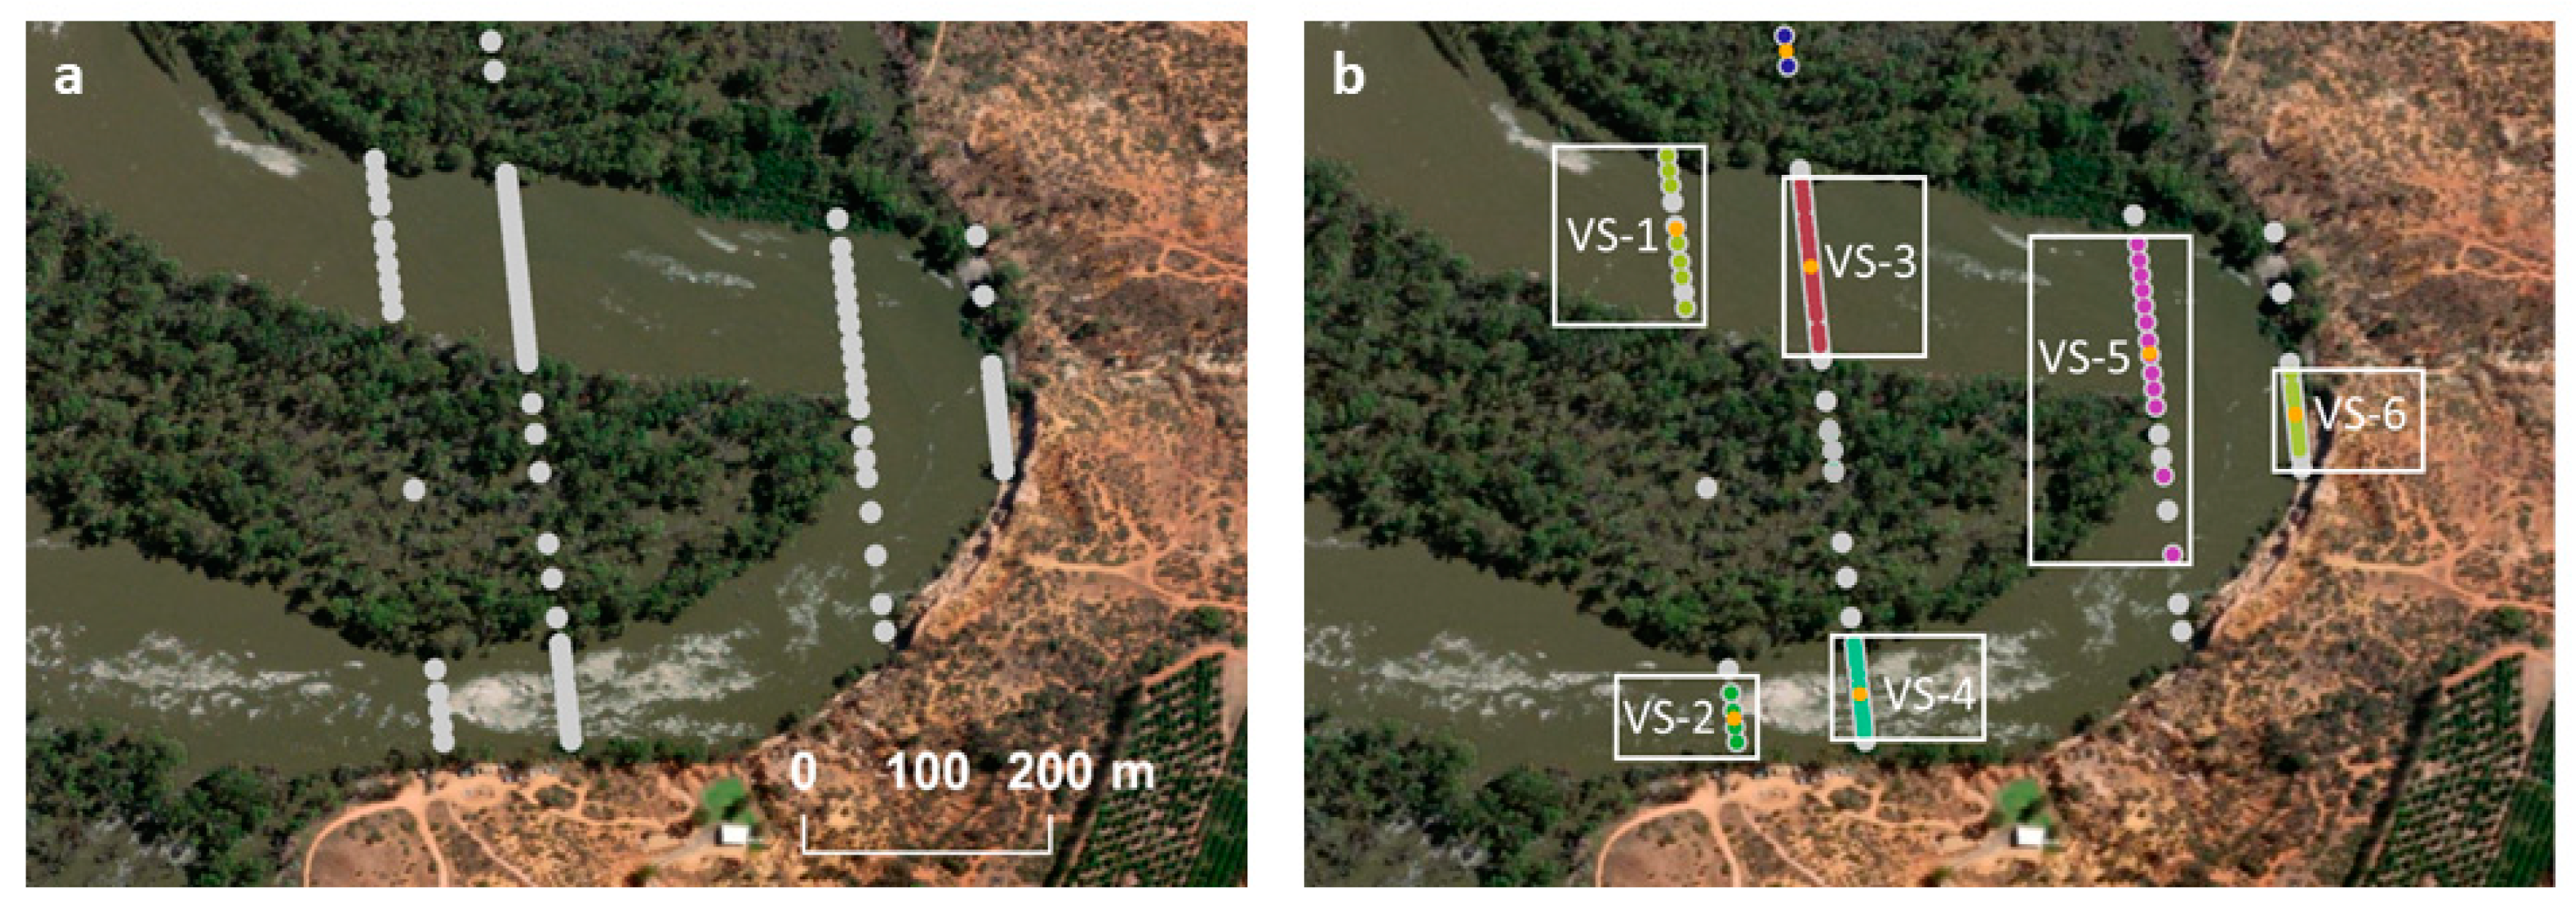
3.1. Development of Auto-Segmentation Approach

The downloaded dataset was broken into segments with non-unique integer IDs for the water/land transition. The ICESAT-2 sensor contains three parallel beam pairs, each with a strong beam and a weak beam (Figure 3a). Both the strong and weak beams consist of segments and share the same IDs. The weak beam has more discontinuities in its segment indexation than the strong beam, while the strong beam always has more segments (fewer gaps in segment indexation) and therefore a higher density of photons than the weak beam [34]. Each segment has multiple photons with the same segment ID. Given that a beam can contain multiple VSs, our key task was to split multiple VSs by defining the beginning and end edges of a VS where only individual beams intersected a contiguous water body. This enabled the extraction of the true representation of water height at that VS. Investigation of the distribution of the non-contiguous segment IDs (Figure 3b) showed that most segment ID differences between adjacent photons were ≤1 for strong beams (about 90%) and ≤2 for weak beams (about 80%). Therefore, we developed an auto-segmentation method reflecting this insight (Figure 4). In the process, we applied the following rules:
(1)
For a VS along the strong beam: segment ID difference between neighbouring photons should be ≤1; otherwise, split.
(2)
For a VS along the weak beam: firstly, keep the photons with the same segment ID as their corresponding VS along its paired strong beam; and secondly, extend them to those photons with a segment ID difference ≤ 2.

3.2. Calculation of Mean WSE

The multiple methods for deriving the mean WSE from ICESAT-2 ATL13 at each VS are listed below. The differences among them lay in using the following:
(1)
All photons at a VS (ALL).
(2)
Photons after removing one segment at each of the two ends of the VS (Two-Ends).
(3)
Photons after removing outliers using STD:
S T D = ( W S E 1 μ ) 2 + + ( W S E N μ ) 2 N
where μ is the mean of all WSE values at a VS, and N represents the number of photons. Photons with a WSE beyond μ ± Std were regarded as outliers and removed.
(4)
Photons after removing outliers using NMAD:
N M A D = C m e d i a n ( [ | W S E 1 m | , , | W S E N m | ] )
where C is a constant determined as 1.4826 [35], and m is the median of all WSE values at a VS. Photons with a WSE beyond m ± NMAD were regarded as outliers and removed.

3.3. Validation of Mean WSE Results at VSs

We evaluated the ICESAT-2 ATL13-derived mean WSE by comparison with the corresponding gauge-observed water level at the time of the satellite overpass. A regression line was obtained by fitting a linear model to correlate the measured mean WSE with observed mean height. The observed mean heights were used as independent variables, and satellite-measured mean heights were used as dependent variables. Metrics for evaluating the regression were the coefficient of determination (R2), RMSE and mean absolute error (MAE).

4. Results and Discussion

4.1. Assessment of Auto-Segmentation Process

A representative example in Figure 5a shows that all grey dots (photons) along a beam on land as well as over water would be included in the calculation of the mean WSE at the VSs (boxes) if auto-segmentation processing was not applied. The resultant mean WSE could involve significant errors because of those dots away from the river channel or water surface. Coloured dots on top of the grey dots (Figure 5b) are the photons selected by the auto-segmentation used to calculate the mean WSE (orange dots) using the NMAD method at each VS.
There are marked (but non-uniform) differences (Figure 6) between the calculated mean WSE values before (grey dots) and after (coloured dots) the auto-segmentation process at selected VSs. The results (Figure 6a) show that the before and after mean WSE values are the same at both VS-1 and VS-5, where the numbers of grey and coloured dots along each track are similar and they are all over water. There are, however, differences between the before and after mean WSE values at VS-2, VS-3, VS-4 and VS-6. These differences arise from the involvement of those extra grey dots (i.e., over land), especially at each end of the VS (Figure 5). In general, the mean standard deviation of the four VSs decreases substantially from 0.35 m (Before) to 0.06 m (After). The significantly lower or smaller values after auto-segmentation indicate that the previously dispersed data (less reliable) are clustered more tightly around the mean (more reliable) than before. Taking VS-4 as an example (Figure 6b), the difference in the mean WSE before (16.751 m) and after (16.500 m) the auto-segmentation at this VS is 25.1 cm due to the inclusion of the outliers at the two ends of the VS. The inferred water surface width (defined by green dots) is 50% narrower than before (defined by grey dots). These further demonstrate that the auto-segmentation process plays an important role in the accurate derivation of the mean WSE at each VS.

4.2. Evaluation of Mean WSE Accuracy

Comparison of the four methods (Table 1 and Figure 7) for the derivation of the ICESAT-2 mean WSE after the auto-segmentation process on 37 dates shows that all methods achieve similar, highly accurate results compared to in situ measurements. The 1:1 regression lines in all plots demonstrate their close agreement, and all the intercepts of zero show the lack of systematic bias in the results. All approaches have the same high R2 value of 0.998. There are slight variations in the accuracy metrics among them: from 0.181 m to 0.189 m for RMSE, and from 0.130 m to 0.142 m for MAE. We can surmise that the four methods have a similar overall outstanding performance. Dandabathula and Rao (2020) calculated the WSEs of 15 reservoirs/water bodies in India from ICESAT-2 using a water mask. The average RMSE of their 46 observations was up to 0.315 m. Li et al. (2023) extracted the WSEs from ICESAT-2 in the Ohio River Basin using a river mask from Sentinel-2, and their RMSE reached 0.350 m. These comparisons further establish the efficiency of our auto-segmentation approach.
The evaluation results of the WSE accuracy calculated using the ALL method for high flow and normal-low flow conditions are presented in Table 2. A streamflow which is greater than the 75th percentile (of river discharge recorded on this day of the year during all years that measurements have been made at the gauge location) is regarded as a high flow. A streamflow which is equal to and less than the 75th percentile is considered a normal-to-low flow. There is no significant variation in R2, which is slightly higher under the high flow than the low flow status. However, there are significant variations in RMSE and MAE. Under the high flow condition, RMSE improved by about 40% and MAE decreased by more than 30% compared to the normal-low flow condition.
Finally, it is noted in this study that the distance between a VS and its nearby streamflow gauge (<1 km) has an unavoidable impact on our validation accuracies due to the surface water slope in between. It was hard to find both at the exact same location within the study area, such that the largest RMSE and MAE in the results came from where the distance is about 1 km between the two in our study.

5. Conclusions

We developed a novel auto-segmentation method for improving the application of ICESAT-2 ATL13 altimetry data on rivers. Our method is effective and efficient in deriving the accurate mean WSE at each VS. It achieves an average R2 of 0.998, RMSE of 0.185 m and MAE of 0.134 m when compared with the measured daily mean water level at 10 gauging stations over 37 dates. Furthermore, the R2 is slightly better, and the MAE and RMSE improve by 30% and 40%, respectively, under the high flow condition in comparison to the normal-low flow condition. The closer agreement (compared to earlier studies in the literature) between the satellite calculated mean WSE and the in situ gauge observed mean water level improves the data utility of ICESAT-2 altimetry data in riverine hydrology.
The four methods (ALL, Two-Ends, STD and NMAD) for calculating the mean WSE after the auto-segmentation all yield similar validation results. This shows that the estimation of the mean WSE at VSs is insensitive to the calculation methods if the VSs are correctly established. The four methods are equally applicable after the adequate split of the photons (or segments) along a beam/track at VSs using our auto-segmentation approach. The findings also further prove that our auto-segmentation method is accurate and robust in producing the mean WSE at river cross-sections.
Future validation may need to be expanded to more gauging stations and flooded areas. Nevertheless, our results here inspire confidence in the direct derivation of the water surface slope along a river profile, and the assimilation of channel bathymetry for accurate flow velocity and discharge estimation. This improves our understanding of the inherent errors and systematic bias introduced while generating ICESAT-2 ATL13 altimetry data. The development will contribute to the better use of satellite altimetry data as inputs to hydrological and ecological modelling in large, complex river basins at regional and global scales.

Author Contributions

Y.C.: Conceptualization, Methodology, Writing—Original draft, Writing—Review & Editing; Q.L.: Methodology, Software, Formal analysis, Validation, Writing—Original draft; C.T.: Methodology, Writing—Review & Editing; C.S.: Formal analysis, Validation, Writing—Review & Editing; F.K.: Validation, Writing—Review & Editing; D.P.: Writing—Review & Editing, Project administration, Funding acquisition; A.S.: Writing—Review & Editing. All authors have read and agreed to the published version of the manuscript.

Funding

This research received no external funding.

Data Availability Statement

Data are contained within the article.

Acknowledgments

This research was funded by CSIRO through its investment in Digital Water and Landscapes. Thanks to Phillip Ford (Honorary Fellow of CSIRO) for reviewing and editing our earlier version of this manuscript.

Conflicts of Interest

The authors declare no conflicts of interest.

References

  1. Brêda, J.P.L.F.; Paiva, R.C.D.; Bravo, J.M.; Passaia, O.A.; Moreira, D.M. Assimilation of Satellite Altimetry Data for Effective River Bathymetry. Water Resour. Res. 2019, 55, 7441–7463. [Google Scholar] [CrossRef]
  2. Jiang, L.; Madsen, H.; Bauer-Gottwein, P. Simultaneous calibration of multiple hydrodynamic model parameters using satellite altimetry observations of water surface elevation in the Songhua River. Remote Sens. Environ. 2019, 225, 229–247. [Google Scholar] [CrossRef]
  3. Shen, Y.; Liu, D.; Jiang, L.; Yin, J.; Nielsen, K.; Bauer-Gottwein, P.; Guo, S.; Wang, J. On the Contribution of Satellite Altimetry-Derived Water Surface Elevation to Hydrodynamic Model Calibration in the Han River. Remote Sens. 2020, 12, 4087. [Google Scholar] [CrossRef]
  4. An, Z.; Chen, P.; Tang, F.; Yang, X.; Wang, R.; Wang, Z. Evaluating the Performance of Seven Ongoing Satellite Altimetry Missions for Measuring Inland Water Levels of the Great Lakes. Sensors 2022, 22, 9718. [Google Scholar] [CrossRef]
  5. Scherer, D.; Schwatke, C.; Dettmering, D.; Seitz, F. ICESat-2 Based River Surface Slope and Its Impact on Water Level Time Series From Satellite Altimetry. Water Resour. Res. 2022, 58, e2022WR032842. [Google Scholar] [CrossRef]
  6. Dhote, P.R.; Agarwal, A.; Singhal, G.; Calmant, S.; Thakur, P.K.; Oubanas, H.; Paris, A.; Singh, R.P. River Water Level and Water Surface Slope Measurement From Spaceborne Radar and LiDAR Altimetry: Evaluation and Implications for Hydrological Studies in the Ganga River. IEEE J. Sel. Top. Appl. Earth Obs. Remote Sens. 2024, 17, 7825–7840. [Google Scholar] [CrossRef]
  7. Verron, J.; Sengenes, P.; Lambin, J.; Noubel, J.; Steunou, N.; Guillot, A.; Picot, N.; Coutin-Faye, S.; Sharma, R.; Gairola, R.M.; et al. The SARAL/AltiKa Altimetry Satellite Mission. Mar. Geod. 2015, 38 (Suppl. 1), 2–21. [Google Scholar] [CrossRef]
  8. Paris, A.; Dias de Paiva, R.; Santos da Silva, J.; Medeiros Moreira, D.; Calmant, S.; Garambois, P.-A.; Collischonn, W.; Bonnet, M.-P.; Seyler, F. Stage-discharge rating curves based on satellite altimetry and modeled discharge in the Amazon basin. Water Resour. Res. 2016, 52, 3787–3814. [Google Scholar] [CrossRef]
  9. Lambin, J.; Morrow, R.; Fu, L.-L.; Willis, J.K.; Bonekamp, H.; Lillibridge, J.; Perbos, J.; Zaouche, G.; Vaze, P.; Bannoura, W.; et al. The OSTM/Jason-2 Mission. Mar. Geod. 2010, 33 (Suppl. 1), 4–25. [Google Scholar] [CrossRef]
  10. Vaze, P.; Neeck, S.P.; Bannoura, W.; Green, J.; Wade, A.; Mignogno, M.; Zaouche, G.; Couderc, V.; Thouvenot, E.; Parisot, F. The Jason-3 Mission: Completing the transition of ocean altimetry from research to operations. SPIE Proc. 2010, 7826, 264–268. [Google Scholar]
  11. Louet, J.; Bruzzi, S. ENVISAT mission and system. In Proceedings of the IEEE 1999 International Geoscience and Remote Sensing Symposium. IGARSS’99 (Cat. No.99CH36293), Hamburg, Germany, 28 June–2 July 1999. [Google Scholar]
  12. Lee, C.-M.; Kuo, C.-Y.; Yang, C.-H.; Kao, H.-C.; Tseng, K.-H.; Lan, W.-H. Assessment of hydrological changes in inland water body using satellite altimetry and Landsat imagery: A case study on Tsengwen Reservoir. J. Hydrol. Reg. Stud. 2022, 44, 101227. [Google Scholar] [CrossRef]
  13. Jiang, L.; Schneider, R.; Andersen, O.B.; Bauer-Gottwein, P. CryoSat-2 Altimetry Applications over Rivers and Lakes. Water 2017, 9, 211. [Google Scholar] [CrossRef]
  14. Kittel CM, M.; Hatchard, S.; Neal, J.C.; Nielsen, K.; Bates, P.D.; Bauer-Gottwein, P. Hydraulic Model Calibration Using CryoSat-2 Observations in the Zambezi Catchment. Water Resour. Res. 2021, 57, e2020WR029261. [Google Scholar] [CrossRef]
  15. Nielsen, K.; Andersen, O.B.; Ranndal, H. Validation of Sentinel-3A Based Lake Level over US and Canada. Remote Sens. 2020, 12, 2835. [Google Scholar] [CrossRef]
  16. Malou, T.; Garambois, P.A.; Paris, A.; Monnier, J.; Larnier, K. Generation and analysis of stage-fall-discharge laws from coupled hydrological-hydraulic river network model integrating sparse multi-satellite data. J. Hydrol. 2021, 603, 126993. [Google Scholar] [CrossRef]
  17. Donlon, C.; Berruti, B.; Mecklenberg, S.; Nieke, J.; Rebhan, H.; Klein, U.; Sciarra, R. The Sentinel-3 Mission: Overview and status. In Proceedings of the 2012 IEEE International Geoscience and Remote Sensing Symposium, Munich, Germany, 22–27 July 2012. [Google Scholar]
  18. Donlon, C.; Cullen, R.; Giulicchi, L.; Fornari, M.; Vuilleumier, P. Copernicus Sentinel-6 Michael Freilich Satellite Mission: Overview and Preliminary in Orbit Results. In Proceedings of the 2021 IEEE International Geoscience and Remote Sensing Symposium IGARSS, Brussels, Belgium, 11–16 July 2021. [Google Scholar]
  19. Markus, T.; Neumann, T.; Martino, A.; Abdalati, W.; Brunt, K.; Csatho, B.; Farrell, S.; Fricker, H.; Gardner, A.; Harding, D.; et al. The Ice, Cloud, and land Elevation Satellite-2 (ICESat-2): Science requirements, concept, and implementation. Remote Sens. Environ. 2017, 190, 260–273. [Google Scholar] [CrossRef]
  20. Fayad, I.; Baghdadi, N.; Bailly, J.S.; Frappart, F.; Zribi, M. Analysis of GEDI Elevation Data Accuracy for Inland Waterbodies Altimetry. Remote Sens. 2020, 12, 2714. [Google Scholar] [CrossRef]
  21. Jasinski, M.; Stoll, J.; Hancock, D.; Robbins, J.; Nattala, J.; Morison, J.; Jones, B.; Ondrusek, M.; Pavelsky, T.; Parrish, C. ATLAS/ICESat-2 L3A Inland Water Surface Height, Version 3; NASA National Snow and Ice Data Center Distributed Active Archive Center: Boulder, CO, USA, 2020; Volume 3. [Google Scholar] [CrossRef]
  22. Li, L.; Fujisaki-Manome, A.; Miller, R.; Titze, D.; Henderson, H. Evaluation of ICESat-2 Significant Wave Height Data with Buoy Observations in the Great Lakes and Application in Examination of Wave Model Predictions. Remote Sens. 2024, 16, 679. [Google Scholar] [CrossRef]
  23. O’Loughlin, F.E.; Neal, J.; Yamazaki, D.; Bates, P.D. ICESat-derived inland water surface spot heights. Water Resour. Res. 2016, 52, 3276–3284. [Google Scholar] [CrossRef]
  24. Xu, N.; Zheng, H.; Ma, Y.; Yang, J.; Liu, X.; Wang, X. Global Estimation and Assessment of Monthly Lake/Reservoir Water Level Changes Using ICESat-2 ATL13 Products. Remote Sens. 2021, 13, 2744. [Google Scholar] [CrossRef]
  25. Narin, O.G.; Abdikan, S. Multi-temporal analysis of inland water level change using ICESat-2 ATL-13 data in lakes and dams. Environ. Sci. Pollut. Res. 2023, 30, 15364–15376. [Google Scholar] [CrossRef] [PubMed]
  26. Zhou, H.; Liu, S.; Mo, X.; Hu, S.; Zhang, L.; Ma, J.; Bandini, F.; Grosen, H.; Bauer-Gottwein, P. Calibrating a hydrodynamic model using water surface elevation determined from ICESat-2 derived cross-section and Sentinel-2 retrieved sub-pixel river width. Remote Sens. Environ. 2023, 298, 113796. [Google Scholar] [CrossRef]
  27. Dandabathula, G.; Rao, S.S. Validation of ICESat-2 surface water level product ATL13 with near real time gauge data. Hydrology 2020, 8, 19–25. [Google Scholar] [CrossRef]
  28. Xiang, J.; Li, H.; Zhao, J.; Cai, X.; Li, P. Inland water level measurement from spaceborne laser altimetry: Validation and comparison of three missions over the Great Lakes and lower Mississippi River. J. Hydrol. 2021, 597, 126312. [Google Scholar] [CrossRef]
  29. Coppo Frias, M.; Liu, S.; Mo, X.; Nielsen, K.; Ranndal, H.; Jiang, L.; Ma, J.; Bauer-Gottwein, P. River hydraulic modeling with ICESat-2 land and water surface elevation. Hydrol. Earth Syst. Sci. 2023, 27, 1011–1032. [Google Scholar] [CrossRef]
  30. Frappart, F.; Blarel, F.; Fayad, I.; Bergé-Nguyen, M.; Crétaux, J.-F.; Shu, S.; Schregenberger, J.; Baghdadi, N. Evaluation of the Performances of Radar and Lidar Altimetry Missions for Water Level Retrievals in Mountainous Environment: The Case of the Swiss Lakes. Remote Sens. 2021, 13, 2196. [Google Scholar] [CrossRef]
  31. Yuan, C.; Gong, P.; Bai, Y. Performance Assessment of ICESat-2 Laser Altimeter Data for Water-Level Measurement over Lakes and Reservoirs in China. Remote Sens. 2020, 12, 770. [Google Scholar] [CrossRef]
  32. Luo, S.; Song, C.; Zhan, P.; Liu, K.; Chen, T.; Li, W.; Ke, L. Refined estimation of lake water level and storage changes on the Tibetan Plateau from ICESat/ICESat-2. CATENA 2021, 200, 105177. [Google Scholar] [CrossRef]
  33. Wang, S.; Cui, D.; Xu, J. Monitoring and Analysis of Water Surface Slope of the Yarlung Zangbo River Based on Remote Sensing. Water 2022, 14, 3304. [Google Scholar] [CrossRef]
  34. Neumann, T.A.; Martino, A.J.; Markus, T.; Bae, S.; Bock, M.R.; Brenner, A.C.; Brunt, K.M.; Cavanaugh, J.; Fernandes, S.T.; Hancock, D.W.; et al. The Ice, Cloud, and Land Elevation Satellite–2 mission: A global geolocated photon product derived from the Advanced Topographic Laser Altimeter System. Remote Sens. Environ. 2019, 233, 111325. [Google Scholar] [CrossRef] [PubMed]
  35. Höhle, J.; Höhle, M. Accuracy assessment of digital elevation models by means of robust statistical methods. ISPRS J. Photogramm. Remote Sens. 2009, 64, 398–406. [Google Scholar] [CrossRef]
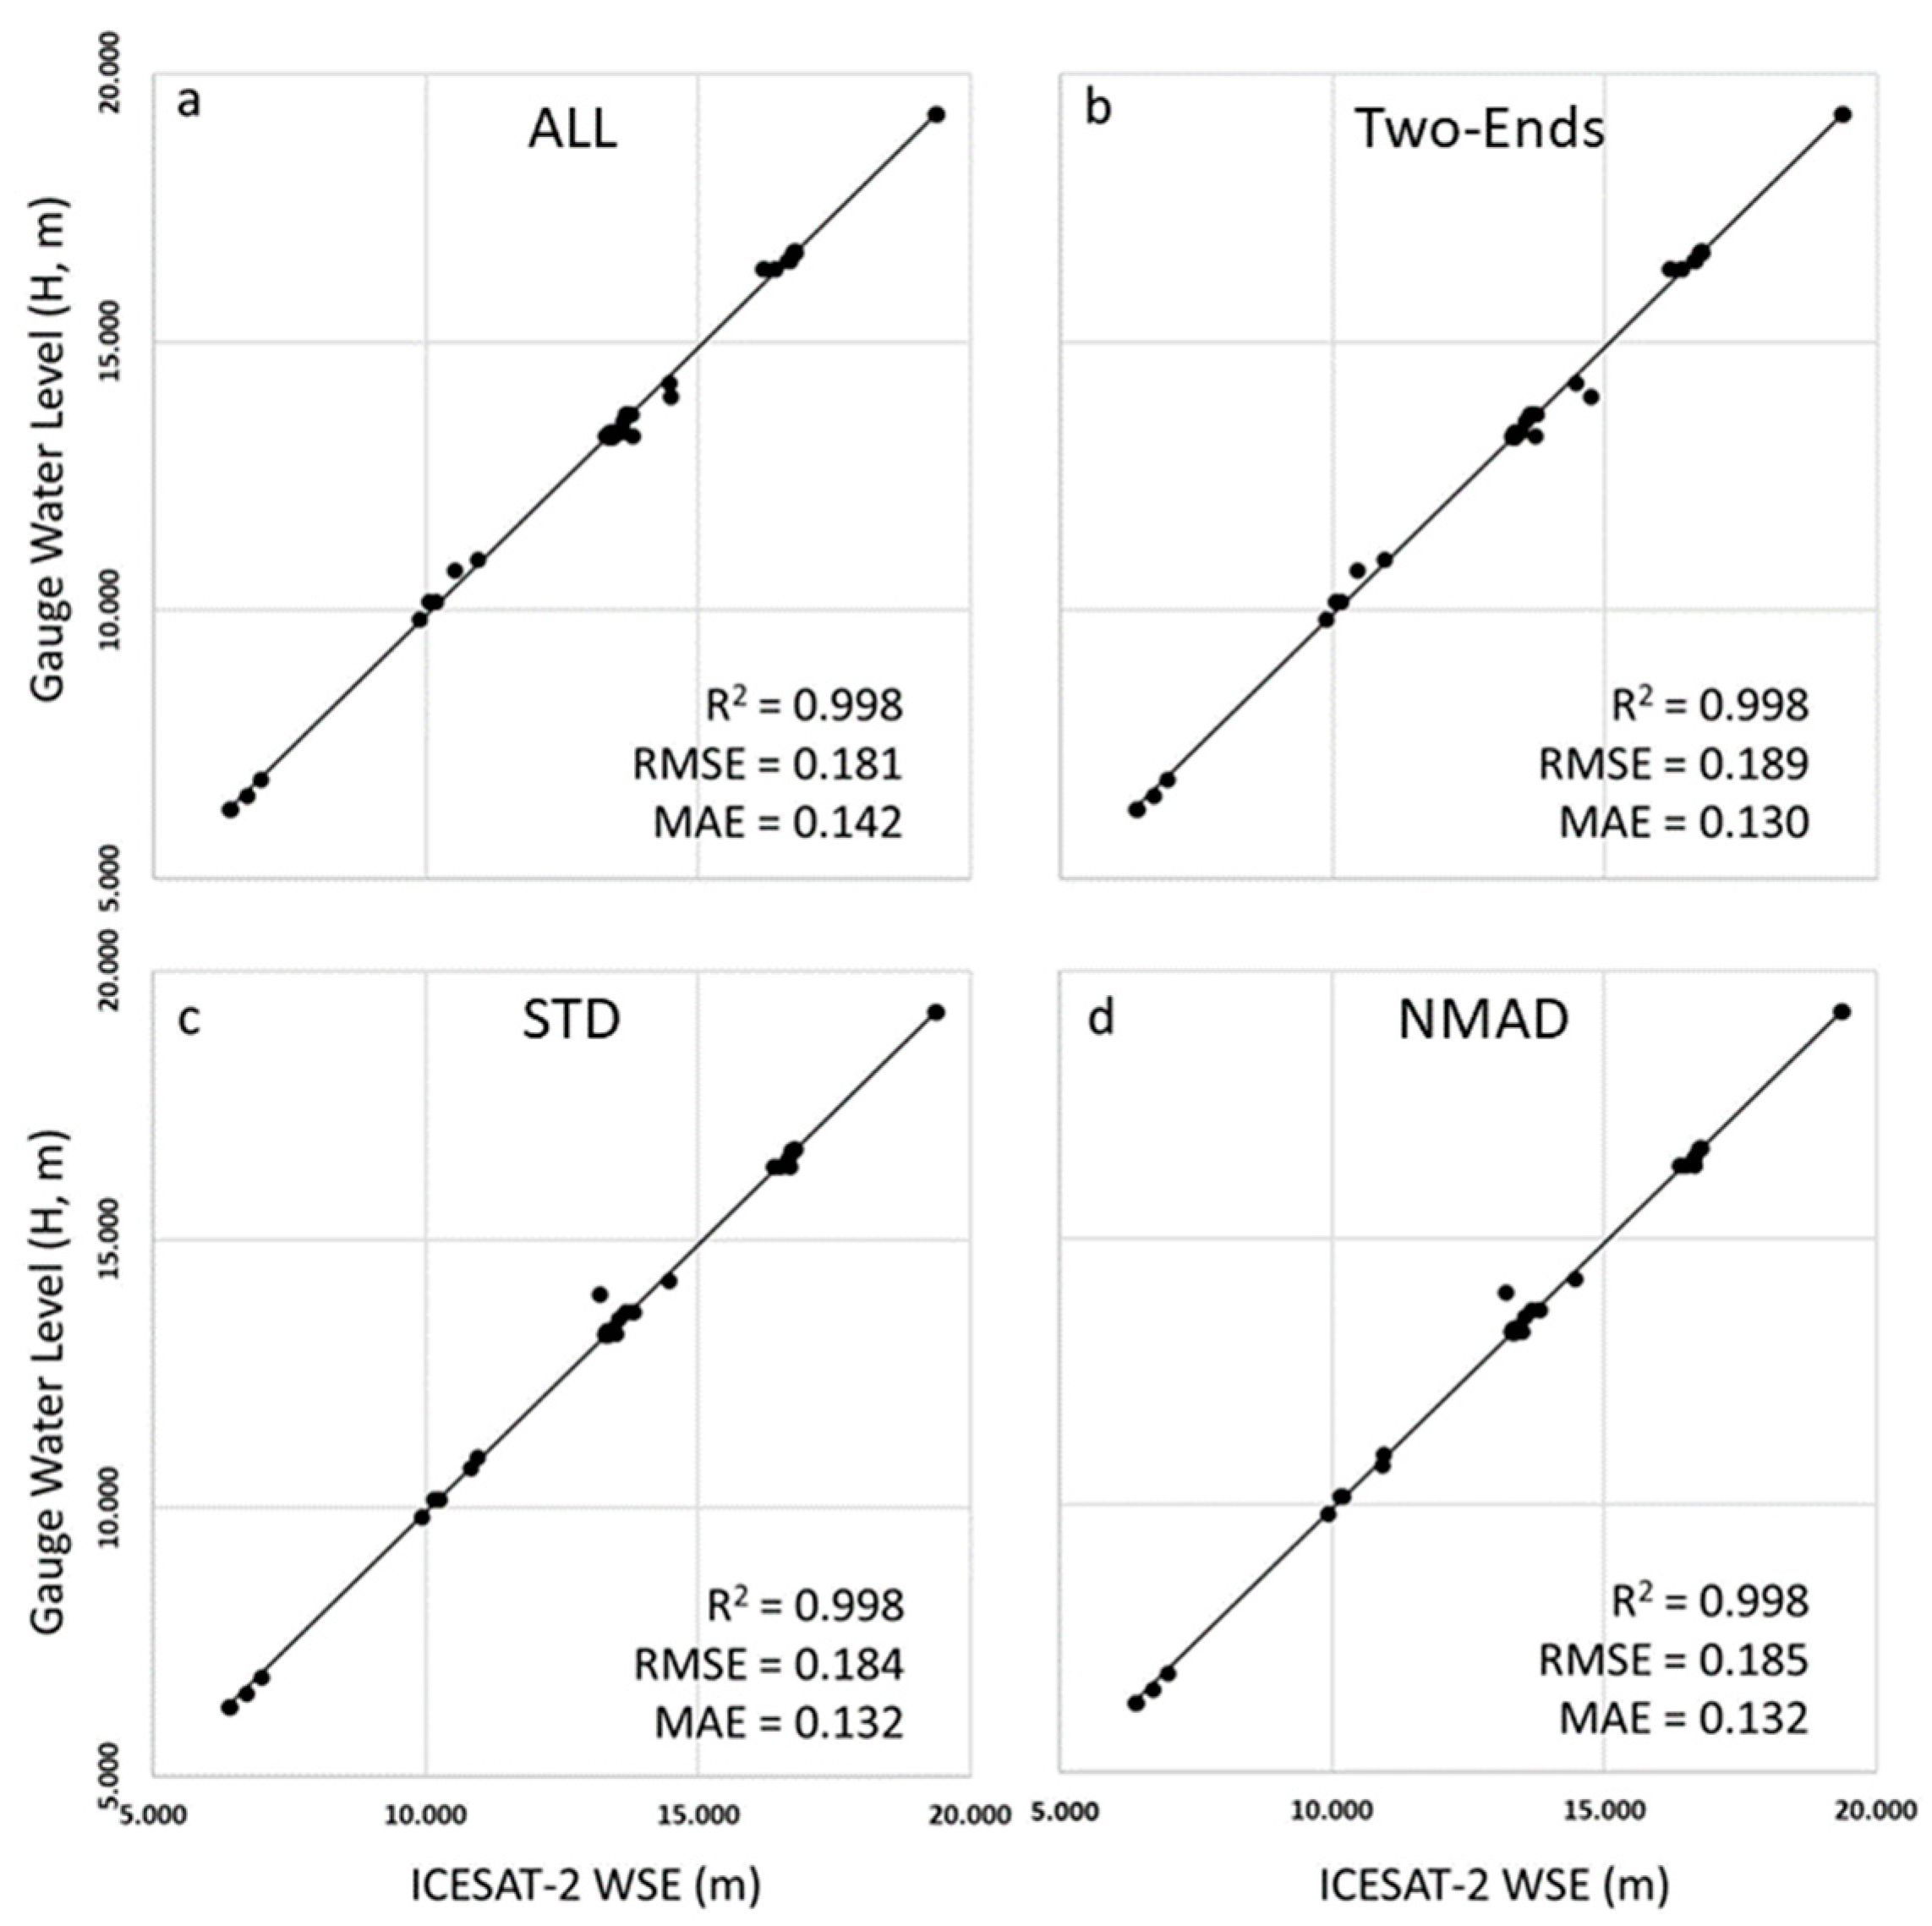
Figure 1. Study area and locations of stream gauges in the Lower Murray River, Australia.
Remotesensing 16 01706 g001
Figure 2. Flowchart of methodology.
Remotesensing 16 01706 g002
Figure 3. (a) Example of segments (different colours) along a pair of beams of a track at the four VSs (located at the red dot in Figure 1). Segments outside yellow boxes are excluded from the mean WSE calculation at each of the four VSs by applying the auto-segmentation method. (b) Density distribution of the segment ID difference between neighbouring photons along strong and weak beams.
Remotesensing 16 01706 g003
Figure 4. Illustration of the auto-segmentation process. Photons are presented as dots. Grey and coloured dots show before and after auto-segmentation, respectively. The number next to each dot is the segment ID of the photon. (a) Pair of beams at the two VSs. (b) The result of applying Rule 1 to the strong beam. (c) The result of applying the first step of Rule 2 to the weak beam. (d) The result of applying the second step of Rule 2 to the weak beam.
Remotesensing 16 01706 g004
Figure 5. Examples of auto-segmentation (location of area is the orange dot in Figure 1): (a) before (grey dots), and (b) after (coloured dots). Orange dots here are the locations of the mean WSE at VSs calculated using the NMAD method after auto-segmentation. Grey dots within the boxes of VS-1 and VS-5 are segment photons with their WSE beyond the value of the median ± NMAD of all photons selected by the auto-segmentation process.
Remotesensing 16 01706 g005
Figure 6. Examples of mean WSE values at selected VSs (in Figure 5) before and after auto-segmentation processing: (a) mean and standard deviation of WSE values at six selected VSs, and (b) mean WSE derivation at VS-4 (blue circle in (a)). Grey dots are segments used to calculate the mean WSE Before (grey dashed line), and green dots are segments used to calculate the mean WSE After (green dashed line).
Remotesensing 16 01706 g006
Figure 7. ICESAT-2-derived mean WSE vs. gauge observed mean water level at 37 VSs from the four methods: (a) ALL, (b) Two-Ends, (c) STD and (d) NMAD. The units for both RMSE and MAE are metres.
Remotesensing 16 01706 g007
Table 1. Comparison between ICESAT-2 ATL13-derived mean WSEs (after auto-segmentation) using each of the four methods and the observed mean water height at all 37 VSs (n = 37).
ALLTwo-EndsSTDNMADAverage
R20.9980.9980.9980.9980.998
RMSE (m)0.1810.1890.1840.1850.185
MAE (m)0.1420.1300.1320.1320.134
Table 2. Comparison between ICESAT-2 ATL13-derived mean WSE using the ALL method (all photons after auto-segmentation) and the observed mean water height at 37 VSs.
Number of ValidationsRMSE
(m)
MAE
(m)
R2
High Flow Condition140.1240.1110.999
Normal–Low Flow Condition230.2080.1600.997
Disclaimer/Publisher’s Note: The statements, opinions and data contained in all publications are solely those of the individual author(s) and contributor(s) and not of MDPI and/or the editor(s). MDPI and/or the editor(s) disclaim responsibility for any injury to people or property resulting from any ideas, methods, instructions or products referred to in the content.

