1. Introduction
With the launch of COSMIC-2 (Constellation Observing System for Meteorology, Ionosphere, and Climate-2a), more and more occultation data are available for obtaining atmospheric parameters [
1,
2,
3,
4]. And the advanced artificial intelligence algorithm can predict atmospheric parameters based on occultation data [
5,
6,
7,
8,
9]. Previous studies have shown that GNSS-RO has the advantages of high accuracy, high stability, long-term consistency, global all-weather detection, high vertical resolution, etc. The high accuracy and long-term consistency of GNSS-RO observations validate that GNSS-RO observations meet the high standards of climate reference observations [
10]. Any equipment used in space-based missions needs to undergo a series of rigorous tests, which also includes GNSS-RO signal receivers [
11,
12]. The GNSS-RO signal receiver plays a crucial role in the occultation detection process, and the evaluation of the GNSS-RO signal receiver is an important step in the design and deployment of the occultation detection system, so it is extremely urgent to establish a set of low-cost ground-based GNSS-RO signal receiver tests and an evaluation system.
Common approaches for testing GNSS-RO signal receivers on the ground using GNSS-RO technology include the mountaintop-based testing approach [
13,
14]. The mountaintop-based testing approach explores the global neutral atmospheric meteorological field profile, which is a simple and effective approach to directly obtain the information of atmospheric refractive index, barometric pressure, density, temperature, and water vapor. Years of experiments have verified that the mountaintop-based testing approach can observe occultation events and obtain the corresponding atmospheric profiles. In a previous study, Bai et al. conducted a validation test of GNOS (the GNSS Occultation Sounder) using the mountaintop-based testing approach, and the results showed that GNOS operated well [
13]. Li et al. utilized mountaintop-based atmospheric radio occultation observations for open/closed-loop tracking [
15].
However, the mountaintop-based testing approach has some obvious drawbacks. (1) The scenario of the mountaintop-based testing approach is not high-dynamic, and the receiver is stationary or moving much slower than GNSS and LEO satellites [
16]; (2) as the GNSS-RO signal receiver is in the troposphere during the testing process, it will limit the selection of inversion algorithms [
17]; (3) the cost of the mountaintop-based testing approach is relatively high, which includes personnel, transportation, accommodation, food and lodging, site, equipment transshipment costs, and personal and property safety risks; (4) the mountaintop-based testing approach is extremely demanding as it is difficult to find suitable peaks, which results in the limited data that can be provided.
Since there are many limitations in the mountaintop-based testing approach, we urgently need to establish a GNSS-RO simulation system. The system needs to be able to simulate both positioning signals and occultation signals that take into account the effects of the atmosphere. Conventional GNSS positioning simulators do not meet the needs of occultation ground-based testing because GNSS-RO simulators need to simulate high and low elevation occultation signals, which conventional navigation and positioning simulators do not have, especially the atmosphere simulation for adventitious observation. Therefore, a GNSS-RO simulation system should be constructed to quickly build a real scene and use real payloads to provide conditions for the development and testing on the ground and to conduct a comprehensive test of the performance indexes of occultation detection, so as to lay the foundation for the successful operation of the payload in orbit. The novel approach is used to evaluate the GNSS-RO signal receiver performance in terms of the ground-based atmospheric occultation simulation system.
The novel approach to evaluate the GNSS-RO signal receiver performance in terms of the ground-based atmospheric occultation simulation system can reduce test costs and improve test accuracy, efficiency, and reliability.
The GNSS atmospheric occultation simulation system that we hope to construct in this paper is an accurate, repeatable, and controllable tool for simulation testing and evaluation. The system can generate highly dynamic GNSS occultation signals according to the orbit of LEO satellites, so as to check the performance of GNSS-RO signal receivers, which has important engineering application value.
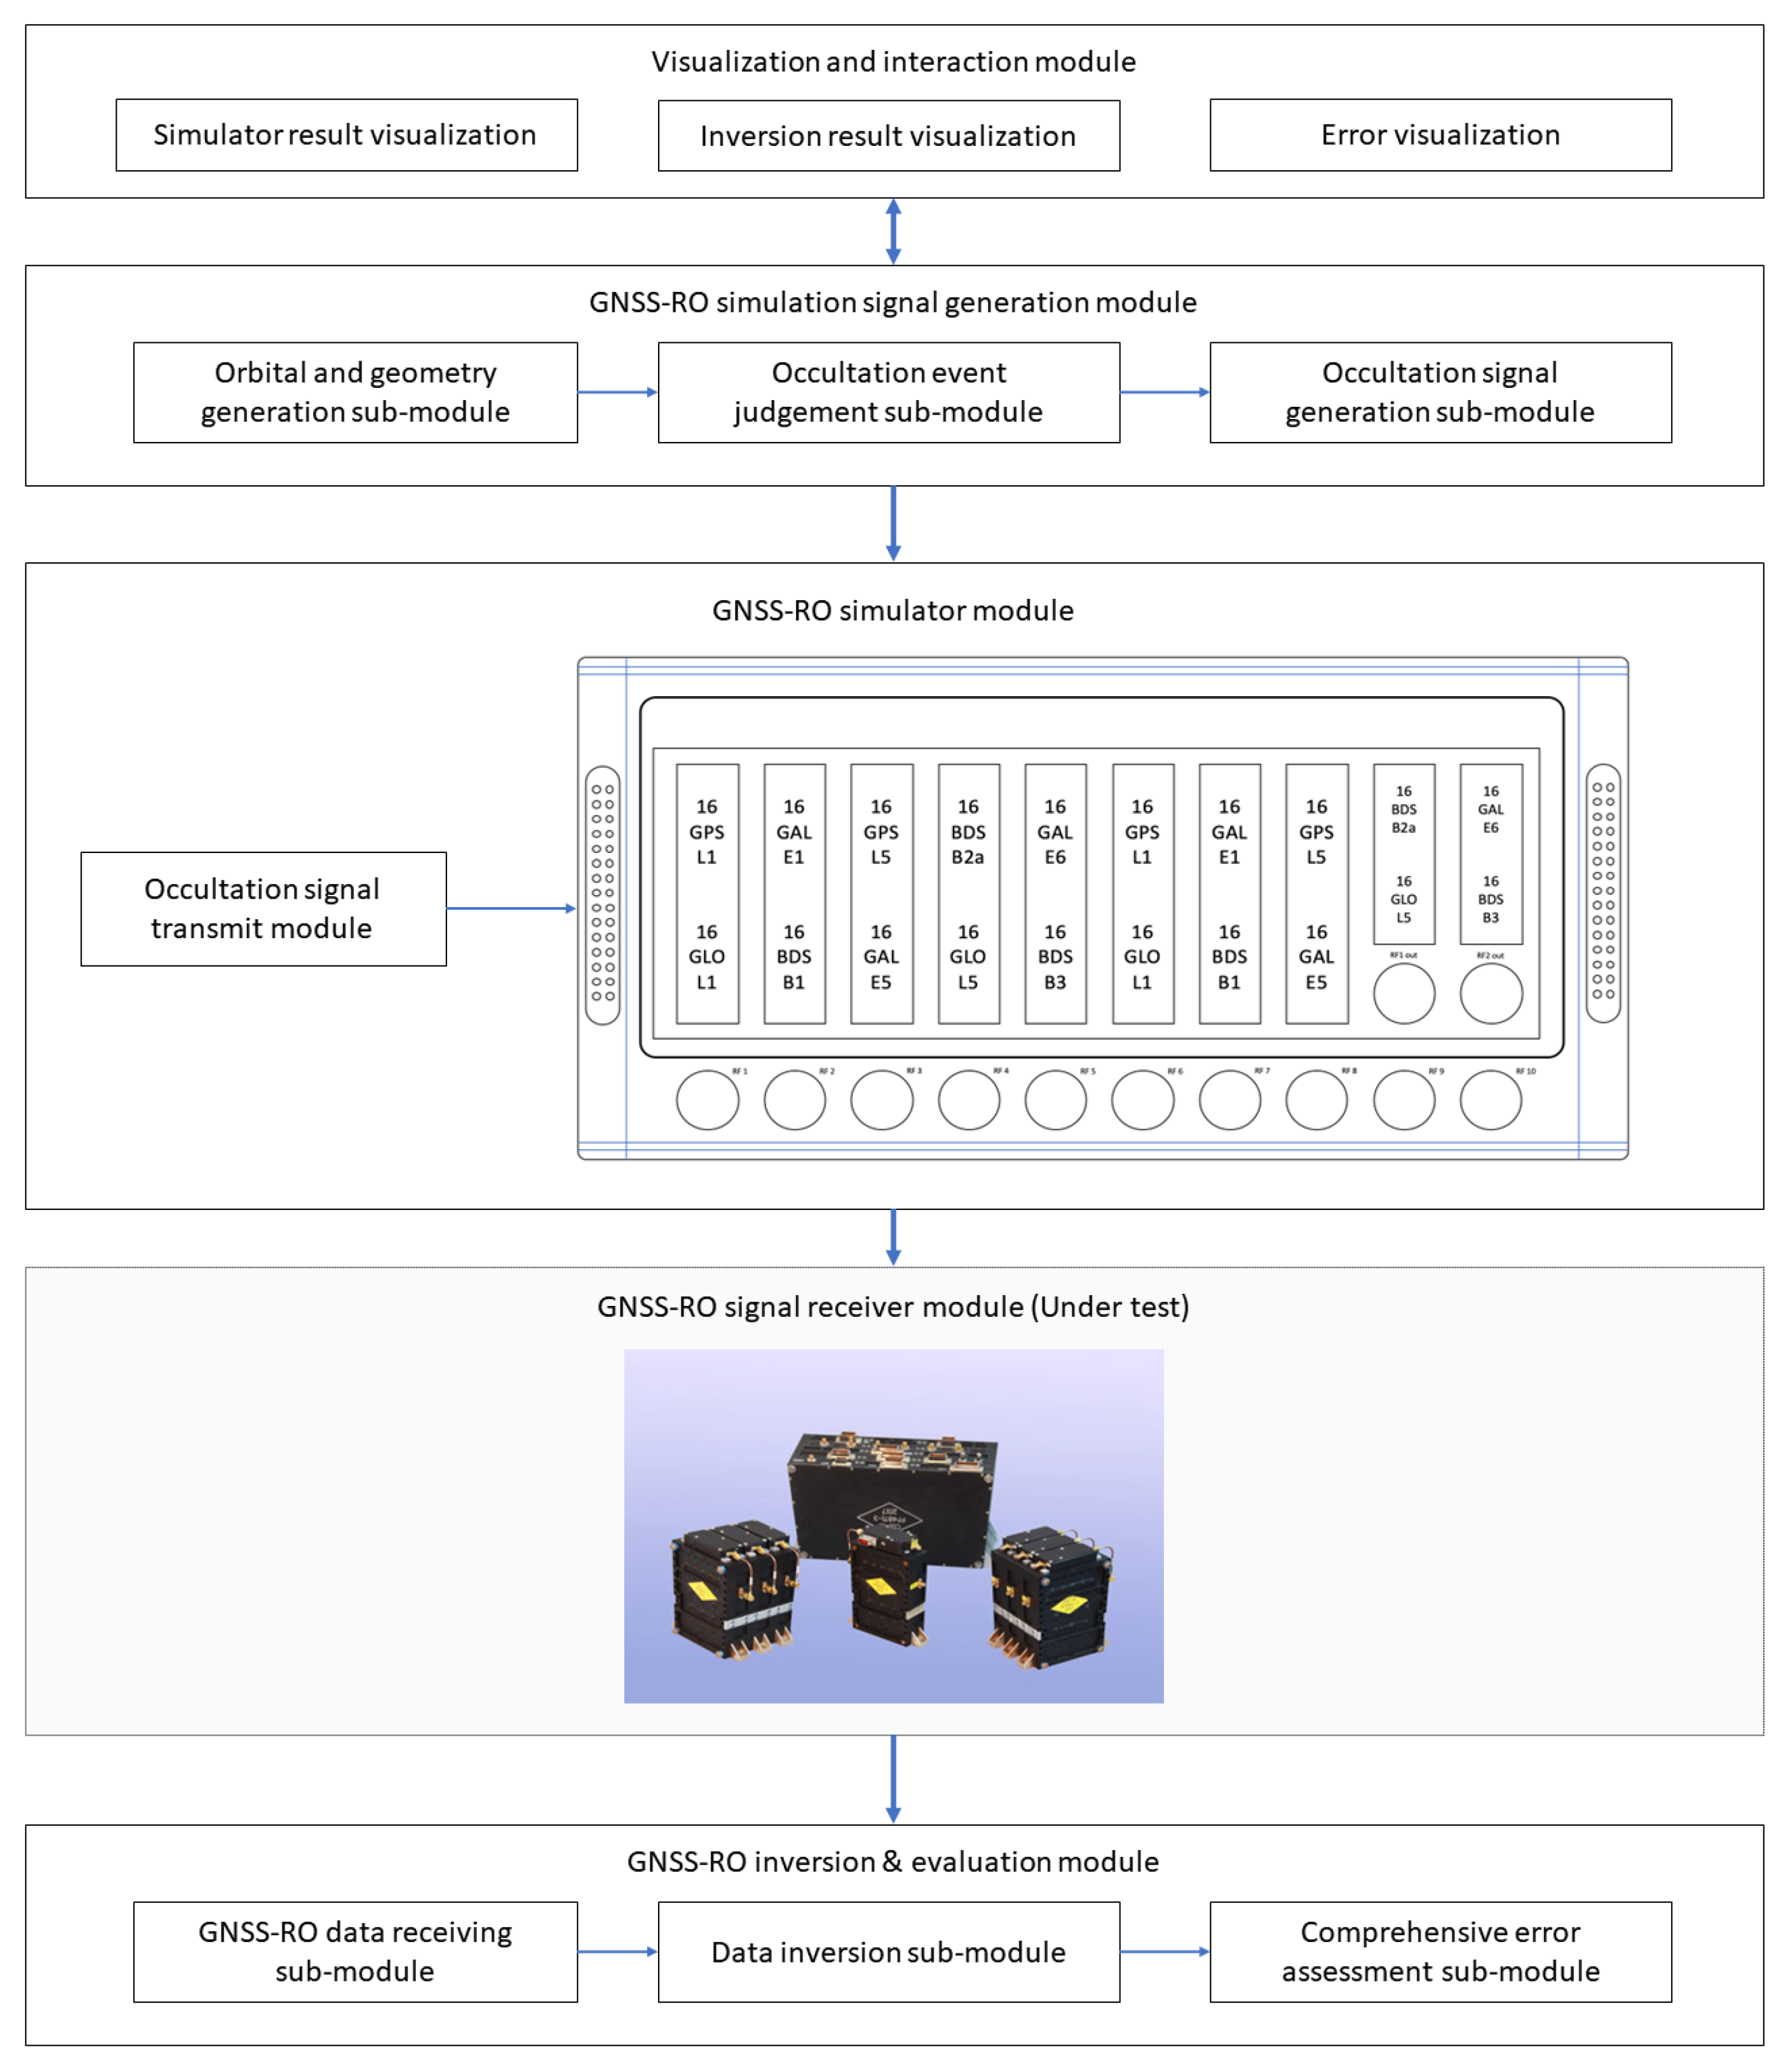
In this paper, we design a novel approach to evaluate the GNSS-RO signal receiver performance in terms of the ground-based atmospheric occultation simulation system to provide a useful reference for research and development in the field of GNSS-RO atmospheric exploration. To address the shortcomings of traditional approaches, we propose a hybrid virtual reality test platform for developing GNSS-RO signal receivers for occultation detection application scenarios. The system consists of the visualization and interaction module, the GNSS-RO simulation signal generation module, the GNSS-RO simulator module, the GNSS-RO signal receiver module, and the GNSS-RO inversion and evaluation module. The simulator hardware simulates the occurrence of scenarios and occultation signals and subsequently transmits radio frequency (RF) signals to the GNSS-RO signal receiver; the inversion and evaluation module uses the signal information to invert atmospheric temperature profiles and other information and compares them with the real values; the whole process is controlled by the scheduling module; and the user interacts with the system through the visualization and interaction module. The visualization and interaction module provides a very convenient way for error analysis of the inversion results. In conclusion, in order to solve the shortcomings of traditional approaches and to combine the advantages of traditional approaches, the paper proposes an efficient, user-friendly test system that adapts to complex and real-world scenarios.
FY-3E is the world’s first civilian morning and evening orbit meteorological satellite, which was successfully launched from the Jiuquan Satellite Launch Center on 5 July 2021 [
18,
19]. With the GNOS-II occultation sounder developed by the National Center for Space Science of the Chinese Academy of Sciences on board, its data will be used for numerical weather prediction, meteorological research, and so on, and it is currently operating normally in orbit [
20,
21,
22]. In this paper, the performance evaluation capability of the ground-based GNSS atmospheric occultation simulation system is verified using the FY-3E GNSS-RO receiver as the actual load. The ground-based GNSS atmospheric occultation simulation system can effectively evaluate the GNSS-RO signal receiver performance, which can lay the foundation for the ground-based performance evaluation of the future GNSS-RO signal receiver.
2. Materials and Methods
The paper provides a comprehensive, accurate, flexible, and user-friendly test system. As an end-to-end test platform, the system can be adapted to different needs and scenarios; the system provides a friendly simulation visualization platform, which makes the test system have a good user experience, and the domain experts can quickly get started and obtain effective results. Based on the above design ideas, the system contains several modules, which are the visualization and interaction module, the GNSS-RO simulation signal generation module, the GNSS-RO simulator module, the GNSS-RO signal receiver module, and the GNSS-RO inversion and evaluation module. The overall workflow of the system is shown in
Figure 1, and these modules will be introduced separately below.
2.1. Visualization and Interaction Module
The visualization and interaction module includes the visualization interface and the scheduler for the testbed. The visualization interface is developed to enhance the user experience. The scheduler of the testbed assumes the important responsibility of controlling the direction of the data flow of the system and coordinating the synchronization relationship between modules. In all possible application scenarios of the simulation platform, the scheduler is responsible for arranging and controlling the operation flow of each module to ensure that each module runs in the expected order and according to the set rules. Through the fine tuning and control of each module, the scheduler can integrate multiple modules that could have been run independently into a complete system with full functionality and friendly interaction, thus improving the overall performance and ease of use of the system. The test system adopts a modular design with event-driven and extensible features, which makes the implementation of the scheduling program possible. Among other things, the modular design encapsulates each functional unit as an independent module. This design not only helps to improve the readability and maintainability of the code but also helps to realize a high degree of decoupling between modules and reduce the complexity of the system. The event-driven mechanism allows each module to generate events based on its own state and external inputs, and the scheduler is responsible for listening to these events and making scheduling decisions accordingly. This mechanism ensures real-time communication between modules and improves system responsiveness and flexibility. Scalability enables the scheduler to easily support the access of new modules and the upgrade of existing modules. By following unified interface specifications and communication protocols, new modules can be quickly integrated into existing test platforms for functional expansion and optimization.
After the task request is submitted, the testbed scheduler first starts the GNSS-RO analog signal generation module. The GNSS-RO simulator receives the command and sends the channel information to the GNSS-RO signal receiver, which converts the received signal into the parameters needed by the inversion module. Finally, the inversion results can be evaluated and error analyzed. The simulation visualization platform is written in TypeScript language. The simulation visualization platform is based on the map publishing service middleware developed by ShuiJingFang Company, which allows offline access to the map without connecting to the Internet. Through the visualization platform, we can perform operations such as task management, simulator status monitoring, system data management, occultation event filtering, and the generation of error comparison maps. The system supports the visualization of real-time simulation results. The interface is shown in
Figure 2.
The system’s visualization interface consists of four parts: the system controller interface, system information, the occultation overview, and the occultation events overview. The system controller interface allows the user to configure the task and control the execution and stop of the task. System information is used to display the currently configured task information, the current system status, and the current simulation progress. The occultation overview shows the results of the simulation so far using a hedgehog plot. The occultation events overview uses tables and icons to show the basic information of the current occultation events, the fields, and the method of display that can be specified by the user.
2.2. GNSS-RO Simulation Signal Generation Module
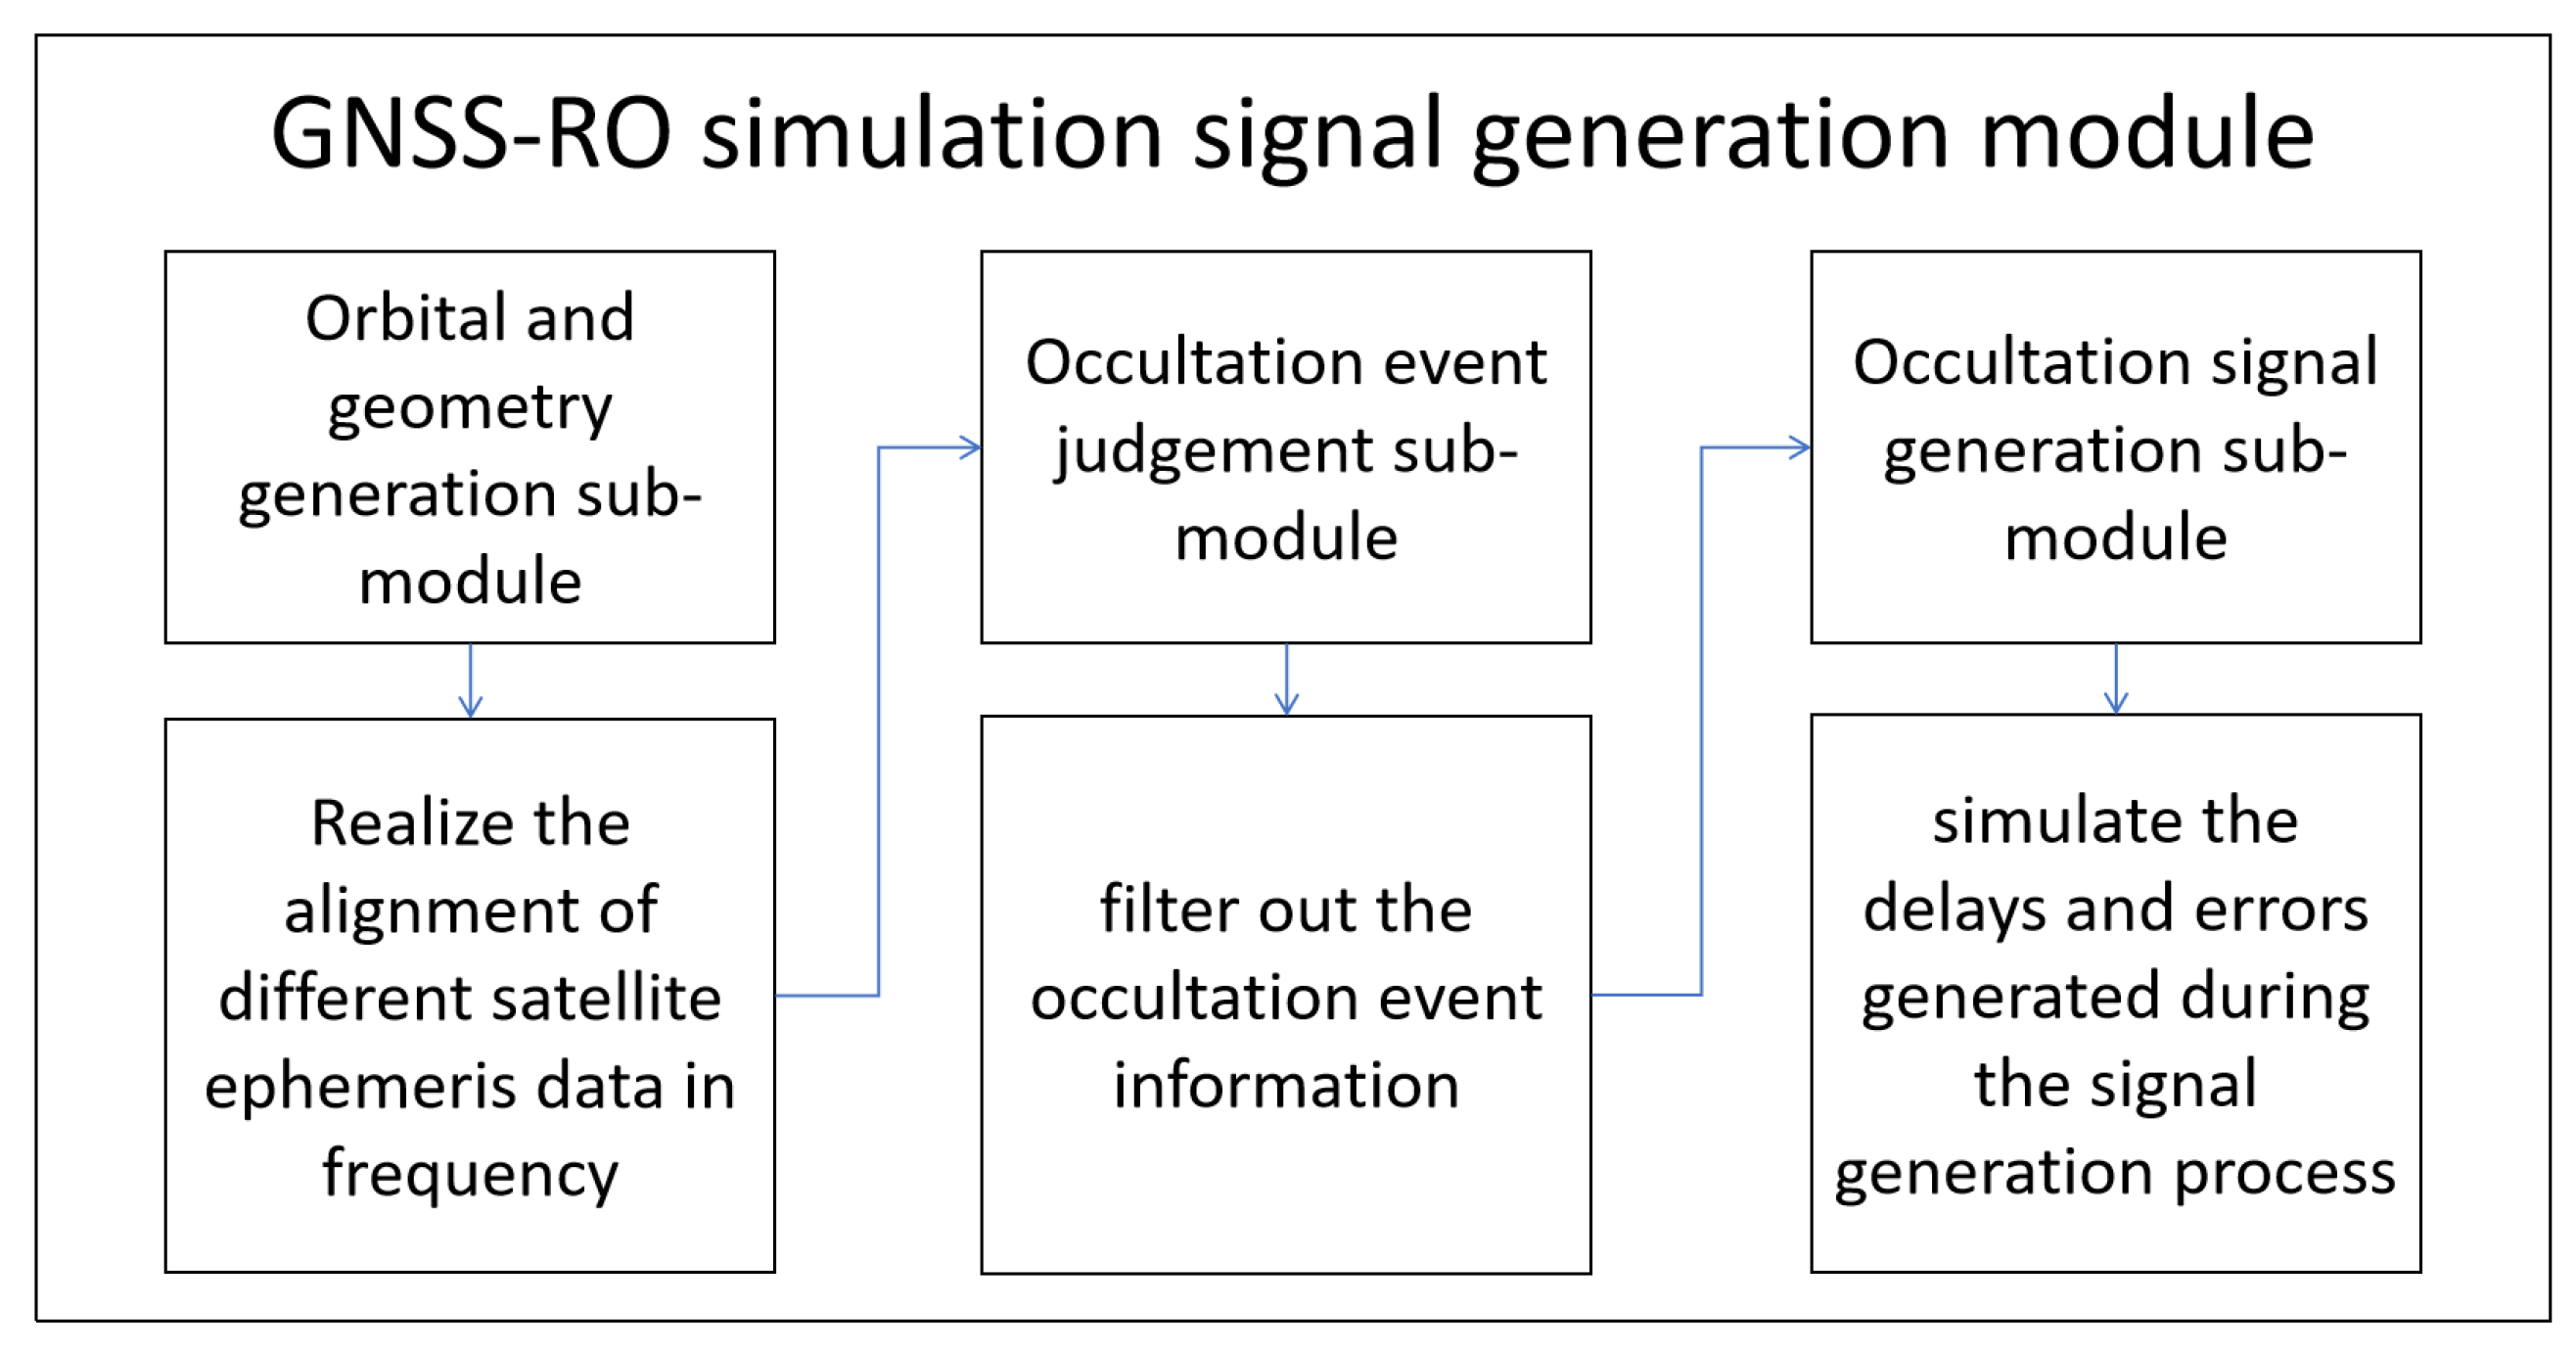
The GNSS-RO simulation signal generation module is the core of the frontend simulation. According to its functionalities, its internal implementation is divided into three sub-modules: the GNSS-RO data interpolation sub-module, the GNSS-RO signal generation sub-module, and the GNSS-RO signal software simulation sub-module. The GNSS-RO data interpolation sub-module is responsible for uniformly interpolating the satellite ephemeris data of different frequencies into satellite ephemeris data of higher frequencies to realize the alignment of different satellite ephemeris data in frequency. The GNSS-RO signal generation sub-module is responsible for processing these ephemeris data and filtering out the occultation event information in the ephemeris, which will be used as the input of the GNSS-RO signal simulation sub-module for the subsequent calculation of GNSS-RO signal information. The GNSS-RO signal software simulation sub-module is responsible for simulating the delays and errors generated during the GNSS-RO signal generation process and converting this information into simulator-readable command files for the subsequent sending of commands to the GNSS-RO simulator. These commands help the simulator to fine-tune the occultation signal simulation. The construction principle of the whole module is shown in
Figure 3.
The forward simulation system is the forward part of the overall system. The forward simulation system generates code offsets and additional phases caused by occultation events in time according to the results of precision orbiting, and this information can help the simulator to fine-tune satellite orbits and transmit signals. The forward simulation module can be divided into three sub-modules: the GNSS-RO data interpolation sub-module, the GNSS-RO event generation sub-module, and the GNSS-RO signal software simulation sub-module, which are described below.
2.2.1. GNSS-RO Data Interpolation Sub-Module
During the simulation phase, users provide multiple Standard Product #3 (Sp3, a standardized orbit format) files storing the IGS precise ephemeris, which is used to provide the precise orbital positions of the satellites [
23]. However, since the user-supplied Sp3 files may correspond to different temporal granularities, a GNSS-RO data interpolation algorithm is needed to standardize the temporal granularity. The system specifies an interpolation frequency of 100 Hz for all data. Lagrangian interpolation is used even though it can theoretically be used to interpolate any set of data points. For a set of data
, there are Lagrange interpolation polynomials as shown in Equation (
1) [
24]:
where
is the Lagrangian basis function as shown in Equation (
2):
2.2.2. GNSS-RO Event Generation Sub-Module
The interpolated orbital information does not fully contain occultation events, and in fact, most of the time no occultation events occur. Therefore, this series of orbit information needs to be filtered according to the occultation event determination algorithm. First, the occultation event determination algorithm deduces the position of the GNSS satellite at the next point in time based on the position and velocity of the GNSS satellite. In addition, the direction angle and elevation angle are calculated based on the relationship between the two satellites. Based on this geometric information, it can be determined whether an occultation event has occurred. In this process, the direction angle and elevation angle are calculated as shown in Equations (3)–(5) [
25,
26].
where
is the position vector of the GNSS satellite in the WGS84 (World Geodetic System) coordinates [
27],
is the position vector of the LEO satellites in the WGS84 coordinates, and
is the position vector of the LEO satellites in the ENU (East-North-Up) coordinates.
The GNSS-RO event generation module is essentially a filter that filters out each occultation event from the entire satellite orbit. The occultation event determination algorithm determines whether or not an occultation event has occurred at that point in time, based on the positional relationship between the GNSS and LEO at each point in time.
2.2.3. GNSS-RO Signal Software Simulation Sub-Module
There are two schemes for simulating occultation events: a 3D ray tracing algorithm and a wave-light simulation algorithm. The 3D ray tracing algorithm can generate a series of code offsets and additional phases generated by the occultation event based on the orbit information of the occultation event. Ray tracing approaches are generally categorized into experimental and bending approaches, and the 3D ray tracing in the simulation module of this system uses the experimental approach. The 3D ray tracing portion of the code uses a linear combination of phase and zero difference to simplify the power filtering approach to estimate the satellite position, which is ultimately used to compute the code offsets, carrier phases, and other information. The system simulates occultation by solving the three-dimensional Haselgrove equation in rectangular coordinates [
28,
29], as shown in Equations (6) and (7):
where
is the position vector in right-angled coordinates,
is the refractive index under Cartesian coordinates, and
t is the “time” of phase travel along the ray path.
Inspired by Davies’s approach, another twelve equations are solved [
30]:
where the summation convention used on the
k indices
is used for the
k metrics.
denotes the initial direction parameter: zenith angle, and
denotes the initial direction parameter: azimuth angle. The system uses the classical fourth-order Runge Kutta approach to solve the PDE (partial differential equation). The wave simulation algorithm utilizes fluctuating optics to achieve the simulation of the occultation signal by solving the fluctuation equations (generally the Helmholtz equation). The specific representation of the Helmhotlz equation is shown in Equation (
10) [
31]:
where
is the wave vector and
is the wavelength.
In this system, the wavelength simulation algorithm is implemented using the open source software ROPP, which will not be discussed too much in this paper.
Inspired by the ROSAP(Radio Occultation Simulations for Atmospheric Profiling) software tool [
32], all meteorological parameters of interest can be derived after solving the PDE.
2.3. GNSS-RO Simulator Module
The GNSS-RO simulator module is responsible for simulating occultation events using a hardware simulator, with delays and errors calculated by the upstream analog simulation module while allowing some corrections to be made to the simulation process. The GNSS-RO simulator will generate RF signals and transmit them to the GNSS-RO signal receiver. Since the output of the GNSS-RO signal simulation generation module is a text file that holds simulator commands and cannot be submitted directly to the simulator, it is necessary to send the commands to the simulator through the occultation signal sending module.
The GNSS-RO simulator is the core hardware of the system. The output of the upstream (GNSS-RO event generation module) needs to be transmitted to the GNSS-RO simulator. The GNSS-RO simulator module generates a series of command files containing 1-second cycles, which need to be sent to the program over the network. The GNSS-RO simulator controller can be seen as a black box between the command files and the simulator. With this layered abstraction, the network sender can adjust the simulator’s multiple functions to meet the program’s requirements. The system transmits instructions via the TCP (Transmission Control Protocol) and UDP (User Datagram Protocol) protocols to honor different instruction types. At the same time, the system has achieved maximum time synchronization through hardware, an operation that allows us to correspond the point in time when the GNSS-RO simulator is started to the point in time on the server, and to extrapolate subsequent times from the start time. All interactions with the GNSS-RO simulator, including control and data sending, are carried out via commands, and the simulator log file is checked at the end of the run to ensure that the commands sent were correctly accepted for execution.
2.4. GNSS-RO Signal Receiver Module
The GNSS-RO signal receiver module is a module under test, which is responsible for acquiring the state in the channel of the GNSS-RO simulator; the signal receiver needs to sample, demodulate, and localize the signals and convert them into data files required by the inversion algorithm. After receiving these files, the inversion algorithm will invert the whole atmospheric model by numerical approaches. The accuracy and robustness of the GNSS-RO signal receiver have a significant impact on the performance and reliability of the whole system.
The GNSS-RO signal receiver is used for navigation satellite positioning, which can receive satellite positioning signals and carry out a series of tracking transformations. The GNSS-RO signal receiver itself comes with a lot of parameters to cope with different scenarios. The GNSS-RO signal receiver can send data to the ground test equipment in time to test the accuracy of the data. After testing the correctness of the data, the ground test equipment sends the real-time data to the inversion evaluation module in the shared folder. Since the corresponding operating system platform of the ground test equipment is different from that of the main tuner, a shared hard disk is designed for this system. The shared hard disk is used to store the data returned by the ground test equipment, which are automatically deleted after being accepted by the inversion evaluation submodule.
2.5. GNSS-RO Inversion and Evaluation Module
The GNSS-RO inversion and evaluation module is responsible for the data reception, data inversion, and evaluation of errors in all aspects of the system under test. In this module, the GNSS-RO data reception sub-module firstly needs to receive data from the GNSS-RO signal receiver. Secondly, the data inversion sub-module extracts the inversion results. Then, the integrated error assessment sub-module evaluates the error between the atmospheric model and the inversion results. This process typically uses various error metrics to measure the difference between the inversion results and the actual values, such as relative error. The error information provided by the overall error assessment module helps to better understand the performance of the system under test and guides optimization and improvement efforts. By displaying error information in real time, the module also helps domain experts to improve the accuracy and stability of the received GNSS-RO signals.
A typical application scenario of the system is to submit a simulation task for an occultation event. After submitting the task, the visualization platform will update the simulation progress and simulation results in real time. Before the simulation starts, the domain expert can configure the simulation task and control its start time via the simulation visualization platform. During the simulation process, the visualization platform displays the simulation results to the domain experts in real time to monitor the simulation progress. At the end of the simulation, the visualization platform performs error analysis.
The inversion evaluation subsystem is responsible for the inversion of the observed data, i.e., receiving the data from the GNSS-RO signal receiver and the inversion of the atmospheric model [
33,
34,
35,
36]. The atmospheric model derived by the inversion evaluation subsystem can be compared with the atmospheric model input by the user, and the closer the two are, the more suitable the receiver and inversion algorithm are for field deployment. The system considers the GNSS-RO signal receiver and inversion algorithm as the system under test for overall error assessment.
The algorithms used by the system are based on the ROPP open source software, which requires the system to use different approaches at different altitudes, including a wave-light inversion algorithm for 0–20 km and a geometric inversion algorithm for above 20 km. Since the system uses a geometric simulation algorithm in the simulation phase, we only present this one algorithm here and will gradually add support for new approaches in the future. The system uses the Abelian transform to obtain refractive index profiles. This algorithm can be used to obtain refractive index information using bending angle data [
37].
2.6. System Scheduler
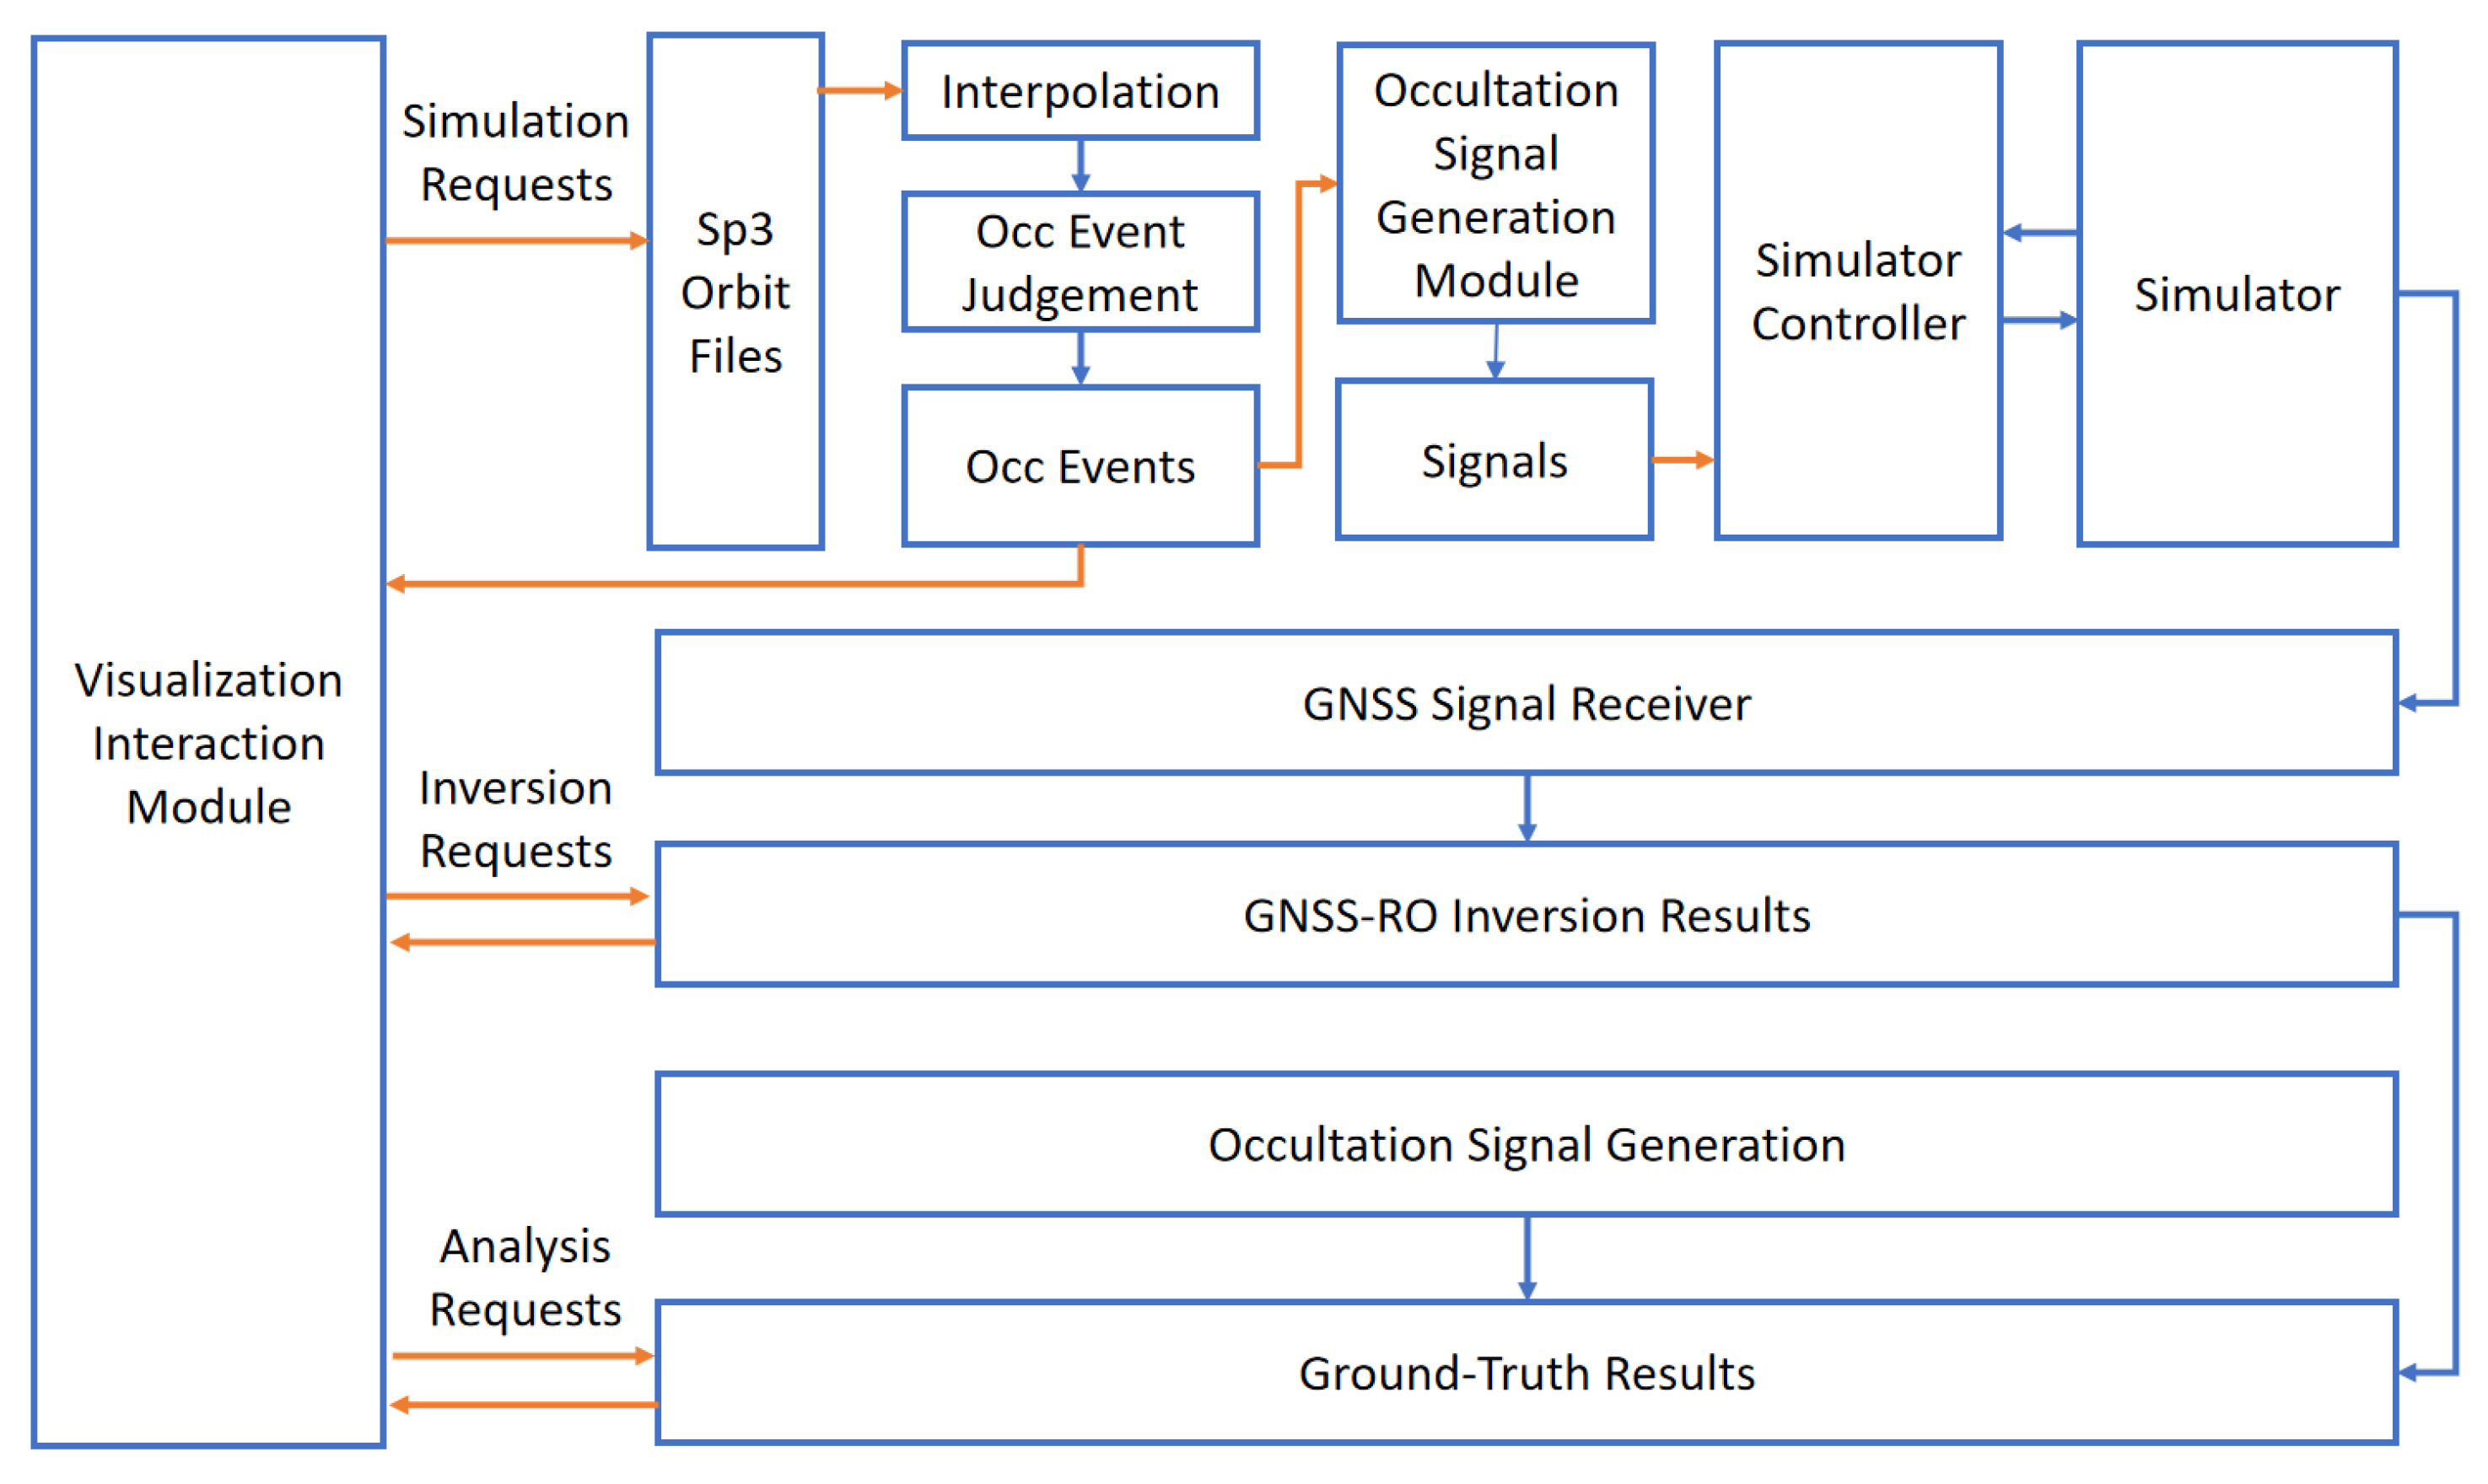
A complex system contains multiple modules that should be able to form a workflow that operates independently. Formally, a workflow is a directed acyclic graph, where a node in the graph represents a task and a directed edge represents a dependency between two tasks. A DAG (directed acyclic graph) graph is a flexible model that allows us to construct a directed acyclic graph by abstracting each module as a point in the graph, and the interface between modules as an edge. We maintain this directed acyclic graph using a scheduler to coordinate the synchronization between submodules and to coordinate the workflow of the system. The scheduler generates the appropriate workflows according to the user’s requirements. In each module, the intermediate data for each step and the program corresponding to this step are tightly coupled. The scheduler controls the basic flow between each module, as shown in
Figure 4.
This paper develops a scheduler based on the Django Rest framework, which includes but is not limited to controlling the order of execution of programs; the flow of data throughout the system; generating, viewing, and editing configuration files needed for processes; and performing task scheduling and task-level resource scheduling. The scheduler also specifies the input and output paths for each module in the workflow based on system calls provided by the operating system.
In a typical application scenario, the user creates a new task and submits the sp3 file through the visualization module, and the scheduler senses it and automatically executes the GNSS-RO data interpolation sub-module, the GNSS-RO event generation sub-module, and the GNSS-RO signal software simulation module. In this process, users can view the progress and results of the simulation in real time. At the end of the simulation, the scheduler will start the GNSS-RO signal software simulation sub-module, which generates signals that can be injected into the GNSS-RO simulator via the simulator controller. Subsequently, the GNSS-RO simulator transmits the RF signal to the GNSS-RO signal receiver. The received signal is inverted to obtain a comparison curve with the theoretical model. During the inversion process, the user can view the progress and results of the inversion in real time. At the end of the inversion, the user can visualize the difference in values. The curves exported by the system can assist domain experts to adjust the receiver parameters.
3. Results and Discussion
An experiment is designed to validate the testbed proposed in this paper, which is used to verify the correctness of the testbed.
In order to test the GNSS-RO signal receiver, the GNSS-RO simulation signal generation module, the GNSS-RO simulator module, and the GNSS-RO inversion and assessment module used in the test platform proposed in this paper have been verified to be effective and reliable by many years of on-orbit tests. It is therefore considered that the performance of the receiver can be illustrated by comparing the meteorological parameters obtained from the inversion with the modeled values. In this paper, the FY-3E occultation receiver is selected for testing because the performance of the FY-3E occultation receiver has been verified. In view of the excellent performance of FY-3E, the following criteria are designed for the test platform: (1) the relative error of the refractive index should be less than 2% in the range of 0–5 km and less than 1% in the range of 5–20 km; (2) the absolute error of temperature should be less than 2K; and (3) the relative error of pressure should be less than 1%.
We choose two types of models to validate our system: the climate empirical model (CIRA) and the real model (ERA5). The CIRA meteorological model, which can describe the typical characteristics of the atmosphere, was chosen for the experiment, and the model can derive the temperature, humidity, and pressure [
38]. ERA5 is the fifth generation ECMWF atmospheric reanalysis of the global climate covering the period from January 1940 to present. It is produced by the Copernicus Climate Change Service (C3S) at ECMWF and provides hourly estimates of a large number of atmospheric, land, and oceanic climate variables [
39].
In addition, the formula for the refractive index is shown in Equation (
11) [
40].
where
N is refractivity,
n is the refractive index,
and
are the dry partial pressure (hPa) and wet partial pressure (hPa) of the atmosphere, and
T is the absolute temperature (K).
In our experiment, we feed the same data to the two models and the testbed to analyze the results of the intermediate variables and the atmospheric model derived by the inversion algorithm.
Since the refractive index is the key parameter in the L1A stage and all other meteorological parameters can be derived from the refractive index, only the refractive index is examined in this paper. In this paper, the refractive index data of the model are compared with the refractive index data given by the simulation inversion algorithm, and the relative error is used as the evaluation criterion, which is calculated as shown in Equation (
12).
where
is the relative error,
is the absolute error, and
L is the true value.
In this paper, data from a GNSS satellite and a LEO satellite on 14 July 2007 are used, and a scene control simulator with only one payload is set up for simulation. In the experiment, two values are compared in this paper. One is the simulated data derived using the model, and the other is the observation data derived from the reception and inversion algorithms on the FY-3E occultation receiver. Graphs are also plotted and analyzed. The refractive indices, temperatures, and pressures derived from the CIRA model, and the inversion modules are compared.
3.1. Comparison of Refractive Indices Derived from CIRA Model and Receiver Inversion Module
Figure 5 shows the comparison between the refractive indices obtained by the CIRA model and the inversion algorithm in the altitude range of 0–20 km, with the blue curve representing the refractive indices obtained by the CIRA model and the orange curve representing the refractive indices obtained by the inversion algorithm. The results show that the results obtained by the receiver through the inversion algorithm are very close to those obtained by the meteorological model, which means that the FY-3E occultation receiver can accurately observe the atmospheric information in this GNSS atmospheric occultation simulation system, which is in line with the actual results. Therefore, it can be judged that the approach to evaluate the GNSS-RO signal receiver performance in terms of the ground-based atmospheric occultation simulation system is valid.
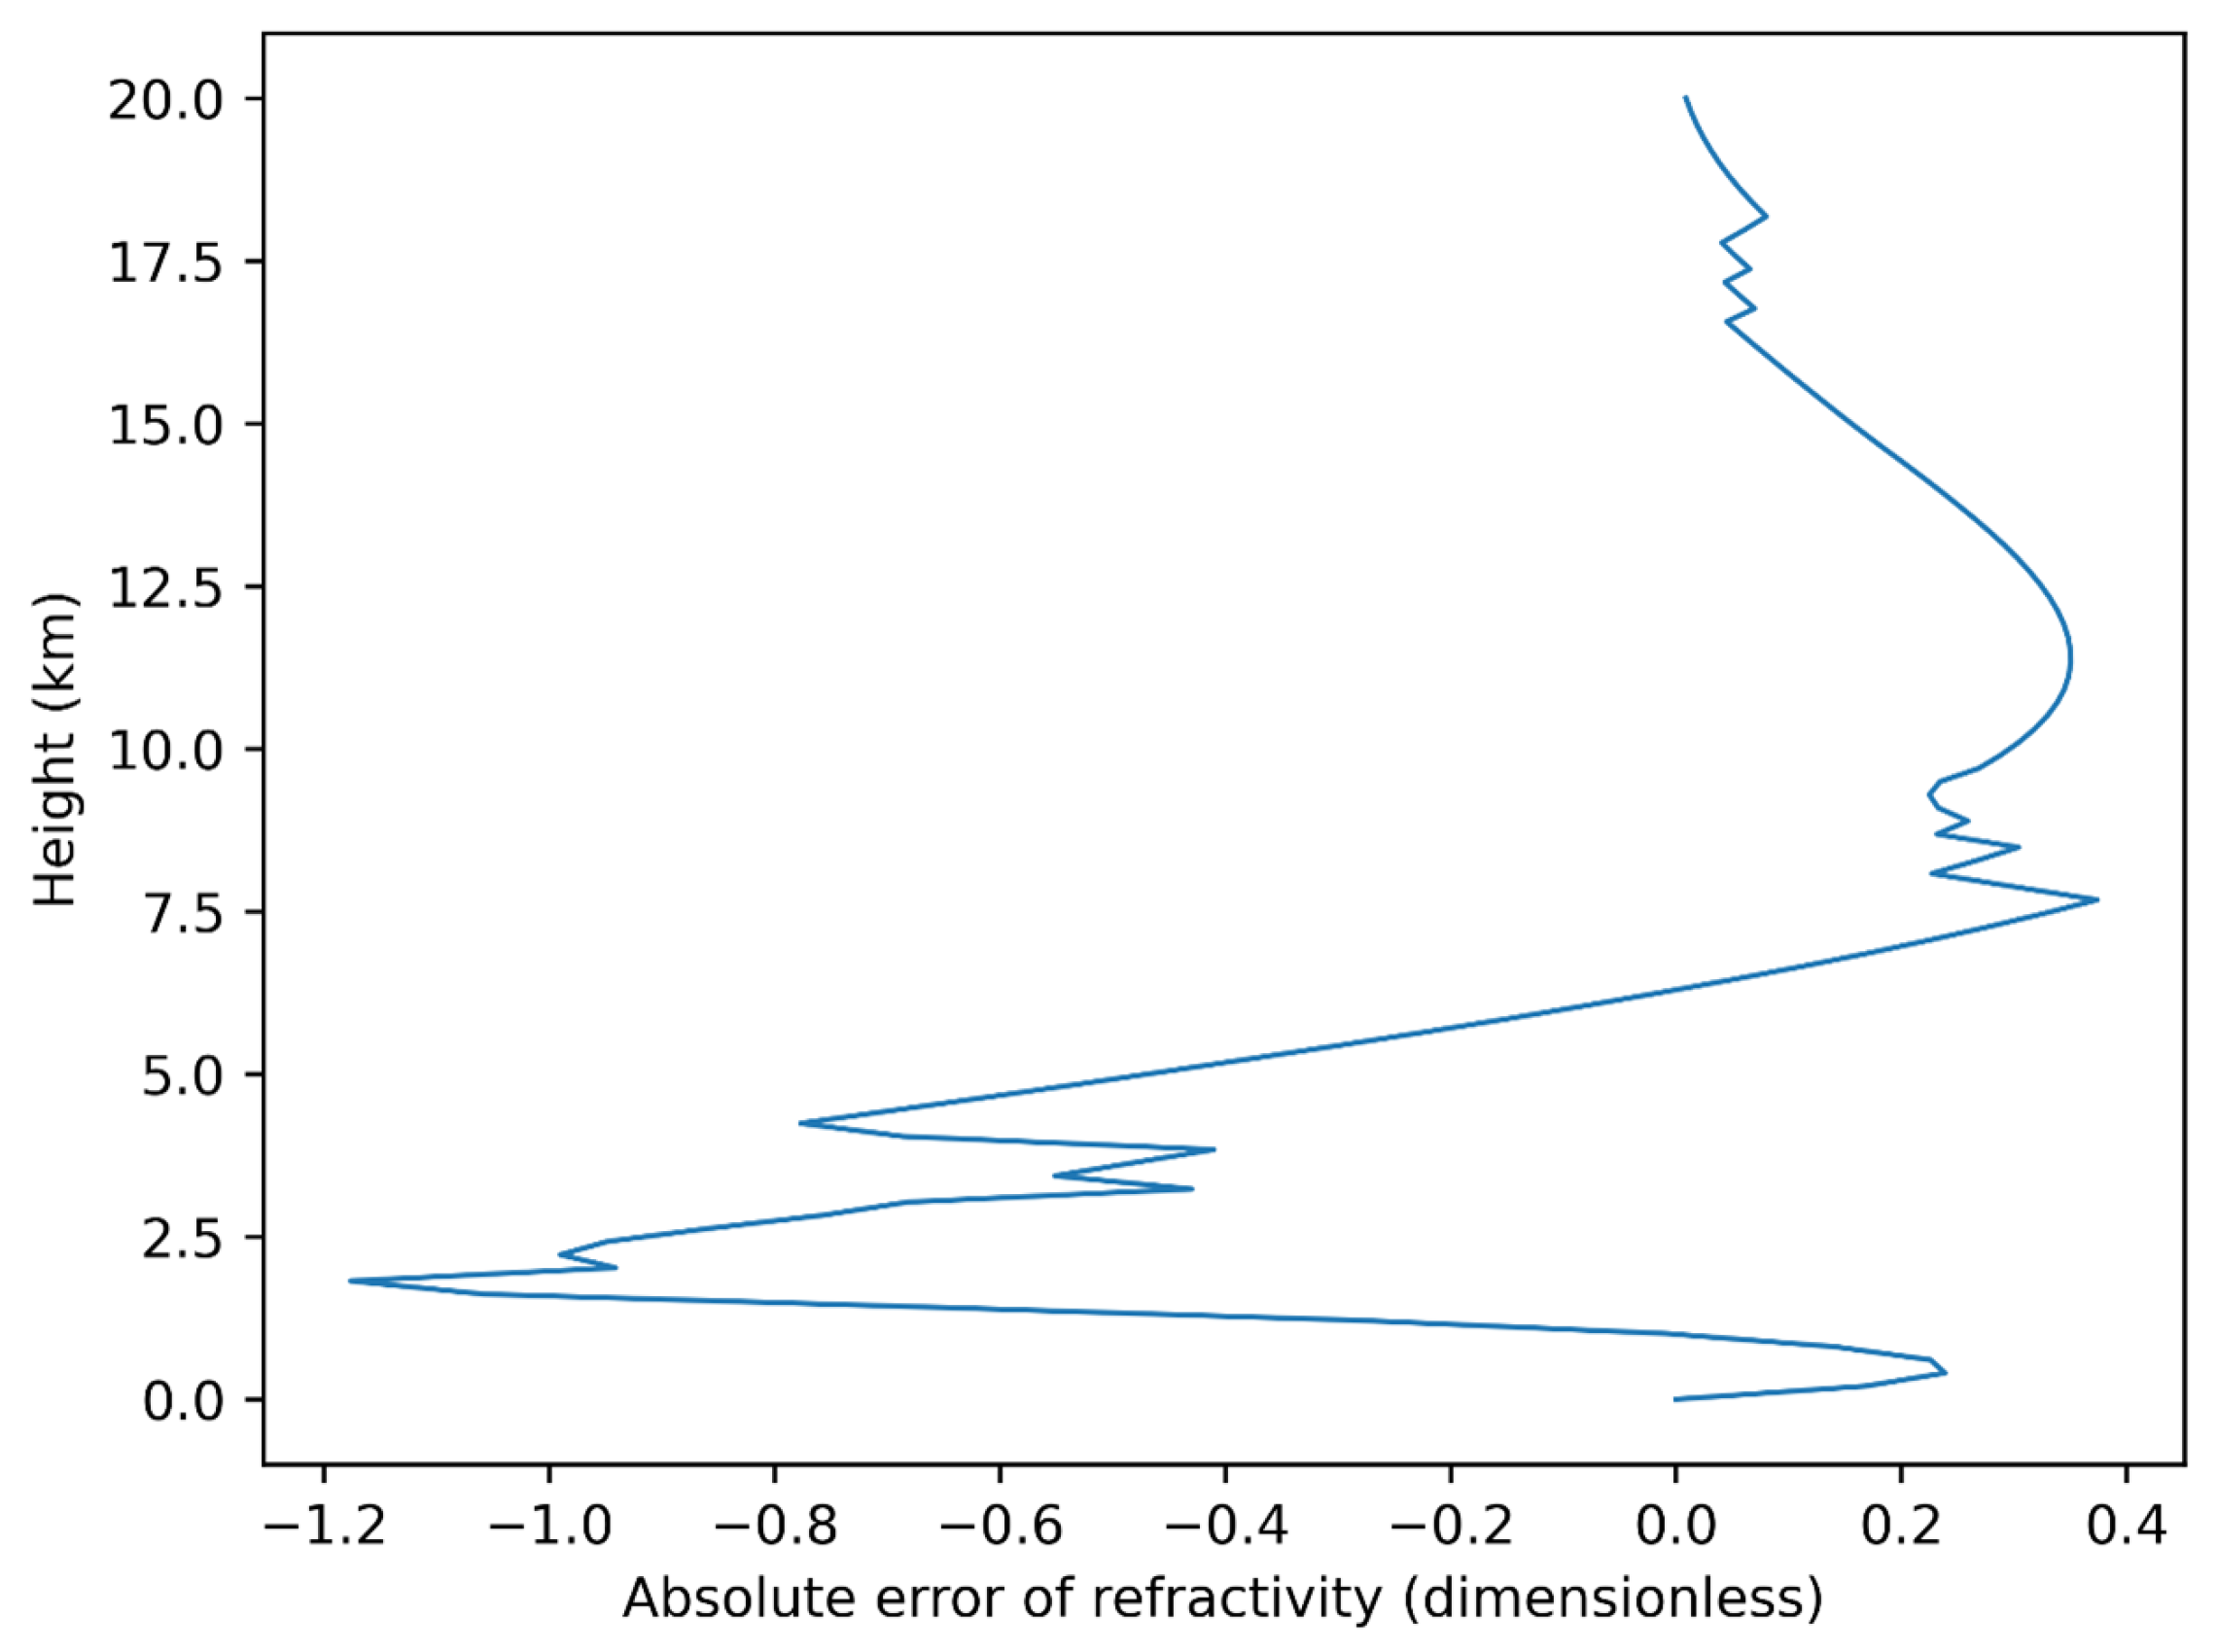
Figure 6 shows the absolute error of the refractive index obtained by the inversion algorithm relative to the refractive index obtained by the CIRA model in the altitude range of 0–20 km, with the horizontal axis representing the absolute error of the refractive index and the axis coordinates representing the altitude. The smaller the absolute error of the refractive index is, the closer the atmospheric observation data inverted by the GNSS-RO signal receiver using occultation data are to the real value and the better the performance of the receiver is. The absolute error of the refractive index is larger in the bottom atmosphere (0–5 km) and smaller in the upper atmosphere (5–20 km), but the absolute error of the refractive index in the altitude range of 0–20 km ranges between −1.2 and 0.4. It is hypothesized that this is due to the fact that the underlying atmosphere is disturbed by complex factors and the simple CIRA model has limited ability to simulate the underlying real atmosphere. From the data in the figure, it can be seen that the FY-3E occultation receiver can accurately observe the atmospheric information in this GNSS atmospheric occultation simulation system, which is in line with the actual results. Therefore, it can be judged that the approach to evaluate the GNSS-RO signal receiver performance in terms of the ground-based atmospheric occultation simulation system is valid.
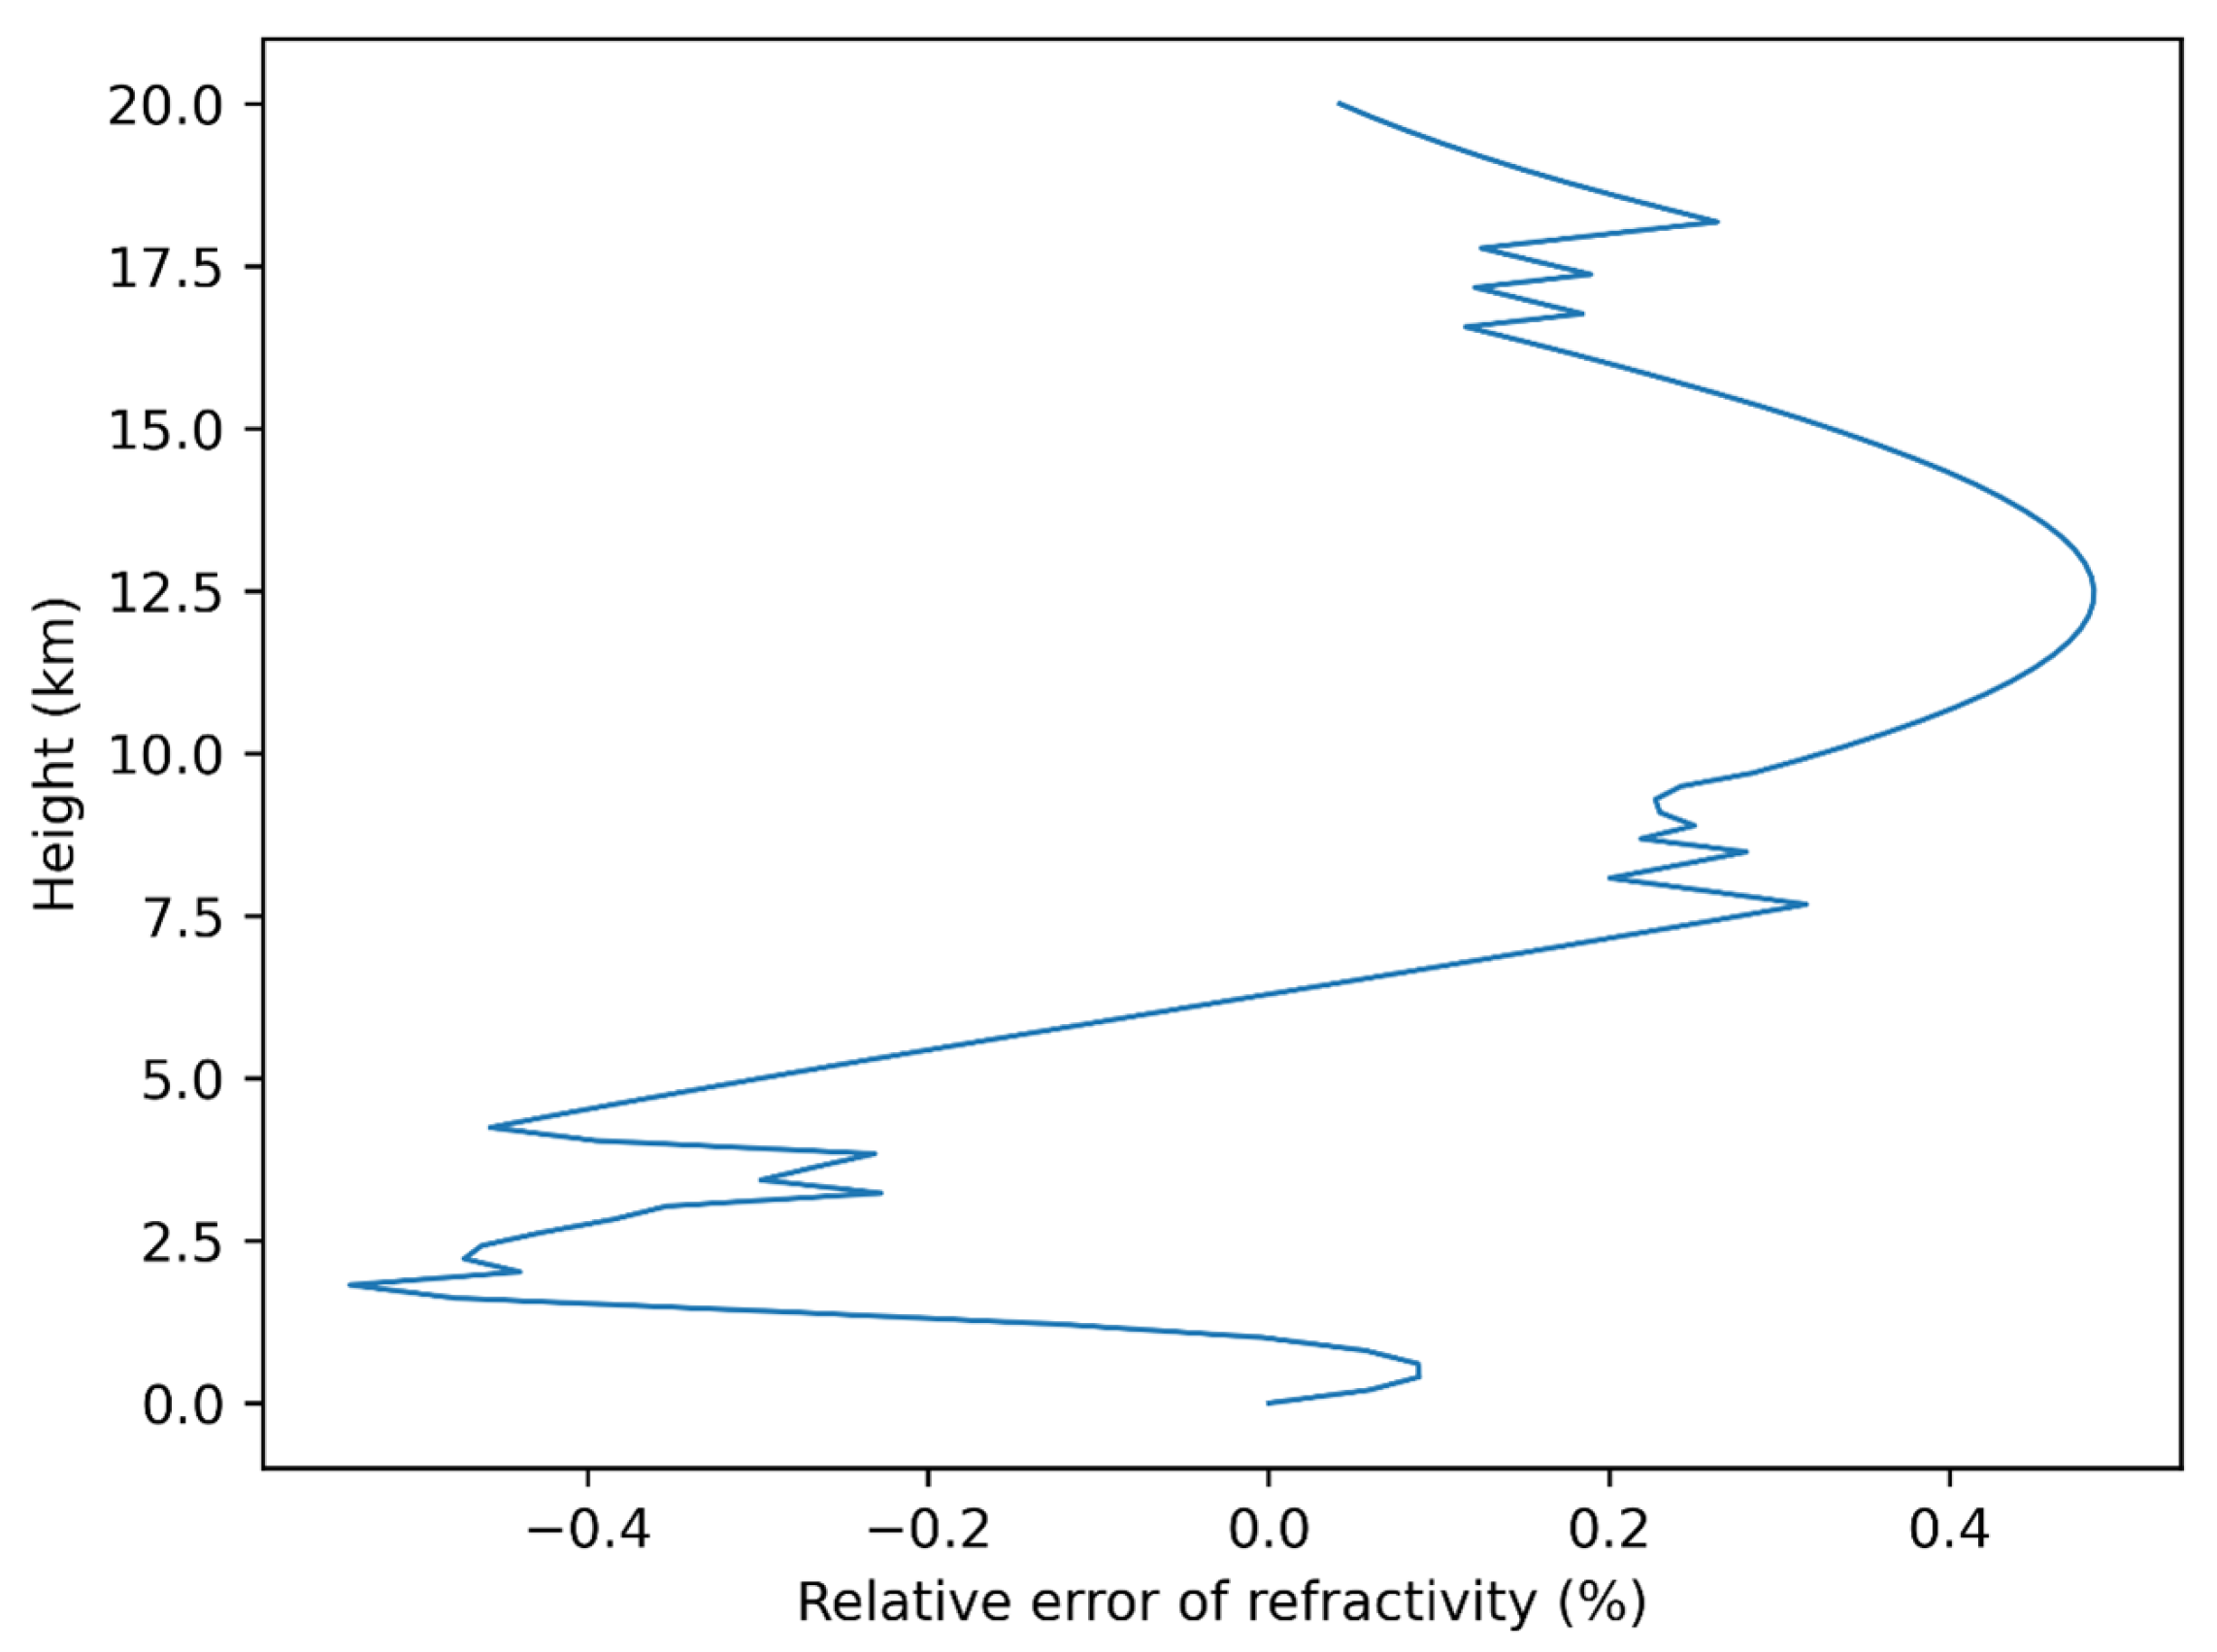
Figure 7 shows the relative error of the refractive index obtained by the inversion algorithm relative to that obtained by the CIRA model in the altitude range of 0–20 km, with the horizontal axis representing the relative error of the refractive index and the axis coordinates representing the altitude. The smaller the relative error of the refractive index, the closer the atmospheric observation data inverted by the GNSS-RO signal receiver using occultation data are to the real value and the better the performance of the receiver. The relative error of the refractive index is large in the range of the bottom atmosphere (0–10 km) and small in the range of the upper atmosphere (10–20 km), but the relative error of the refractive index is less than 1% in all of the altitude ranges from 0–20 km. It is hypothesized that this is due to the fact that the bottom atmosphere is disturbed by complex factors and the simple CIRA model has limited ability to simulate the real atmosphere at the bottom. From the data in the figure, it can be seen that the FY-3E occultation receiver can accurately observe the atmospheric information in this GNSS atmospheric occultation simulation system, which is in line with the actual results. Therefore, it can be judged that the approach to evaluate the GNSS-RO signal receiver performance in terms of the ground-based atmospheric occultation simulation system is valid.
3.2. Comparison of Temperatures Derived from the CIRA Model and the Receiver Inversion Module
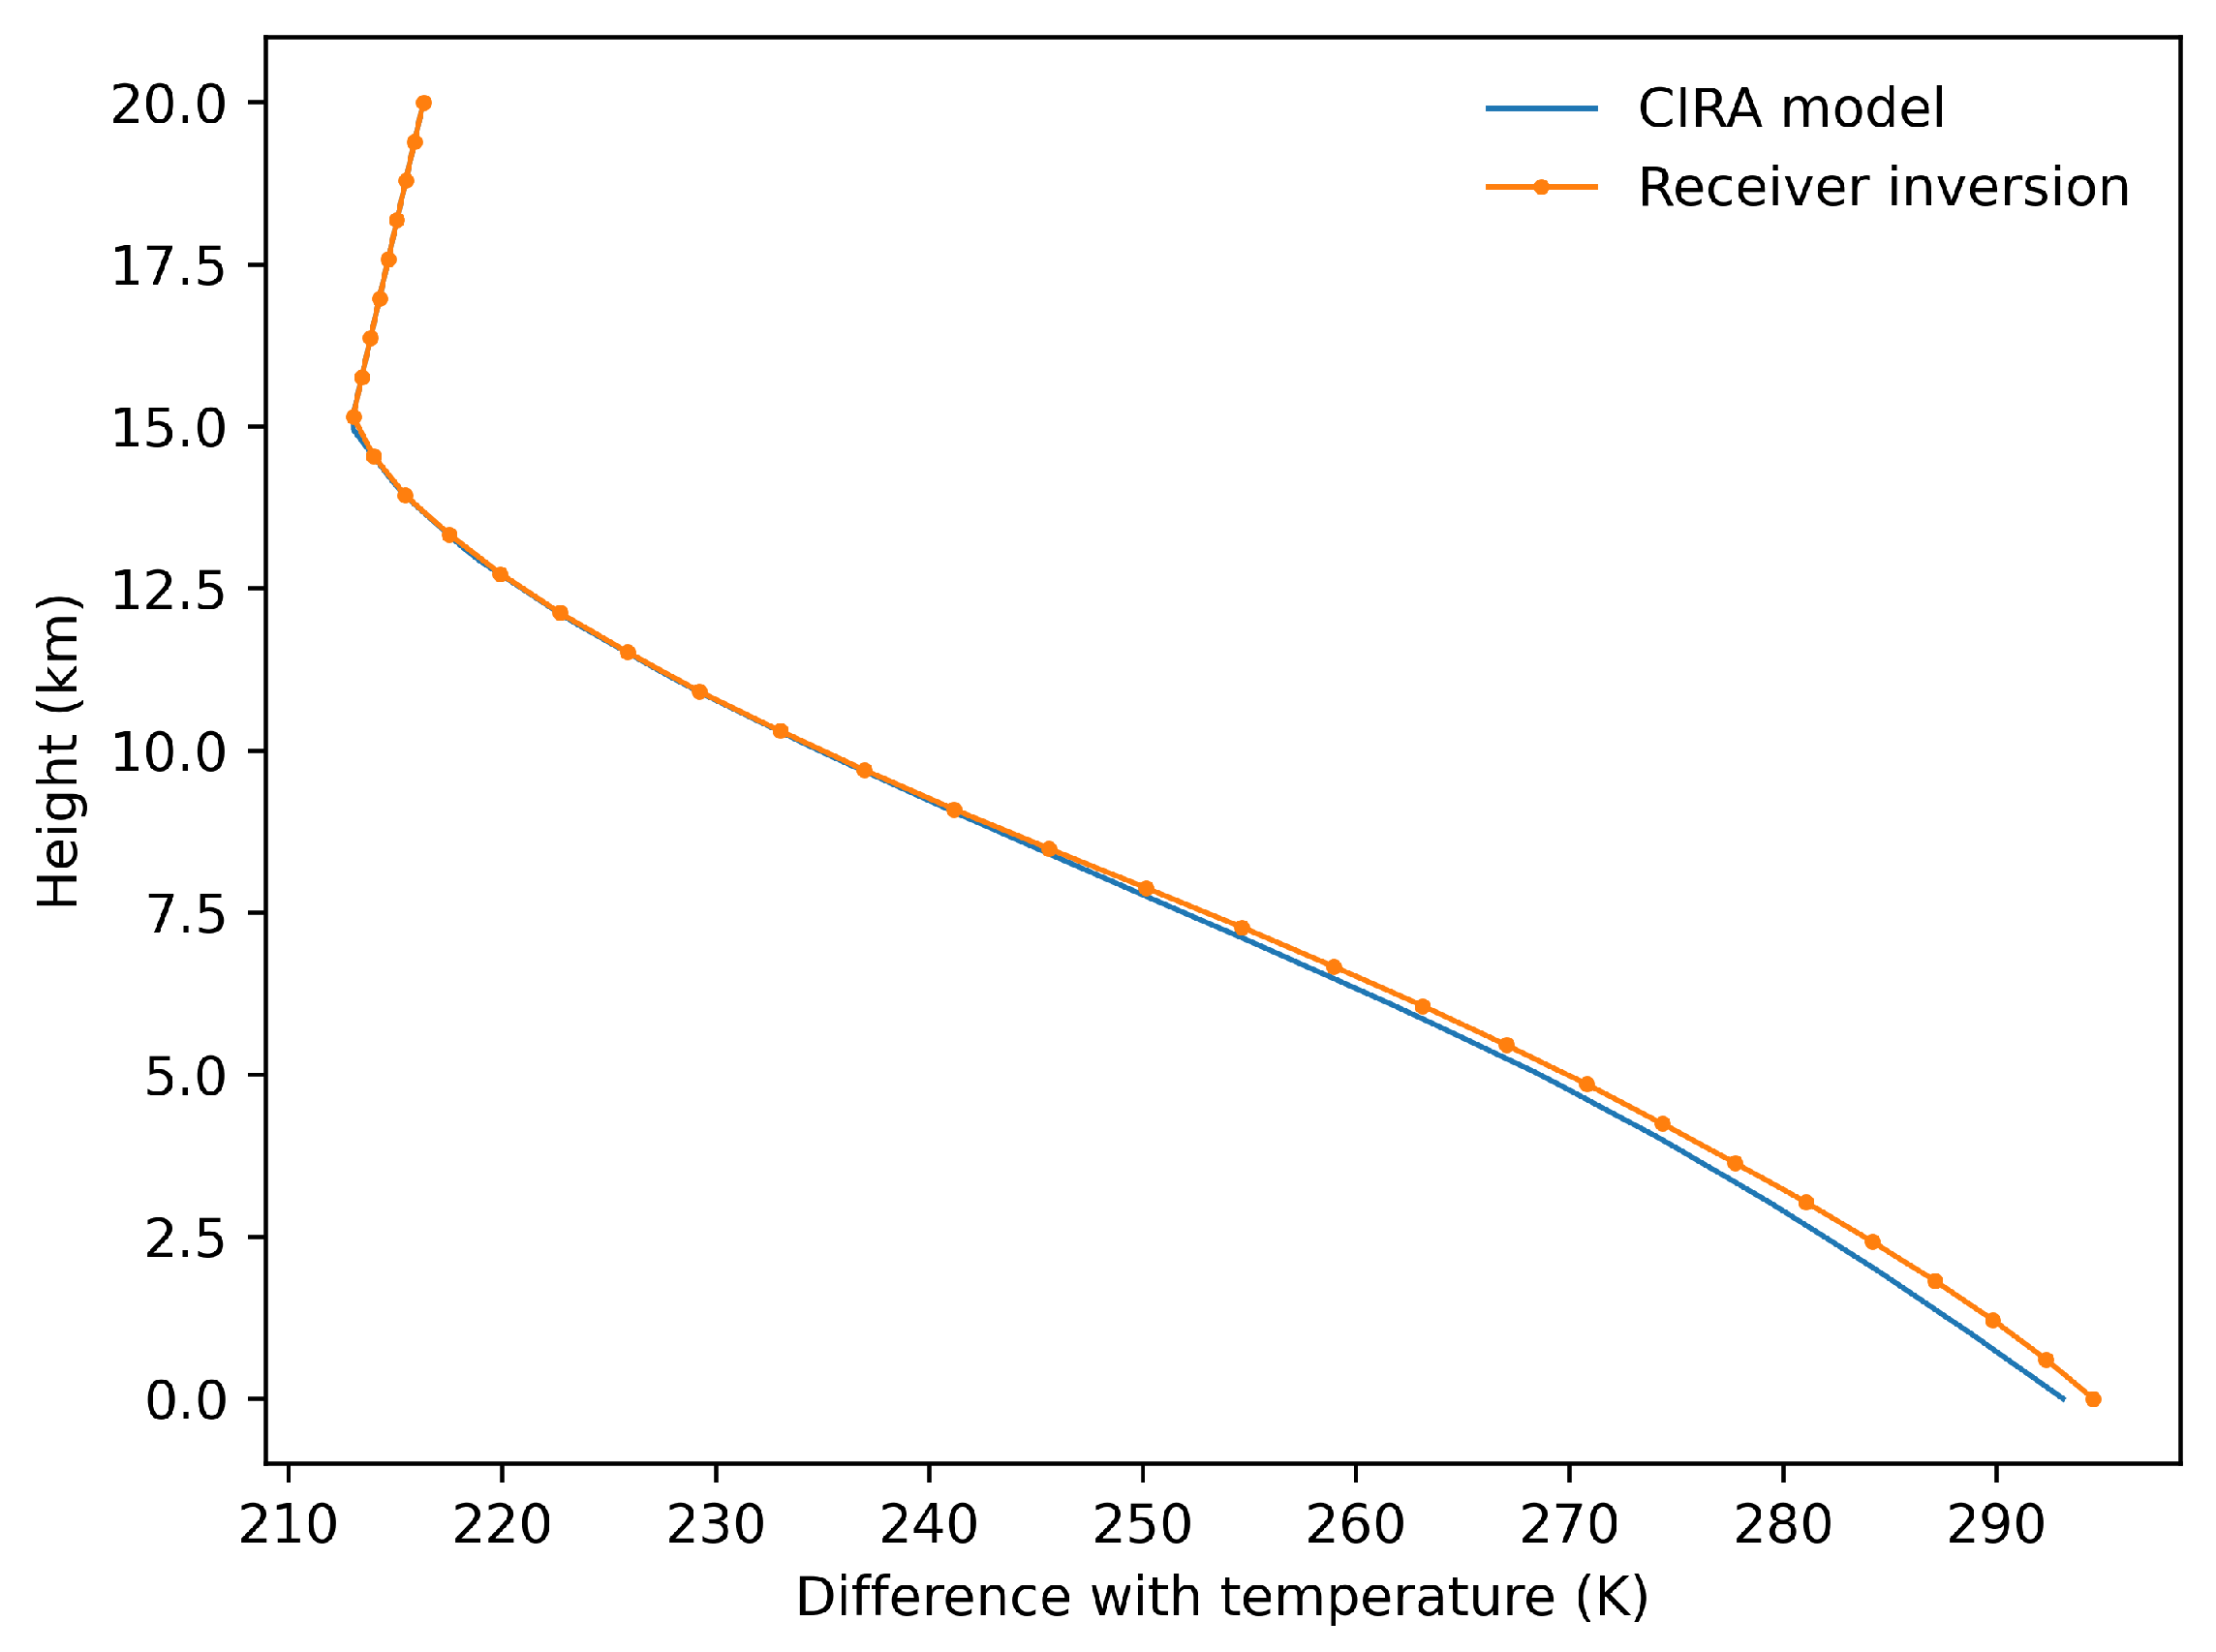
Figure 8 shows the comparison between the temperatures obtained by the CIRA model and the inversion algorithm in the altitude range of 0–20 km, with the blue curve representing the temperature obtained by the CIRA model and the orange curve representing the temperature obtained by the inversion algorithm. The results show that the results obtained by the receiver through the inversion algorithm are very close to those obtained by the meteorological model, which means that the FY-3E occultation receiver can accurately observe the atmospheric information in this GNSS atmospheric occultation simulation system, which is consistent with the actual results. Therefore, it can be judged that the approach to evaluate the GNSS-RO signal receiver performance in terms of the ground-based atmospheric occultation simulation system is valid.
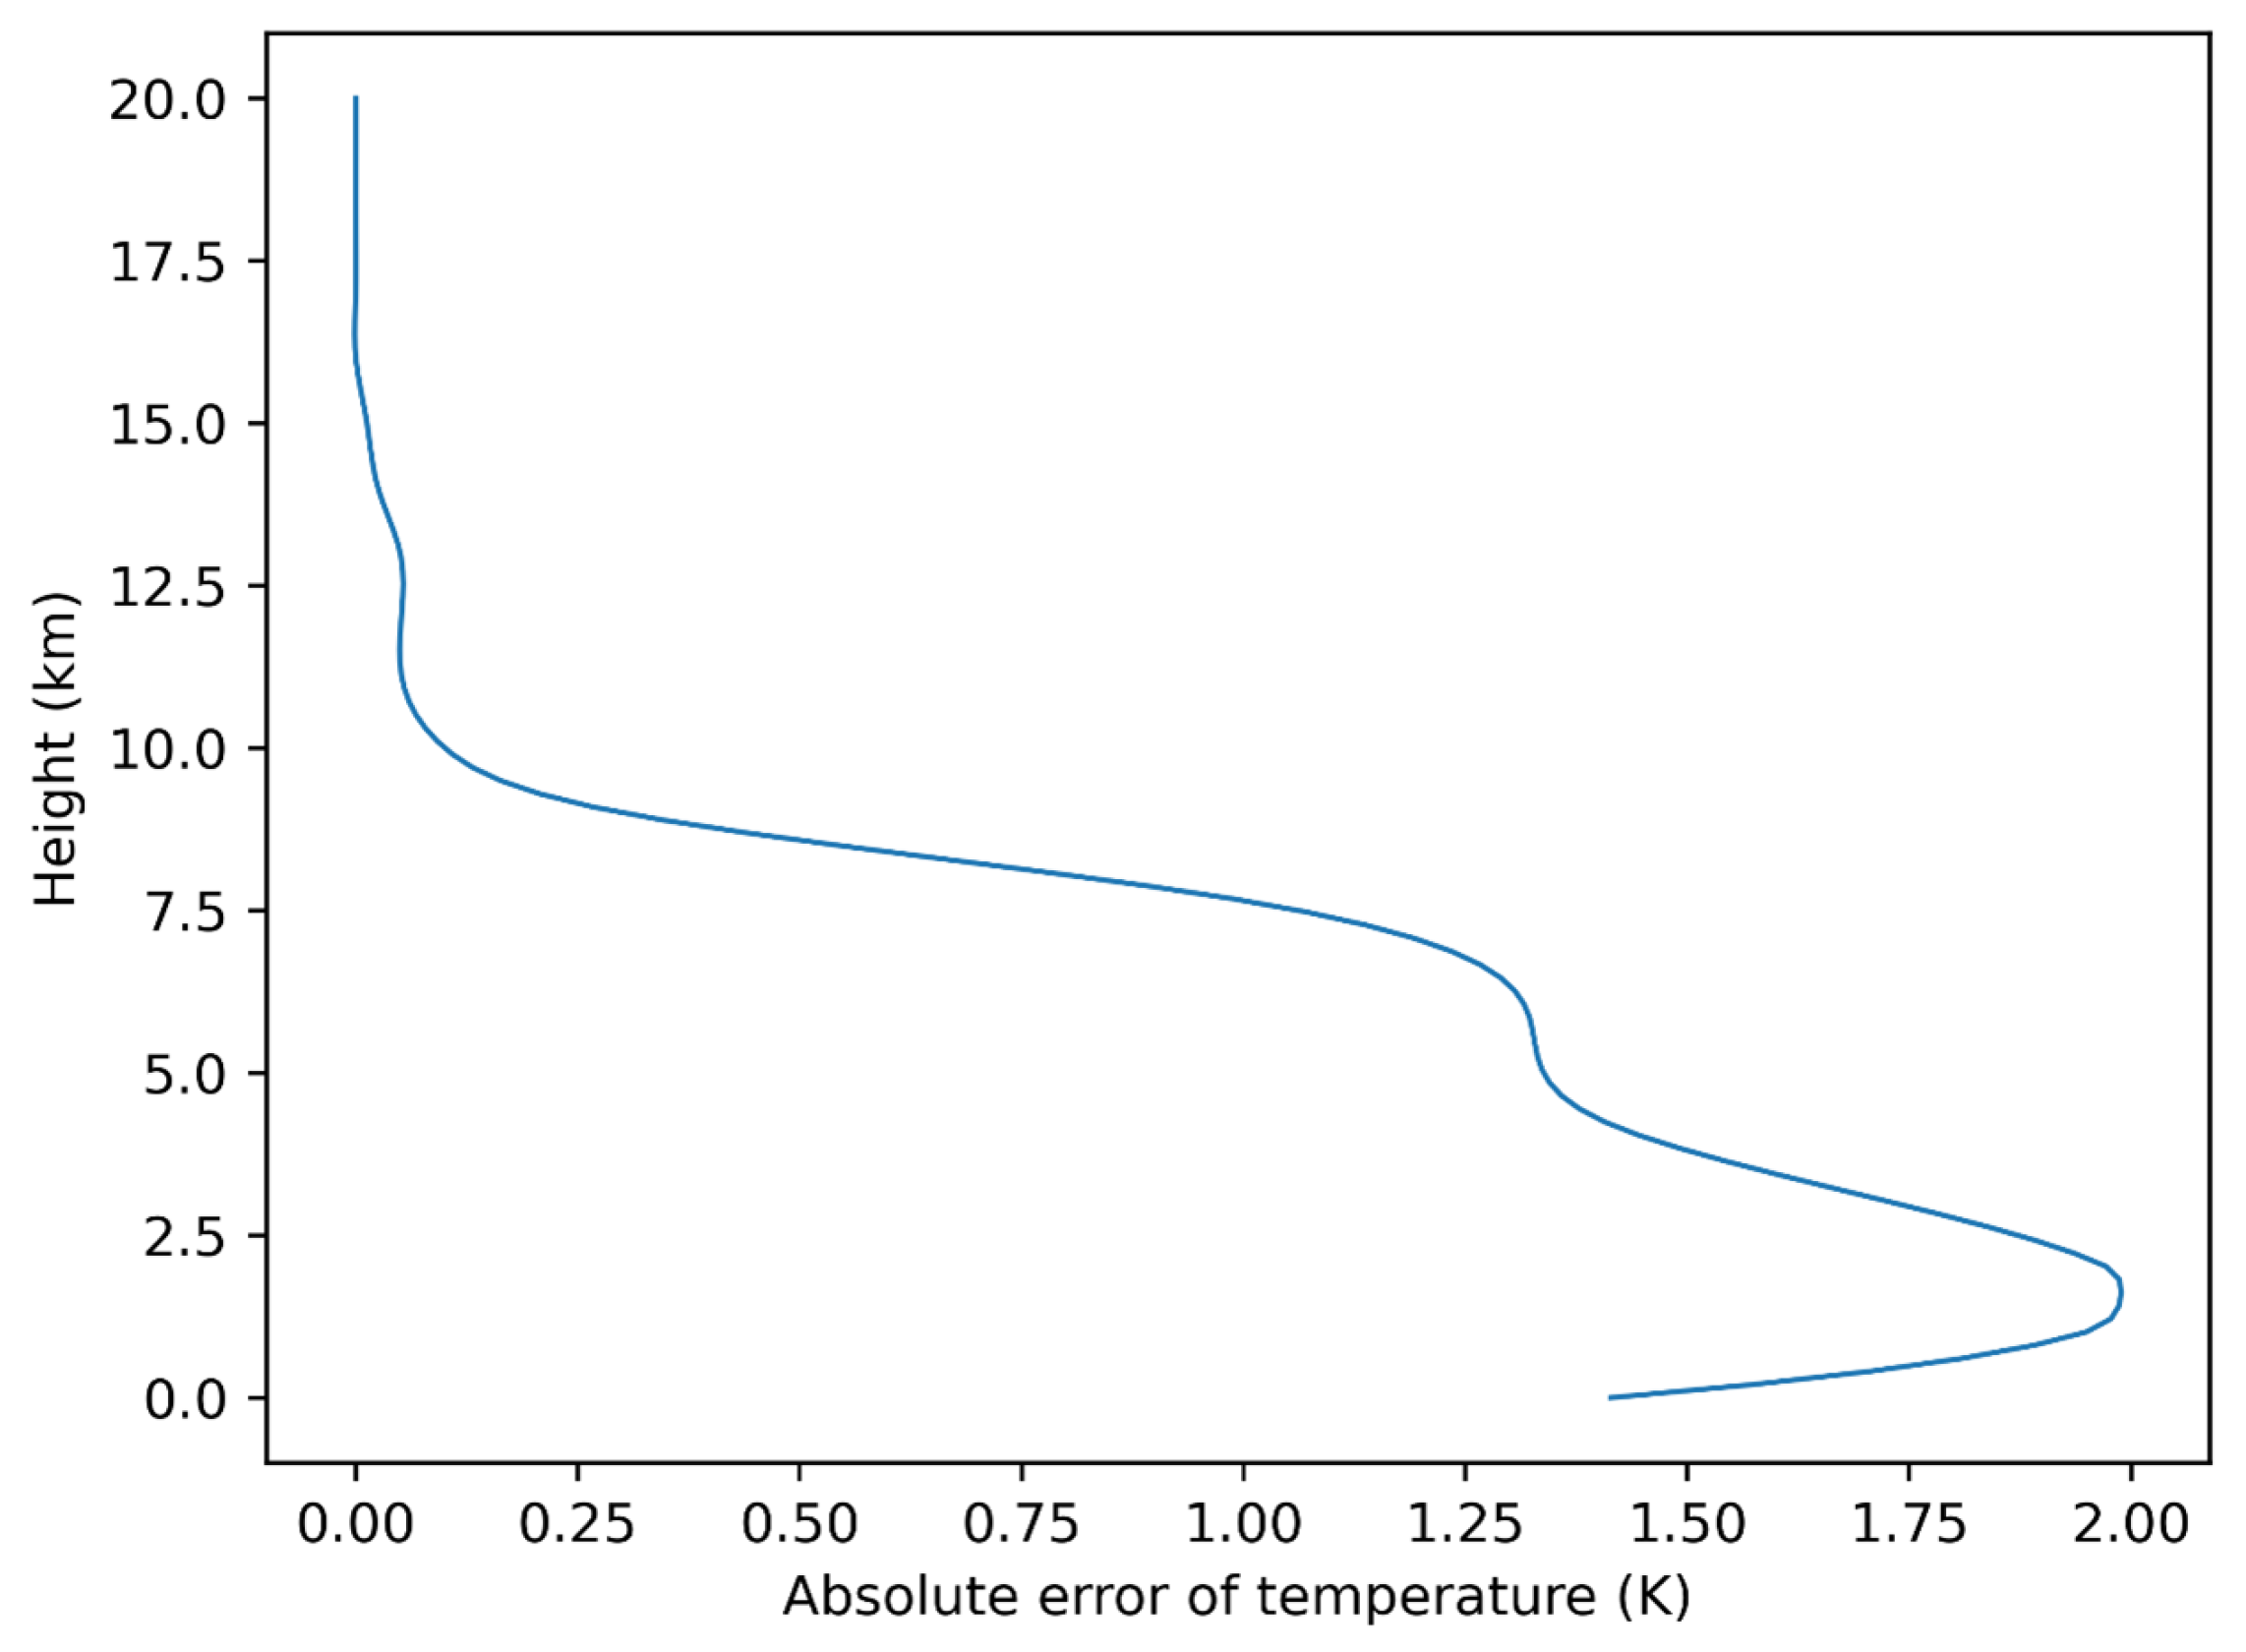
Figure 9 shows the absolute error of the temperature obtained by the inversion algorithm relative to the temperature obtained by the CIRA model in the altitude range of 0–20 km, with the horizontal axis representing the absolute error of the temperature and the axis coordinates representing the altitude. The smaller the absolute error of temperature is, the closer the atmospheric observation data inverted by the GNSS-RO signal receiver using occultation data are to the real value and the better the performance of the receiver is. The absolute error in temperature is larger in the bottom atmosphere (0–10 km) and smaller in the upper atmosphere (10–20 km), but the absolute error in temperature is less than 2K in all altitude ranges from 0–20 km. It is hypothesized that this is because the bottom atmosphere is subjected to the interference of complex factors, and the simulation ability of the simple CIRA model for the real atmosphere of the bottom layer is limited. From the data in the figure, we can see that the FY-3E occultation receiver can accurately observe the atmospheric information in this GNSS atmospheric occultation simulation system, which is in line with the actual results. Therefore, it can be judged that the approach to evaluate the GNSS-RO signal receiver performance in terms of the ground-based atmospheric occultation simulation system is valid.
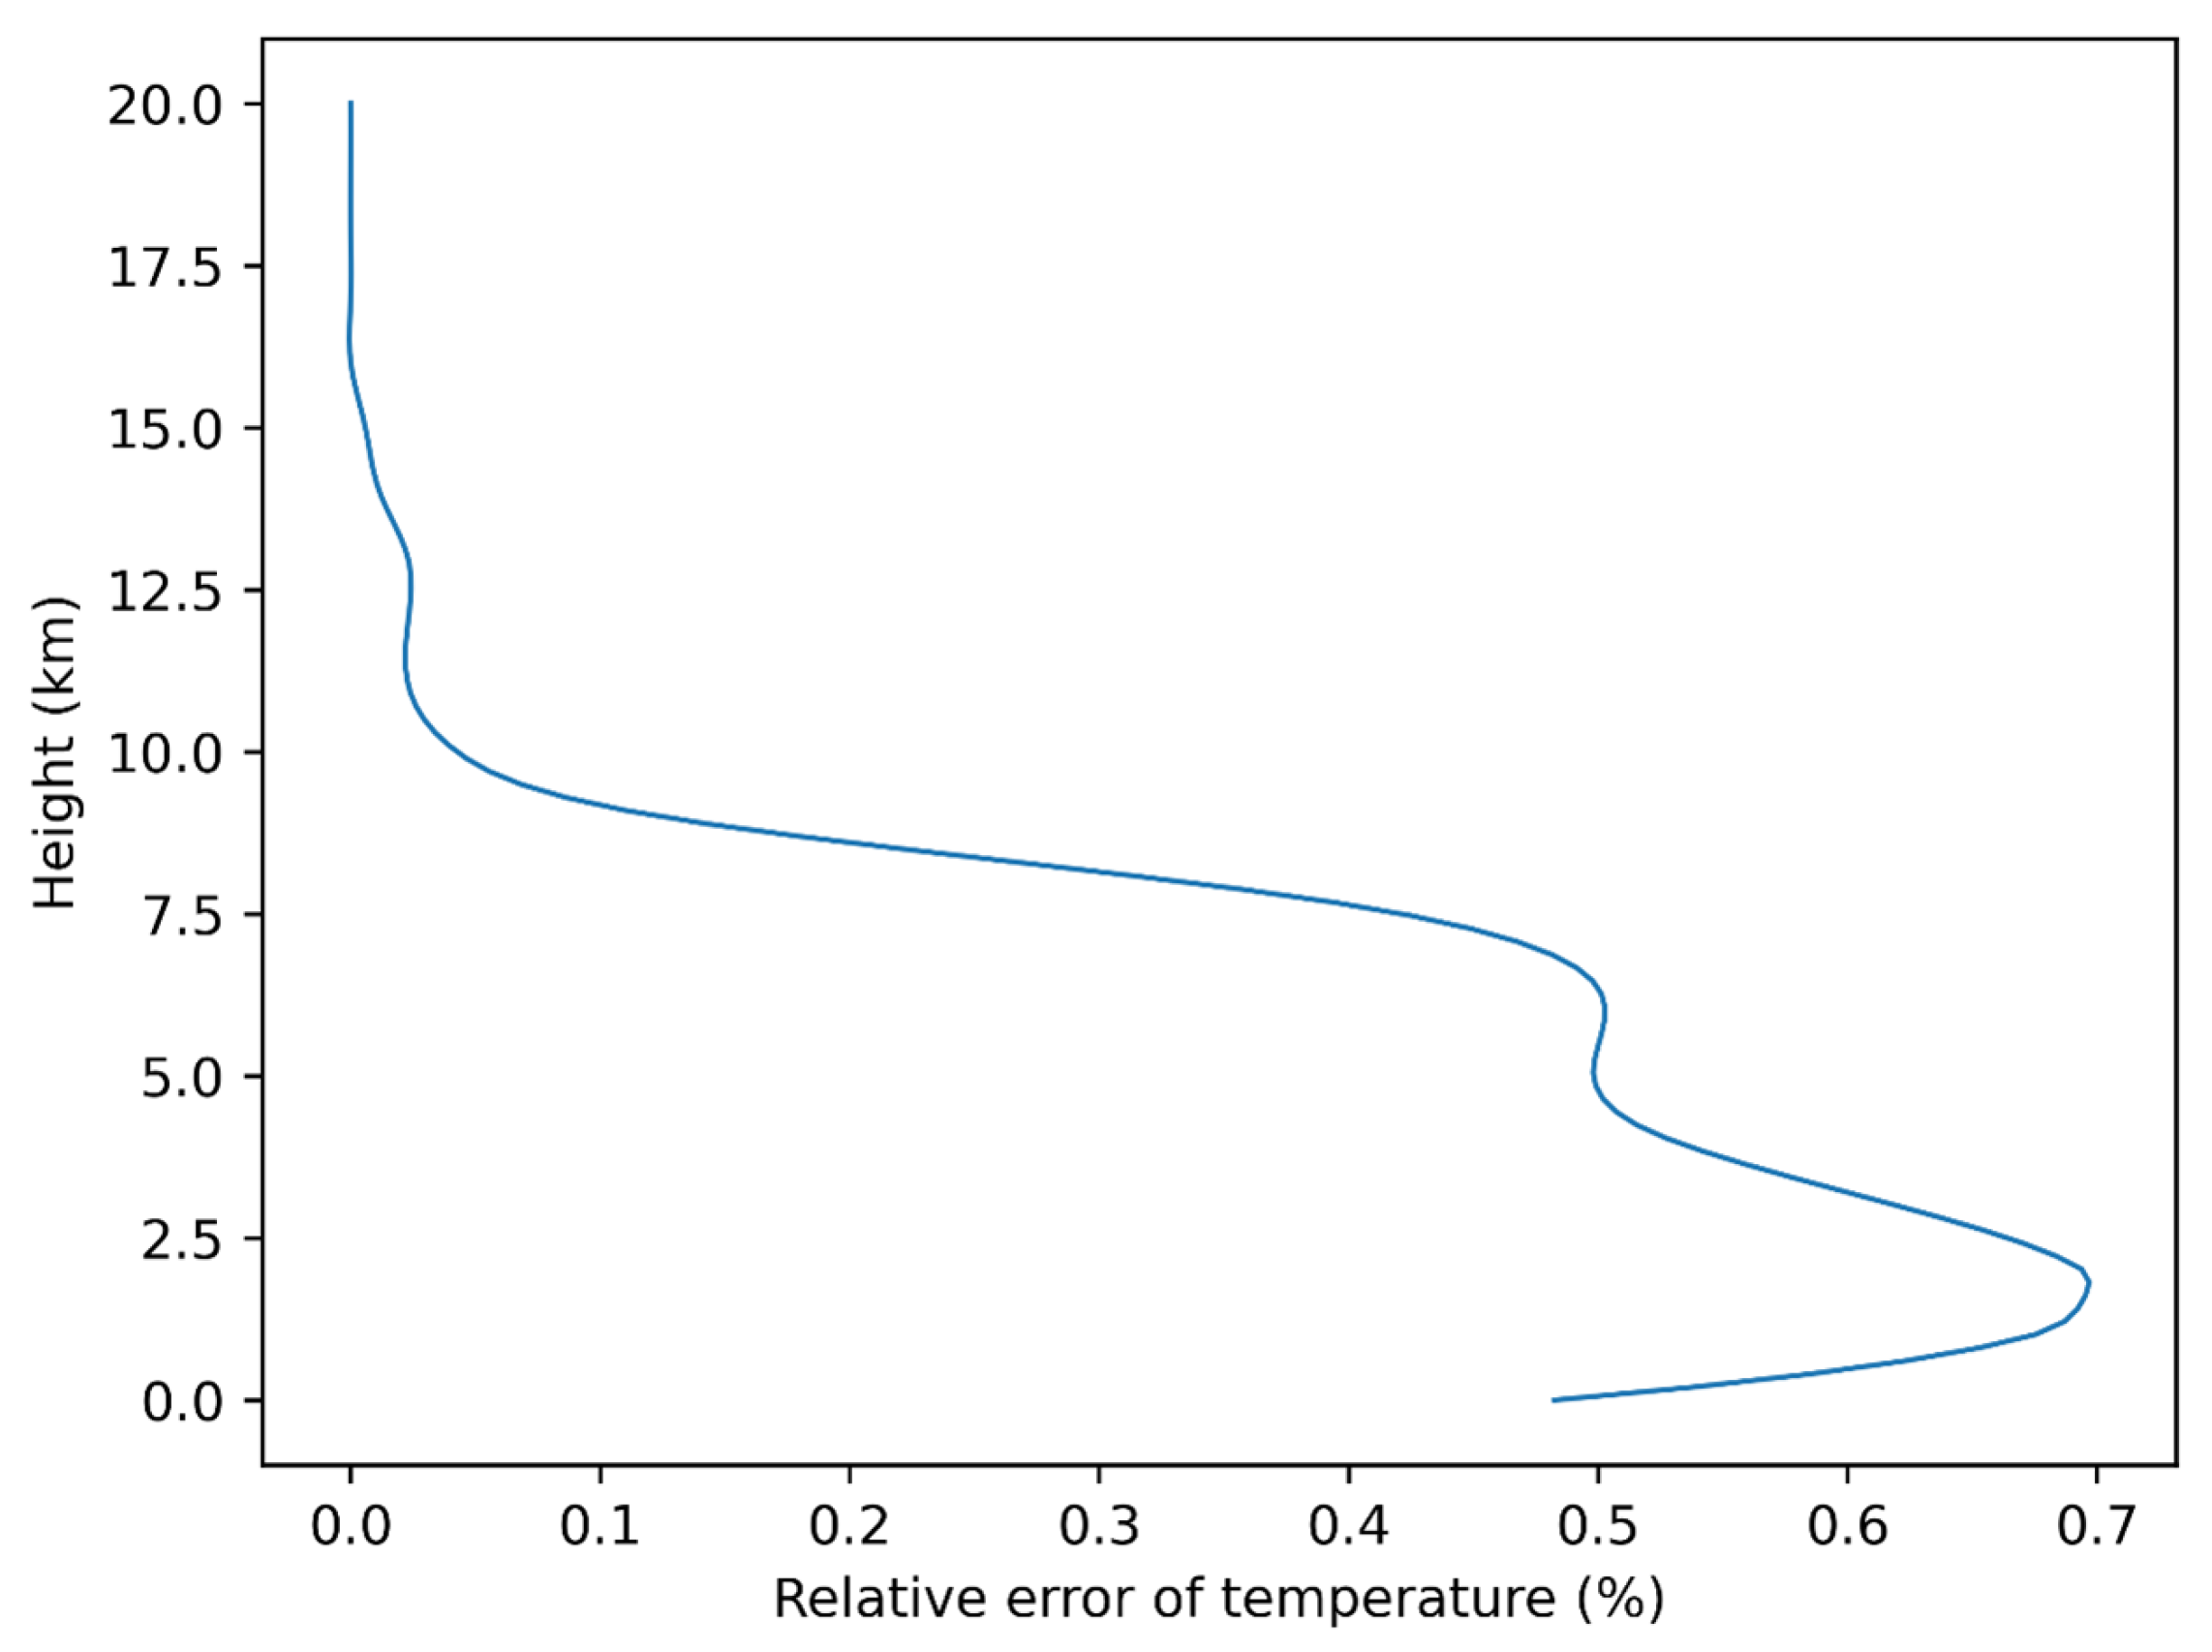
Figure 10 shows the relative error of the temperature obtained by the inversion algorithm relative to the temperature obtained by the CIRA model in the altitude range of 0–20 km, with the horizontal axis representing the relative error of the temperature and the axis coordinates representing the altitude. The smaller the relative error of temperature, the closer the atmospheric observations inverted by the GNSS-RO signal receiver using occultation data are to the real value and the better the performance of the receiver. The relative error of temperature is large in the range of the bottom atmosphere (0–10 km) and small in the range of the upper atmosphere (10–20 km), but the relative error of temperature is less than 1.1% in all altitude ranges from 0–20 km. It is hypothesized that this is due to the fact that the bottom atmosphere is disturbed by complex factors and the simple CIRA model has limited ability to simulate the real atmosphere at the bottom. From the data in the figure, we can see that the FY-3E occultation receiver can accurately observe the atmospheric information in this GNSS atmospheric occultation simulation system, which is in line with the actual results. Therefore, it can be judged that the approach to evaluate the GNSS-RO signal receiver performance in terms of the ground-based atmospheric occultation simulation system is valid.
3.3. Comparison of Pressures Derived from the CIRA Model and the Receiver Inversion Module
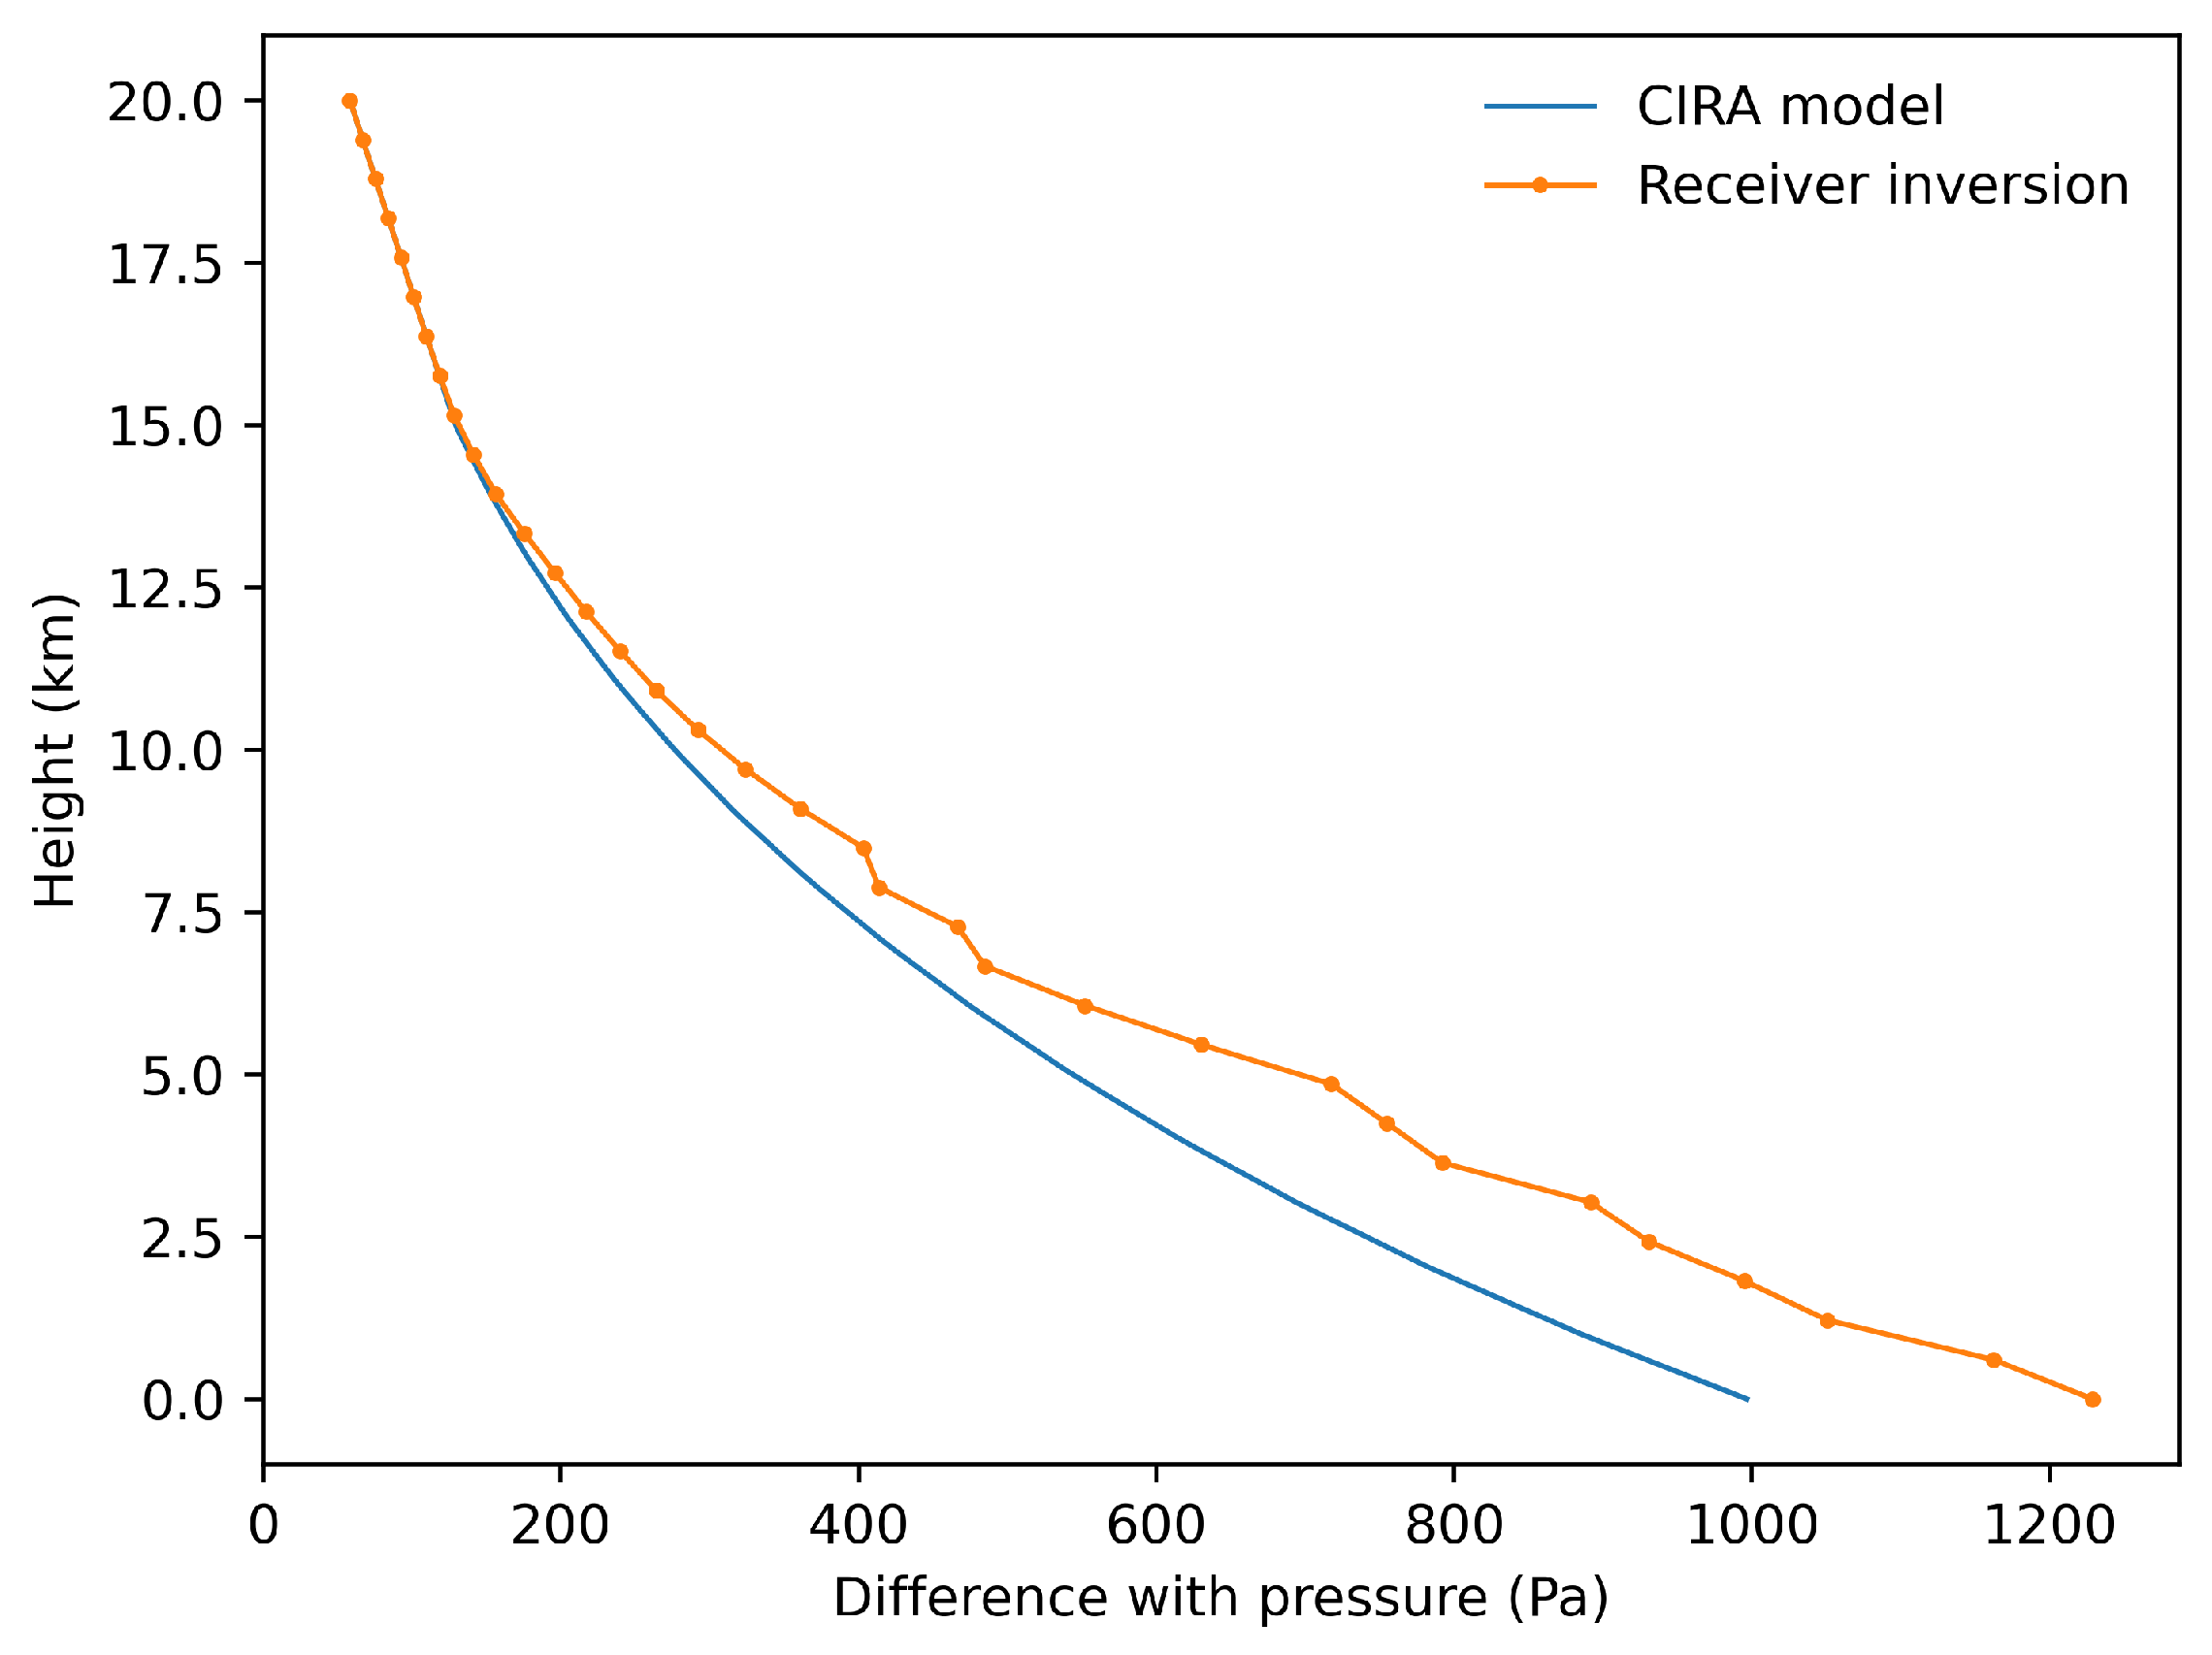
Figure 11 shows the comparison between the pressures obtained by the CIRA model and the inversion algorithm in the altitude range of 0–20 km, with the blue curve representing the pressure obtained by the CIRA model and the orange curve representing the pressure obtained by the inversion algorithm. The results show that the results obtained by the receiver through the inversion algorithm are very close to those obtained by the meteorological model, which means that the FY-3E occultation receiver can accurately observe the atmospheric information in this GNSS atmospheric occultation simulation system, which is consistent with the actual results. Therefore, it can be judged that the approach to evaluate the GNSS-RO signal receiver performance in terms of the ground-based atmospheric occultation simulation system is valid.
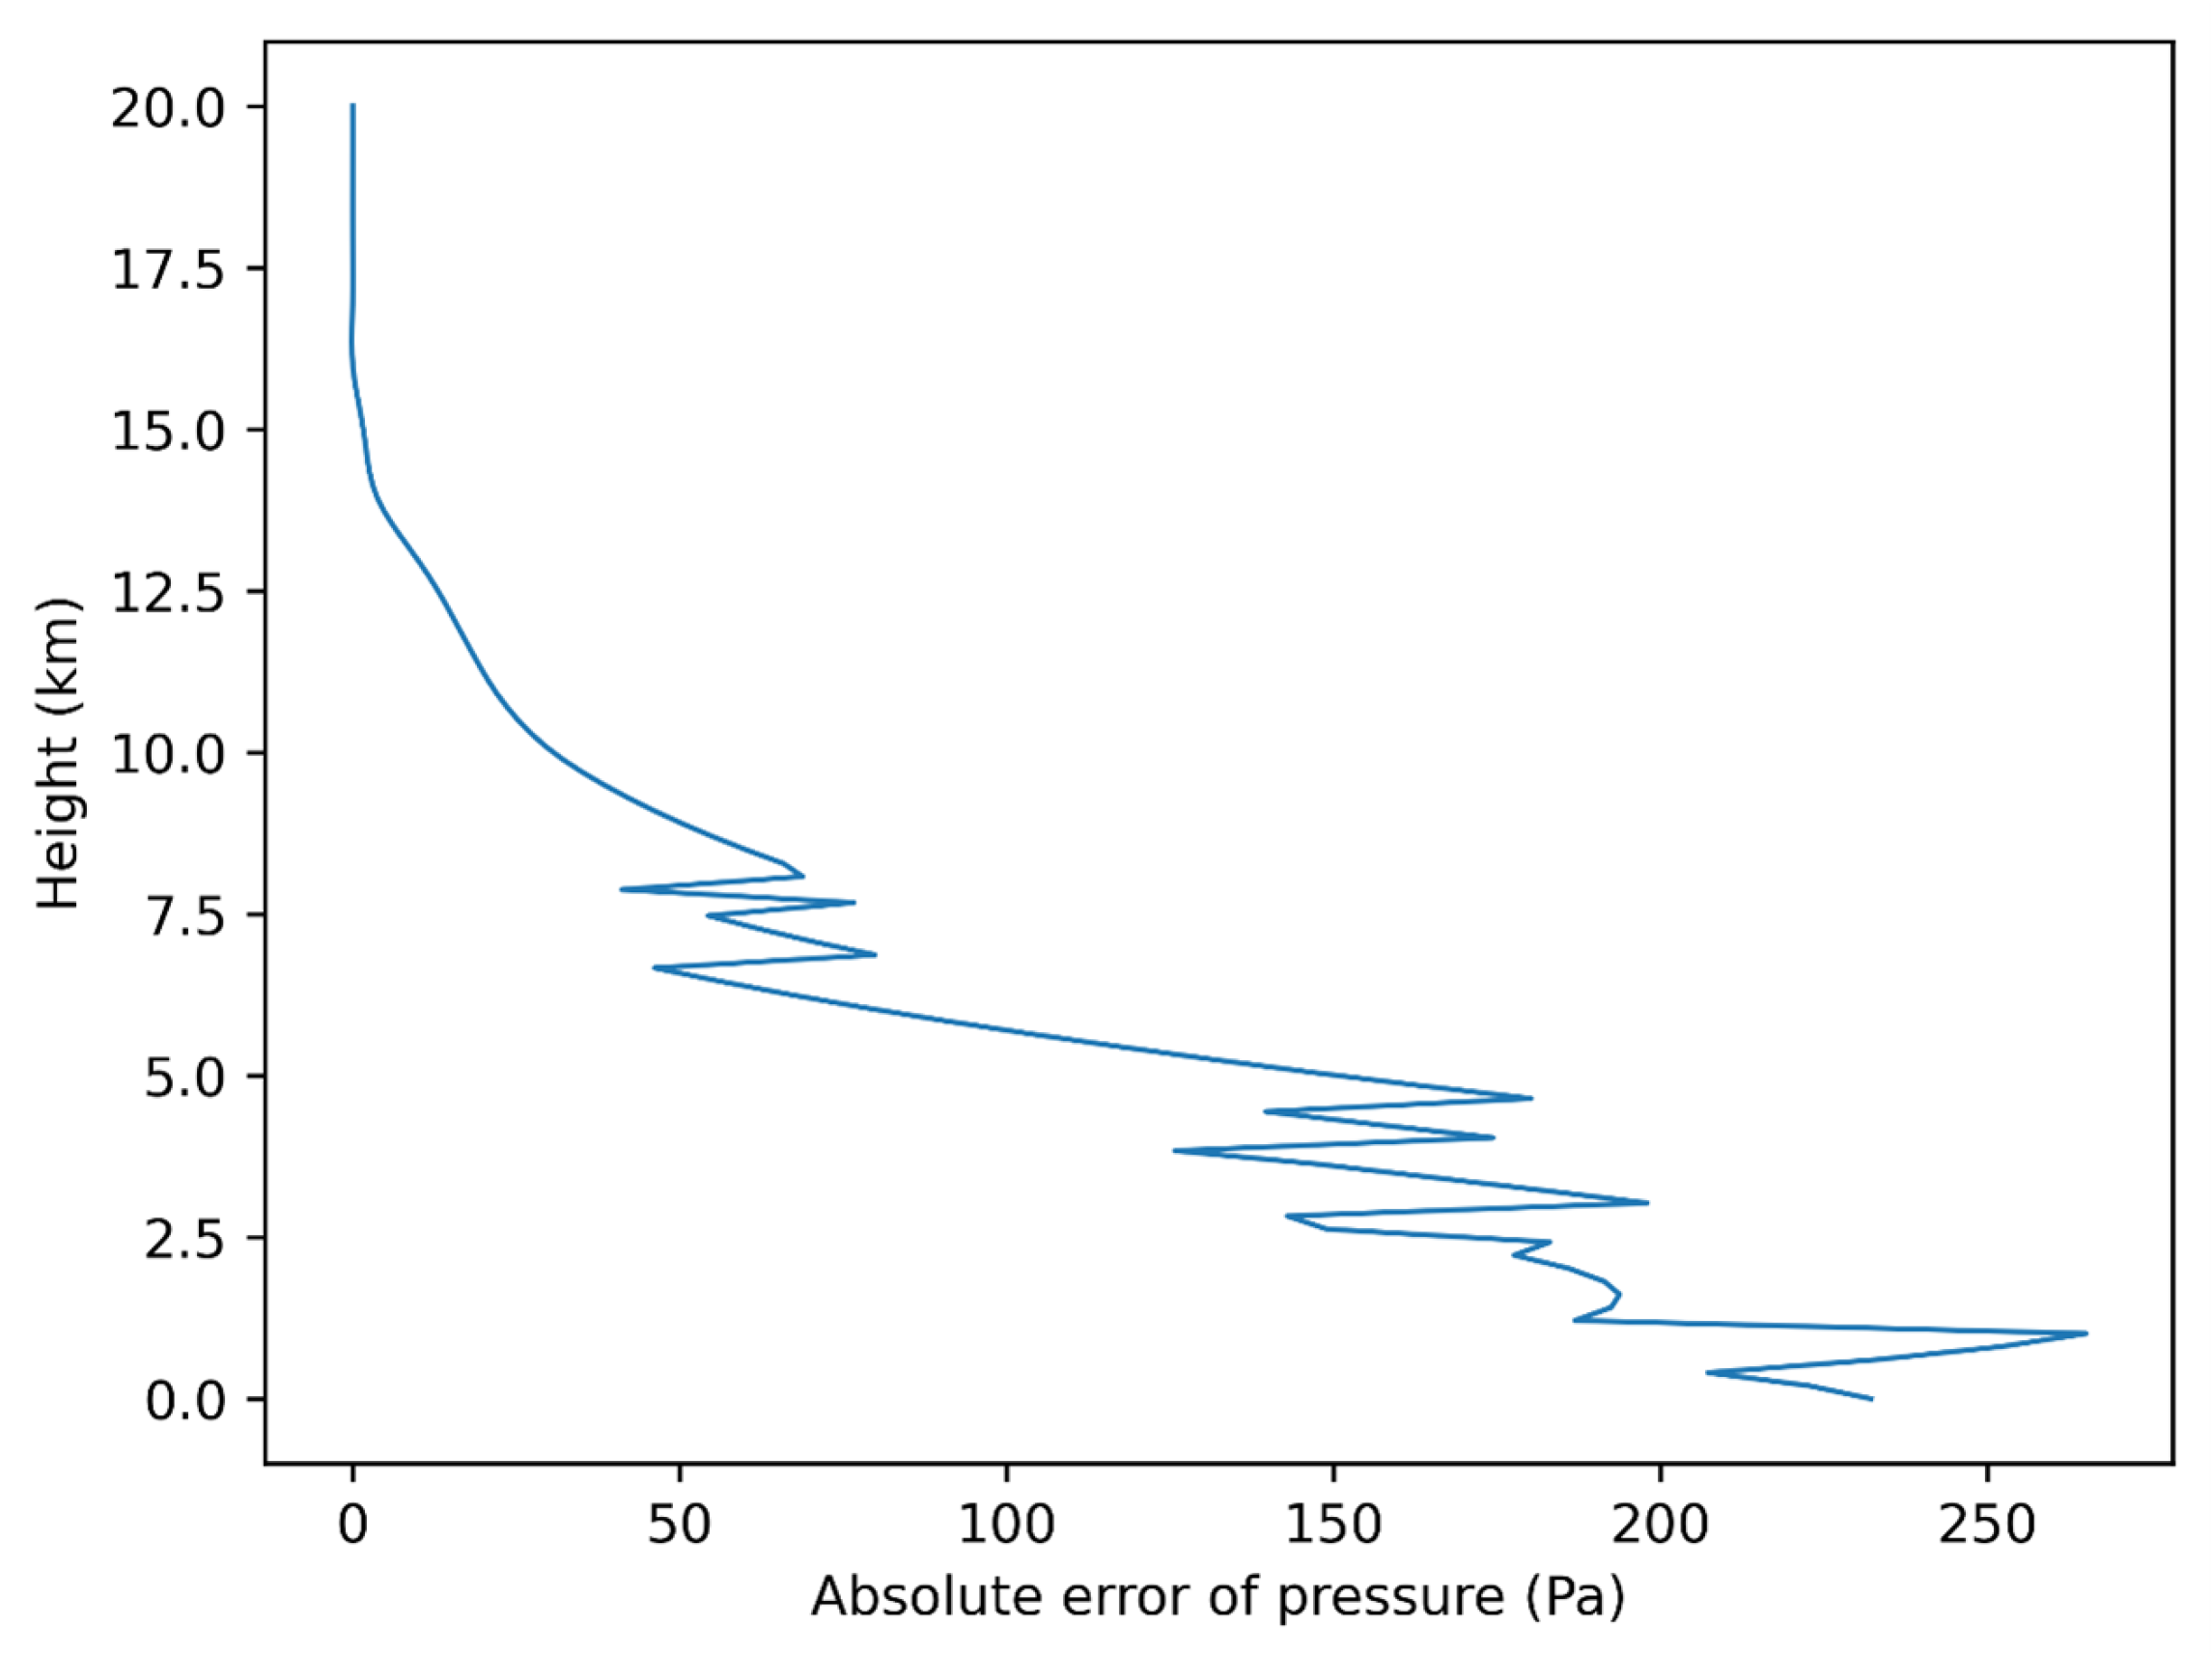
Figure 12 shows the absolute error of the pressure obtained by the inversion algorithm relative to the pressure obtained by the CIRA model in the altitude range of 0–20 km, with the horizontal axis representing the absolute error of the pressure and the axial coordinates representing the altitude. The smaller the absolute error of pressure is, the closer the atmospheric observation data inverted by the GNSS-RO signal receiver using occultation data are to the real value and the better the performance of the receiver is. The absolute error of the pressure is larger in the range of the bottom atmosphere (0–10 km) and smaller in the range of the upper atmosphere (10–20 km), but the absolute error of the pressure in the altitude range of 0–20 km is less than 300 K. It is hypothesized that this is due to the fact that the values obtained by the receiver inversion are interfered with by a number of conditions, including the tracking error of the receiver, the receiver’s clock differences, numerical integration errors in the inversion process, and many other factors superimposed on the results. From the data in the figure, it can be seen that the FY-3E occultation receiver can accurately observe the atmospheric information in this GNSS atmospheric occultation simulation system, which is consistent with the actual results. Therefore, it can be judged that the approach to evaluate the GNSS-RO signal receiver performance in terms of the ground-based atmospheric occultation simulation system is valid.
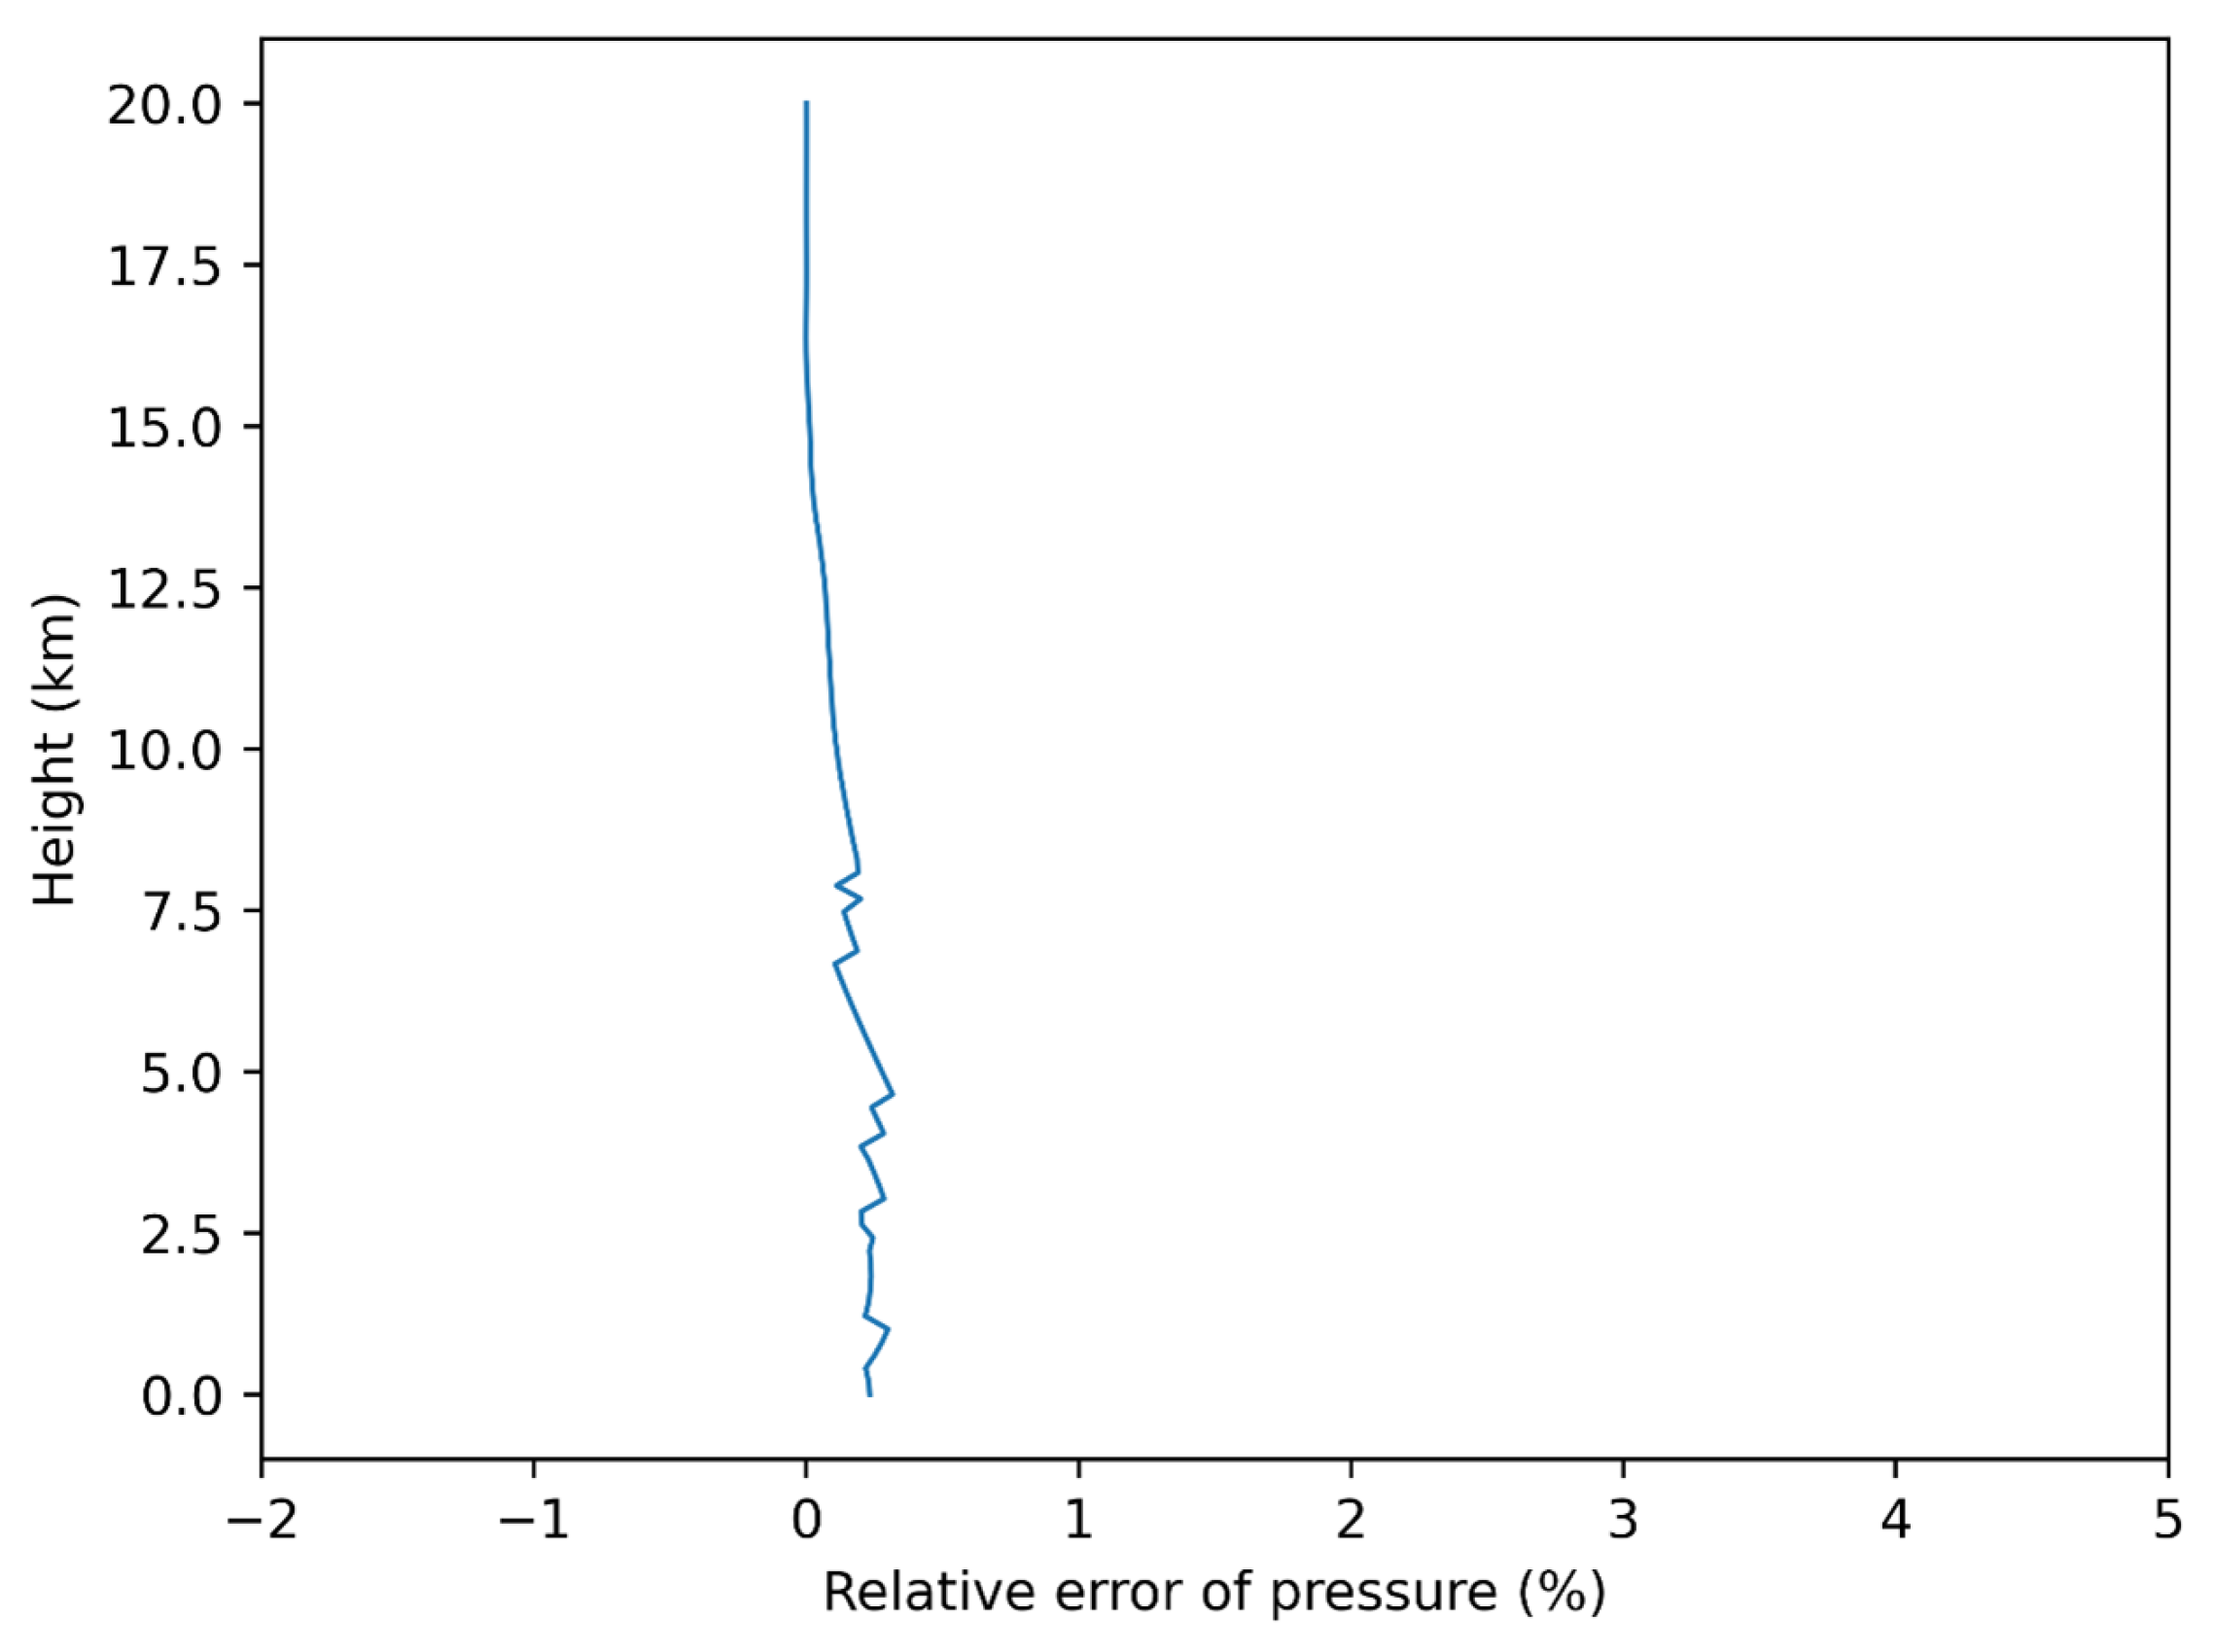
Figure 13 shows the relative error of the pressure obtained by the inversion algorithm relative to the pressure obtained by the CIRA model in the altitude range of 0–20 km, with the horizontal axis representing the relative error of the pressure and the axial coordinates representing the altitude. The smaller the relative error of pressure, the closer the atmospheric observation data inverted by the GNSS-RO signal receiver using occultation data are to the real value and the better the performance of the receiver. The relative error of the pressure is larger in the range of the bottom atmosphere (0–10 km) and smaller in the range of the upper atmosphere (10–20 km), but the relative error of the pressure is less than 1% in the altitude range of 0–20 km. It is hypothesized that this is due to the fact that the values obtained from the receiver inversion are disturbed by many conditions, including receiver tracking errors, receiver clock differences, numerical integration errors during the inversion process, and many other factors superimposed on the results. From the data in the figure, it can be seen that the FY-3E occultation receiver can accurately observe the atmospheric information in this GNSS atmospheric occultation simulation system, which is consistent with the actual results. Therefore, it can be judged that the approach to evaluate the GNSS-RO signal receiver performance in terms of the ground-based atmospheric occultation simulation system is valid.
3.4. Comparison of Refractive Indices Derived from ERA5 Model and Receiver Inversion Module
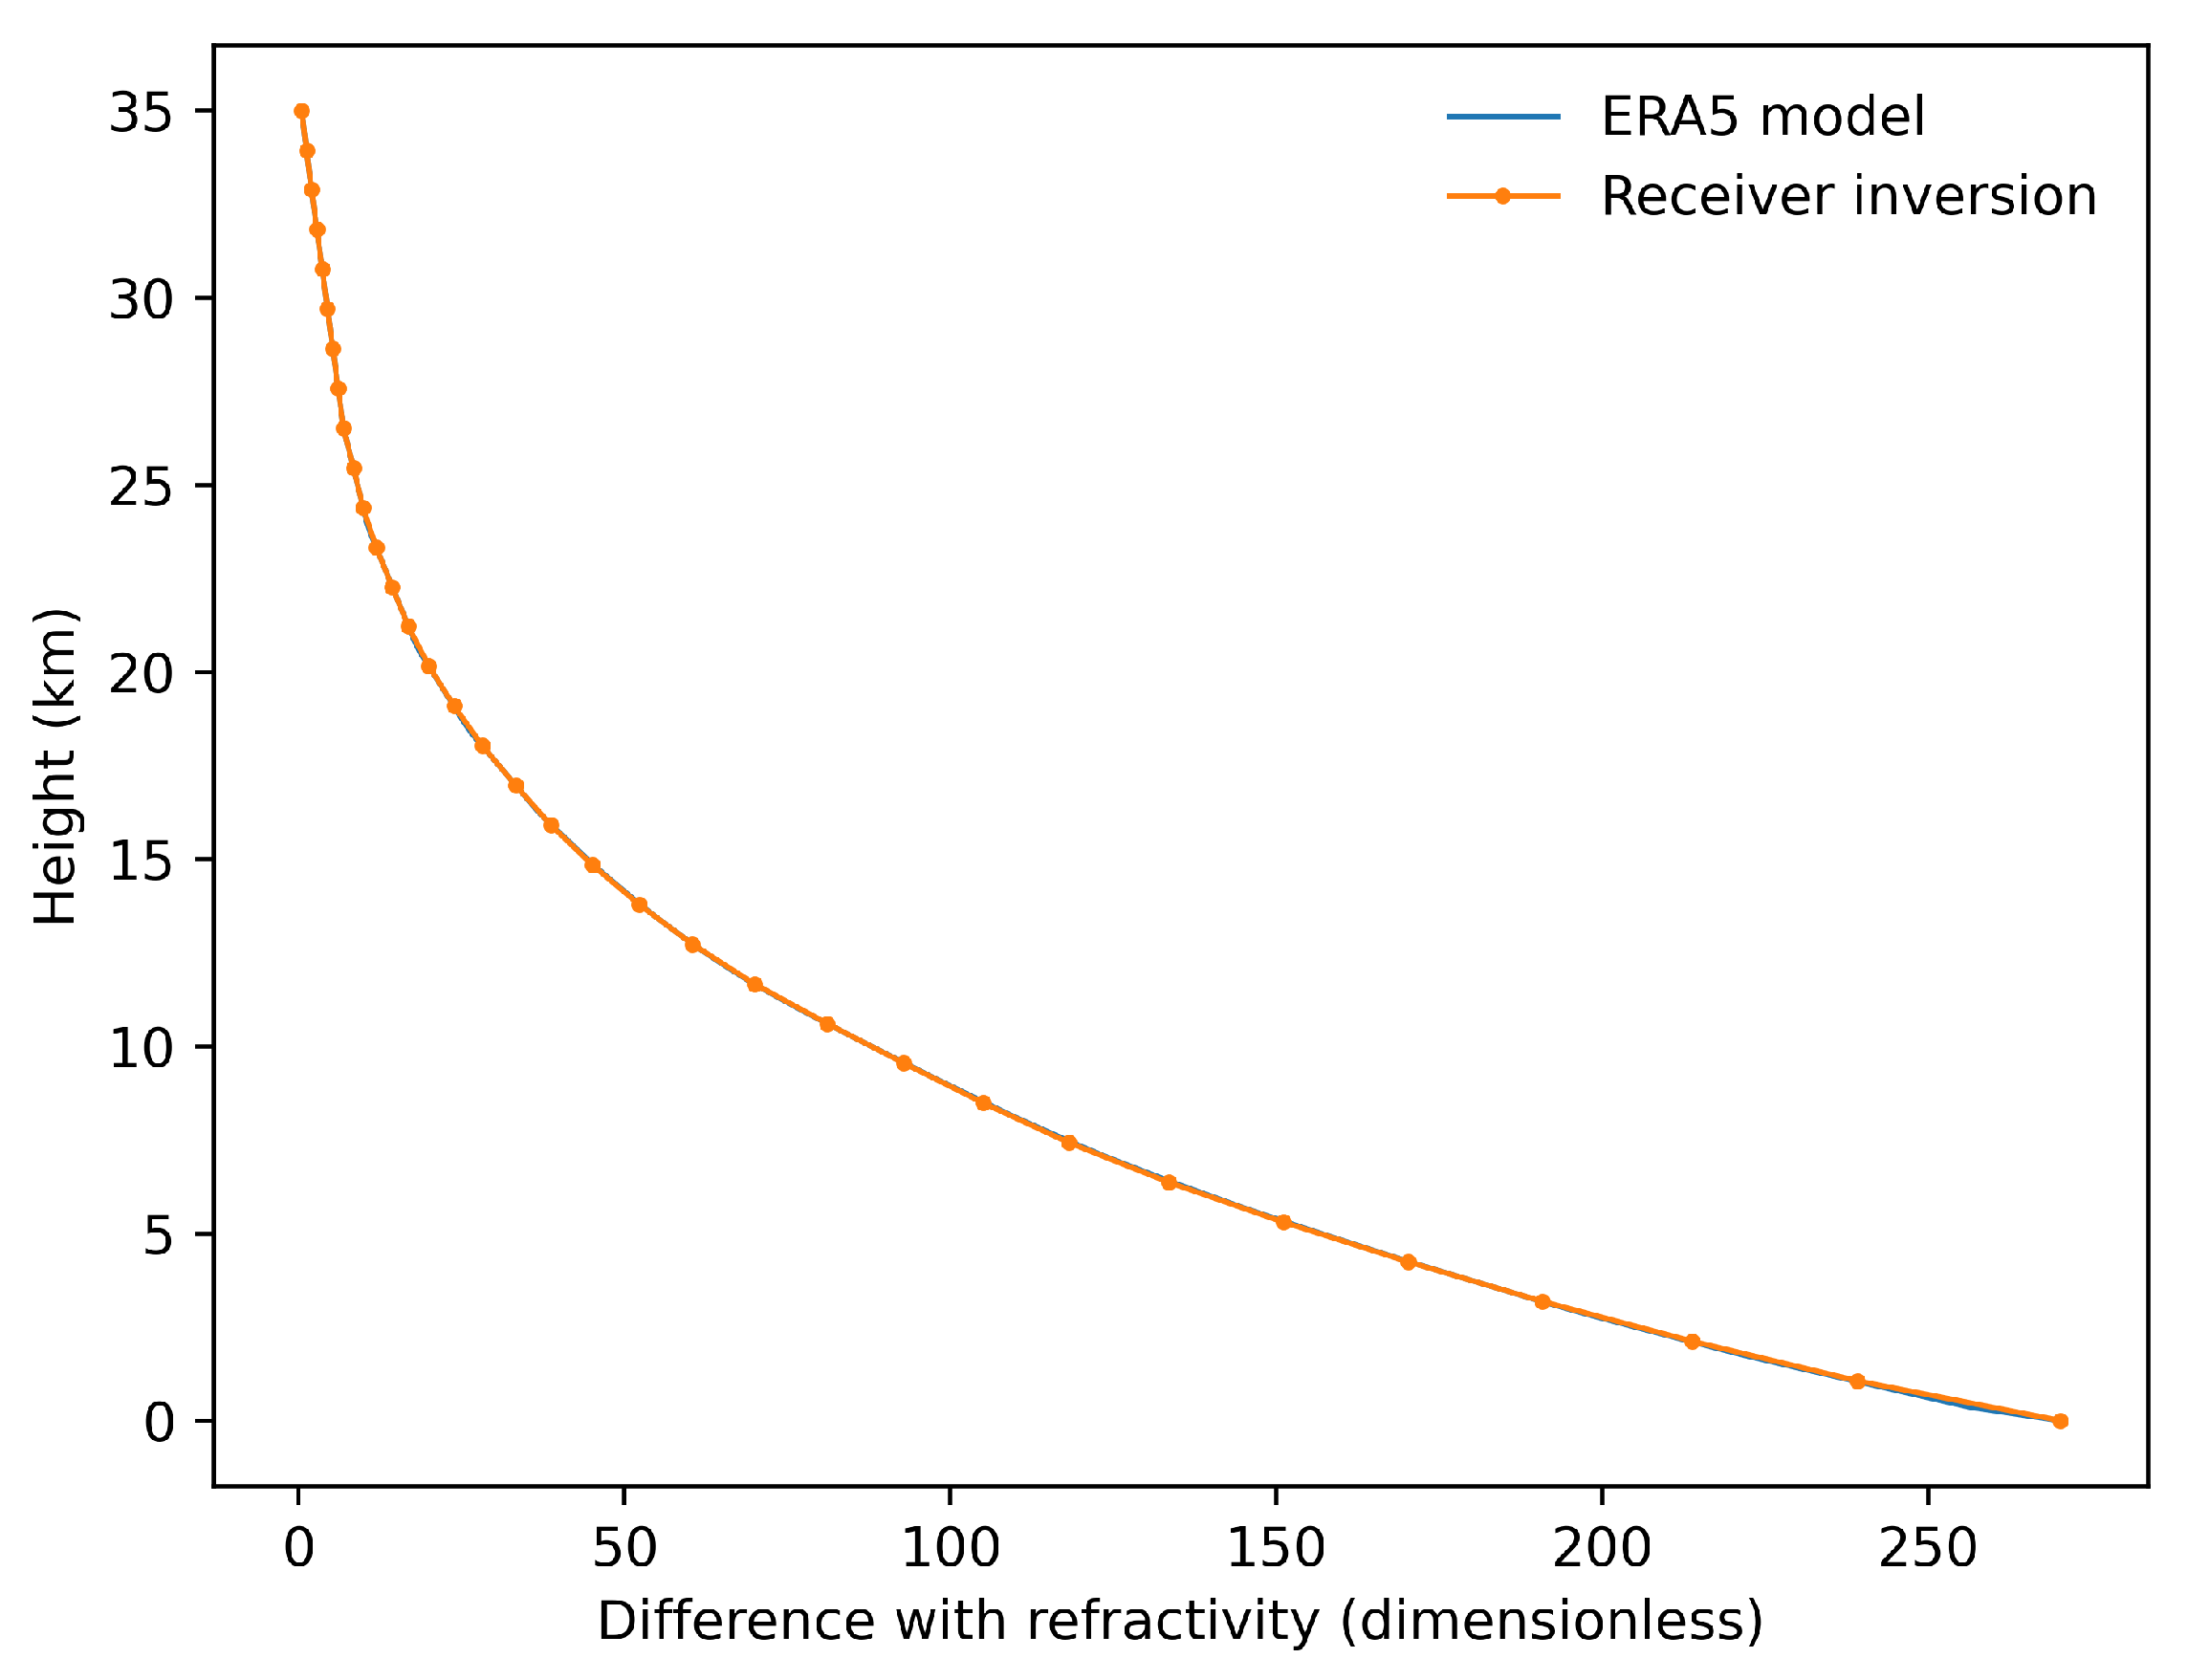
Figure 14 shows the comparison between the refractive indices obtained by the ERA5 model and the inversion algorithm in the altitude range of 0–35 km, with the blue curve representing the refractive indices obtained by the ERA5 model and the orange curve representing the refractive indices obtained by the inversion algorithm. The results show that the results obtained by the receiver through the inversion algorithm are very close to those obtained by the meteorological model, which means that the FY-3E occultation receiver can accurately observe the atmospheric information in this GNSS atmospheric occultation simulation system, which is in line with the actual results. Therefore, it can be judged that the approach to evaluate the GNSS-RO signal receiver performance in terms of the ground-based atmospheric occultation simulation system is valid.
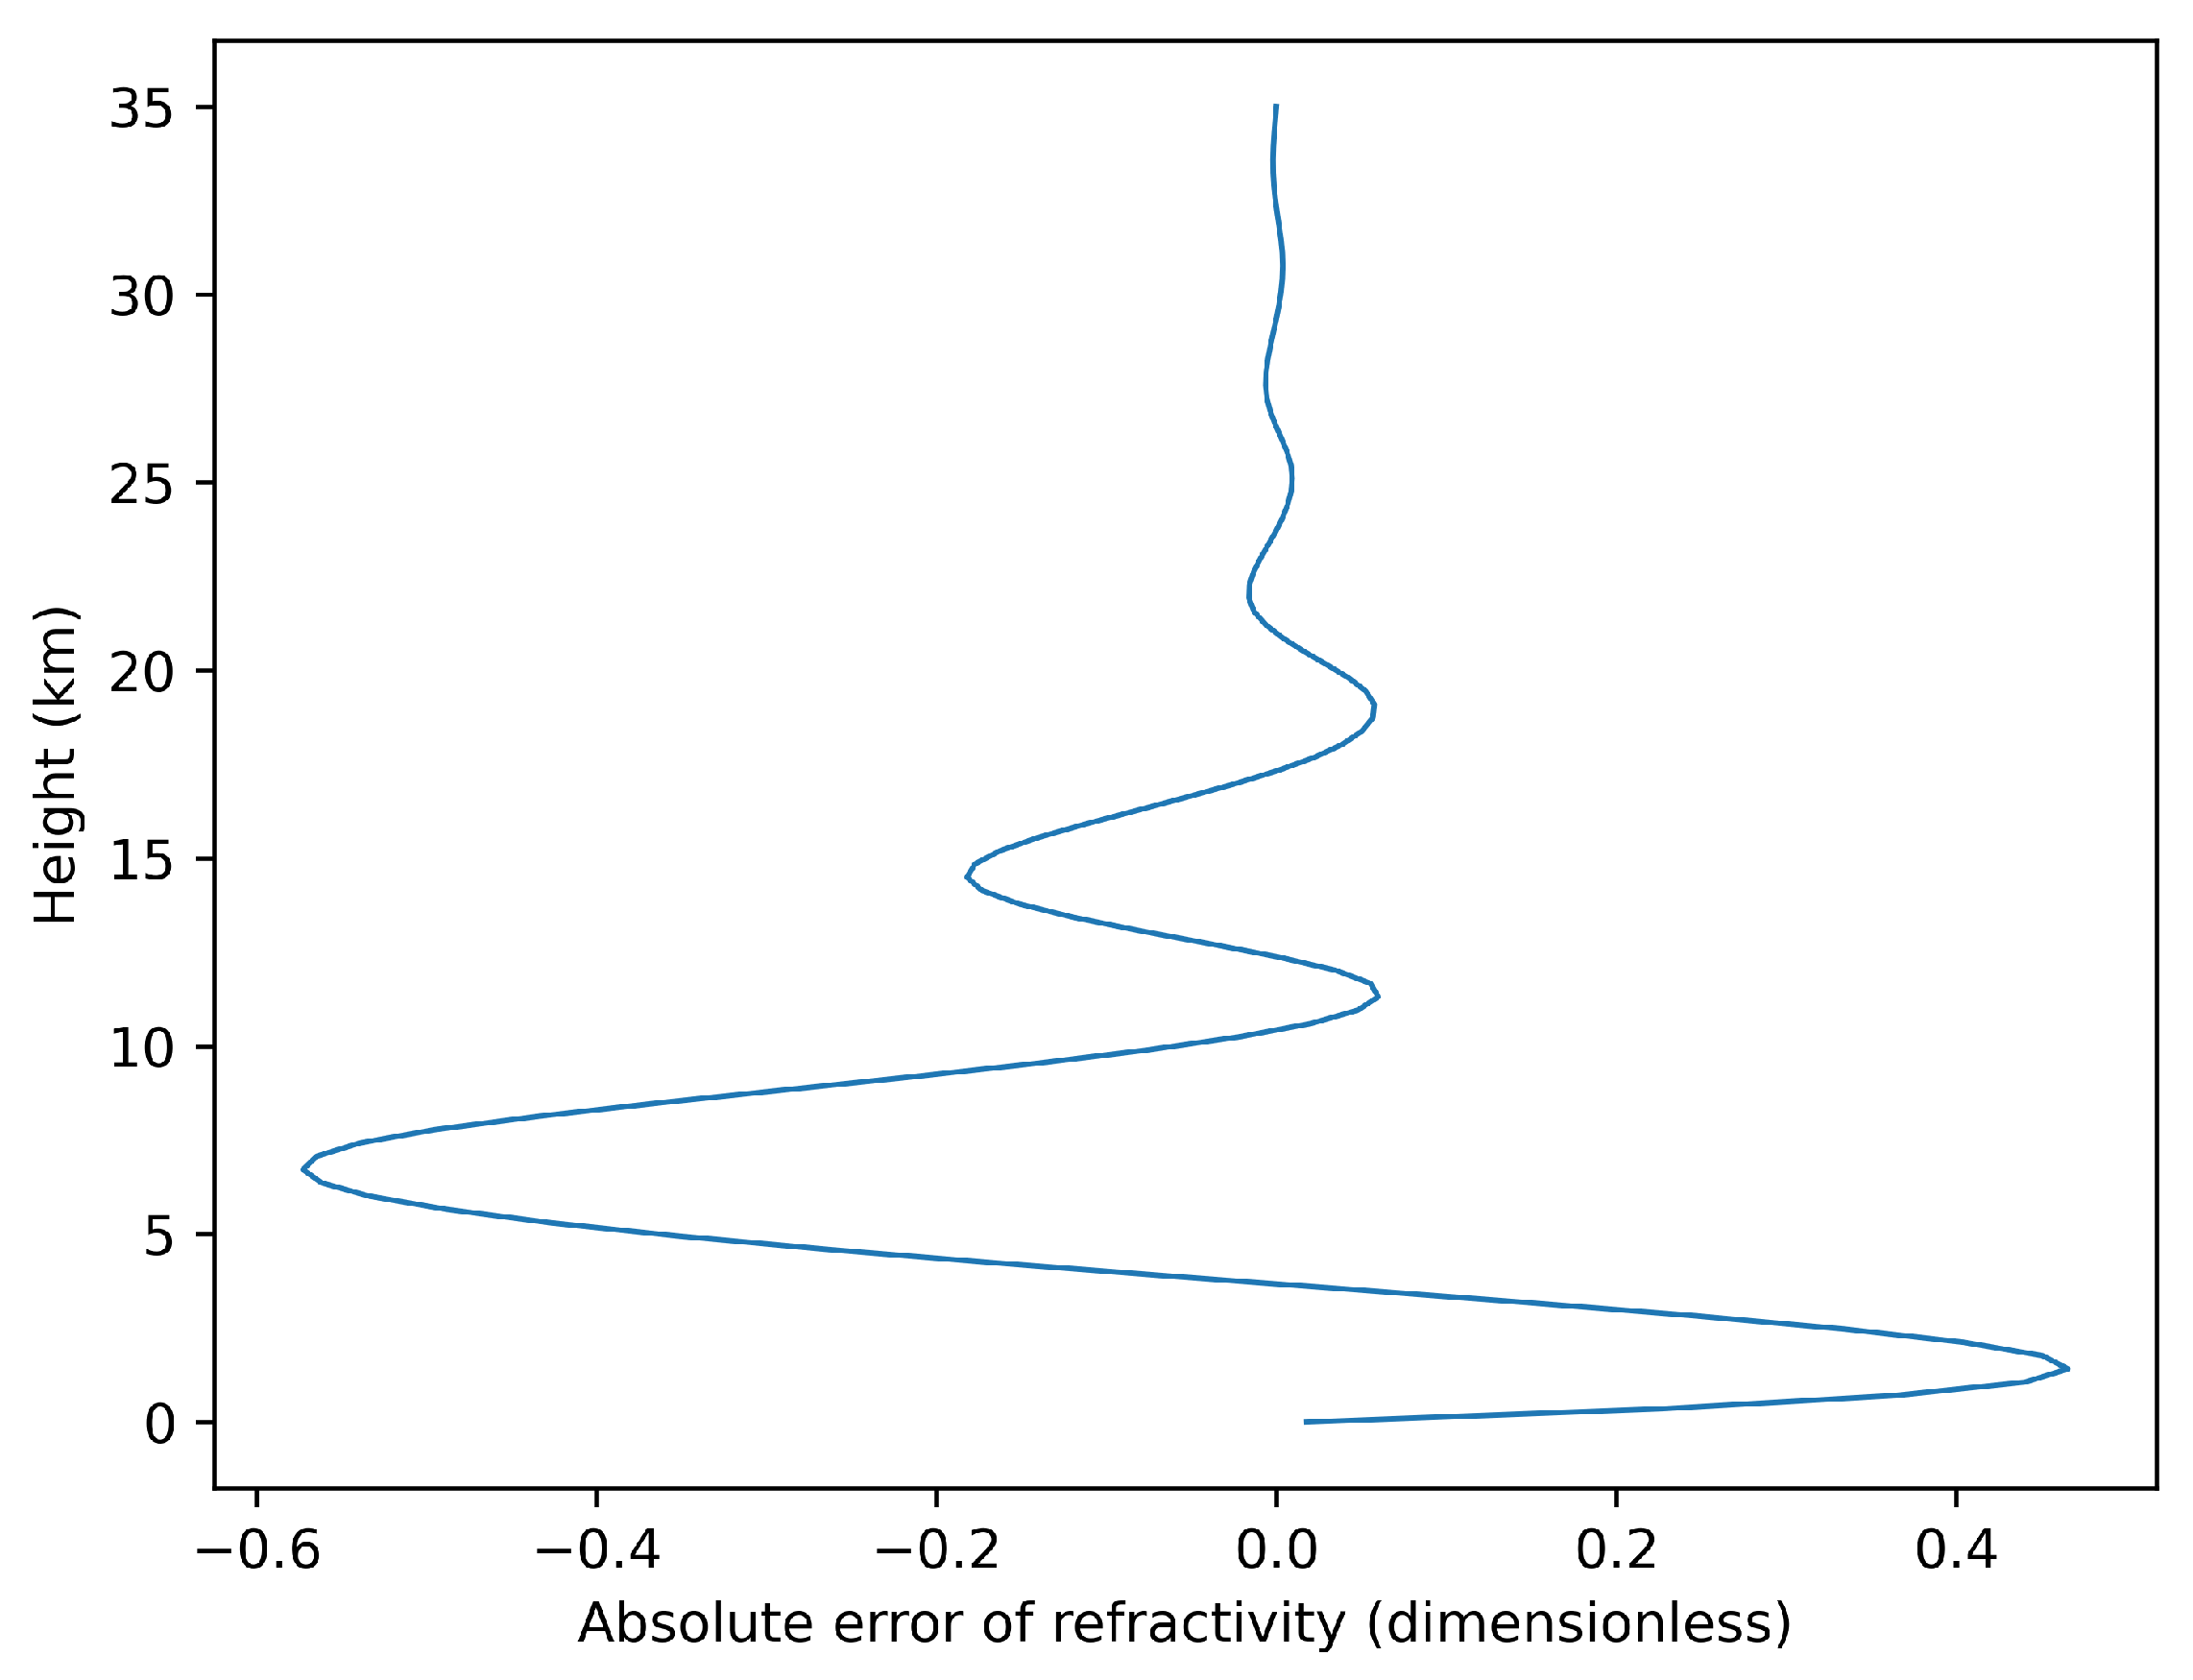
Figure 15 shows the absolute error of the refractive index obtained by the inversion algorithm relative to the refractive index obtained by the ERA5 model in the altitude range of 0–35 km, with the horizontal axis representing the absolute error of the refractive index and the axis coordinates representing the altitude. The smaller the absolute error of refractive index is, the closer the atmospheric observation data inverted by the GNSS-RO signal receiver using occultation data are to the real value and the better the performance of the receiver is. The absolute error of the refractive index is larger in the bottom atmosphere (0–10 km) and smaller in the upper atmosphere (10–35 km), but the absolute error of the refractive index in the altitude range of 0–35 km ranges between −0.6 and 0.5. It is hypothesized that this is due to the fact that the underlying atmosphere is disturbed by complex factors and the simple ERA5 model has limited ability to simulate the underlying real atmosphere. From the data in the figure, it can be seen that the FY-3E occultation receiver can accurately observe the atmospheric information in this GNSS atmospheric occultation simulation system, which is in line with the actual results. Therefore, it can be judged that the approach to evaluate the GNSS-RO signal receiver performance in terms of the ground-based atmospheric occultation simulation system is valid.
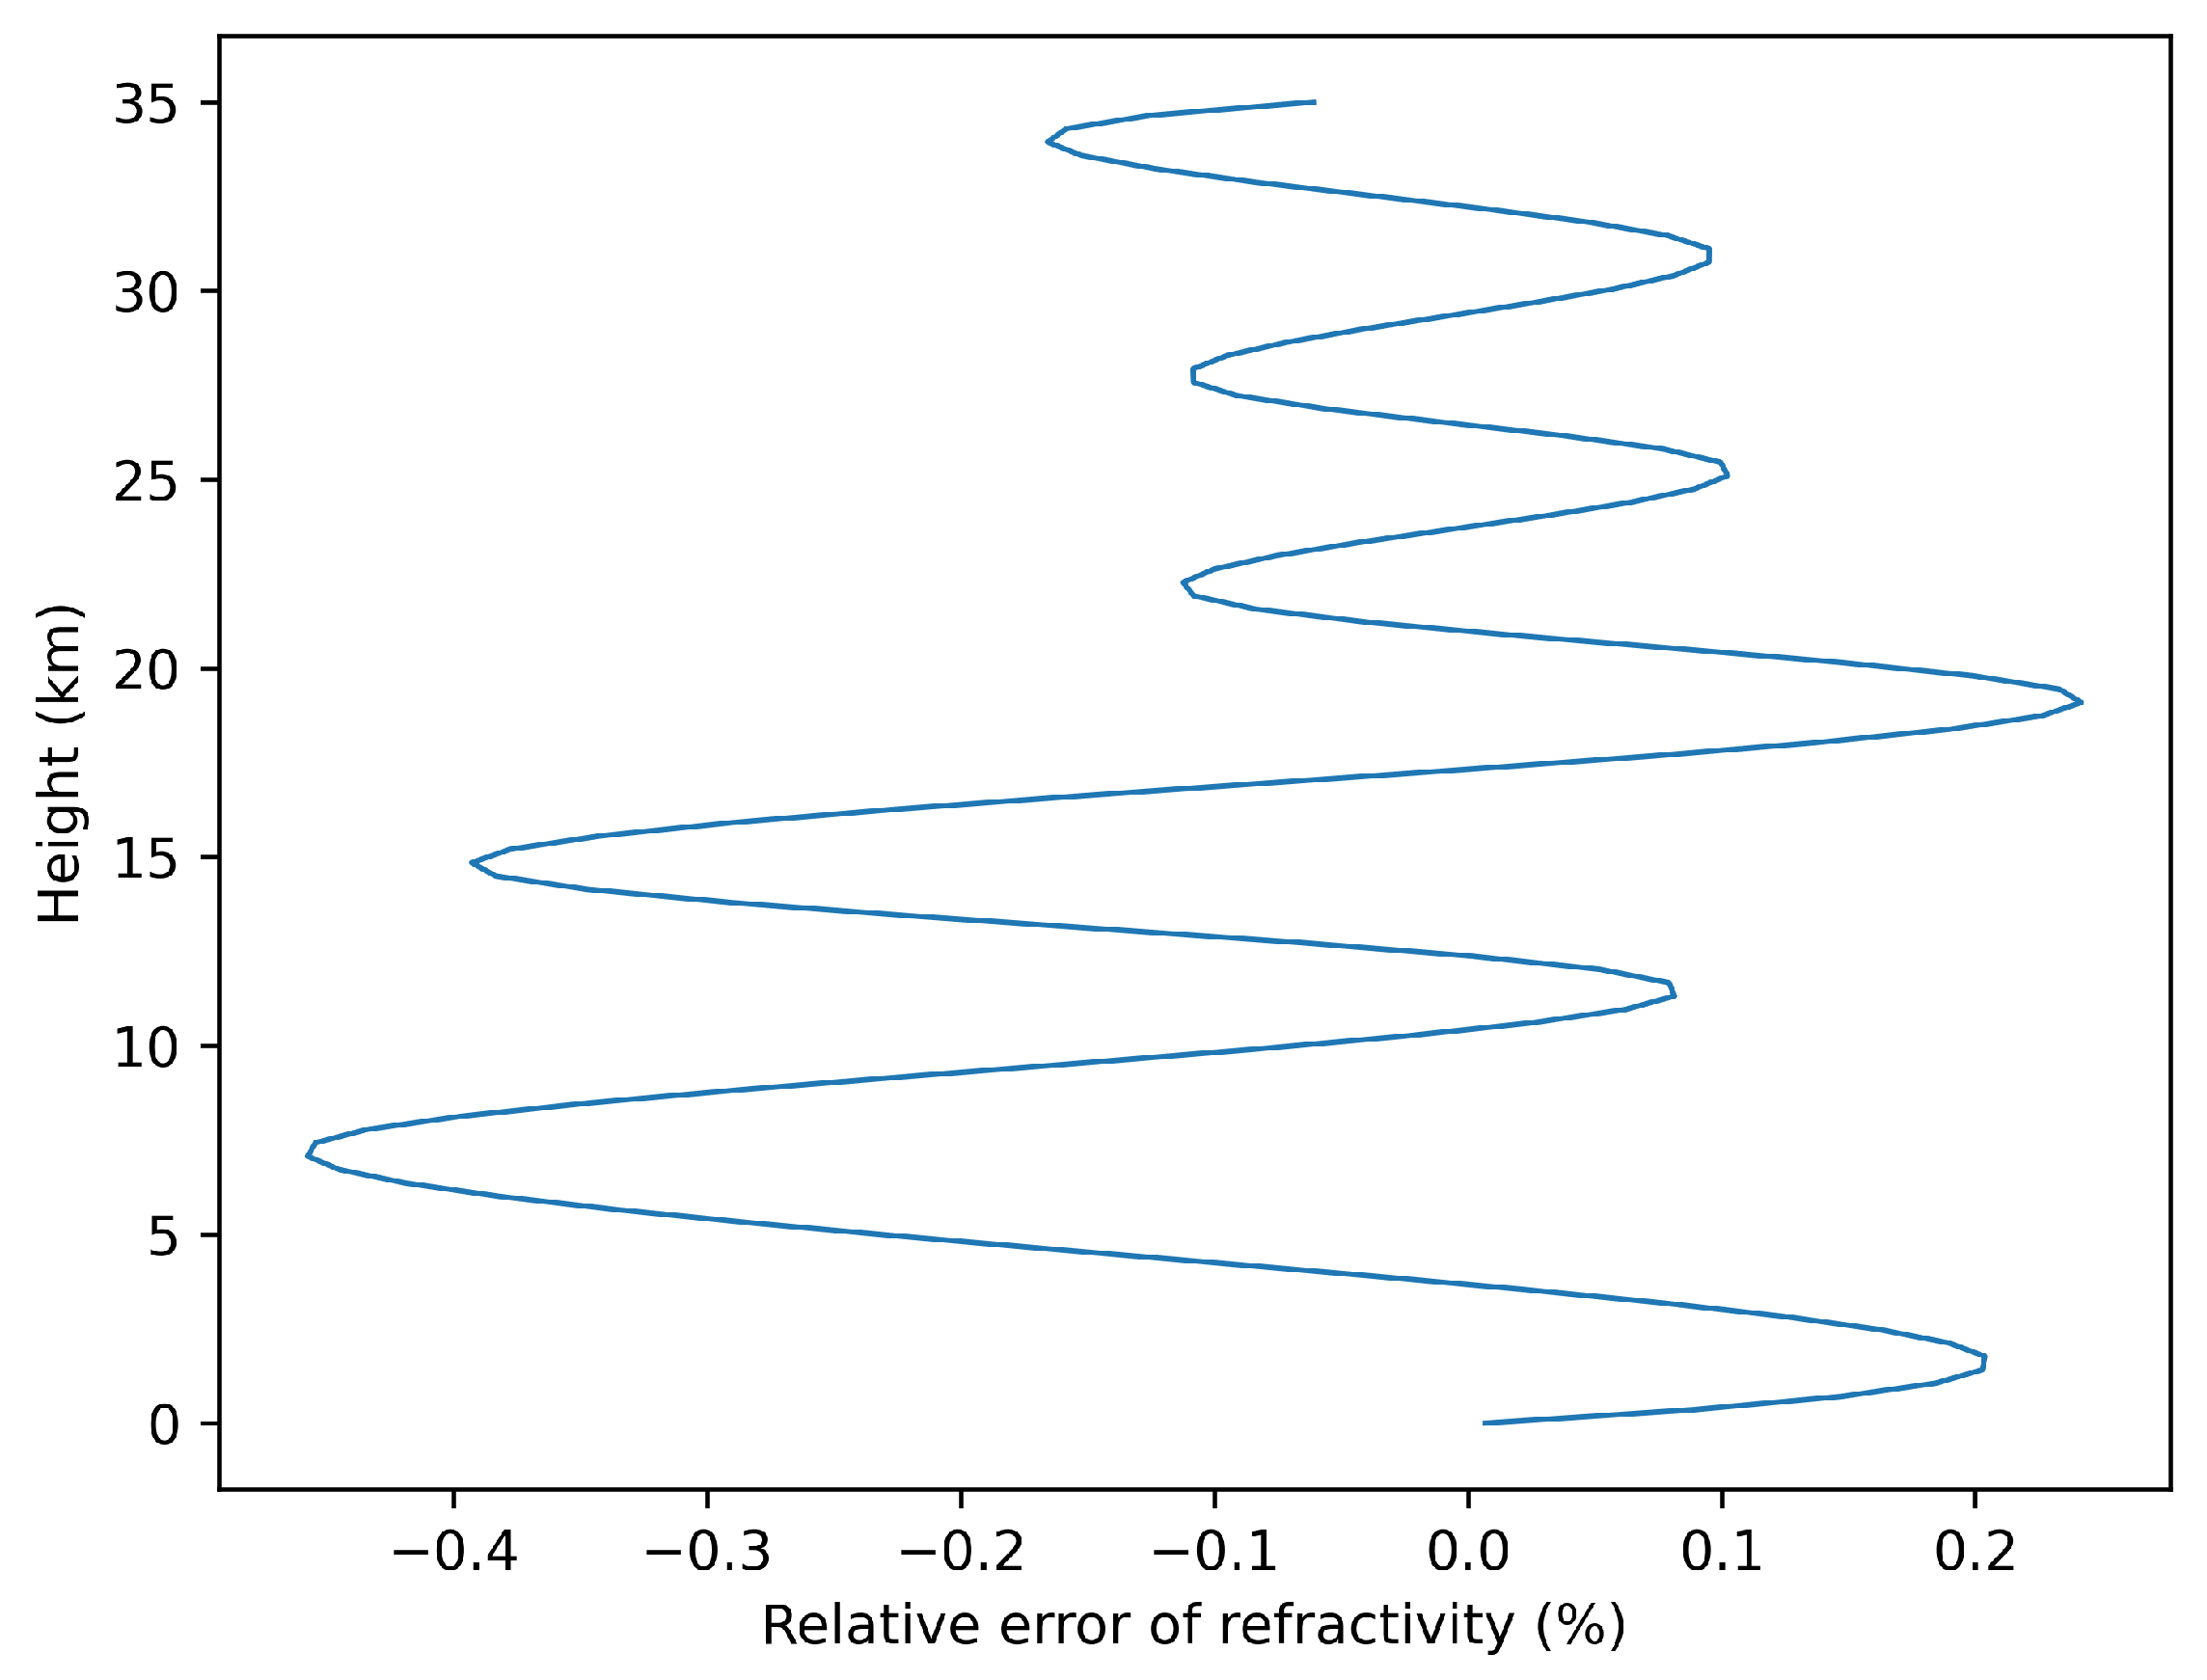
Figure 16 shows the relative error of the refractive index obtained by the inversion algorithm relative to that obtained by the ERA5 model in the altitude range of 0–35 km, with the horizontal axis representing the relative error of the refractive index and the axis coordinates representing the altitude. The smaller the relative error of the refractive index, the closer the atmospheric observation data inverted by the GNSS-RO signal receiver using occultation data are to the real value and the better the performance of the receiver. The relative error of the refractive index is less than 1% in all altitude ranges from 0–35 km. It is hypothesized that this is due to the fact that the bottom atmosphere is disturbed by complex factors and the simple ERA5 model has limited ability to simulate the real atmosphere at the bottom. From the data in the figure, it can be seen that the FY-3E occultation receiver can accurately observe the atmospheric information in this GNSS atmospheric occultation simulation system, which is in line with the actual results. Therefore, it can be judged that the approach to evaluate the GNSS-RO signal receiver performance in terms of the ground-based atmospheric occultation simulation system is valid.
3.5. Comparison of Temperatures Derived from the ERA5 Model and the Receiver Inversion Module
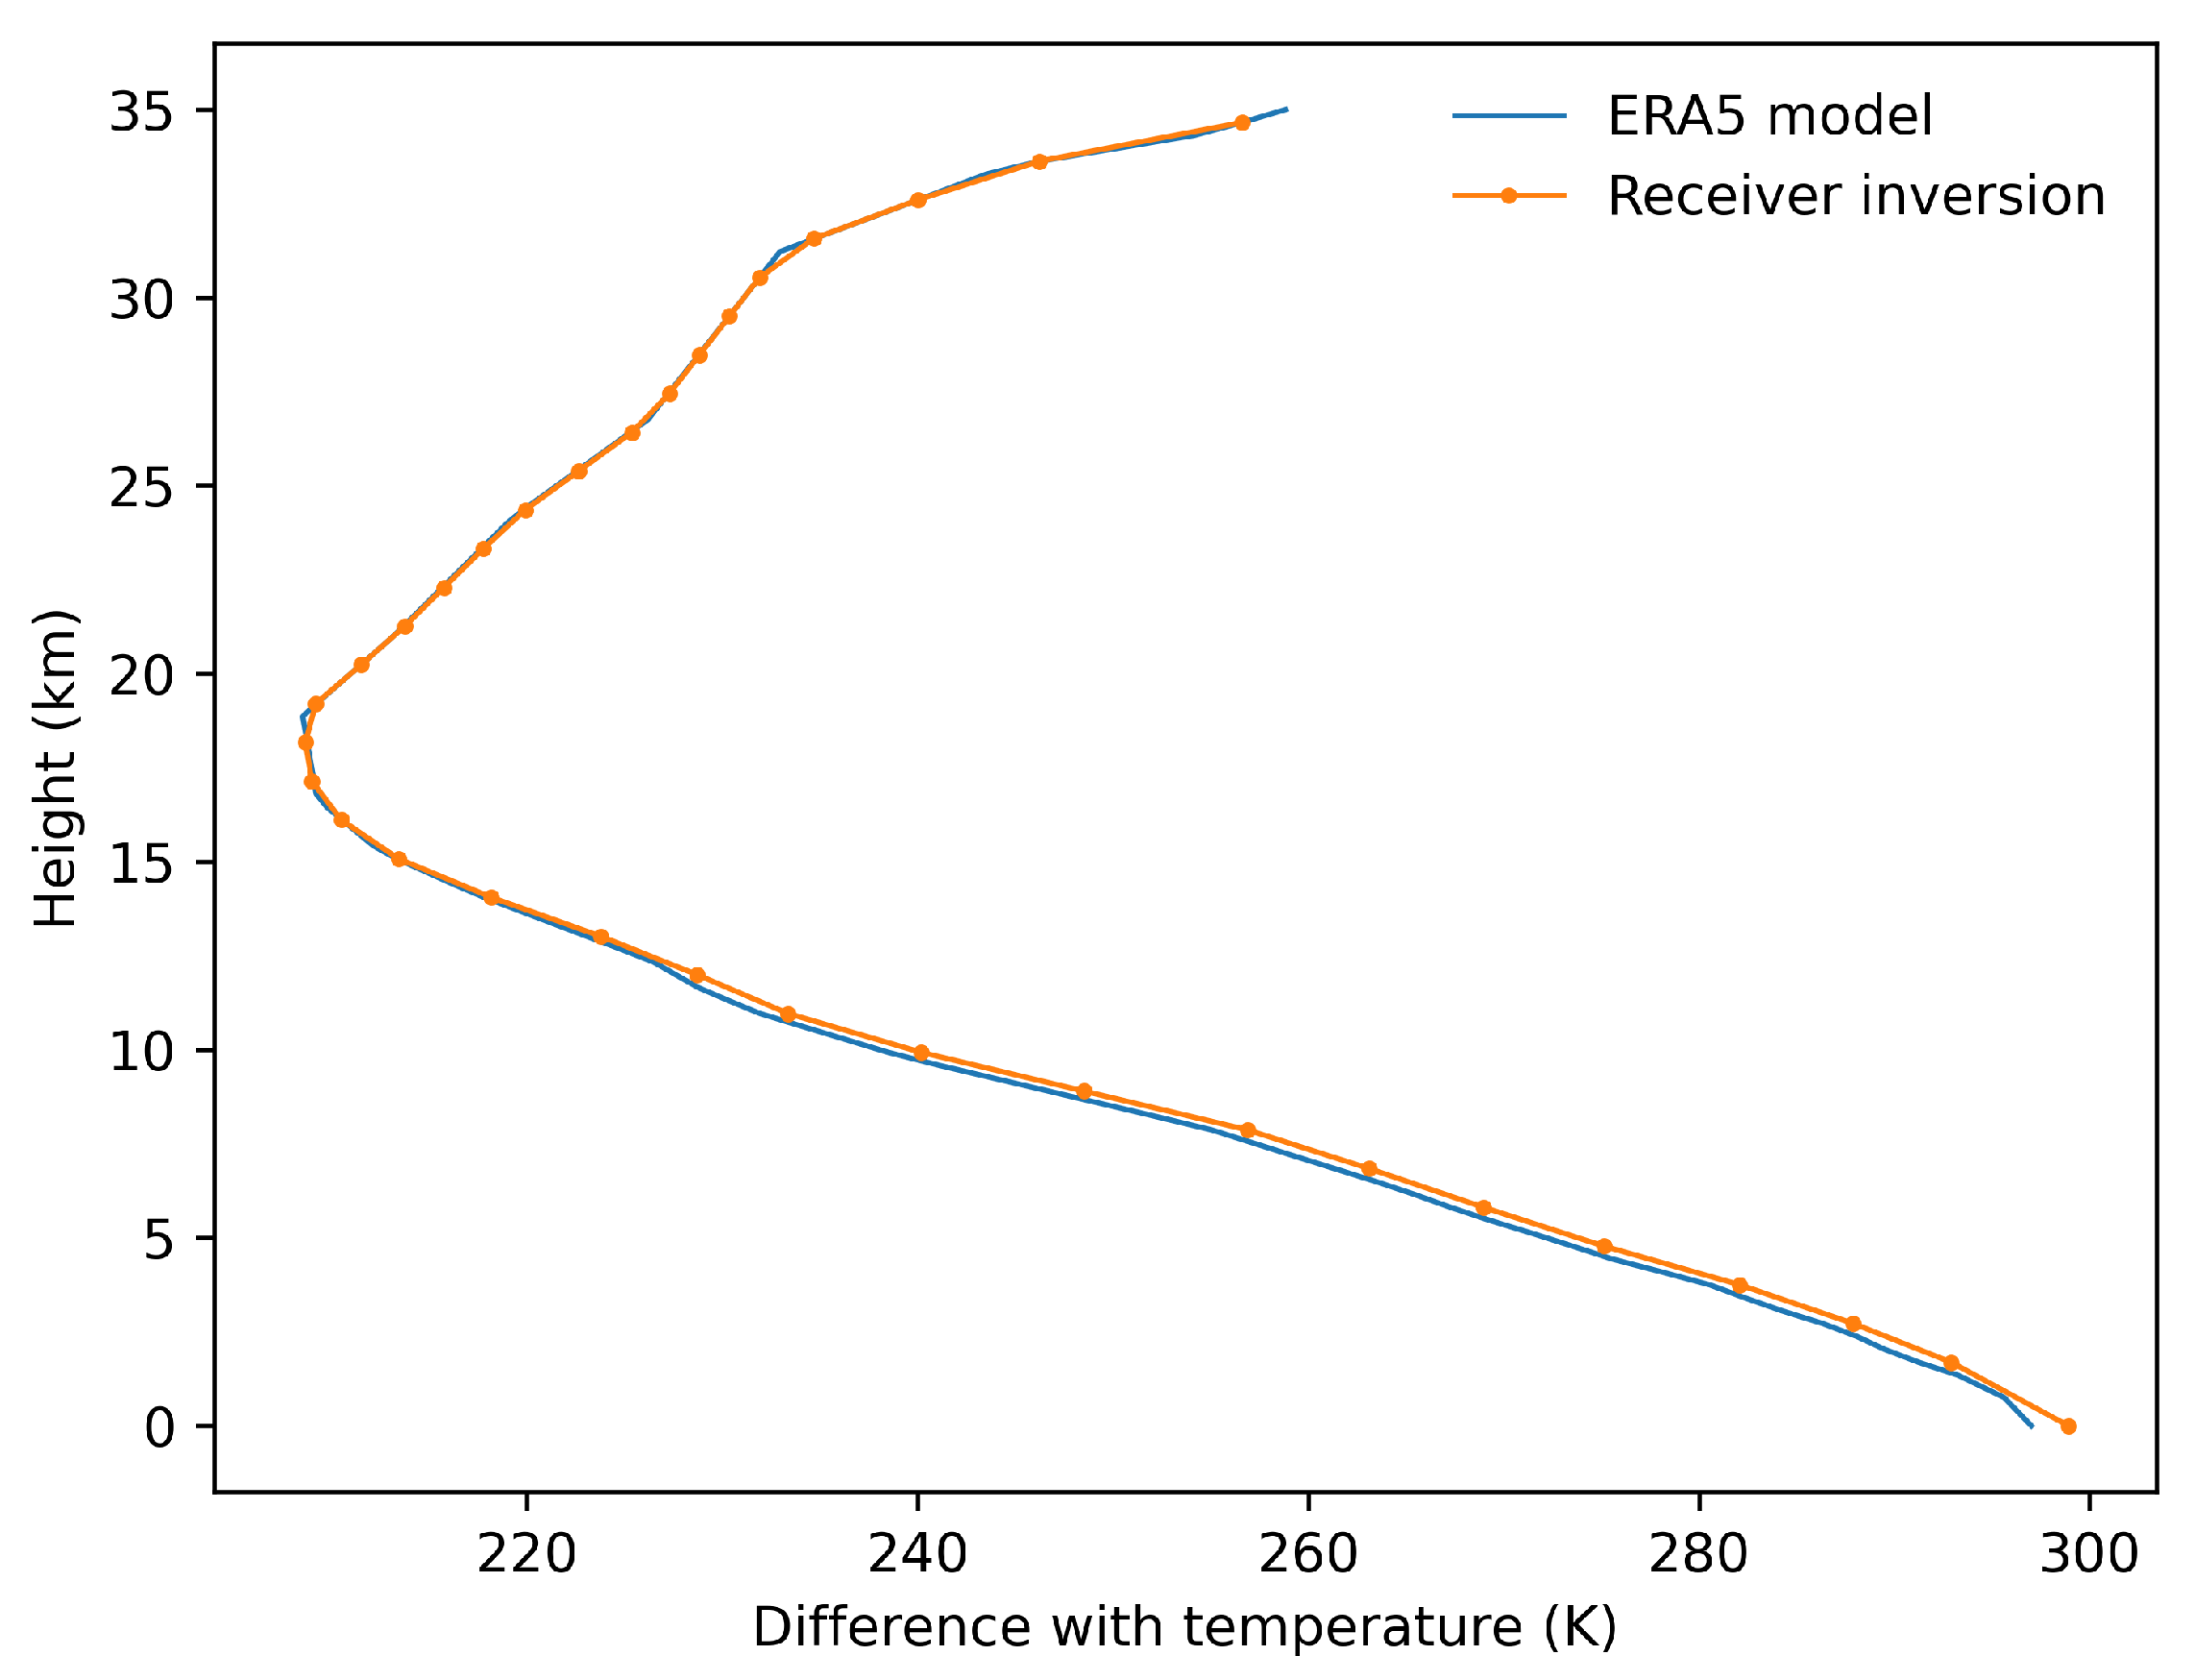
Figure 17 shows the comparison between the temperatures obtained by the ERA5 model and the inversion algorithm in the altitude range of 0–35 km, with the blue curve representing the temperature obtained by the ERA5 model and the orange curve representing the temperature obtained by the inversion algorithm. The results show that the results obtained by the receiver through the inversion algorithm are very close to those obtained by the meteorological model, which means that the FY-3E occultation receiver can accurately observe the atmospheric information in this GNSS atmospheric occultation simulation system, which is consistent with the actual results. Therefore, it can be judged that the approach to evaluate the GNSS-RO signal receiver performance in terms of the ground-based atmospheric occultation simulation system is valid.
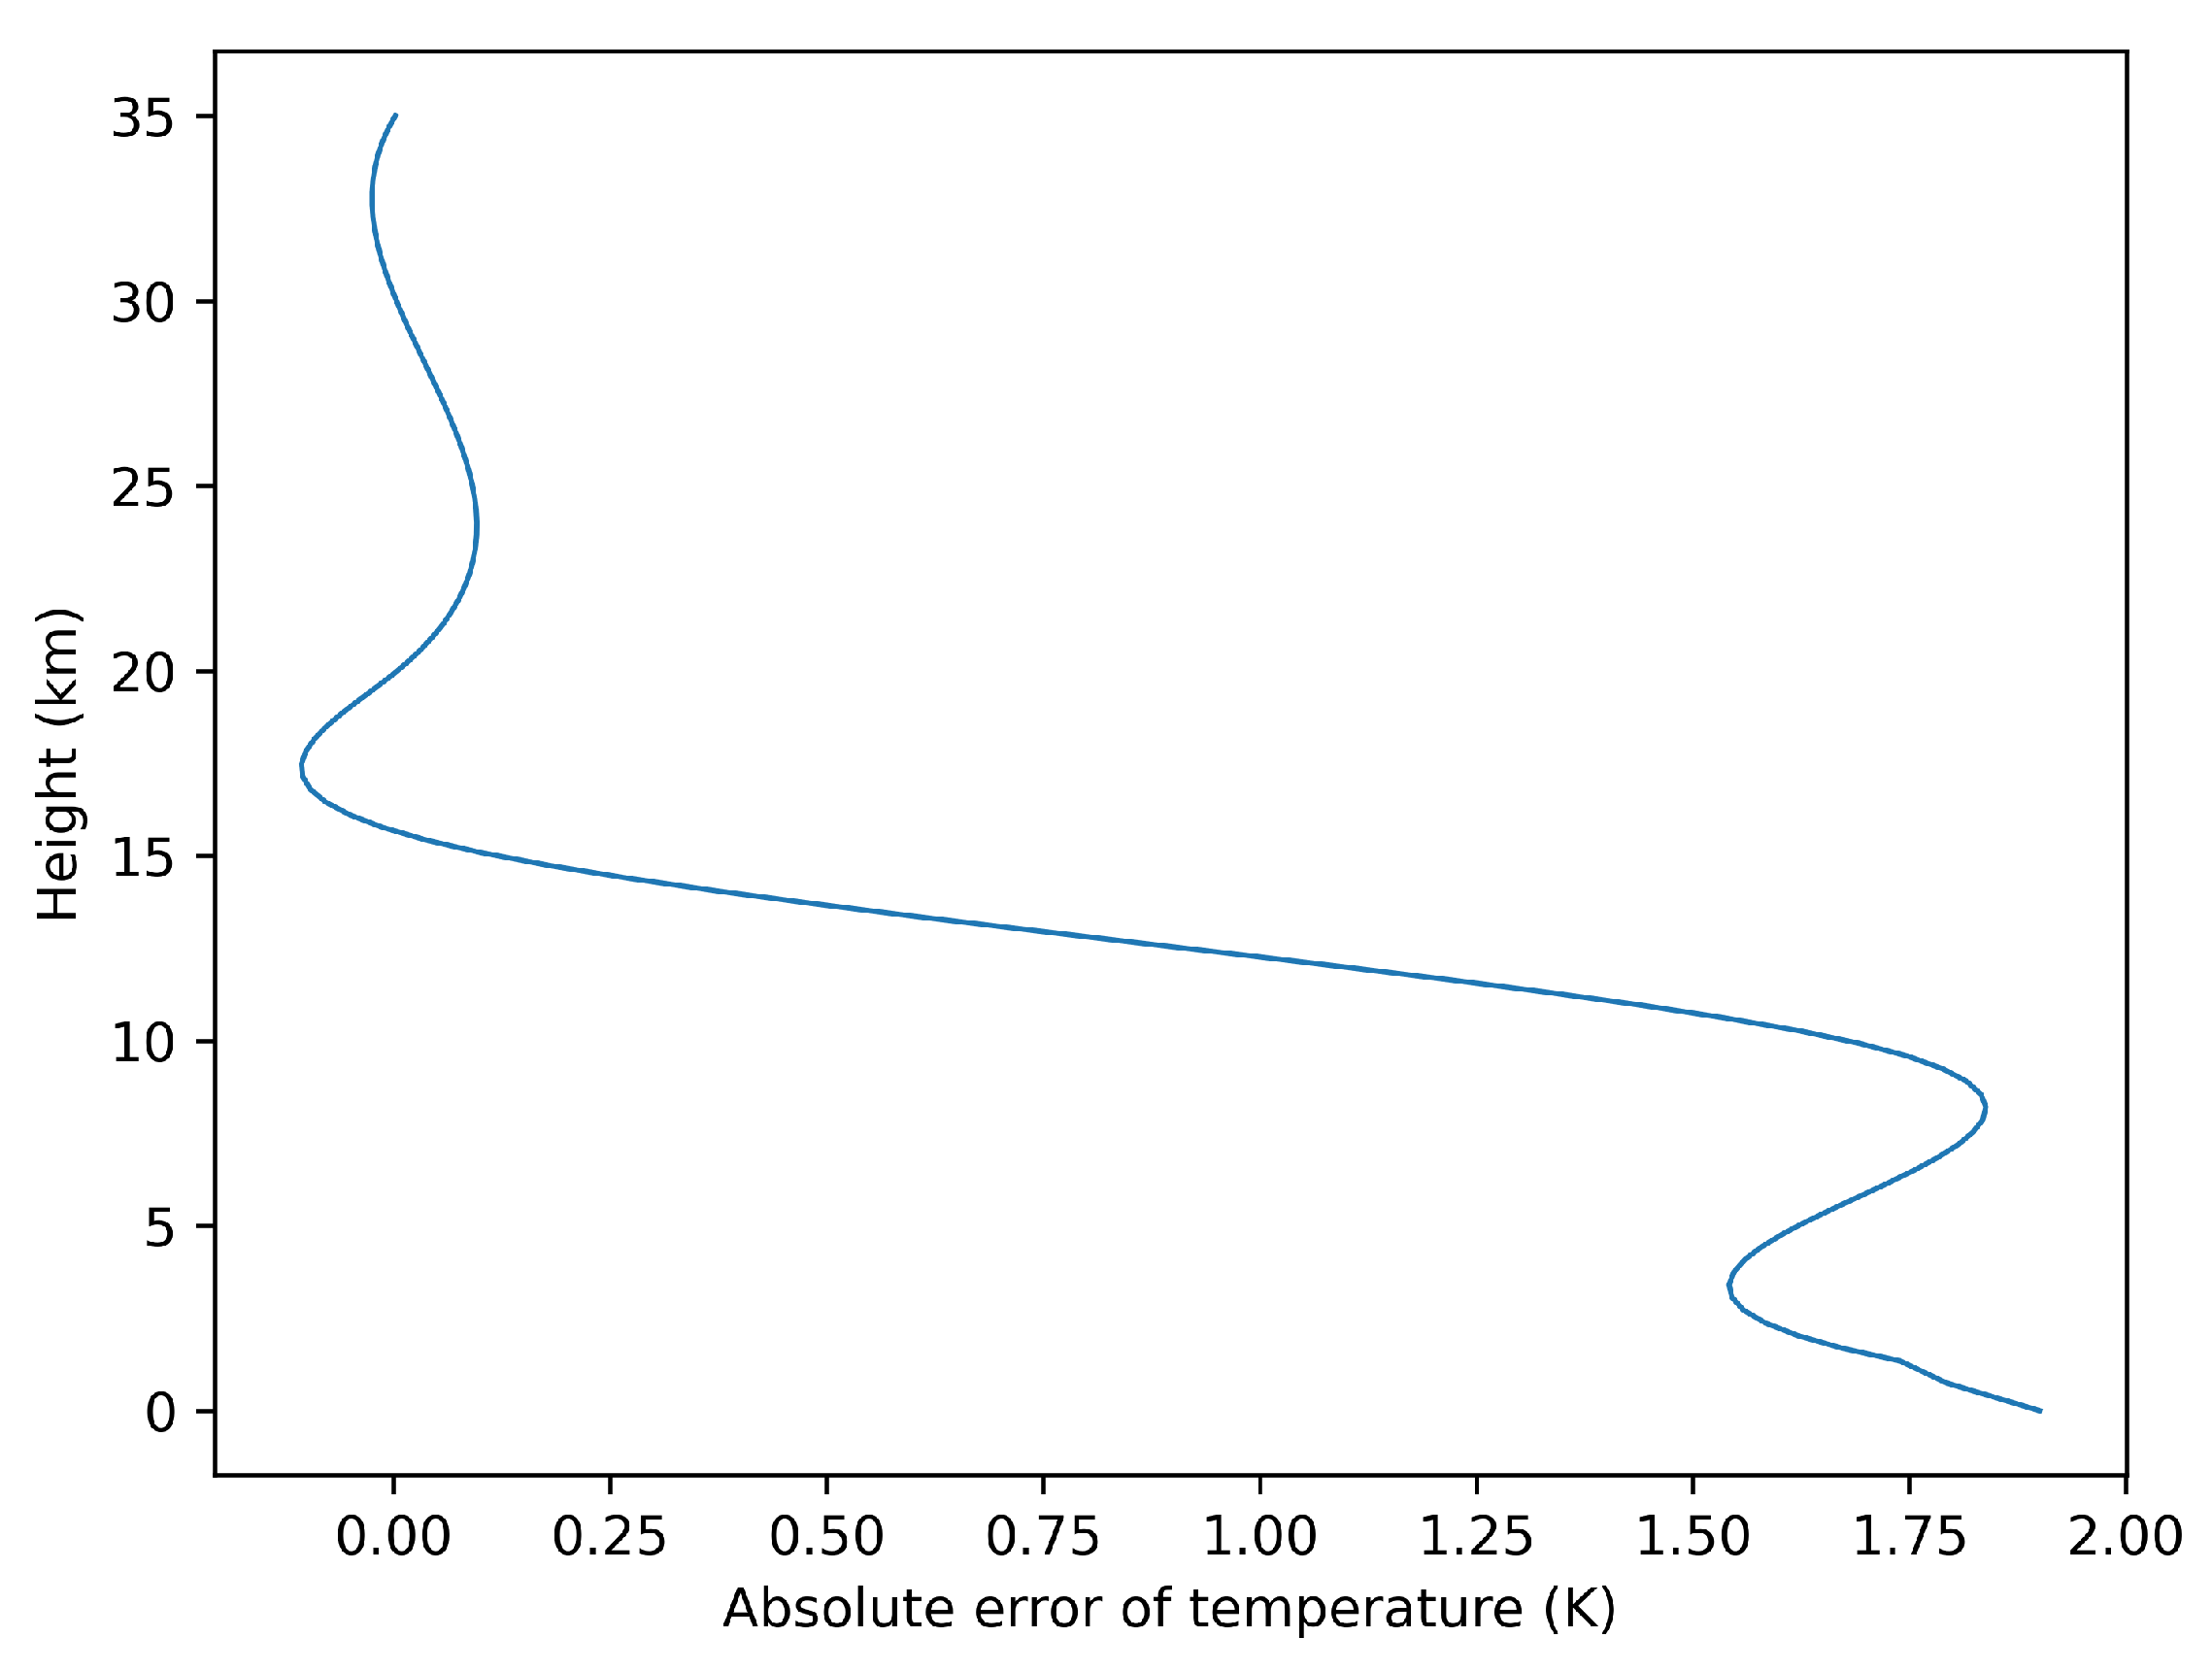
Figure 18 shows the absolute error of the temperature obtained by the inversion algorithm relative to the temperature obtained by the ERA5 model in the altitude range of 0–35 km, with the horizontal axis representing the absolute error of the temperature and the axis coordinates representing the altitude. The smaller the absolute error of temperature is, the closer the atmospheric observation data inverted by the GNSS-RO signal receiver using occultation data are to the real value and the better the performance of the receiver is. The absolute error in temperature is larger in the bottom atmosphere (0–10 km) and smaller in the upper atmosphere (10–35 km), but the absolute error in temperature is less than 2 K in all altitude ranges from 0–35 km. It is hypothesized that this is because the bottom atmosphere is subjected to the interference of complex factors, and the simulation ability of the simple ERA5 model for the real atmosphere of the bottom layer is limited. From the data in the figure, we can see that the FY-3E occultation receiver can accurately observe the atmospheric information in this GNSS atmospheric occultation simulation system, which is in line with the actual results. Therefore, it can be judged that the approach to evaluate the GNSS-RO signal receiver performance in terms of the ground-based atmospheric occultation simulation system is valid.
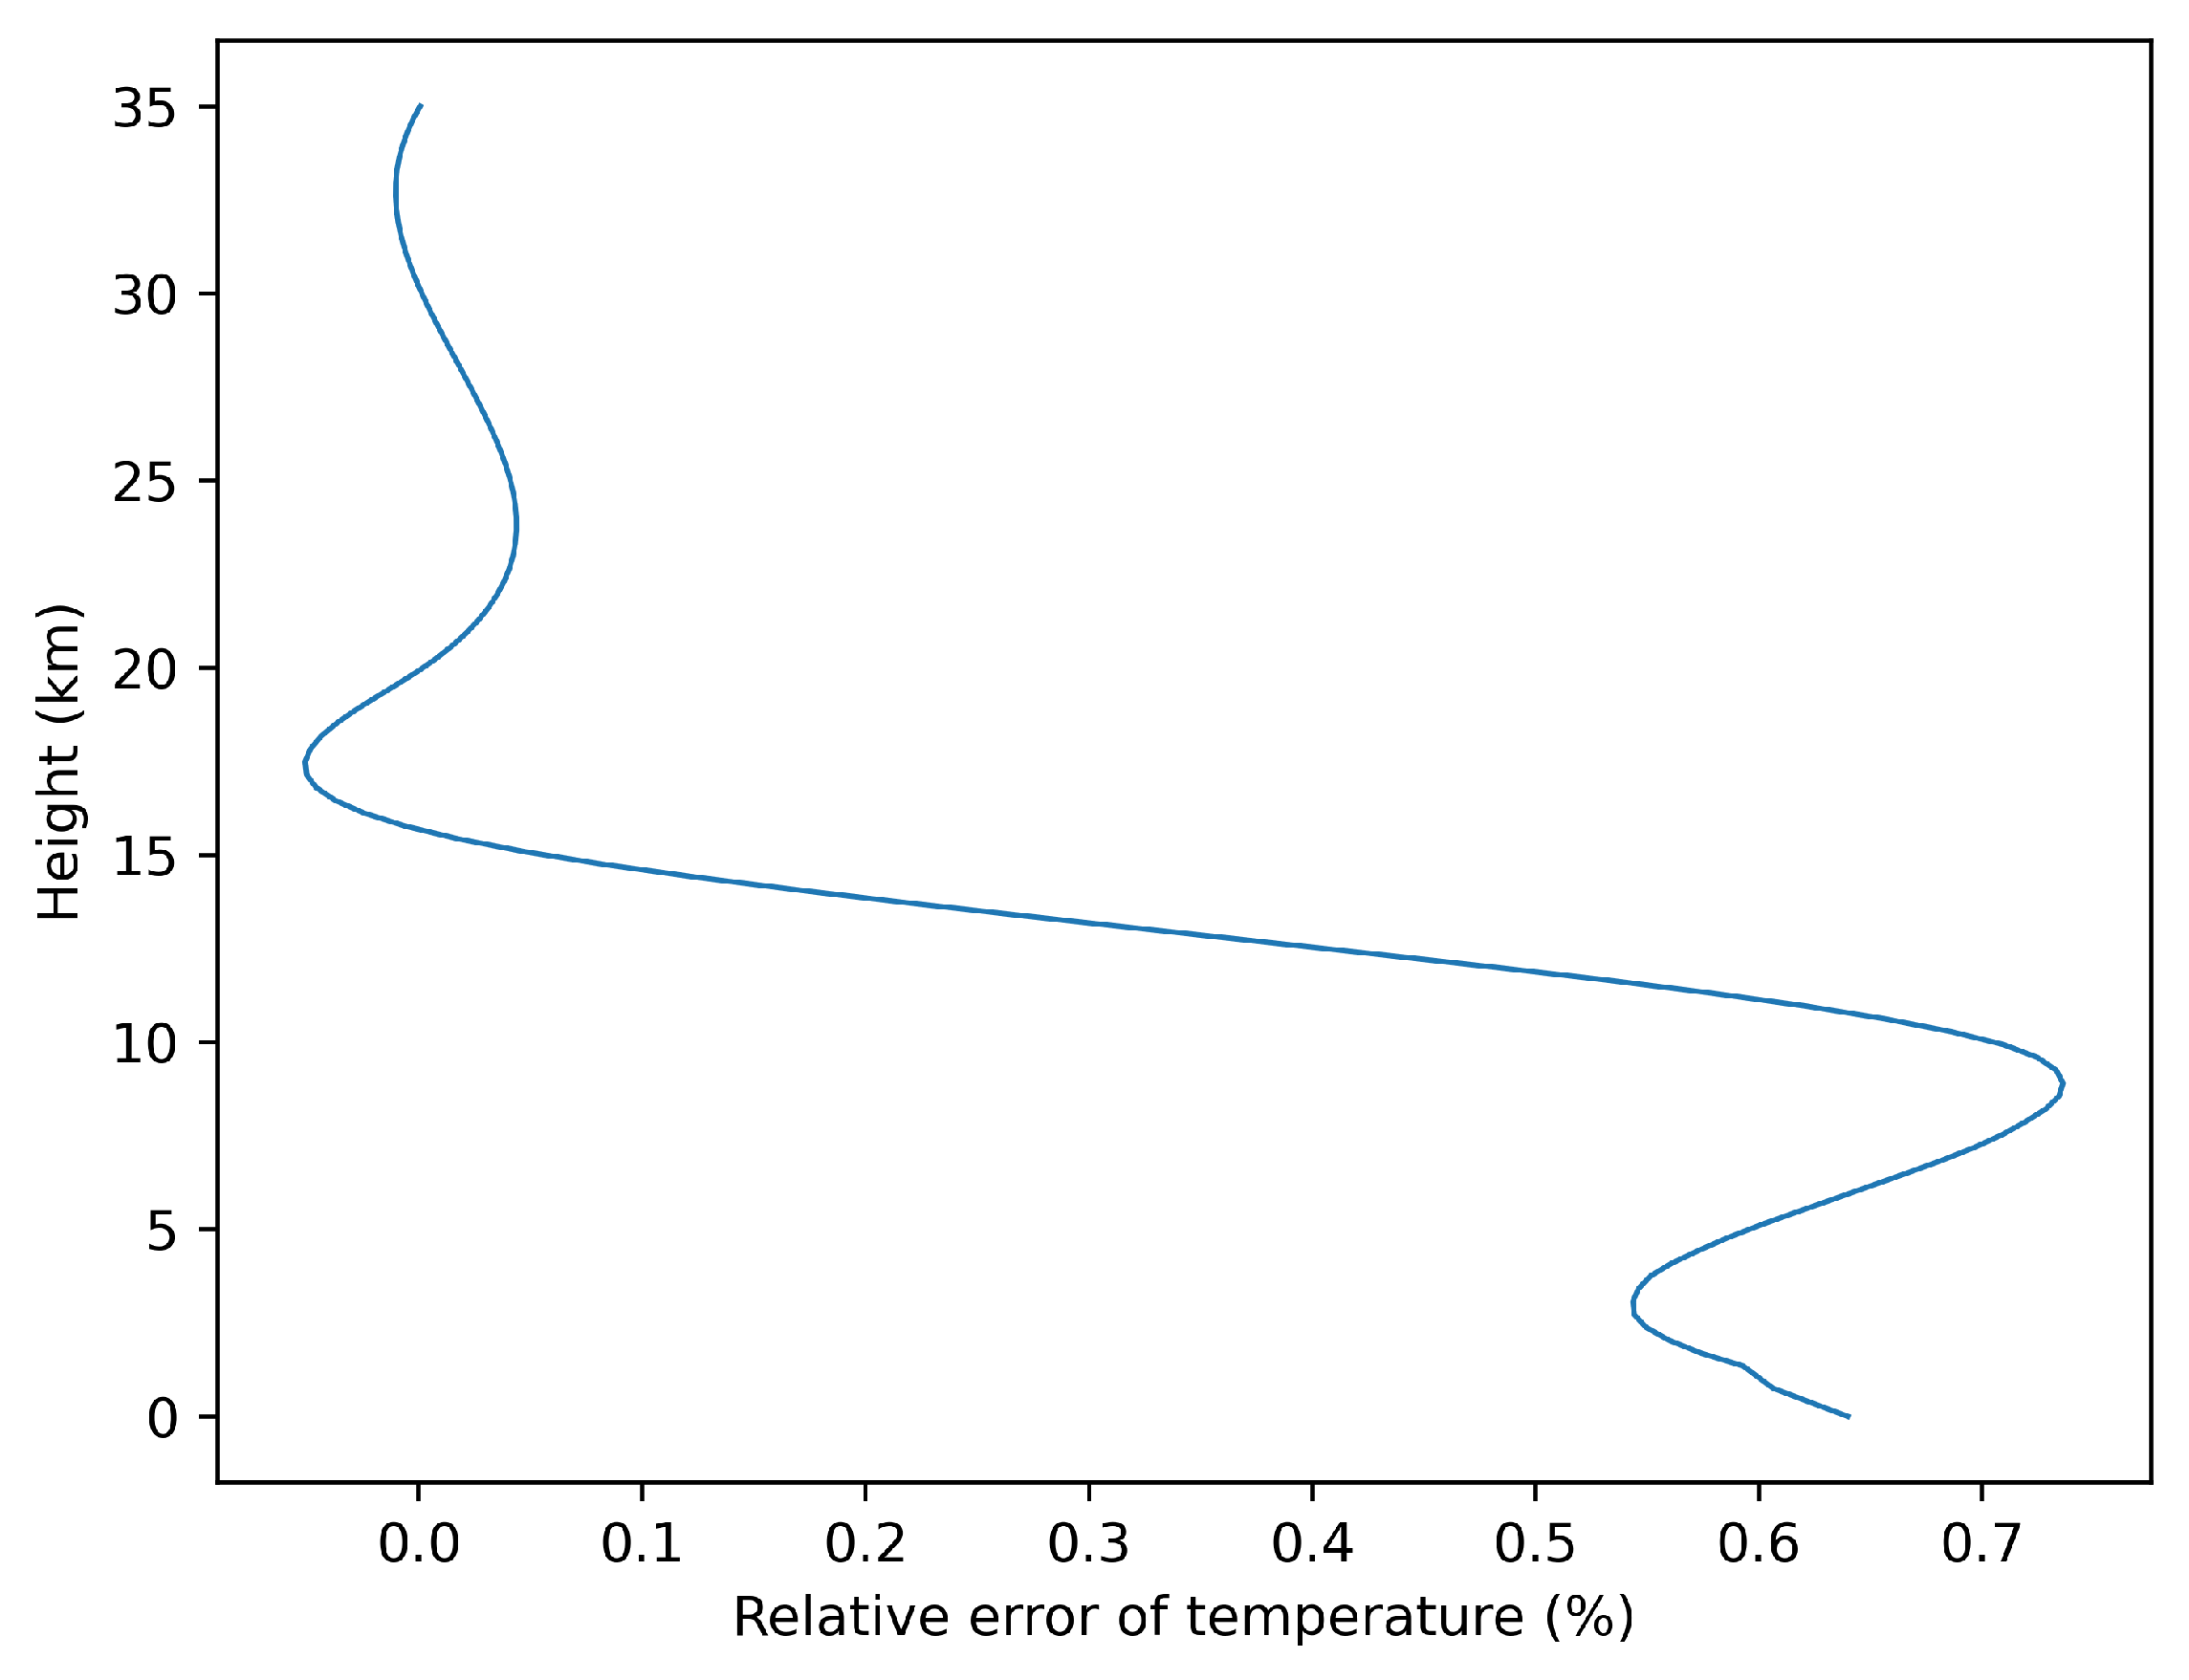
Figure 19 shows the relative error of the temperature obtained by the inversion algorithm relative to the temperature obtained by the ERA5 model in the altitude range of 0–35 km, with the horizontal axis representing the relative error of the temperature and the axis coordinates representing the altitude. The smaller the relative error of temperature, the closer the atmospheric observations inverted by the GNSS-RO signal receiver using occultation data are to the real value and the better the performance of the receiver. The relative error of temperature is large in the range of the bottom atmosphere (0–10 km) and small in the range of the upper atmosphere (10–35 km), but the relative error of temperature is less than 1.1% in all altitude ranges from 0–35 km. It is hypothesized that this is due to the fact that the bottom atmosphere is disturbed by complex factors and the simple ERA5 model has limited ability to simulate the real atmosphere at the bottom. From the data in the figure, we can see that the FY-3E occultation receiver can accurately observe the atmospheric information in this GNSS atmospheric occultation simulation system, which is in line with the actual results. Therefore, it can be judged that the approach to evaluate the GNSS-RO signal receiver performance in terms of the ground-based atmospheric occultation simulation system is valid.
4. Conclusions
In this paper, an accurate, repeatable, and controllable GNSS atmospheric occultation simulation system is proposed. The novel approach to evaluate the GNSS-RO signal receiver performance in terms of the ground-based atmospheric occultation simulation system is constructed on this basis. The GNSS occultation simulation system consists of a visualization interaction module, a GNSS-RO simulation signal generation module, a GNSS-RO simulator module, a GNSS-RO signal receiver module, and a GNSS-RO inversion and evaluation module. The GNSS-RO simulation system consists of the visual interaction module, GNSS-RO simulated signal generation module, GNSS-RO simulator module, GNSS-RO signal receiver module, and GNSS-RO inversion and evaluation module, which can generate a high dynamic GNSS occultation simulation signal according to the flight track of the vehicle and the set atmospheric model, and the GNSS-RO signal receiver can invert the GNSS occultation simulation signal to obtain a series of atmospheric parameters, compare this atmospheric parameter to the set atmospheric model parameter, and then evaluate the performance of the GNSS-RO signal receiver by the error information. The GNSS-RO signal receiver performance is evaluated through the error information.
In order to verify the feasibility of the novel approach to evaluate the GNSS-RO signal receiver performance in terms of the ground-based atmospheric occultation simulation system proposed in this paper, the GNSS atmospheric occultation simulation system is verified by using the FY-3E occultation receiver that has been verified by on-orbit performance. On the basis of adopting the CIRA meteorological model and the ERA5 model that can describe the typical characteristics of the atmosphere, the atmospheric refractive index obtained by the inversion of FY-3E occultation receiver is compared with the refractive index set by the CIRA meteorological model and the ERA5 model. In the altitude range of 0–5 km, the relative error between the refractive index of the atmosphere obtained by the FY-3E occultation receiver inversion and the refractive index set by the CIRA meteorological model and the ERA5 model is less than 2%, and in the altitude range of 5–20 km, the relative error is less than 1%; the absolute error between the temperature of the atmosphere obtained by the FY-3E receiver inversion and the temperature set by the CIRA meteorological model and the ERA5 model is less than 2 km; and the relative error between the pressure of the atmosphere obtained by the FY-3E occultation receiver inversion and the pressure set by the CIRA meteorological model and the ERA5 model is less than 1%. Therefore, the FY-3E occultation receiver passes the novel approach to evaluate the GNSS-RO signal receiver performance in terms of the ground-based atmospheric occultation simulation system, which is in line with reality, so it can be inferred that the novel approach to evaluate the GNSS-RO signal receiver performance in terms of the ground-based atmospheric occultation simulation system proposed in this paper is feasible. The novel approach to evaluate the GNSS-RO signal receiver performance in terms of the ground-based atmospheric occultation simulation system proposed in this paper overcomes many limitations of the mountaintop-based testing approach and can efficiently and accurately carry out the receiver test, which provides an effective solution for the development and testing of future GNSS-RO signal receivers.

 ,
, 