

Capturing Small-Scale Surface Temperature Variation across Diverse Urban Land Uses with a Small Unmanned Aerial Vehicle


Department of Civil Engineering, University of Texas at Arlington, 701 S Nedderman Dr., Arlington, TX 76019, USA
*
Author to whom correspondence should be addressed.
Remote Sens. 2023, 15(8), 2042; https://doi.org/10.3390/rs15082042
Submission received: 15 March 2023
/
Revised: 8 April 2023
/
Accepted: 10 April 2023
/
Published: 12 April 2023
(This article belongs to the Special Issue Urban Planning Supported by Remote Sensing Technology II)
Abstract
:Urbanization increases the urban land surface temperature (LST), challenging society and the environment. This study measured the LST of diverse land uses (LU) in Dallas–Fort Worth (DFW) using a high-resolution (8 cm) thermal infrared sensor onboard a small, unmanned aerial vehicle (UAV). LUs included park (PA), industrial (IA), residential low-cost (RLC), and residential high-cost (RHC) areas. LST was collected by the UAV at different times on eight nonconsecutive days. UAV-collected LST was compared with that from Landsat 8-9 and in situ measurements. RHC reported the highest mean LST, and PA showed the lowest mean LST. Dark-colored asphalt shingle roofs in RHC had the highest mean LST range at 35.67 °C. Lower LST was measured in shaded areas and under thick green cover, whereas areas with thin green cover occasionally reported higher LST than pavements. The micro-urban heat island (MUHI) was calculated between LUs and within land cover types (roof, pavement, green, and water). The MUHI varied from 4.83 °C to 15.85 °C between LUs and 0.2 °C to 23.5 °C within LUs for the less than 1 km2 study area. While the UAV thermal sensor and Landsat demonstrated a similar trend of LST variation, the UAV sensor reported more intense MUHI. An average percent bias (PBIAS) of 5.1% was calculated between the UAV sensor and in situ measurements. This study helps inform the urban design process by demonstrating how land use decisions impact LST locally and provides valuable insight for studies concerned with fine-scale urban LST variability.
1. Introduction
Almost 50% of the global population resides inside urban boundaries, and urbanization is increasing [1,2]. It is projected that 68% of the world’s population will be urbanized by 2050 [3]. An upsurge in urbanization alters the surface thermal environment [4]. The surface thermal environment is the heat exchange between the land and the atmosphere, which generates land surface temperature (LST) [5]. Land use change due to urbanization also affects local climatology by increasing LST, leading to warming of the land surface [6,7]. Extensive LST variation is expected over the course of a day due to the complex heterogeneity of an urban area causing unequal warming [8,9]. Differences in the material properties in an urban area also cause variations in LST along with other factors [10].
Urban Heat Island (UHI) is a phenomenon that results from the difference in temperature between urban and rural areas. UHI has been associated with intensive energy consumption, heat waves, and some health issues. Multiple studies have assessed the UHI impact and its relationship with changing land use due to increasing urbanization [11,12,13]. Most of these studies measured UHI at city scales by either using air temperature [14,15] or LST [16,17]. Contrary to UHI, micro UHI (MUHI) forms within an urban area due to the difference in temperature between land uses (LUs) [18]. Intra-urban LST variations of up to 10 °C with a strong linkage between LST and LU were estimated in coastal cities in Greece [19]. Similarly, Jenerette et al. [6] observed that dark surfaces, built-up areas, vehicles, and industries generate micro-urban heat islands (MUHIs) in Chennai, India. Moreover, street width, the distance between buildings, and building heights affect urban ventilation, which ultimately influences MUHI [20]. Improved urban ventilation can reduce the UHI effect within cities [21].
Anthropogenic heat arising from energy consumption, power generation, and transportation plays an important role in temperature variability in the urban core by manifesting maximum heating [22]. The temperature difference within the urban area may be even greater than the temperature difference between urban and rural areas [23]. Urban heterogeneity highly impacts temperature variability, and these variations are largely attributed to the street structure, green spaces, road network, bare soil, and other related anthropogenic activities [24,25,26]. The material used in urban areas, for example, concrete, asphalt, bricks, etc., radiates heat at night, which is then absorbed during the day [27]. This induces temperature fluctuations in and around the urban area. The closely-spaced buildings in cities limit outgoing radiation at night, increasing nighttime temperatures [28]. Green spaces in the city often lead to a significant decrease in temperature. For example, a decrease of 0.86 °C is possible with an increase of 10% green spaces [29]. Moreover, urban vegetation influences the microclimate and decreases the temperature in built-up areas [30].
As urbanization is occurring at a rapid pace [31,32], it is paramount to observe the temperature changes within the city structure. MUHI examination requires high spatial resolution because the land cover changes within a square kilometer. With recent technological advances, studies concerning LST variation and UHI/MUHI have used satellite remote sensing data [28,33,34]. Satellite-based remote sensing products provide LST data at different spatial and temporal scales. The Geostationary Operational Environmental Satellite (GOES) provides LST with a large temporal scale compared to polar-orbiting satellites. GOES-R provides data with a 30-min temporal and 2-km spatial resolution. The Spinning Enhanced Visible and InfraRed Imager (SEVIRI) has a spatial resolution of 5 km, and the SEVIRLST2 V1 product has a temporal resolution of 1 h [35]. The Moderate Resolution Imaging Spectroradiometer (MODIS) onboard Terra and Aqua satellites LST product has a 1 km × 1 km spatial resolution and daily temporal scale [36]. The Ecosystem Spaceborne Thermal Radiometer Experiment on Space Station (ECOSTRESS), launched in June 2018, has a 70 m × 70 m spatial resolution and variable temporal scale. These satellite products with high spatial scales offer new insights to the study of urban temperature variability and are used to estimate LSTs in various regions. Hulley et al. [37] produced a fine-scale Heat Vulnerability Index of Los Angeles using ECOSTRESS and MODIS LST data. Landsat is also one of NASA’s flagship projects. Landsat 8 Operational Land Imager (OLI) and Thermal Infrared Sensor (TIRS) has 11 bands, most of which have a spatial resolution of 30 m × 30 m, whereas band 8 (panchromatic) has a 15 m × 15 m resolution [38]. Its revisit cycle is 16 days.
However, certain problems are associated with retrieving LST from satellites [39]. Retrieval algorithms such as split windows and dual channels for thermal infrared sensors induce errors in LST. Other error sources include noise, bandpass, and wavelength indetermination [40]. Likewise, atmospheric turbulence and cloud cover are considered to contaminate satellite images [41,42]. Moreover, long revisit cycles from low earth orbiting satellites and the coarse spatial resolution of geostationary orbiting satellites impede the capture of LST at high temporal and spatial scales, respectively. Considering the problems associated with satellite LST products, small Unmanned Aerial Vehicles (UAVs) are a viable option to capture LST when equipped with a thermal sensor. Thermal sensor-equipped UAVs can provide LST at a large spatiotemporal scale and can be operated in weather conditions where satellite data may be prone to errors [43].
Urban areas can be photographed by UAVs with thermal cameras, which can be used to pinpoint hot and cold spots. UAVs may measure LST over various parts of the city at various times of the day, providing information that can also be used to determine the causes of micro UHIs [44,45]. UAV-based studies of UHI can be especially helpful in cities with clearly defined land uses, such as commercial and residential districts because these areas typically have particular characteristics. For instance, commercial districts might have more paved surfaces, which may raise LST, but residential areas might have more green areas, which may lower LST. In such locations, UAVs can give a more precise measurement of LST variations than conventional approaches or ground measurements, which might not completely cover the region of interest or measure data with the same level of accuracy [46].
For cities with land uses that are not well-defined [47], measuring UHIs may be difficult. However, UAVs can offer a detailed perspective of the urban landscape in such cities, where land use patterns are unorganized, making it difficult for ground observations to provide the same information [48]. Flying the UAV at various altitudes to take thermal photos of the urban area from various angles can assist in locating hot and cold spots [49] and patterns in the LST variation that might be associated with particular land uses. Likewise, thermal photos from UAVs can be analyzed using machine learning algorithms to find LST patterns related to various land uses. Although using UAVs in cities with ill-defined land uses may require complex analysis, the results can help identify the causes of UHIs and devise mitigation plans.
Multiple studies on urban LST variation have used UAVs. In Yerevan, Armenia, the green area was found to have a significant impact on LST variation and, despite a difference of two days between Landsat and UAV data, the same pattern was observed in both [50]. The performance of a thermal-equipped UAV was validated with 160 ground points on the campus of Changwon National University in South Korea. Physical factors, such as buildings, caused differences in LST between the UAV and in situ measurements. Camera specification and weather conditions likewise influenced UAV performance [51]. Kim et al. [52] compared the performance of UAV-derived LST with that of Landsat 8 using ground data at Geum River Park in Sejong, Republic of Korea. The UAV-acquired LST showed a better correlation with the ground measurement as compared with the LST from Landsat. The LST from UAVs had a correlation of 0.912 with the ground data, and Landsat had a correlation of 0.3. Thermal imaging-equipped UAVs have a strong record of performance. However, these aforementioned UAV studies did not measure the LST variation among different LUs within an urban area, which is the focus of this study.
Although some studies have used UAVs to estimate LST, more work is required to answer questions remaining on the influence of heterogeneous land uses in urban areas on LST. Additionally, the microscale surface urban heat island phenomenon can be better investigated and quantified using UAVs due to the high spatial resolution of UAV-collected data. Furthermore, high spatiotemporal monitoring of LST is beneficial for several scientific analyses [53]. LST can significantly vary within a meter in a short span of time owing to many reasons, including wind direction and speed, cloud movements, and irrigation activities [54], which affect soil heating, vegetation, and atmosphere throughout the day [55,56]. In various land surface model studies, LST is often calculated at a coarse grid value, including multiple land uses. Therefore, estimating LST at a meter scale would be helpful for measuring heat fluxes, the atmospheric surface layer, land-atmospheric feedbacks, and providing insight to studies concerned with LST heterogeneity at the finest possible scale [57,58].
Cities are engines of growth. With the anticipated growth in urban populations, cities will be prone to diverse challenges. The United Nations Sustainable Development Goal (SDG) 11 “Make cities and human settlements inclusive, safe, resilient and sustainable” focuses exclusively on cities. Urbanization plays a role in influencing local climatology. The evaluation of LST in connection with LU at a micro-scale within an urban area can help urban planners better design neighborhoods, eventually assisting in achieving sustainable development. High temperatures are considered to have negative impacts on human health and life. The 2011 heat wave in Texas, the most severe since 1985, caused a 5.8% increase in elderly mortality risk [59]. Therefore, observing the LST variation at a high spatial scale in different LUs will provide pragmatic ways to reduce the severe impacts of extreme events and help achieve SDG 11.
The overall objective of this study is to estimate small-scale variations in LST occurring within and between different LUs in an urban area. LST is compared with satellite-derived LST to observe if the thermal sensor onboard UAVs can capture the MUHI, which may be overlooked in satellite data owing to their coarse spatial resolution.
2. Materials and Methods
2.1. Study Area
Dallas–Fort Worth is the largest landlocked metropolitan area in the United States and the 4th largest by population, with 7.6 million people. According to the US Census Bureau, the population of DFW has increased by 1.2 million in the last decade–meaning it has a growth rate of three times other large metropolitan areas. The region is expected to reach 10.5 million by 2040 [60].
Located in North Texas, the climate of DFW is humid subtropical. The average annual rainfall in the DFW area varies from 500 to 1200 mm. The site selected for this study is in Arlington, the third largest city in the DFW area (see Figure 1). This area has diverse LUs, including industrial areas (IA) with a rubber supplier, thermal insulation, chemical, and engineering company buildings, etc., residential low-cost (RLC) with factory-manufactured homes, residential high-cost (RHC) comprising a gated community, and a park area (PA) with a green cover and a small river. Two residential LUs have been selected because their spatial configuration, green cover, and roof colors are different. Moreover, residents in RHC may have higher incomes compared to the residents of RLC. These diverse LUs also include some of the urban built-up and natural land cover features categorized in typical land use classifications, i.e., Local Climate Zone and National Land Cover Database. The area of IA, RHC, RLC, and PA is 0.0387 km2, 0.0256 km2, 0.0392 km2 and 0.0313 km2, respectively. The selected study site does not fall under any Federal Aviation Administration (FAA)-controlled airspace, and no drone authorization was required to fly.
2.2. Data Collection
2.2.1. Thermal Sensor-Equipped UAV
The UAV used for this study was a DJI Matrice 300 RTK equipped with a Zenmuse H20T payload. The Zenmuse H20T has zoom, wide, and thermal cameras and was used to capture the LST. The characteristics of the UAV and payload are listed in Table 1.
In total, 12 flights were performed (see Table 2). The data from eight flights performed between 24 September 2022 and 19 October 2022 were used for LST analysis and estimation of micro-urban heat islands (MUHI). The data from four flights performed in February 2023 were used for in situ data validation (See Table 2). During these periods, the cloud cover was less than 30%. Flights were performed during the day, because, unlike the atmospheric UHI, surface UHI is prominent during daytime [61]. Intense surface UHI occurs during the daytime because abundant vegetative cover in rural/sub-urban areas produces strong evaporative cooling effects [62].
Flight altitude was maintained at 91 m for all flights. The front and side overlap ratio was set to 80%. A margin of 25 m was set so that the study area was completely covered in the orthomosaiced image produced after the flight. Individual flight mission paths were created in the Keyhole Markup Language (KML) for each LU in the study area and uploaded to the remote controller of the UAV. The UAV was flown into the study area, and images were obtained using the Zenmuse H20T camera. Thermal images were processed using the ATygeo thermal tool and orthomosaiced in Pix4Dmapper to obtain radiometric orthomosaiced thermal images of the area. The wide-angle images of the Zenmuse H20T camera were orthomosaiced for each LU of the study area using Pix4Dmapper, as shown in Figure 2.
2.2.2. Landsat 8-9
Thermal data in Landsat 8-9 are collected using an Operational Land Imager (OLI) and Thermal Infrared Sensor (TIRS). Landsat 8-9 has 11 bands. In TIRS, data from two thermal bands (Band 10 and 11) are resampled from a 100 m resolution to 30 m, with spectral resolutions of 10.6–11.19 m. Collection 2 level 1 Landsat images of the study area were obtained from the United States Geological Survey (USGS). The Landsat 8-9 satellite provides images of the study area at 17:02 every eight days due to overlapping 16-day revisit cycles.
2.3. Image Classification
Supervised maximum likelihood classification (MLC) was used for image classification to determine the area of different land covers (roof, pavement, green, and water) in the study area. MLC is commonly used in remote sensing and image processing for classifying pixels within an image into different land cover classes. It aims to assign a pixel to the class that is most likely to have generated its spectral signature. A set of training samples was selected, which consisted of pixels that were known to belong to specific land cover classes, i.e., roof, pavement, green, or roof (cold) for each LU. A signature file was prepared for the training samples. Afterward, the MLC tool in ArcGIS was used with the original image of the LU as the input raster, and the signature file with training samples was loaded to generate a classified image.
Supervised MLC is a widely used and robust method for land cover classification, but its accuracy can be affected by factors such as the quality of the training data and the number of classes. An accuracy assessment of the MLC image for each LU was also performed. First, accuracy assessment points were created following a random sampling strategy. Second, the ground truth field was populated based on the land cover. Finally, the confusion matrix was calculated for each LU. A confusion matrix, also called an error matrix, compares the relationship between a classified image and a reference image. It provides user accuracy (Equation (1)), producer accuracy (Equation (2)), and overall accuracy (Equation (3)). The kappa coefficient, which measures the degree of accuracy of the classified image, is also calculated by the confusion matrix in ArcGIS. The kappa coefficient value ranges between 0-1. A value close to 1 indicates good classification performance.
2.4. Thermal Image Processing
The thermal images acquired from Zenmuse H20T were in a Radiometric JPG (RJPG) format. The ATygeo Thermal tool was used to convert the RJPG images to tiff while maintaining the temperature data. The ATygeo Thermal tool requires values for distance (m), humidity (%), emissivity (%), and ambient temperature (°C). Meteorological parameters, i.e., humidity and temperature, were obtained from the Arlington Municipal Airport (KGKY) and from a hygrometer (see Table 1). Emissivity values in the spectral range of 8–14 m were used based on the emissivity of the four primary land covers in each LU.
Each LU mainly comprises the following four types of land cover: roof, pavement (road and sidewalks), green area, and water. A classified image obtained from the MLC technique was used to calculate the percentage area of the roof, pavement, water, and green cover for each LU (see Table 3). The roofing in IA is mostly PVC and insulated panels. The roofing in most RHC and RLC buildings is asphalt shingle. Pavement in IA is mostly concrete. Pavement in RLC and RHC is a combination of concrete and asphalt. A weighted emissivity value for each LU was calculated based on the emissivity value of each land cover type (roof, pavement, water, and green cover) and its area within each LU. Similarly, the albedo was also estimated.
After processing the thermal images using ATygeo Thermal, Pix4Dmapper was used to generate the radiometric thermal orthomosaic of each LU. Pix4Dmapper is a licensed photogrammetry tool used for drone mapping.
2.5. Micro-Urban Heat Islands
Considering the LST variation observed during each flight, the MUHI was calculated as the maximum difference of mean LST between any two LU in the study area. Using the mean LST for each land cover (roof, pavement, green, water) in each LU, the heat island effect was calculated as the difference between the maximum and minimum mean LST of any land cover in each LU.
2.6. LST Comparison between Zenmuse H20T and Landsat 8-9
The LST values obtained from the Zenmuse H20T were compared with the LST acquired from the Landsat 8-9 imagery for two flights. One UAV flight was operated on 2 October around 17:00, one day before Landsat 8-9 flew over. While the UAV measurements were taken on the day before Landsat, both days had similar weather conditions. The second UAV flight was conducted on 19 October between 16:30 and 17:30 to coincide with the Landsat flyover. The process for retrieving LST from Landsat 8 detailed by Avdan and Jovanovska [63] and Mukherjee and Singh [64] was used here. First, the Top of Atmospheric Spectral Radiance was calculated using Equation (4).
Here, is the band-specific multiplicative rescaling factor, and is Band 10. AL is the radiance additive scaling factor for the band. is the correction value for band 10 (0.29). Values of (0.00038) and (0.1) were taken from the USGS metadata files. Radiance was converted to the at-sensor temperature (BT) in degrees Celsius using Equation (5).
(1329) and (799) are thermal constants for band 10, which were obtained from metadata files. The Normal Difference Vegetation Index (NDVI) was calculated with Equation (6).
Band 5 is the near-infrared band and band 4 is the red band. The proportion of vegetation (Pv) was calculated using Equation (7). is the (Equation (6)) calculated for areas with vegetative cover, and is NDVI calculated for areas with bare soil. Wang et al. [65] suggested = 0.5 and = 0.2 to be used in global conditions. Afterward, emissivity was estimated using Equation (8). Finally, LST in degrees Celsius was obtained using Equation (9).
2.7. In Situ LST Measurement
To validate the LST data collected from the Zenmuse H20T thermal camera, LST was measured at 14 points on the ground in IA (see Figure 3) using an infrared thermometer (see Table 1). IA was the home base during UAV operations, making IA the logical location to take comparative in situ measurements. The purpose of in situ measurements was to compare LST with the UAV for land covers, i.e., roof, pavement, water, and green area. Validation points were limited to IA because it was the flight base station, and the team had to remain together for the data collection efforts. As IA has no water body and roofs could not be accessed, 14 random points were selected, which covered pavement and green areas. The measurement protocol was to compare UAV data with in situ measurements over different times of the day (morning to evening). However, due to operational limitations and logistical challenges, it was difficult to continuously fly UAVs at different times of the same day. Therefore, the UAV was operated on 21 February at 09:30 and 11:45 and on 19 February at 15:30 and 16:45. These four flights are in addition to the eight flights conducted in September and October 2022 and are solely used for ground validation (see Table 2).
3. Results
3.1. In-Situ Temperature Measurement
The infrared thermometer was used to measure LST on the ground at 14 points in IA to be compared with Zenmuse H20T. Overall, the Zenmuse H20T showed a good relationship with the in situ data. Percentage bias (PBIAS) was estimated each time. A PBIAS of 6.7, 5.5, 0.9, and 7.2% was noted at 09:30, 11:45, 15:30, and 16:45, respectively (Table 4). Similarly, Root Mean Squared Errors (RMSEs) of 1.7, 3.2, 1.5, and 1.9 °C were obtained for the flights performed at 09:30, 11:45, 15:30, and 16:45, respectively. The flight conducted at noon produced the largest RMSE and a larger standard deviation than the other flights. Lower standard deviations and RMSEs were reported in the afternoon, i.e., at 15:30 and 16:45. Kim et al. [52] estimated accuracy of UAV-based thermal cameras with in situ measurements and found better results in the summer season with RMSE ranging from 2.52–3.49 °C whereas, in autumn and winter, RMSE varied from 3.83–5.39 °C. However, in this study, the in situ validation performed in the month of February (one of the coldest months in the study area) also showed encouraging results with RMSE varying between 1.5–3.2 °C. In sum, in situ measurements were not significantly different from the LST measurements obtained with the Zenmuse H20T.
3.2. Image Classification
The confusion matrix was calculated for each LU to ascertain the overall accuracy of the image produced using MLC (See Table 5). Here, P-A and U-A mean producer accuracy and user accuracy. The overall accuracy of all LUs was above 90%. For RHC, RLC, IA, and PA, the overall accuracy was 92%, 93%, 92%, and 95%, respectively. An overall accuracy above 85% is considered very good for remote sensing image classification [66,67]. The kappa coefficient was also estimated for each LU. A kappa value of 0.87, 0.89, 0.88, and 0.87 was found for RHC, RLC, IA, and PA, respectively. Overall, accuracy and the Kappa coefficient for each LU were in an acceptable range.
3.3. LST Variation among LUs and MUHI Estimation
The temporal variation of LST in each LU was calculated. In the morning, IA showed the highest mean LST as compared to other LUs (see Table 6). At midday and in the evening, RHC had the highest mean LST. RLC and RHC usually reported similar LSTs. PA typically had the lowest mean LST at all times; however, IA showed the lowest mean LST for the flights conducted in the late afternoon (16:20 and 17:30). Flights at 16:20 and 17:30 were performed on 17 and 19 October, respectively, shortly after a rainfall event on 16 October. All LUs demonstrated an increase in the mean LST after 12:00 except for the flights at 16:20 and 17:30, which show lower LST due to the cooling effects of recent rainfall (see Figure 4). Figure 4 also illustrates the range of LST for each LU from morning to evening. RHC and RLC showed the largest range of LST at noon. Overall, IA showed the highest range of LST, and PA recorded the lowest range (see Figure 5).
The plot (see Figure 5) illustrates a similar LST distribution for residential neighborhoods (RHC and RLC) which differs from the other LUs. PA is mainly a natural land cover consisting of green cover and flowing water. However, RLC, RHC, and IA are urban clusters; thus, a large variation in LST was observed due to the use of construction materials with different heat capacities [68]. In IA, some roofs reported extremely low temperatures. A few industries working with thermal insulation are located within the IA. The Zenmuse H20T thermal camera reported consistently lower or sometimes negative temperatures on a large part of the roofs of these buildings, as shown in the blue polygons in Figure 3. These roofs significantly impact the mean LST in IA and will hereafter be referred to as “cold roofs.”
Cold roofs had a considerable influence on the mean LST of the IA. If the cold roofs are excluded from calculating the mean LST, there is a difference of almost 9.70 °C and 10.50 °C at 16:20 and 17:30, respectively, as seen in Table 6. Cold roof buildings use insulated materials for cold storage purposes. Different types of cold insulation are used (e.g., phenolic foam, polyethylene foam) with service temperatures as low as −180 °C and as high as 150 °C [69]. The presence of these insulation materials on cold roofs may be the reason for low LST measurements. Moreover, low temperatures may result from the reflected temperature, wherein the thermal imaging camera is actually measuring the temperature of thermal radiation emitted from any nearby colder object and not from the target surface [70]. For example, a panel next to a liquid Nitrogen tower outside one of the cold roof buildings was measured to be −35 °C at around 16:00. Thus, the Zenmuse H20T thermal camera reported lower temperatures for these panels installed on cold roofs.
In addition, the Zenmuse H20T thermal camera consistently reported lower or negative LST for white-colored metal parking roofs in RLC and RHC. White shining metal objects have low emissivity values, which causes thermal cameras to confuse them with cold objects. Thermal imaging of highly reflective surfaces, when viewed directly from above, showed temperatures as low as −60 °C, because of the reflection of the “cold sky” and minimum thermal radiation [71]. The same phenomenon has been noted in the case of a white-colored metal roof and other similar surfaces in the RLC and RHC. The UAV captured thermal images of the study area directly above the surfaces. However, abnormal temperature values were removed by using the Interquartile Range outlier technique.
The UAV was able to detect minute LST. Statistics for all eight flights are shown in Table 7. LST values as high as 64.5 °C were observed. Given the high resolution of the thermal camera, it can detect even the smoke of a cigarette placed on the road, explaining why such anomalous temperatures have been recorded [72]. The built-up areas, i.e., RHC, RLC, and IA, showed nearly two times higher standard deviation than the PA.
The intensity and temporal variation of the MUHI were observed. PA was consistently the LU with the lowest mean LST except at 09:30, whereas the highest mean LST was found in LUs with urban characteristics (RHC, RLC, and IA). Figure 6 shows the temporal variation of the MUHI. It can be inferred that the MUHI is less intense in the morning. During the morning, MUHI scores of 4.90 °C and 4.40 °C were calculated between IA (maximum) and RHC, and PA (minimum), respectively. The MUHI intensified by noon and remained high afterward. RHC had the maximum mean LST in the late afternoon/evening hours, and PA exhibited the lowest mean LST, causing intense MUHI in the afternoon and evening. The MUHI illustrates a pattern of being lowest in the morning, peaking at noon, and slightly decreasing in the afternoon/evening time.
3.4. LST Variation and Heat Island Estimation in Each LU
The LST of different land covers (roof, pavement, green, and water) within each LU was also calculated. Figure 7 shows the mean LST of all land covers in each LU over time. In RLC, the pavement had the highest mean LST, and the green cover had the lowest mean LST. The pavement reported a maximum diurnal mean LST range up to 26.37 °C between 09:00 and 18:00. The roof reported the highest mean LST in RHC, with the green cover showing the lowest mean LST on all flight days.
In RHC, roofs showed a mean LST range of up to 35.67 °C. In IA, the green area and pavement observed a higher mean LST than the roofs. After the rainfall event (16:20 and 17:30), entire cold roofs reported negative mean LST. Cold roofs had a maximum mean LST range of 32.6 °C from 09:00–18:00. In PA, green areas showed a maximum mean LST range of 21.6 °C. Water showed a lower mean LST than green cover almost all the time. Small creeks flowing through the PA are generally shaded by trees and hence have a lower mean LST.
Roofs in RHC reported the maximum mean LST and largest LST variation among all LUs. There is a sharp increase in the mean LST from morning to noon for roofs in RHC, as depicted in Figure 7a. Factors including (1) variety of installations on the rooftop (solar heating system and solar boilers, etc.), (2) changing paint area, and (3) multiple anthropogenic activities inside the building play a pivotal role in the large variation in LST in roofs [73]. Roofs in RHC are generally dark, which may contribute to a higher LST than in RLC, where roofs are a mixture of light and dark colors. Roofs in IA showed a minimum mean LST for all times of the day among all LUs, except morning. This is primarily because of the type of material used by the industries on some roofs, which persistently reported low temperatures.
The pavement in RHC and RLC had a slightly higher mean LST than the pavement of IA, as shown in Figure 7. It is pertinent to mention that the pavement in IA is composed of concrete, whereas it is asphalt and concrete in RLC and RHC. However, more traffic movement was observed in IA because flights were conducted during business hours. The vehicle blocks the radiation of the sun causing a lower LST on the surface, which is called heat shadow [74]. This resulted in lower LST of the pavement under the shadow of the car as compared to the surrounding pavement. Moreover, IA showed the highest mean LST for green cover among all LUs. IA does not have many trees, and most of the green cover is thin grass near buildings. This thin grass has exposed soil patches, which absorb more heat and have a low albedo [75], therefore, producing a high LST.
As the MUHI was calculated among LUs, heat islands were also found within each LU. Figure 8 explains the temporal variation of the magnitude of heat islands in all LUs. IA reported the highest heat islands most of the time, except at 12:00 when RHC showed the highest heat island (17.4 °C). In IA, the heat island was intense on post-rainfall days with values of 23.5 °C and 22.5 °C on the 17th (17:30) and 19 (16:20) October, respectively. This was because of significant drops in LST for all cold roofs after rainfall. Contrary to IA, all other LUs showed a decrease in the heat island immediately after rainfall, i.e., 17:30.
Overall, minimal heat islands were detected in PA, with heat islands ranging between 0.3 °C and 3.3 °C. IA reported the highest heat islands, ranging from 10.7 °C to 23.5 °C, due to the influence of the cold roofs. Heat islands in RLC ranged between 1 °C and 8.9 °C. Up until 12:00, the maximum LST difference was observed between the roof (highest mean LST) and the green area (lowest mean LST).
However, from 12:00 to 16:00, the highest mean LST was pavement, while the green area continued to have the lowest mean LST. For RHC, heat islands ranged between 2.4 °C and 18.6 °C. At 09:30 and 10:00, the maximum LST difference was recorded between pavement (highest mean LST) and green area (lowest mean LST). From 12:00 to 18:00, the maximum LST difference was observed between the roof (highest mean LST) and green area (lowest mean LST). Despite having a similar % of green area in RHC and RLC (see Table 3), more intense heat island formation was observed in RHC.
3.5. LST Comparison between Zenmuse H20T and Landsat 8-9
The performance of Zenmuse H20T was compared with Landsat 8-9. The mean LST comparison between Zenmuse H20T and Landsat for each LU on the 2nd and 3rd October, respectively, is shown in Figure 9a. The Zenmuse H20T recorded a higher mean LST than Landsat in each LU. However, both showed a similar trend with the lowest mean LST in PA and highest mean LST in RHC, as depicted in Figure 9a. The datasets were highly correlated (R2 = 0.94).
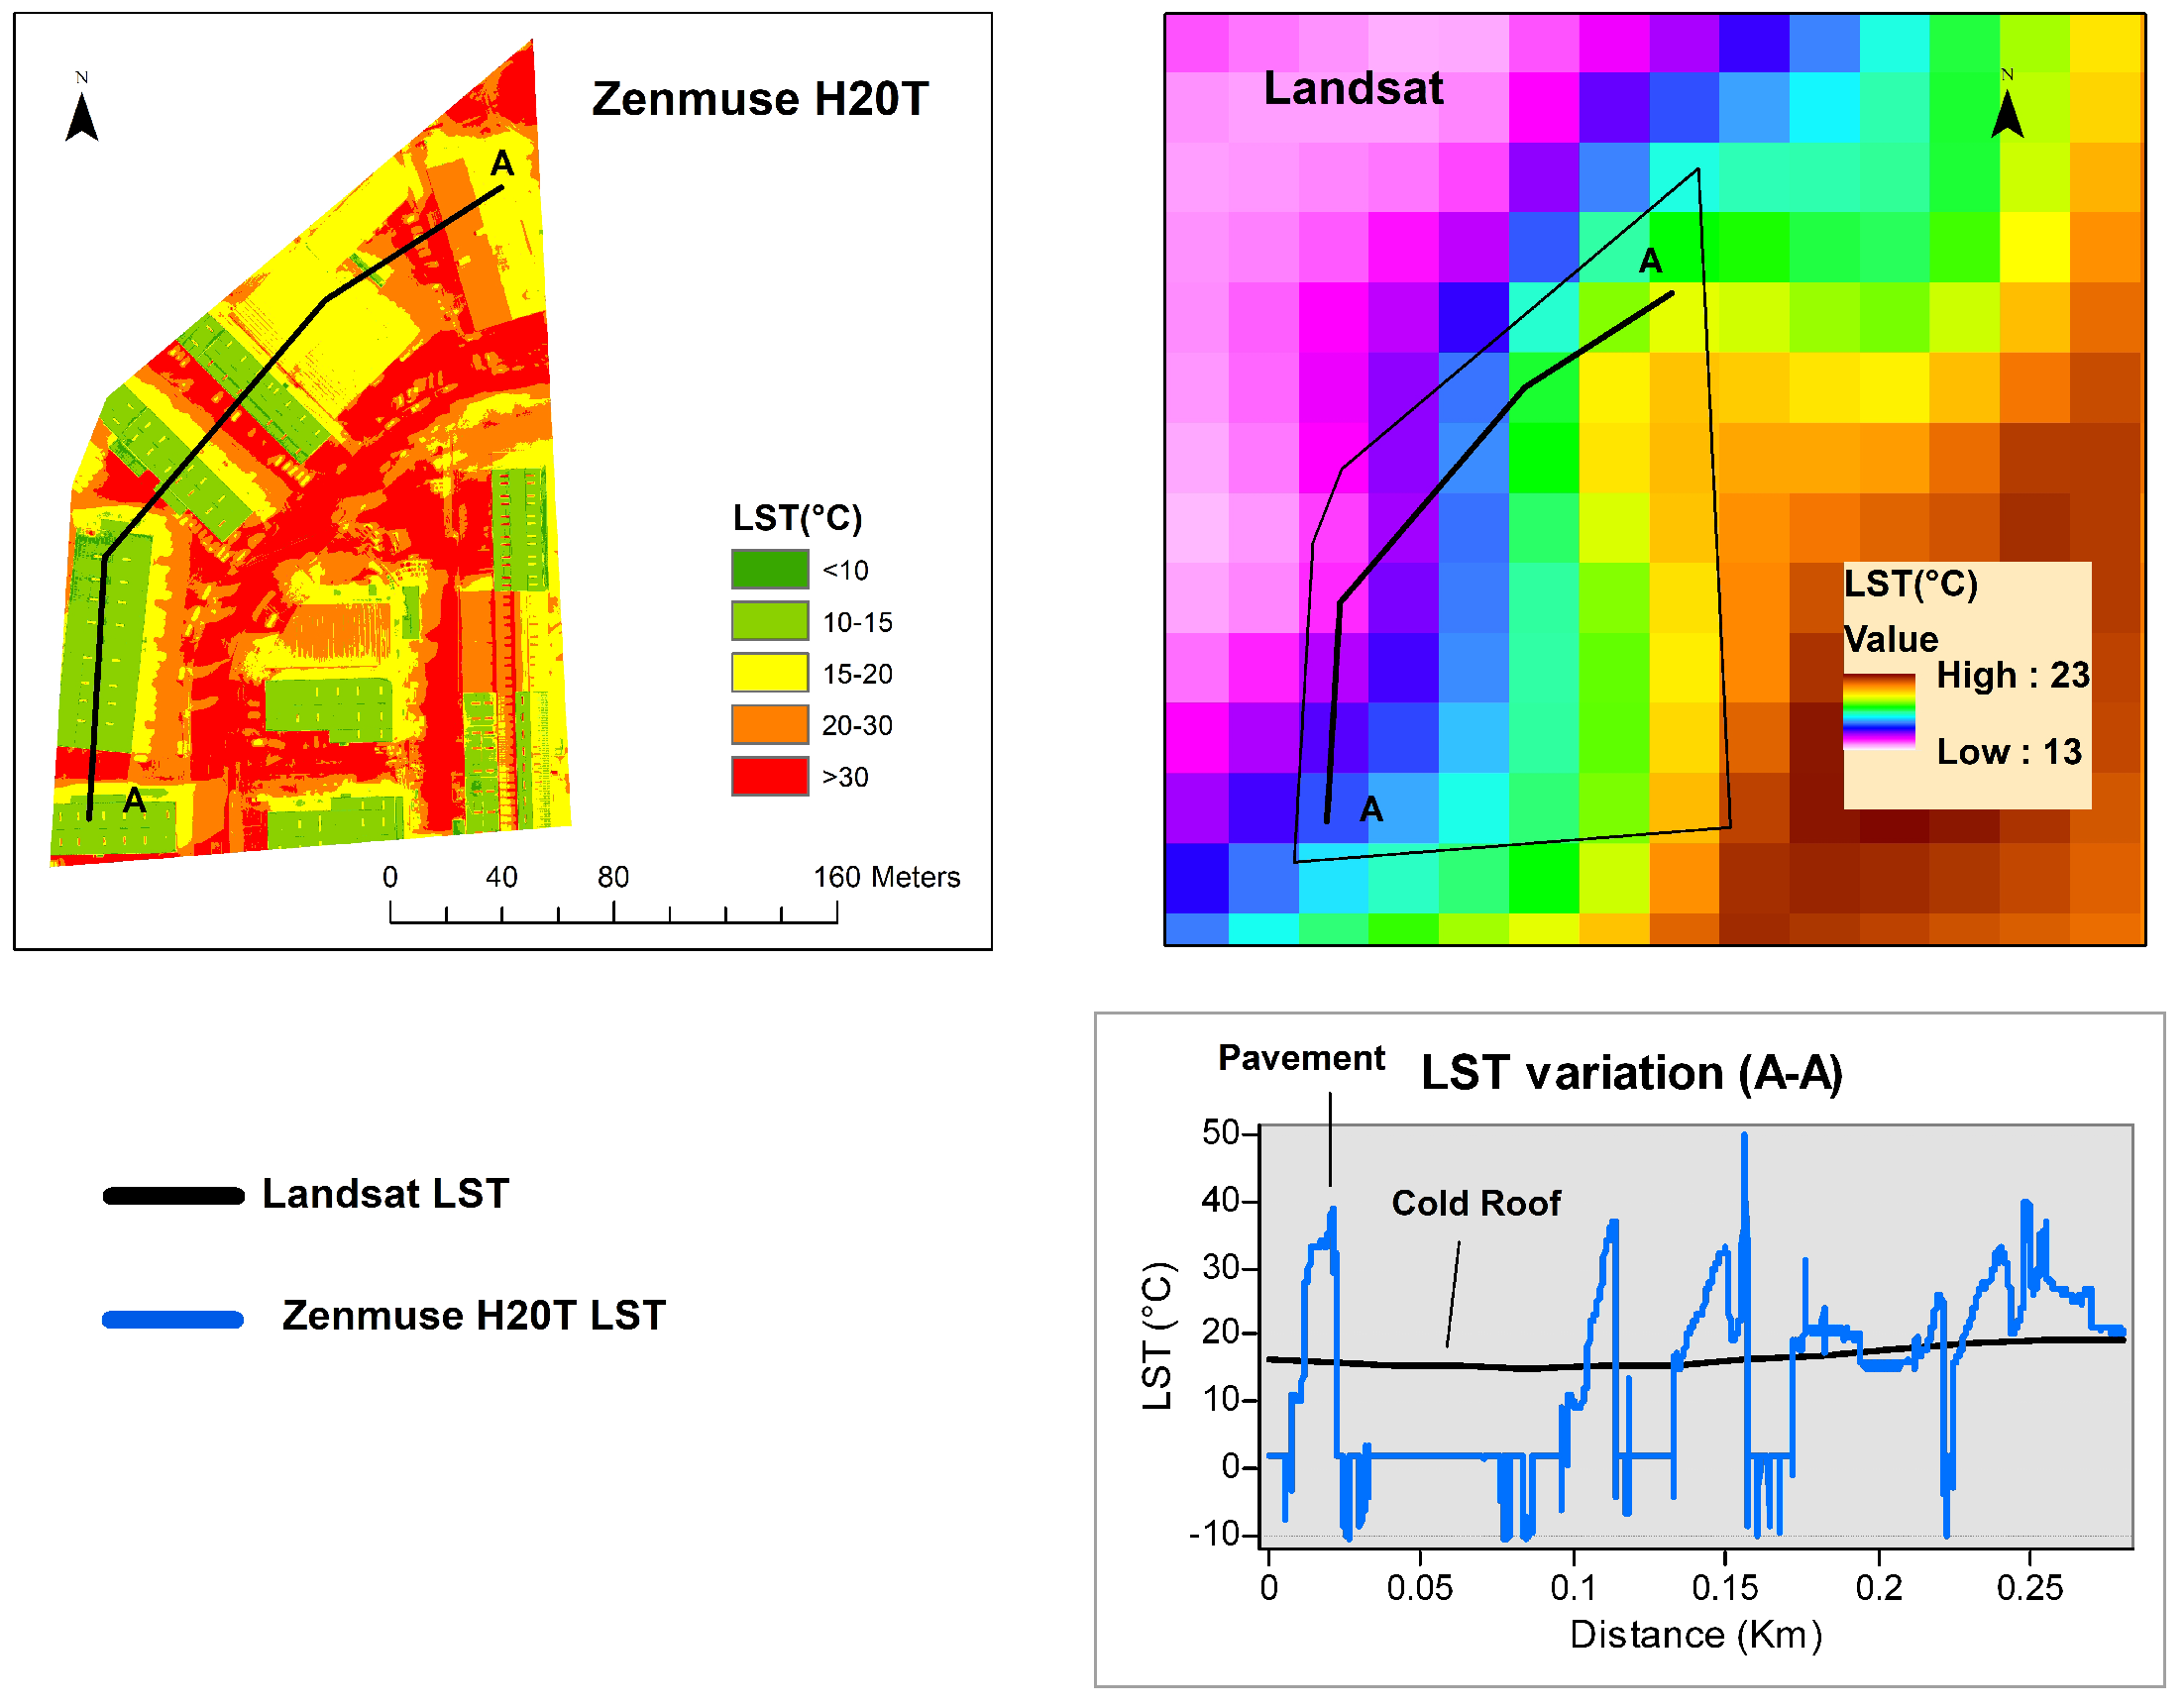
A UAV flight was performed on 19 October 2022 to capture LST in the study area for the same time as the Landsat flyover, i.e., 17:02. The mean LST comparison for Landsat and Zenmuse H20T is shown in Figure 9b. Landsat showed a minimum mean LST in PA and maximum mean LST in RHC. However, Zenmuse H20T reported a minimum mean LST in IA and a maximum mean LST in RHC. Remember this flight was conducted during a post-rainfall event that occurred on 16 October 2022. Cold roofs in IA showed a mean LST of 0.61 °C after the rainfall event, as recorded by the Zenmuse H20T, resulting in a mean LST of 15.34 °C in IA. If the cold roof LST reported by the Zenmuse H20T is excluded, then the mean LST for IA is 25.02 °C, resulting in PA having the lowest mean LST, as was seen with Landsat. In comparison to the measurements from 2 and 3 October, a weak correlation (R2 = 0.478) was observed between Landsat and Zenmuse H20T on 19 October 2022. This was mainly due to the large difference in the cold roof LST in IA between Landsat and Zenmuse H20T (see Table 8, Figure 10a,b). However, Figure 11 shows that despite having a coarser spatial resolution than the Zenmuse H20T, Landsat did show a slightly decreasing trend in LST on a cold roof which may signal the cold roof effect.
Moreover, the Zenmuse H20T detected a MUHI of 15.00 °C on 2 October between RHC (highest mean LST) and PA (lowest mean LST). Conversely, Landsat reported a MUHI of 6.51 °C between RHC (highest mean LST) and PA (lowest mean LST) on 3 October. Likewise, Zenmuse H20T detected a MUHI of 15.86 °C on 19 October between RHC (highest mean LST) and IA (lowest mean LST). Landsat reported a MUHI of 6.59 °C between RHC (highest mean LST) and PA (lowest mean LST) at the same time. This demonstrates the superior capability of UAVs in capturing fine-scale LST variability.
The mean LST calculated for land covers from the Zenmuse H20T and Landsat in IA, RHC, and RLC on 19 October is provided in Table 8. Except for roofs (cold and normal) in IA, Landsat reported a lower mean LST for the roof, pavement, and green area in IA, RHC, and RLC. Green areas had the lowest reported mean LST difference of 3.77 °C, 6.64 °C, and 5.01 °C for IA, RLC, and RHC, respectively. For pavement, a mean LST difference of 3.89 °C, 14.27 °C and 11.77 °C was found for IA, RLC, and RHC, respectively. The mean LST difference for the roof was 10.03 °C and 17.01 °C for RLC and RHC, respectively.
4. Discussion
Various studies have estimated the Surface Urban Heat Island (SUHI) effect using satellite products. Studies reveal city centers to be the warmest part of the urban area [76,77]. Peng et al. [78] estimated SUHI in 37 cities of the United States and found the annual daytime surface UHI to be around 2.3 ± 1.6 °C. This study captured MUHIs varying between 4.83 °C and 15.86 °C among four urban LUs covering less than a square kilometer and not located within the city center. Moreover, SUHIs tend to be intense in the summer months [62,79]. However, this study recorded high MUHI between late September and October, which is not the hottest time of the year in North Texas. Moreover, excluding the cold roof effect in IA, RHC recorded the highest heat island. Reduced ventilation due to the narrow streets and closely spaced houses/buildings in RHC as compared to RLC and IA could possibly have caused high heat islands. This UAV-based MUHI study facilitates the detection of high-temperature spots arising due to anthropogenic activities and can inform efforts to make metropolitan areas resilient to microclimate changes [80]. Moreover, the knowledge of MUHI intensity can indirectly help in the pragmatic planning of energy consumption.
IAs are mostly hotspots of high temperatures in urban areas owing to high heat emissions [8,81,82]. However, this study found IA to be cooler than the nearby residential LUs. As thermal companies located in IA have “cold roofs,” this reduced the mean LST of the IA. Despite the “cold roofs” being excluded, the IA still had a lower reported mean LST than residential LUs, except in the morning.
Moreover, the geometry of LUs also influences the LST variation [83]. The IA has wider pavement sections and recorded an average of 5 °C lower mean LST than the narrow pavements of residential LUs. Shishegar [84] conclude that wider streets/pavements allow better air mixing and improve thermal comfort. Street geometry is an important aspect of city design and, thus, requires careful consideration to alleviate UHI effects [85].
Moreover, pavement material type, i.e., concrete or asphalt, influenced LST. Pavements in IA are concrete in comparison to asphalt and concrete pavements in RLC and RHC. Kaloush et al. [86] found concrete pavements to be around 6 °C cooler than asphalt pavements at their peak temperatures in laboratory testing. This study also observed concrete pavements to be cooler than asphalt pavements.
In addition, roof color has a considerable influence on the intensity of LST [87,88]. In this study, the LST of dark-colored roofs spiked from noon-onwards. This developed an intense heat island in the RHC. On average, an 18 °C heat island was found between dark-colored roofs and the green area of the RHC in the afternoon. In addition to increases in energy consumption [89], this thermal difference in a small area can negatively affect the livability of the residents in many ways [90]. Despite having similar green areas in two residential LUs, i.e., RHC and RLC, a more intense heat island was recorded in RHC due to dark-colored roofs. Therefore, urban planning to mitigate SUHI should also consider the role of roof color on LST.
High spatial resolution UAVs can provide useful insight regarding LST variation as compared to coarse resolution satellite products [91]. This study found similar LST trends between Landsat and UAV among LUs, but Landsat reported lower MUHI and heat islands. The large LST differences could be explained by the inverse-square law, which states, “The intensity of radiation emitted from a point source varies as the inverse square of the distance between source and receiver” [92]. The Zenmuse H20T was able to obtain strong thermal infrared signals owing to its proximity to the source, but Landsat was unable to capture the minute LST variations, as reported by the Zenmuse H20T. However, only a limited comparison between Landsat and UAV LST could be performed for this study because Landsat data obtained on some flight days was affected by weather conditions, such as cloud cover. Urban studies aimed at understanding high spatial LST variation and MUHI behavior can leverage UAV technology.
This study adopted a unique approach by not using typical LU classifications and instead studied a contiguous area with different LUs in a metropolitan area. As this type of LU heterogeneity is possible in metropolitan areas, the results of this study can inform research focused on capturing and mitigating MUHI for improved decision-making in urban areas.
This study has some limitations. The Zenmuse H20T thermal sensor onboard the UAV was highly sensitive to white metallic shining surfaces because of little to no emissivity from these surfaces. In addition, certain operational limitations occurred at the site while using the UAV. These include (1) a flight altitude restriction of 400 ft imposed by the FAA, (2) limited battery capacity, (3) flying risks in high wind speeds, and (4) the requirement of UAVs to be in a constant line of sight, which makes it hard to operate in areas with high rise buildings. Lastly, these results may not be universally applicable, given the variability of climate and geography worldwide.
5. Conclusions
With an anticipated increase in urbanization, local climatology must be better understood. LST is an important climate variable that is influenced by urban areas. Considering the heterogeneity in urban areas, large LST variations within a short distance are expected. Remote sensing techniques have been utilized to capture this LST variation. Multiple satellite products offer LST data. However, their spatial and temporal resolutions are inadequate for capturing microscale LST variations and LU changes within a kilometer-scale in an urban area. Landsat offers LST data with a 30 m × 30 m resolution but with a revisit time of 16 days. To resolve these limitations associated with satellite products, UAV technology can be utilized to measure LST at the micro-scale with a thermal imaging camera onboard.
This study utilized a Zenmuse H20T camera with a spatial resolution of 8 cm onboard a UAV to identify LST variations in an urban area. RHC reported the highest mean LST, except in the morning. Dark-colored roofs in the RHC primarily caused the relatively high LST. The mean LST variation in RLC was similar to RHC. PA showed the lowest mean LST overall. IA reported the lowest mean LST in the late afternoon–evening. Some buildings in the IA use cold-insulated panels that lead to a reduction in mean LST. During post-rainfall events, these cold roofs led to a drastic reduction in LST. Post rainfall, all LUs reported a decrease in the mean LST. The highest variation in LST was observed in the RHC, whereas PA showed the lowest LST variability. The study was performed between 24 September–19 October, which is not the hottest time of the year in the DFW area. However, large LST temporal variations were still noted. For example, a 35.67 °C variation in LST within roofs in the RHC was recorded in a span of 25 days.
The MUHI among LUs was estimated. PA typically reported the minimum mean LST. The magnitude of MUHI was minimal in the morning and increased around noon and in the afternoon. The heat island within an LU was also estimated. Overall, the highest heat islands were reported in IA. Post rainfall, IA reported a maximum heat island between pavement and cold roof, whereas other LUs showed a reduction in the heat island after rainfall compared with the pre-rainfall measurement. Green cover in PA, RHC, and RLC is mainly composed of trees with a reported minimum LST for each flight. Green cover in IA is thin grass in lawns, which sometimes reported a higher LST than pavements and roofs. Asphalt shingle dark-colored roofs in RHC reported higher LSTs compared to light-colored roofs in IA and RLC. The Zenmuse H20T measured intense MUHI in comparison to Landsat. Moreover, Zenmuse H20T produced an average RMSE and percent bias (PBIAS) of 2.1 °C and 5.1%, respectively, when compared with ground LST measurements. The results of the study help to understand the LST variation within a heterogeneous urban area better. Urban planners may use their findings to inform the design of cities to mitigate microscale UHI effectively.
6. Future Work
This research is ongoing. Additional flights will be performed during the summer season to identify the seasonal variation of the LST in this study area. Moreover, the MUHI estimation, in situ validation, and comparison with Landsat will be performed simultaneously in the upcoming summer season. Furthermore, Landsat LST will be downscaled to check the applicability of UAV-based data at a consistent spatial resolution.
Author Contributions
J.A. contributed to conceptualization of the study, conducted the data collection and analysis, and prepared the original draft. J.A.E. contributed to conceptualization, supervised the work, and edited the manuscript. All authors have read and agreed to the published version of the manuscript.
Funding
The study was funded by the University of Texas at Arlington.
Data Availability Statement
Access to the data will be provided by the authors upon request.
Conflicts of Interest
The authors declare no conflict of interest.
References
- Brenner, N.; Keil, R. From global cities to globalized urbanization. In The City Reader; Routledge: New York, NY, USA, 2011; pp. 667–684. [Google Scholar]
- Smart, A.; Smart, J. Urbanization and the global perspective. Annu. Rev. Anthropol. 2003, 32, 263–285. [Google Scholar] [CrossRef] [Green Version]
- Gerland, P.; Raftery, A.E.; Ševčíková, H.; Li, N.; Gu, D.; Spoorenberg, T.; Alkema, L.; Fosdick, B.K.; Chunn, J.; Lalic, N.; et al. World population stabilization unlikely this century. Science 2014, 346, 234–237. [Google Scholar] [CrossRef] [PubMed] [Green Version]
- Zhou, W.; Wang, J.; Cadenasso, M.L. Effects of the spatial configuration of trees on urban heat mitigation: A comparative study. Remote Sens. Environ. 2017, 195, 1–12. [Google Scholar] [CrossRef]
- Peng, J.; Ma, J.; Liu, Q.; Liu, Y.; Li, Y.; Yue, Y. Spatial-temporal change of land surface temperature across 285 cities in China: An urban-rural contrast perspective. Sci. Total Environ. 2018, 635, 487–497. [Google Scholar] [CrossRef]
- Jenerette, G.D.; Harlan, S.L.; Buyantuev, A.; Stefanov, W.L.; Declet-Barreto, J.; Ruddell, B.L.; Myint, S.W.; Kaplan, S.; Li, X. Micro-scale urban surface temperatures are related to land-cover features and residential heat related health impacts in Phoenix, AZ USA. Landsc. Ecol. 2016, 31, 745–760. [Google Scholar] [CrossRef]
- Voogt, J.A.; Oke, T.R. Thermal remote sensing of urban climates. Remote Sens. Environ. 2003, 86, 370–384. [Google Scholar] [CrossRef]
- Li, J.; Song, C.; Cao, L.; Zhu, F.; Meng, X.; Wu, J. Impacts of landscape structure on surface urban heat islands: A case study of Shanghai, China. Remote Sens. Environ. 2011, 115, 3249–3263. [Google Scholar] [CrossRef]
- Pervaiz, F. Evaluation of Ice Loads on Beitstadsundet bridge by Deterministic and Probabilistic Approaches. Master’s Thesis, Norwegian University of Science and Technology, Trondheim, Norway, 2019. [Google Scholar]
- Elachi, C.; Van Zyl, J.J. Introduction to the Physics and Techniques of Remote Sensing; John Wiley & Sons: Hoboken, NJ, USA, 2021. [Google Scholar]
- Chapman, S.; Watson, J.E.; Salazar, A.; Thatcher, M.; McAlpine, C.A. The impact of urbanization and climate change on urban temperatures: A systematic review. Landsc. Ecol. 2017, 32, 1921–1935. [Google Scholar] [CrossRef]
- Li, X.; Stringer, L.C.; Chapman, S.; Dallimer, M. How urbanisation alters the intensity of the urban heat island in a tropical African city. PLoS ONE 2021, 16, e0254371. [Google Scholar] [CrossRef]
- Lin, L.; Gao, T.; Luo, M.; Ge, E.; Yang, Y.; Liu, Z.; Zhao, Y.; Ning, G. Contribution of urbanization to the changes in extreme climate events in urban agglomerations across China. Sci. Total Environ. 2020, 744, 140264. [Google Scholar] [CrossRef]
- Kolokotroni, M.; Giridharan, R. Urban heat island intensity in London: An investigation of the impact of physical characteristics on changes in outdoor air temperature during summer. Sol. Energy 2008, 82, 986–998. [Google Scholar] [CrossRef] [Green Version]
- Wong, N.H.; Yu, C. Study of green areas and urban heat island in a tropical city. Habitat Int. 2005, 29, 547–558. [Google Scholar] [CrossRef]
- Chang, Y.; Xiao, J.; Li, X.; Frolking, S.; Zhou, D.; Schneider, A.; Weng, Q.; Yu, P.; Wang, X.; Li, X.; et al. Exploring diurnal cycles of surface urban heat island intensity in Boston with land surface temperature data derived from GOES-R geostationary satellites. Sci. Total Environ. 2021, 763, 144224. [Google Scholar] [CrossRef] [PubMed]
- Hu, L.; Brunsell, N.A. The impact of temporal aggregation of land surface temperature data for surface urban heat island (SUHI) monitoring. Remote Sens. Environ. 2013, 134, 162–174. [Google Scholar] [CrossRef]
- Aniello, C.; Morgan, K.; Busbey, A.; Newland, L. Mapping micro-urban heat islands using Landsat TM and a GIS. Comput. Geosci. 1995, 21, 965–969. [Google Scholar] [CrossRef]
- Stathopoulou, M.; Cartalis, C.; Keramitsoglou, I. Mapping micro-urban heat islands using NOAA/AVHRR images and CORINE Land Cover: An application to coastal cities of Greece. Int. J. Remote Sens. 2004, 25, 2301–2316. [Google Scholar] [CrossRef]
- Wong, M.S.; Nichol, J.; Ng, E. A study of the “wall effect” caused by proliferation of high-rise buildings using GIS techniques. Landsc. Urban Plan. 2011, 102, 245–253. [Google Scholar] [CrossRef]
- Yang, J.; Wang, Y.; Xue, B.; Li, Y.; Xiao, X.; Xia, J.C.; He, B. Contribution of urban ventilation to the thermal environment and urban energy demand: Different climate background perspectives. Sci. Total Environ. 2021, 795, 148791. [Google Scholar] [CrossRef]
- Taha, H. Urban climates and heat islands: Albedo, evapotranspiration, and anthropogenic heat. Energy Build. 1997, 25, 99–103. [Google Scholar] [CrossRef] [Green Version]
- Buyantuyev, A.; Wu, J. Urban heat islands and landscape heterogeneity: Linking spatiotemporal variations in surface temperatures to land-cover and socioeconomic patterns. Landsc. Ecol. 2010, 25, 17–33. [Google Scholar] [CrossRef]
- Kuang, W.; Liu, Y.; Dou, Y.; Chi, W.; Chen, G.; Gao, C.; Yang, T.; Liu, J.; Zhang, R. What are hot and what are not in an urban landscape: Quantifying and explaining the land surface temperature pattern in Beijing, China. Landsc. Ecol. 2015, 30, 357–373. [Google Scholar] [CrossRef]
- Ahmari, H.; Hummel, M.; Chao, S.H.S.; Kabir, S.M.I.; Pervaiz, F.; Acharya, B.R.; Dean, M.; Mowla, Q.A. Identify and Analyze Inundated Bridge Superstructures in High Velocity Flood Events; Technical Report; University of Texas at Arlington: Arlington, TX, USA, 2021. [Google Scholar]
- Lim, S.; Popov, D.; Raza, N.; Pervaiz, F.; Al-Qadi, M. Feasibility Study of Submerged Floating Crossing; TU Delft Repository: Delft, The Netherlands, 2018; Available online: https://repository.tudelft.nl/islandora/search/?collection=education (accessed on 10 December 2022).
- Kappou, S.; Souliotis, M.; Papaefthimiou, S.; Panaras, G.; Paravantis, J.A.; Michalena, E.; Hills, J.M.; Vouros, A.P.; Ntymenou, A.; Mihalakakou, G. Cool pavements: State of the art and new technologies. Sustainability 2022, 14, 5159. [Google Scholar] [CrossRef]
- Xu, J.; Zhang, F.; Jiang, H.; Hu, H.; Zhong, K.; Jing, W.; Yang, J.; Jia, B. Downscaling ASTER land surface temperature over urban areas with machine learning-based area-to-point regression Kriging. Remote Sens. 2020, 12, 1082. [Google Scholar] [CrossRef] [Green Version]
- Li, X.; Zhou, W.; Ouyang, Z.; Xu, W.; Zheng, H. Spatial pattern of greenspace affects land surface temperature: Evidence from the heavily urbanized Beijing metropolitan area, China. Landsc. Ecol. 2012, 27, 887–898. [Google Scholar] [CrossRef]
- Weng, Q.; Lu, D.; Schubring, J. Estimation of land surface temperature–vegetation abundance relationship for urban heat island studies. Remote Sens. Environ. 2004, 89, 467–483. [Google Scholar] [CrossRef]
- Pervaiz, F.; Hummel, M. Evaluation of Climate Change and Urbanization Impacts on Bridges in Harris County, Texas. In Proceedings of the World Environmental and Water Resources Congress 2022, Atlanta, GA, USA, 5–8 June 2022; pp. 499–507. [Google Scholar]
- Ahmad, J.; Eisma, J. Exploring the Role of Urbanization and Wind on the Distribution of Extreme Rainfall by Utilizing High Spatiotemporal Radar Rainfall Product: A Dallas Fort-Worth Case Study. In Proceedings of the AGU Fall Meeting 2022, Chicago, IL, USA, 12–16 December 2022; Available online: https://www.authorea.com/doi/full/10.22541/essoar.167276444.45670980 (accessed on 16 February 2023).
- Ezimand, K.; Azadbakht, M.; Aghighi, H. Analyzing the effects of 2D and 3D urban structures on LST changes using remotely sensed data. Sustain. Cities Soc. 2021, 74, 103216. [Google Scholar] [CrossRef]
- Mushore, T.D.; Mutanga, O.; Odindi, J. Estimating urban LST using multiple remotely sensed spectral indices and elevation retrievals. Sustain. Cities Soc. 2022, 78, 103623. [Google Scholar] [CrossRef]
- Trigo, I.F.; Monteiro, I.T.; Olesen, F.; Kabsch, E. An assessment of remotely sensed land surface temperature. J. Geophys. Res. Atmos. 2008, 2, 113. [Google Scholar] [CrossRef]
- Yu, P.; Zhao, T.; Shi, J.; Ran, Y.; Jia, L.; Ji, D.; Xue, H. Global spatiotemporally continuous MODIS land surface temperature dataset. Sci. Data 2022, 9, 143. [Google Scholar] [CrossRef]
- Hulley, G.; Shivers, S.; Wetherley, E.; Cudd, R. New ECOSTRESS and MODIS land surface temperature data reveal fine-scale heat vulnerability in cities: A case study for Los Angeles County, California. Remote Sens. 2019, 11, 2136. [Google Scholar] [CrossRef] [Green Version]
- Jang, J.C.; Park, K.A. High-resolution sea surface temperature retrieval from Landsat 8 OLI/TIRS data at coastal regions. Remote Sens. 2019, 11, 2687. [Google Scholar] [CrossRef] [Green Version]
- Ahmad, J. Merging Satellite Rainfall Estimates in Scarcely Gauged Basin: A Case Study of Indus Basin. Master’s Thesis, UNESCO-IHE Institute for Water Education, Delft, The Netherlands, 2018. [Google Scholar]
- Jiménez-Muñoz, J.; Sobrino, J. Error sources on the land surface temperature retrieved from thermal infrared single channel remote sensing data. Int. J. Remote Sens. 2006, 27, 999–1014. [Google Scholar] [CrossRef]
- Wang, X.; Prigent, C. Comparisons of diurnal variations of land surface temperatures from numerical weather prediction analyses, infrared satellite estimates and in situ measurements. Remote Sens. 2020, 12, 583. [Google Scholar] [CrossRef] [Green Version]
- Maymandi, N.; Hummel, M.A.; Zhang, Y. Compound coastal, fluvial, and pluvial flooding during historical hurricane events in the Sabine-Neches Estuary, Texas. Water Resour. Res. 2022, 58, e2022WR033144. [Google Scholar] [CrossRef]
- Bai, L.; Shi, C.; Li, L.; Yang, Y.; Wu, J. Accuracy of CHIRPS satellite-rainfall products over mainland China. Remote Sens. 2018, 10, 362. [Google Scholar] [CrossRef] [Green Version]
- Shao, H.; Song, P.; Mu, B.; Tian, G.; Chen, Q.; He, R.; Kim, G. Assessing city-scale green roof development potential using Unmanned Aerial Vehicle (UAV) imagery. Urban For. Urban Green. 2021, 57, 126954. [Google Scholar] [CrossRef]
- Yao, H.; Qin, R.; Chen, X. Unmanned aerial vehicle for remote sensing applications—A review. Remote Sens. 2019, 11, 1443. [Google Scholar] [CrossRef] [Green Version]
- Wu, Y.; Shan, Y.; Lai, Y.; Zhou, S. Method of calculating land surface temperatures based on the low-altitude UAV thermal infrared remote sensing data and the near-ground meteorological data. Sustain. Cities Soc. 2022, 78, 103615. [Google Scholar] [CrossRef]
- Sachindra, D.; Ullah, S.; Zaborski, P.; Nowosad, M.; Dobek, M. Temperature and urban heat island effect in Lublin city in Poland under changing climate. Theor. Appl. Climatol. 2023, 151, 667–690. [Google Scholar] [CrossRef]
- May, D.; Petrov, O.; Saczuk, E. The Urban Heat Island Effect in Densely Populated Urban Areas and Its Implications on Eco-City Planning: Investigation of Vertical Temperature Profiles in Downtown Vancouver. Ph.D. Thesis, British Columbia Institute of Technology, Burnaby, BC, USA, 2021. [Google Scholar]
- Lee, K.; Lee, W.H. Temperature Accuracy Analysis by Land Cover According to the Angle of the Thermal Infrared Imaging Camera for Unmanned Aerial Vehicles. ISPRS Int. J.-Geo-Inf. 2022, 11, 204. [Google Scholar] [CrossRef]
- Tepanosyan, G.; Muradyan, V.; Hovsepyan, A.; Pinigin, G.; Medvedev, A.; Asmaryan, S. Studying spatial-temporal changes and relationship of land cover and surface Urban Heat Island derived through remote sensing in Yerevan, Armenia. Build. Environ. 2021, 187, 107390. [Google Scholar] [CrossRef]
- Song, B.; Park, K. Verification of accuracy of unmanned aerial vehicle (UAV) land surface temperature images using in-situ data. Remote Sens. 2020, 12, 288. [Google Scholar] [CrossRef] [Green Version]
- Kim, D.; Yu, J.; Yoon, J.; Jeon, S.; Son, S. Comparison of accuracy of surface temperature images from unmanned aerial vehicle and satellite for precise thermal environment monitoring of urban parks using in situ data. Remote Sens. 2021, 13, 1977. [Google Scholar] [CrossRef]
- Desai, A.R.; Khan, A.M.; Zheng, T.; Paleri, S.; Butterworth, B.; Lee, T.R.; Fisher, J.B.; Hulley, G.; Kleynhans, T.; Gerace, A.; et al. Multi-sensor approach for high space and time resolution land surface temperature. Earth Space Sci. 2021, 8, e2021EA001842. [Google Scholar] [CrossRef]
- Yi, K.; Smith, J.W.; Jablonski, A.D.; Tatham, E.A.; Scanlon, T.M.; Lerdau, M.T.; Novick, K.A.; Yang, X. High heterogeneity in canopy temperature among co-occurring tree species in a temperate forest. J. Geophys. Res. Biogeosci. 2020, 125, e2020JG005892. [Google Scholar] [CrossRef]
- Dirmeyer, P.A.; Cash, B.A.; Kinter III, J.L.; Stan, C.; Jung, T.; Marx, L.; Towers, P.; Wedi, N.; Adams, J.M.; Altshuler, E.L.; et al. Evidence for enhanced land–atmosphere feedback in a warming climate. J. Hydrometeorol. 2012, 13, 981–995. [Google Scholar] [CrossRef] [Green Version]
- Taylor, C.M.; de Jeu, R.A.; Guichard, F.; Harris, P.P.; Dorigo, W.A. Afternoon rain more likely over drier soils. Nature 2012, 489, 423–426. [Google Scholar] [CrossRef] [Green Version]
- Guillevic, P.C.; Bork-Unkelbach, A.; Göttsche, F.M.; Hulley, G.; Gastellu-Etchegorry, J.P.; Olesen, F.S.; Privette, J.L. Directional viewing effects on satellite land surface temperature products over sparse vegetation canopies—A multisensor analysis. IEEE Geosci. Remote Sens. Lett. 2013, 10, 1464–1468. [Google Scholar] [CrossRef]
- Metzger, S. Surface-atmosphere exchange in a box: Making the control volume a suitable representation for in-situ observations. Agric. For. Meteorol. 2018, 255, 68–80. [Google Scholar] [CrossRef]
- Zhang, K.; Chen, T.H.; Begley, C.E. Impact of the 2011 heat wave on mortality and emergency department visits in Houston, Texas. Environ. Health 2015, 14, 1–7. [Google Scholar] [CrossRef] [Green Version]
- Foss, A.W.; Ko, Y. Barriers and opportunities for climate change education: The case of Dallas-Fort Worth in Texas. J. Environ. Educ. 2019, 50, 145–159. [Google Scholar] [CrossRef]
- Roth, M.; Oke, T.R.; Emery, W.J. Satellite-derived urban heat islands from three coastal cities and the utilization of such data in urban climatology. Int. J. Remote Sens. 1989, 10, 1699–1720. [Google Scholar] [CrossRef]
- Zhou, D.; Zhao, S.; Liu, S.; Zhang, L.; Zhu, C. Surface urban heat island in China’s 32 major cities: Spatial patterns and drivers. Remote Sens. Environ. 2014, 152, 51–61. [Google Scholar] [CrossRef]
- Avdan, U.; Jovanovska, G. Algorithm for automated mapping of land surface temperature using LANDSAT 8 satellite data. J. Sensors 2016, 2016, 1–8. [Google Scholar] [CrossRef] [Green Version]
- Mukherjee, F.; Singh, D. Assessing land use–land cover change and its impact on land surface temperature using LANDSAT data: A comparison of two urban areas in India. Earth Syst. Environ. 2020, 4, 385–407. [Google Scholar] [CrossRef]
- Wang, F.; Qin, Z.; Song, C.; Tu, L.; Karnieli, A.; Zhao, S. An improved mono-window algorithm for land surface temperature retrieval from Landsat 8 thermal infrared sensor data. Remote Sens. 2015, 7, 4268–4289. [Google Scholar] [CrossRef] [Green Version]
- Campbell, J. Introduction to Remote Sensing, CORINE Land Cover Technical Guide; European Environment Agency: Copenhagen, Denmark, 2002; Available online: https://www.eea.europa.eu/publications/tech40add/download (accessed on 12 December 2022).
- Adhikary, P.P.; Barman, D.; Madhu, M.; Dash, C.J.; Jakhar, P.; Hombegowda, H.; Naik, B.; Sahoo, D.; Beer, K. Land use and land cover dynamics with special emphasis on shifting cultivation in Eastern Ghats Highlands of India using remote sensing data and GIS. Environ. Monit. Assess. 2019, 191, 1–15. [Google Scholar] [CrossRef]
- Ramachandran, V.S.; Paroli, R.M.; Beaudoin, J.J.; Delgado, A.H. Handbook of Thermal Analysis of Construction Materials; William Andrew: Norwich, NY, USA, 2002. [Google Scholar]
- Deshmukh, G.; Birwal, P.; Datir, R.; Patel, S. Thermal insulation materials: A tool for energy conservation. J. Food Process. Technol 2017, 8, 8–11. [Google Scholar] [CrossRef]
- Bernard, V.; Staffa, E.; Mornstein, V.; Bourek, A. Infrared camera assessment of skin surface temperature–effect of emissivity. Phys. Medica 2013, 29, 583–591. [Google Scholar] [CrossRef] [Green Version]
- O’Keefe, E.S.; Raven, P.N. Infrared and visible cooperative vehicle identification markings. In Proceedings of the Sensors, and Command, Control, Communications, and Intelligence (C3I) Technologies for Homeland Security and Homeland Defense V; SPIE: Orlando, FL, USA, 2006; Volume 6201, pp. 633–643. [Google Scholar]
- Li, S.; Qiao, L.; Zhang, Y.; Yan, J. An Early Forest Fire Detection System Based on DJI M300 Drone and H20T Camera. In Proceedings of the 2022 International Conference on Unmanned Aircraft Systems (ICUAS), Dubrovnik, Croatia, 21–24 June 2022; pp. 932–937. [Google Scholar]
- Chudnovsky, A.; Ben-Dor, E.; Saaroni, H. Diurnal thermal behavior of selected urban objects using remote sensing measurements. Energy Build. 2004, 36, 1063–1074. [Google Scholar] [CrossRef]
- Naughton, J.; McDonald, W. Evaluating the variability of urban land surface temperatures using drone observations. Remote Sens. 2019, 11, 1722. [Google Scholar] [CrossRef] [Green Version]
- Mathew, A.; Khandelwal, S.; Kaul, N.; Chauhan, S. Analyzing the diurnal variations of land surface temperatures for surface urban heat island studies: Is time of observation of remote sensing data important? Sustain. Cities Soc. 2018, 40, 194–213. [Google Scholar] [CrossRef] [Green Version]
- Tran, H.; Uchihama, D.; Ochi, S.; Yasuoka, Y. Assessment with satellite data of the urban heat island effects in Asian mega cities. Int. J. Appl. Earth Obs. Geoinf. 2006, 8, 34–48. [Google Scholar] [CrossRef]
- Wong, K.V.; Chaudhry, S. Use of satellite images for observational and quantitative analysis of urban heat islands around the world. J. Energy Resour. Technol. 2012, 134, 042101. [Google Scholar] [CrossRef]
- Peng, S.; Piao, S.; Ciais, P.; Friedlingstein, P.; Ottle, C.; Bréon, F.M.; Nan, H.; Zhou, L.; Myneni, R.B. Surface urban heat island across 419 global big cities. Environ. Sci. Technol. 2012, 46, 696–703. [Google Scholar] [CrossRef]
- Morabito, M.; Crisci, A.; Guerri, G.; Messeri, A.; Congedo, L.; Munafò, M. Surface urban heat islands in Italian metropolitan cities: Tree cover and impervious surface influences. Sci. Total Environ. 2021, 751, 142334. [Google Scholar] [CrossRef]
- Bahi, H.; Mastouri, H.; Radoine, H. Review of methods for retrieving urban heat islands. Mater. Today Proc. 2020, 27, 3004–3009. [Google Scholar] [CrossRef]
- Zhang, X.; Friedl, M.A.; Schaaf, C.B.; Strahler, A.H.; Schneider, A. The footprint of urban climates on vegetation phenology. Geophys. Res. Lett. 2004, 31. [Google Scholar] [CrossRef]
- Zhou, D.; Xiao, J.; Bonafoni, S.; Berger, C.; Deilami, K.; Zhou, Y.; Frolking, S.; Yao, R.; Qiao, Z.; Sobrino, J.A. Satellite remote sensing of surface urban heat islands: Progress, challenges, and perspectives. Remote Sens. 2018, 11, 48. [Google Scholar] [CrossRef] [Green Version]
- Wang, Y.; Berardi, U.; Akbari, H. Comparing the effects of urban heat island mitigation strategies for Toronto, Canada. Energy Build. 2016, 114, 2–19. [Google Scholar] [CrossRef]
- Shishegar, N. Street design and urban microclimate: Analyzing the effects of street geometryand orientation on airflow and solar access in urban canyons. J. Clean Energy Technol. 2013, 1, 52. [Google Scholar] [CrossRef]
- Zhou, W.; Huang, G.; Cadenasso, M.L. Does spatial configuration matter? Understanding the effects of land cover pattern on land surface temperature in urban landscapes. Landsc. Urban Plan. 2011, 102, 54–63. [Google Scholar] [CrossRef]
- Kaloush, K.E.; Carlson, J.D.; Golden, J.S.; Phelan, P.E. The Thermal and Radiative Characteristics of Concrete Pavements in Mitigating Urban Heat Island Effects; Technical Report; Portland Cement Association: Skokie, IL, USA, 2008. [Google Scholar]
- Prado, R.T.A.; Ferreira, F.L. Measurement of albedo and analysis of its influence the surface temperature of building roof materials. Energy Build. 2005, 37, 295–300. [Google Scholar] [CrossRef]
- Zhao, Q.; Myint, S.W.; Wentz, E.A.; Fan, C. Rooftop surface temperature analysis in an urban residential environment. Remote Sens. 2015, 7, 12135–12159. [Google Scholar] [CrossRef] [Green Version]
- Li, X.; Zhou, Y.; Yu, S.; Jia, G.; Li, H.; Li, W. Urban heat island impacts on building energy consumption: A review of approaches and findings. Energy 2019, 174, 407–419. [Google Scholar] [CrossRef]
- Elgendawy, A.; Davies, P. The urban heat island in Australian city planning. In Proceedings of the 9th State of Australian Cities National Conference, Perth, Australia, 30 November–5 December 2019. [Google Scholar]
- Kang, D.I.; Moon, H.G.; Sung, S.Y.; Cha, J.G. Applicability of UAV in urban thermal environment analysis. J. Korean Inst. Landsc. Archit. 2018, 46, 52–61. [Google Scholar] [CrossRef] [Green Version]
- Callahan, P.S. Intermediate and far infrared sensing of nocturnal insects. Part I. Evidences for a far infrared (FIR) electromagnetic theory of cummunication and sensing in moths and its relationship to the limiting biosphere of the corn earworm. Ann. Entomol. Soc. Am. 1965, 58, 727–745. [Google Scholar] [CrossRef]
Figure 1.
Study Area.
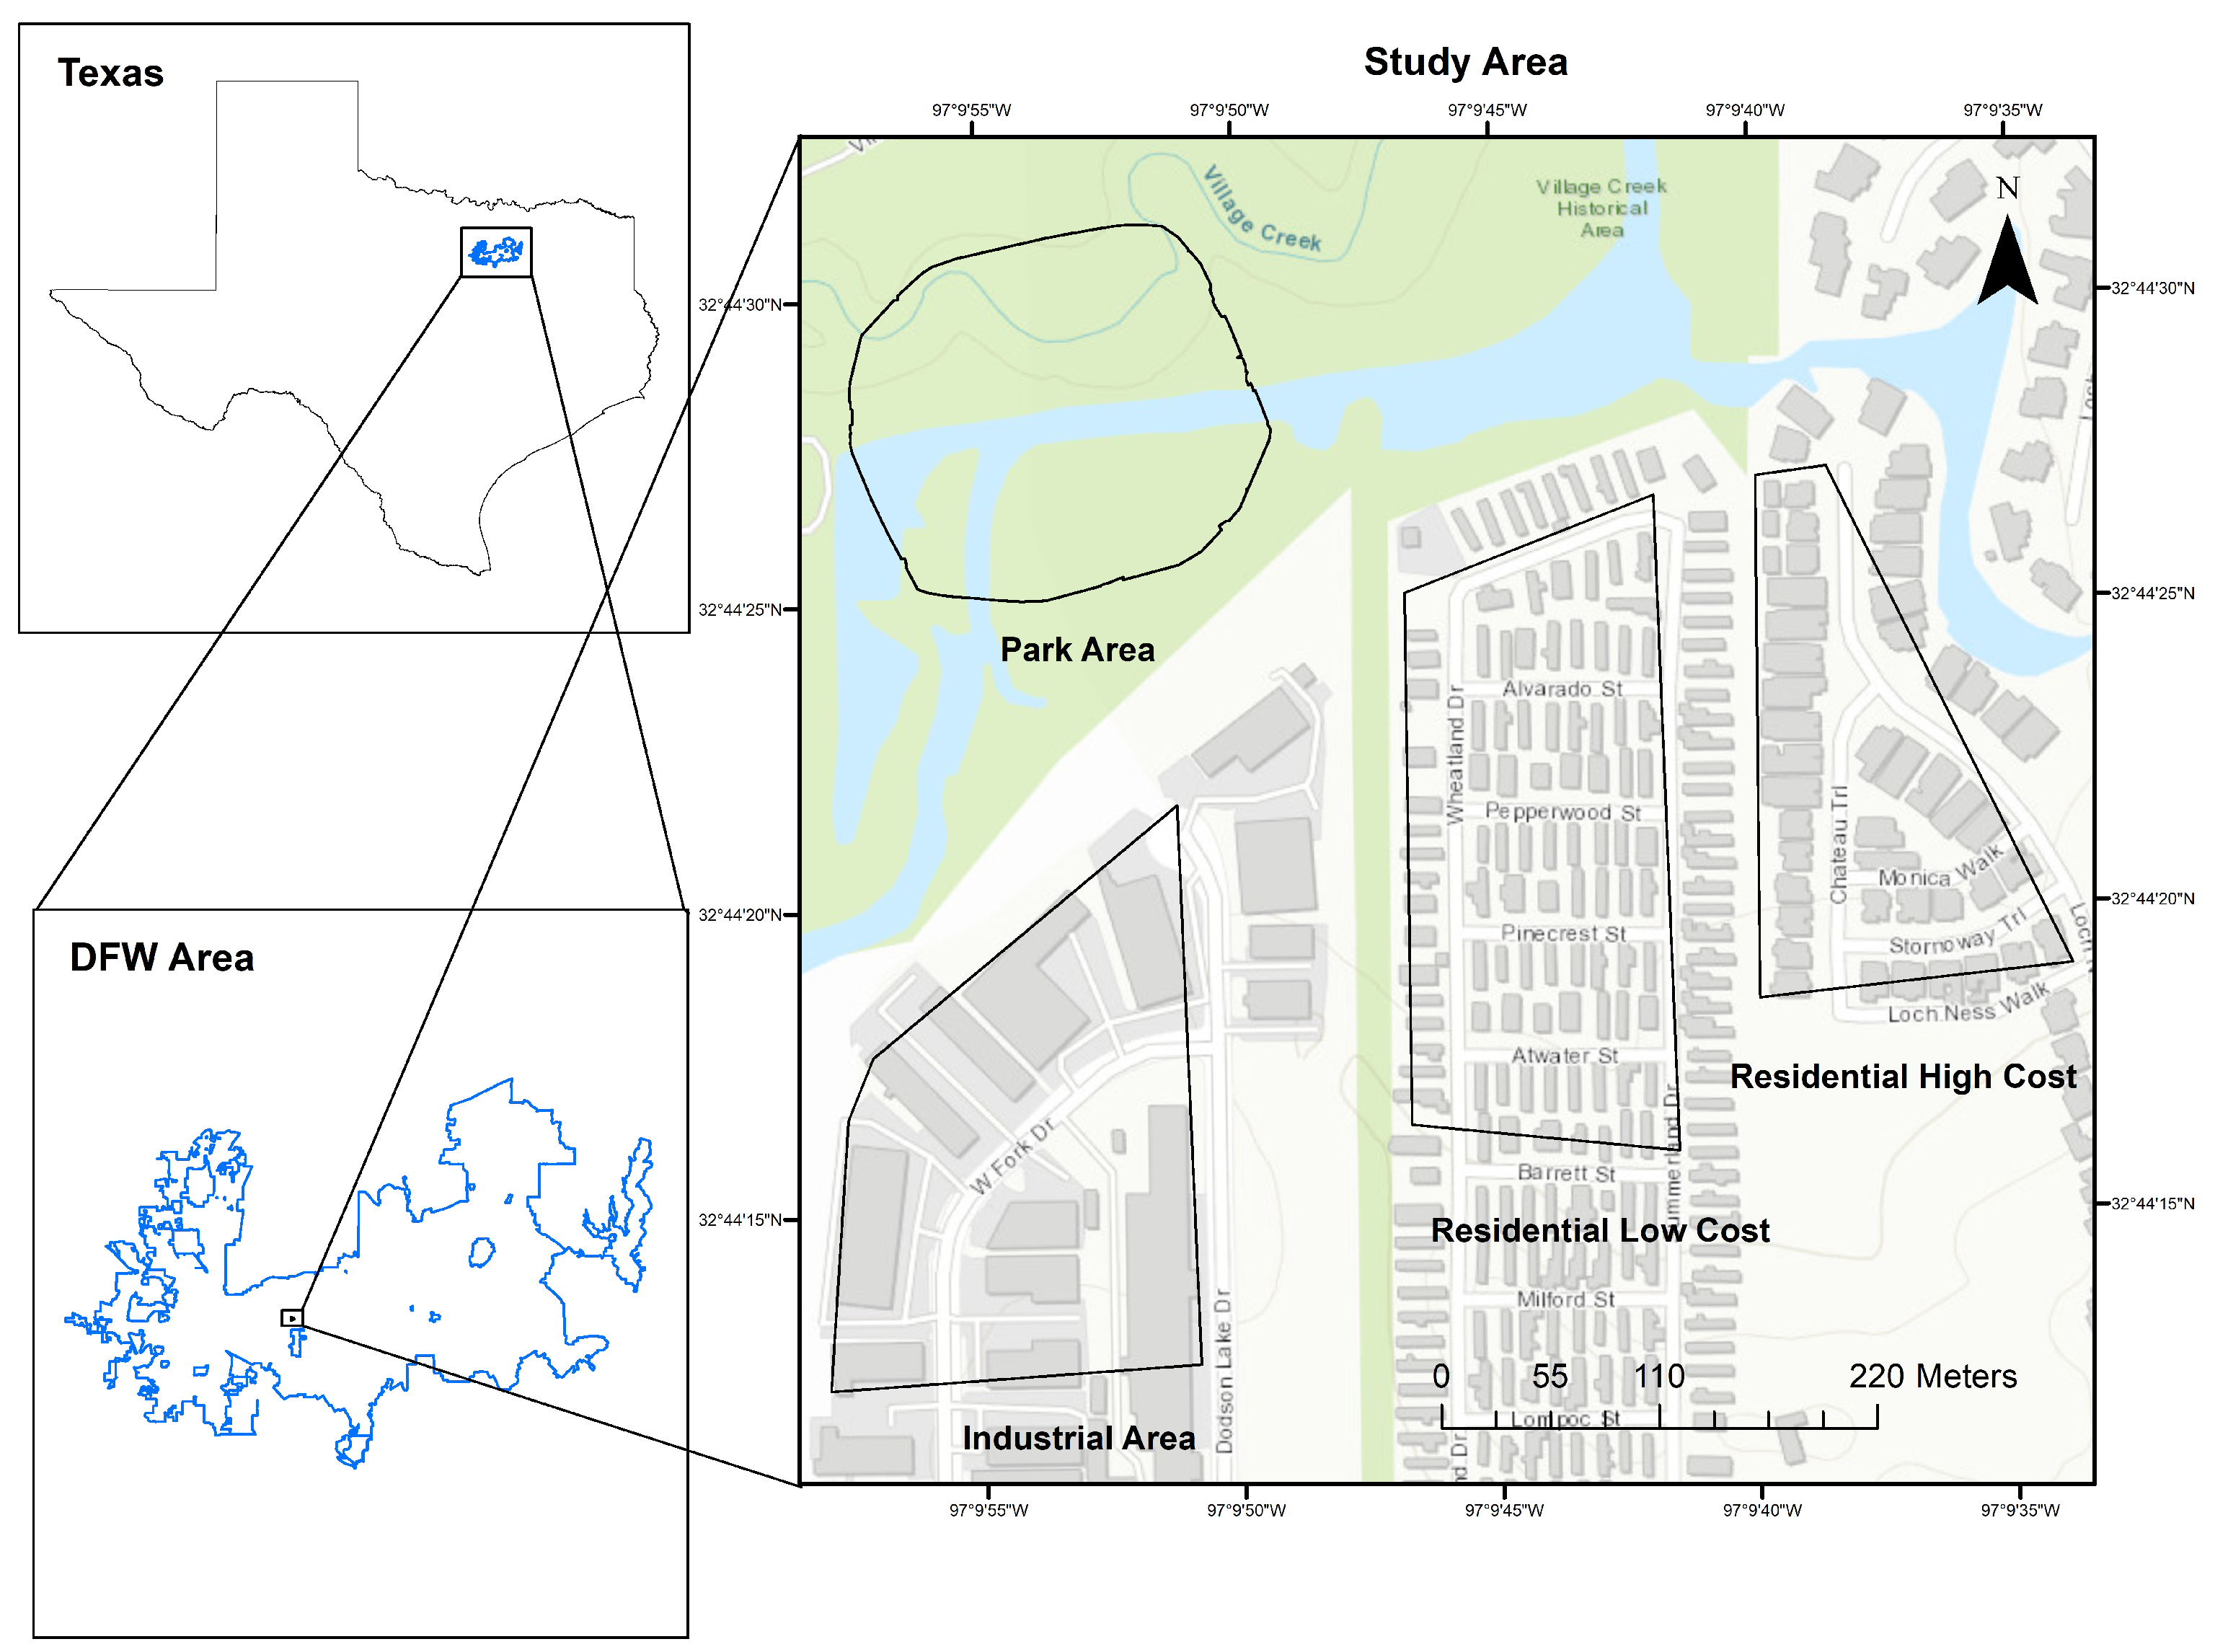
Figure 2.
Orthomosaiced image of PA, IA, RLC, and RHC captured using Zenmuse H20T wide-angle camera (24 September 2022).
Figure 2.
Orthomosaiced image of PA, IA, RLC, and RHC captured using Zenmuse H20T wide-angle camera (24 September 2022).
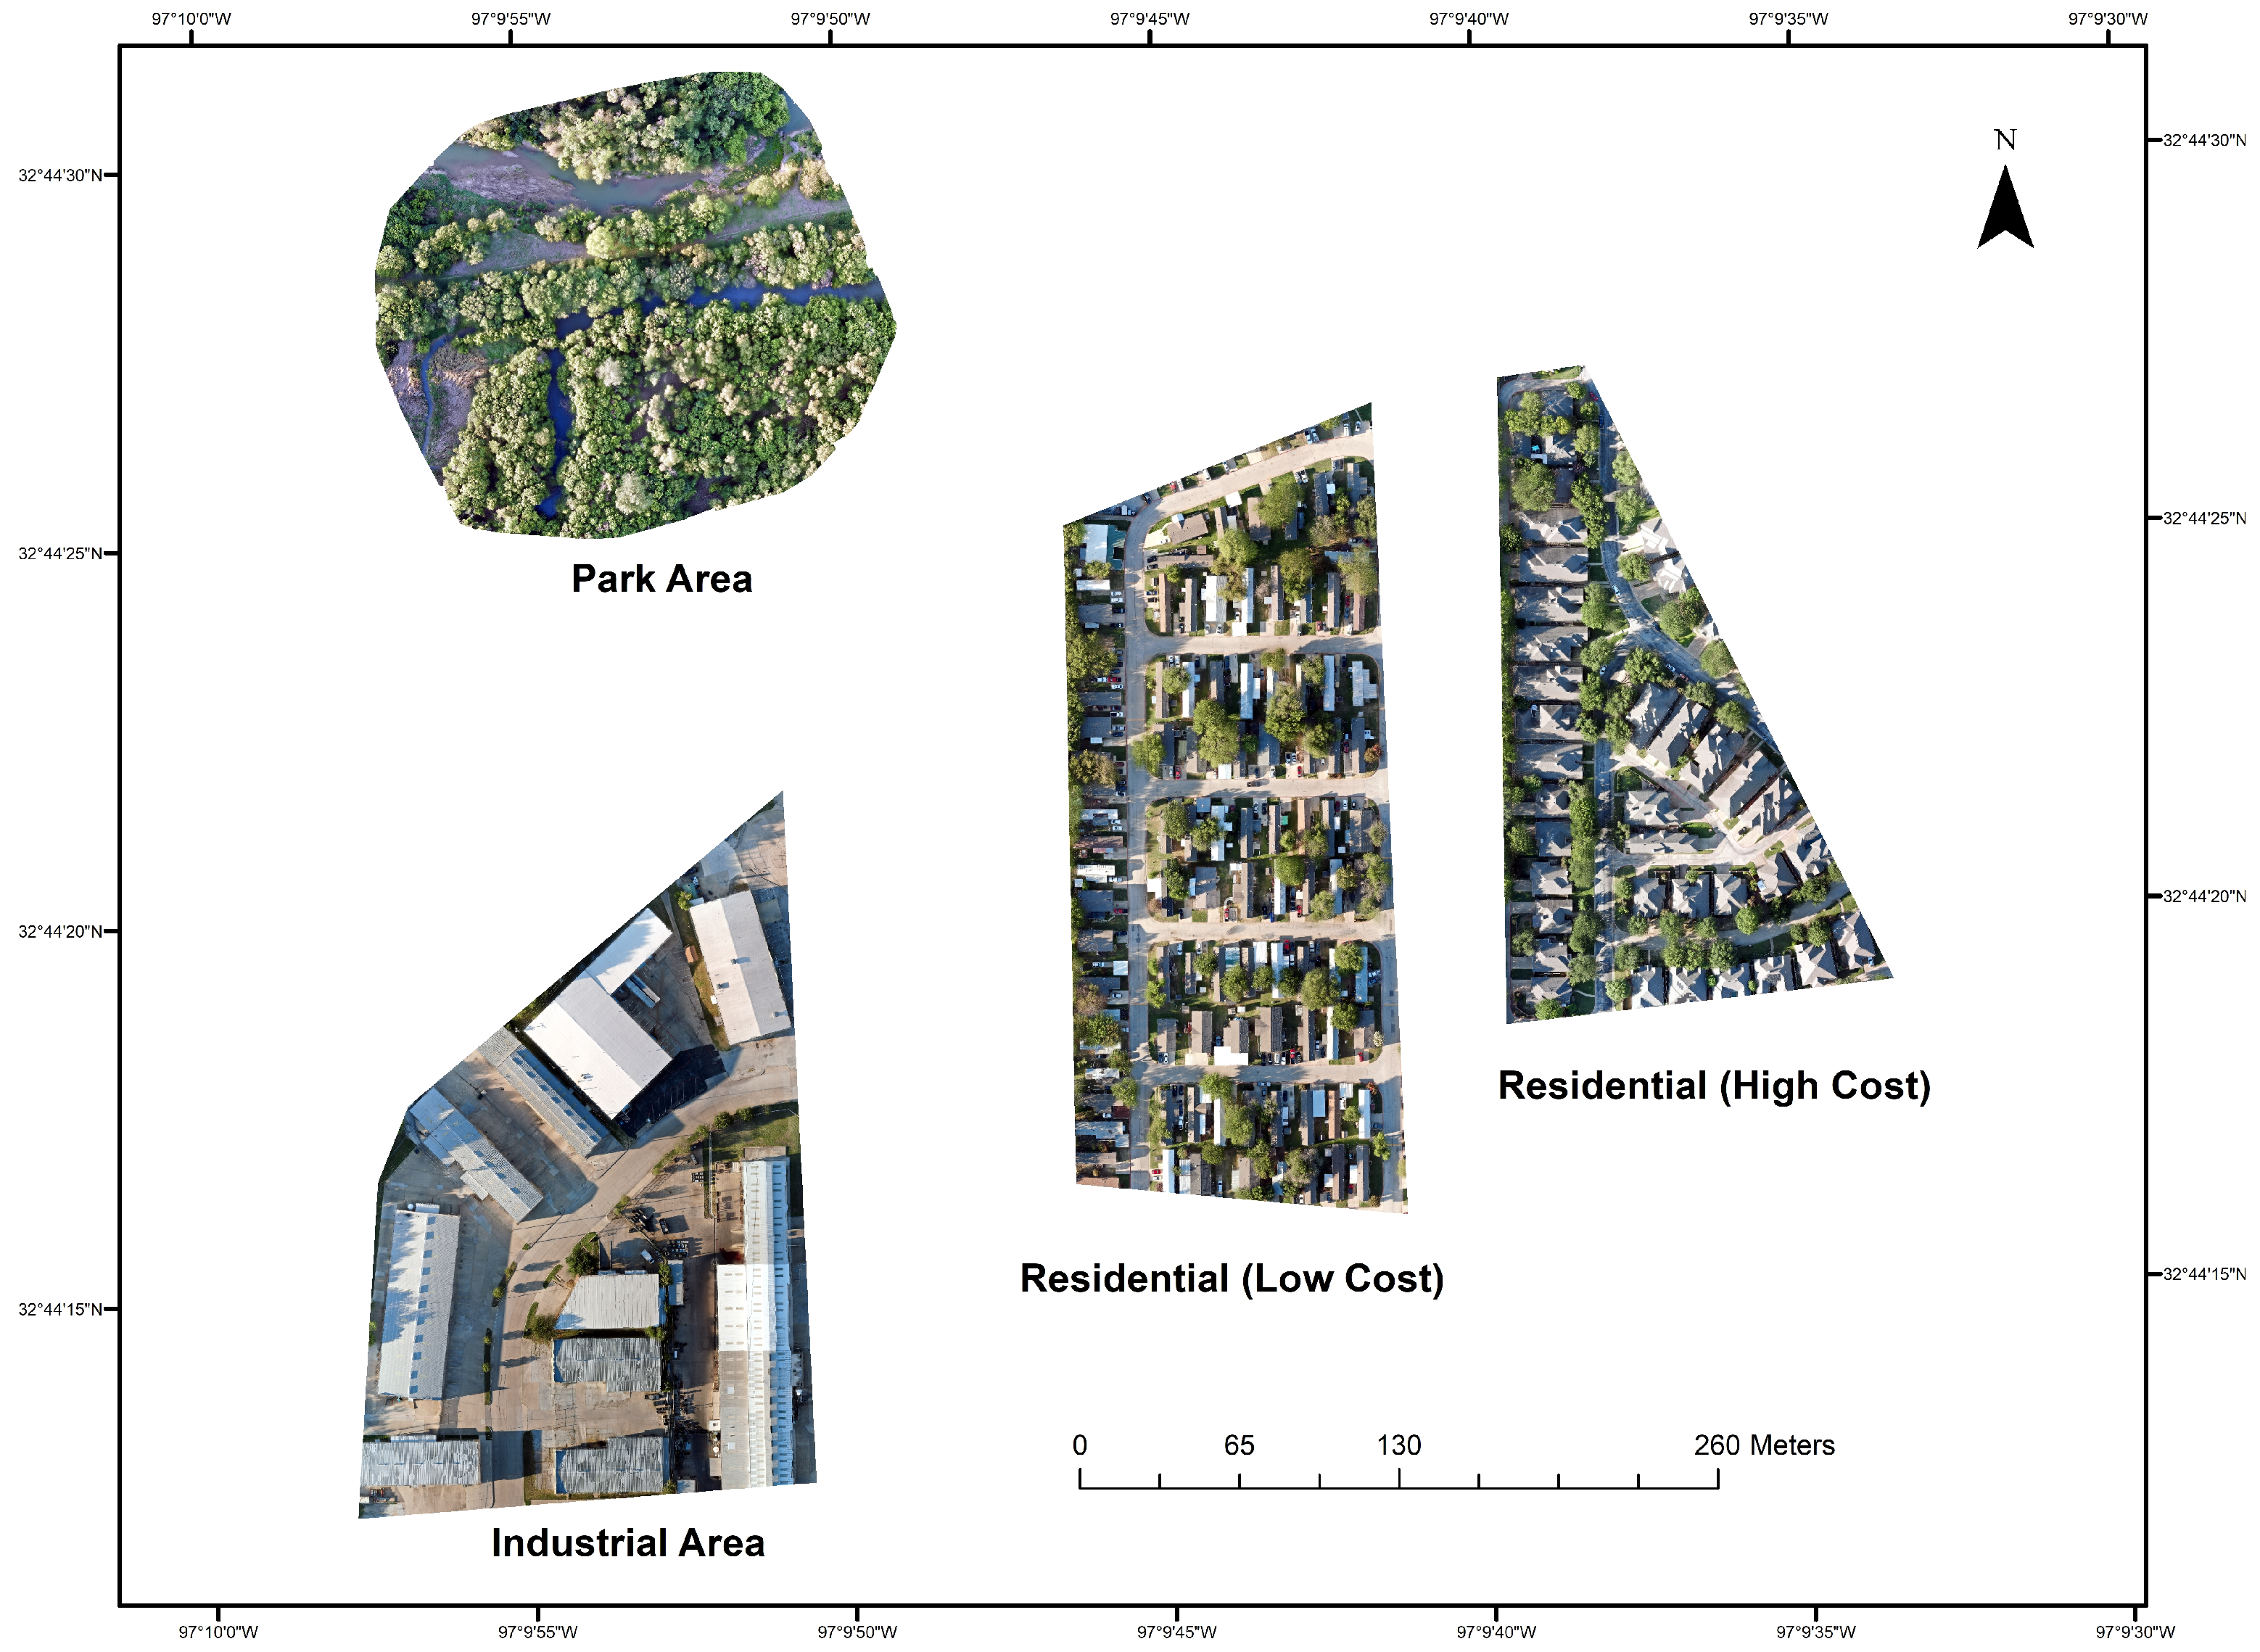
Figure 3.
In-situ LST measurement points (yellow triangles) and cold roofs (blue polygons) in IA.
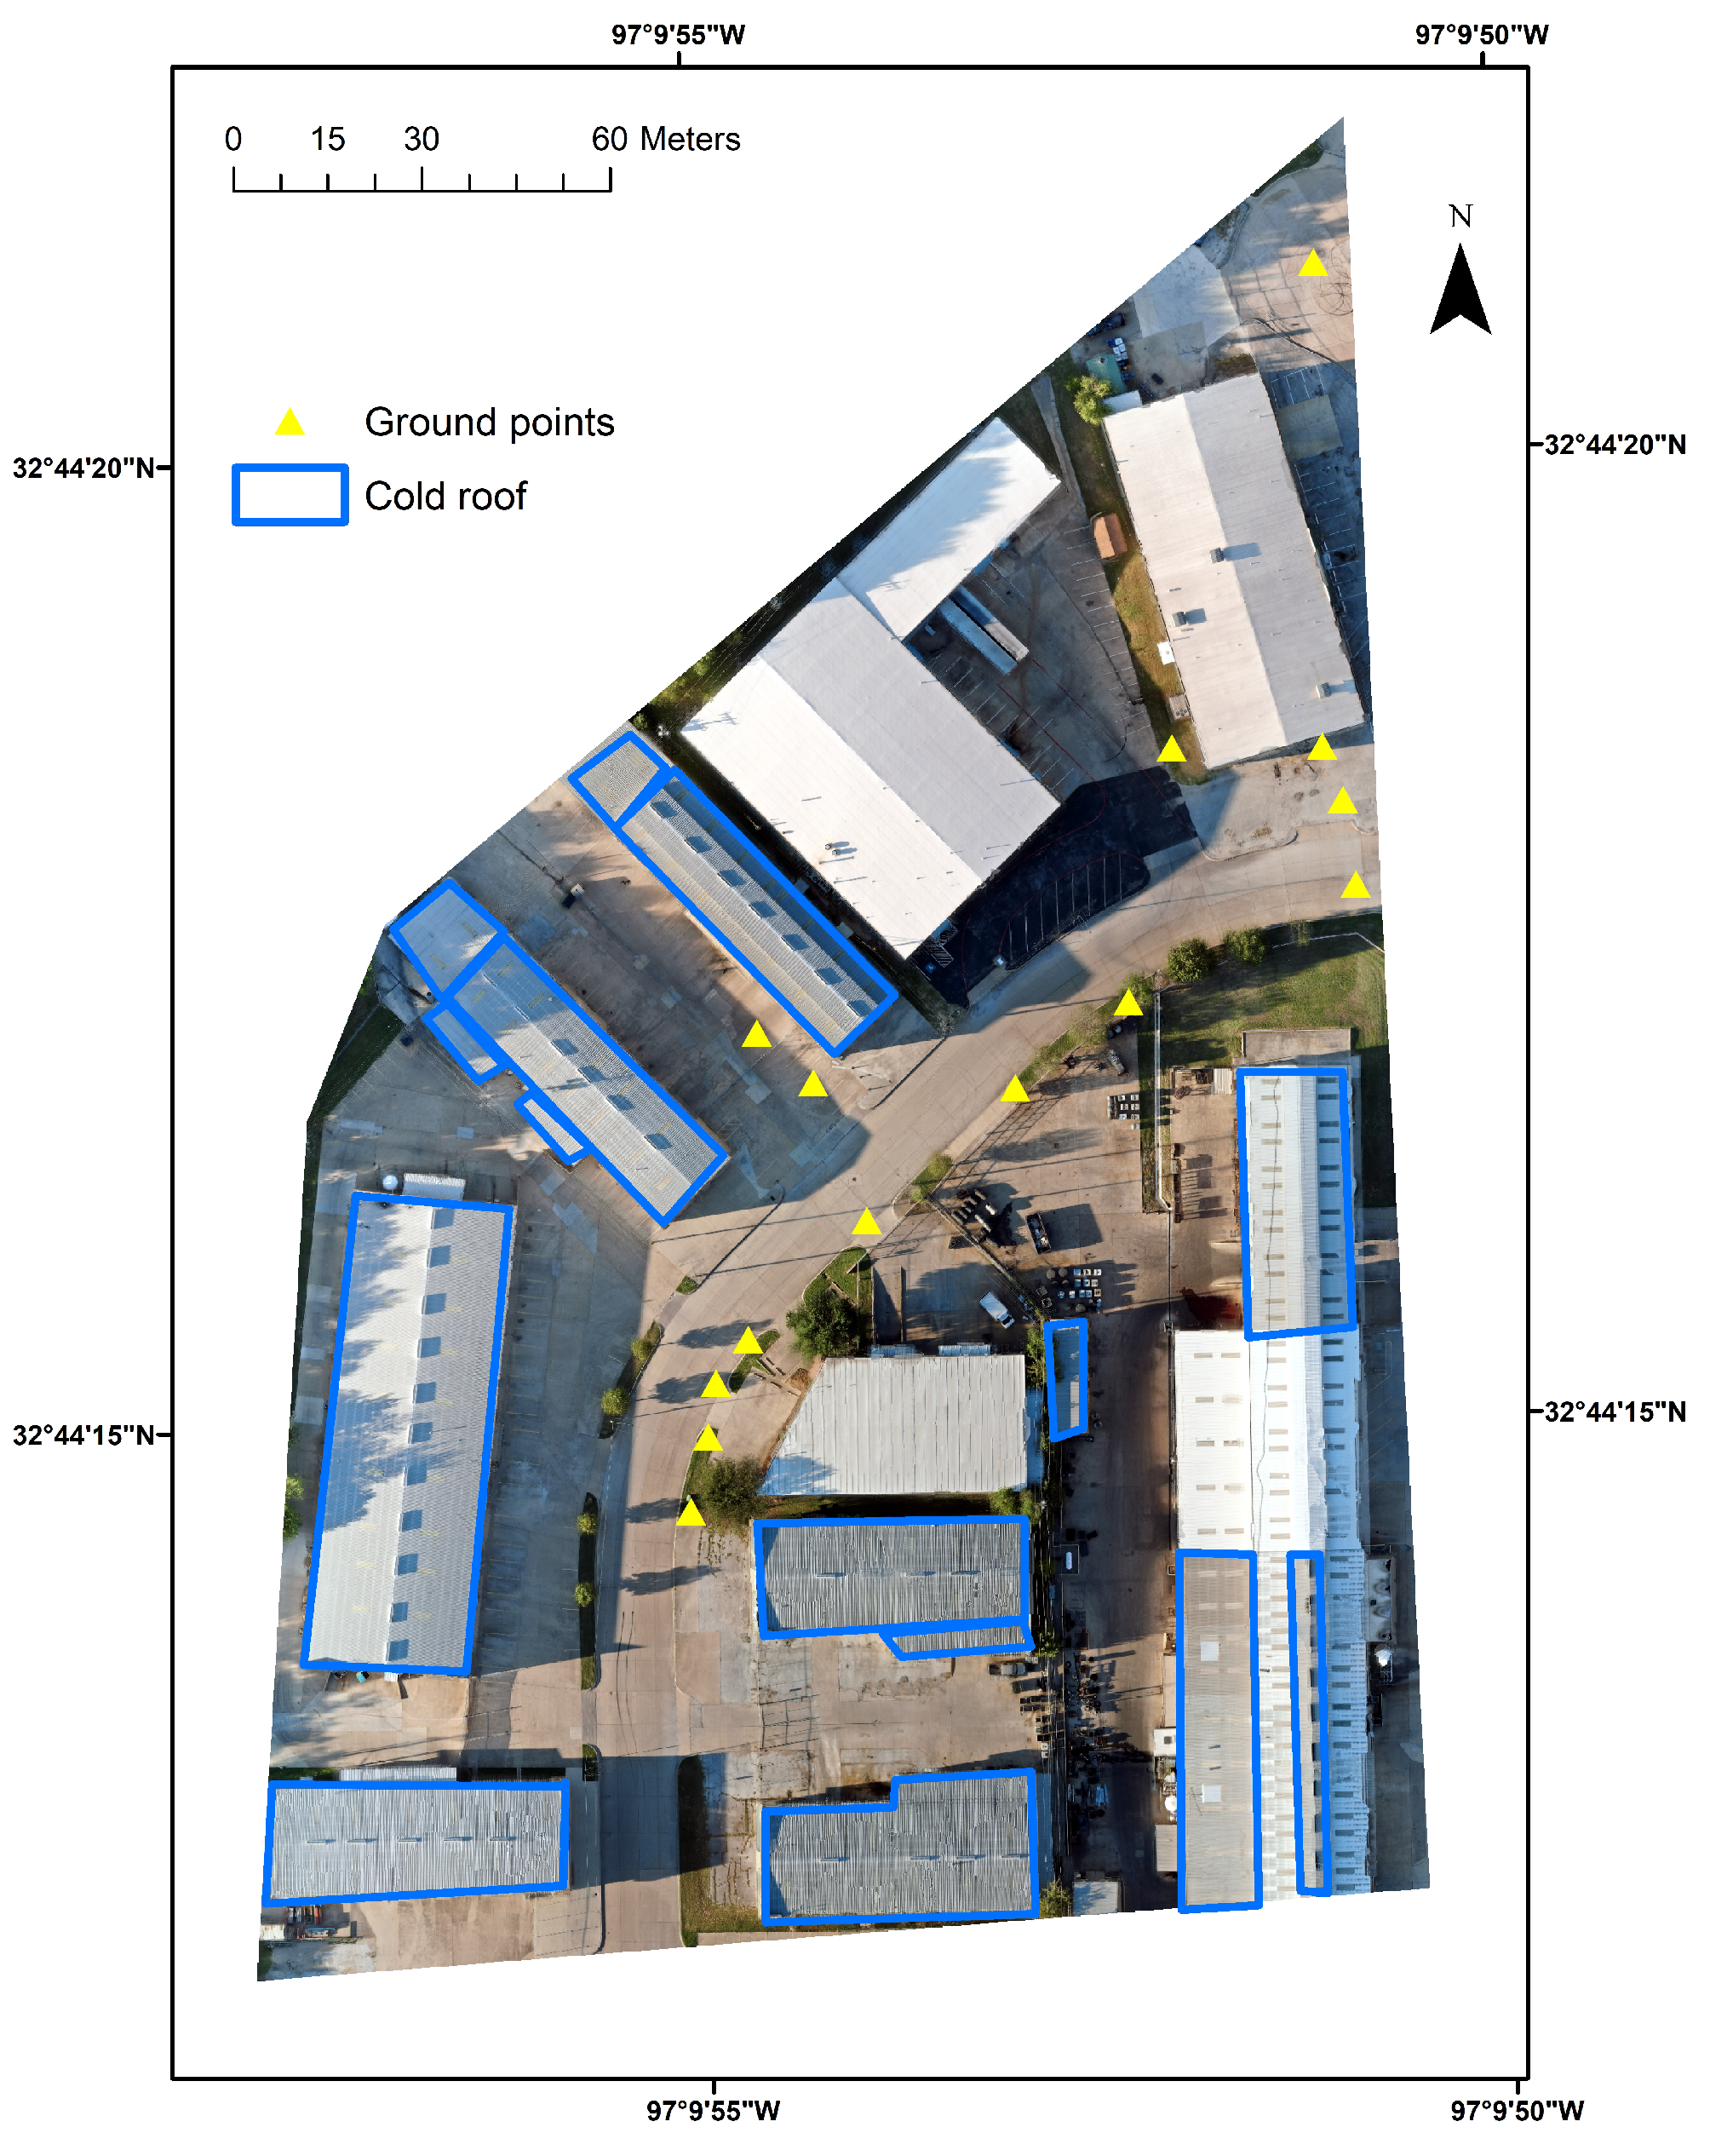
Figure 4.
Temporal variation of mean and range of LST for different land uses at different times of the day.
Figure 4.
Temporal variation of mean and range of LST for different land uses at different times of the day.
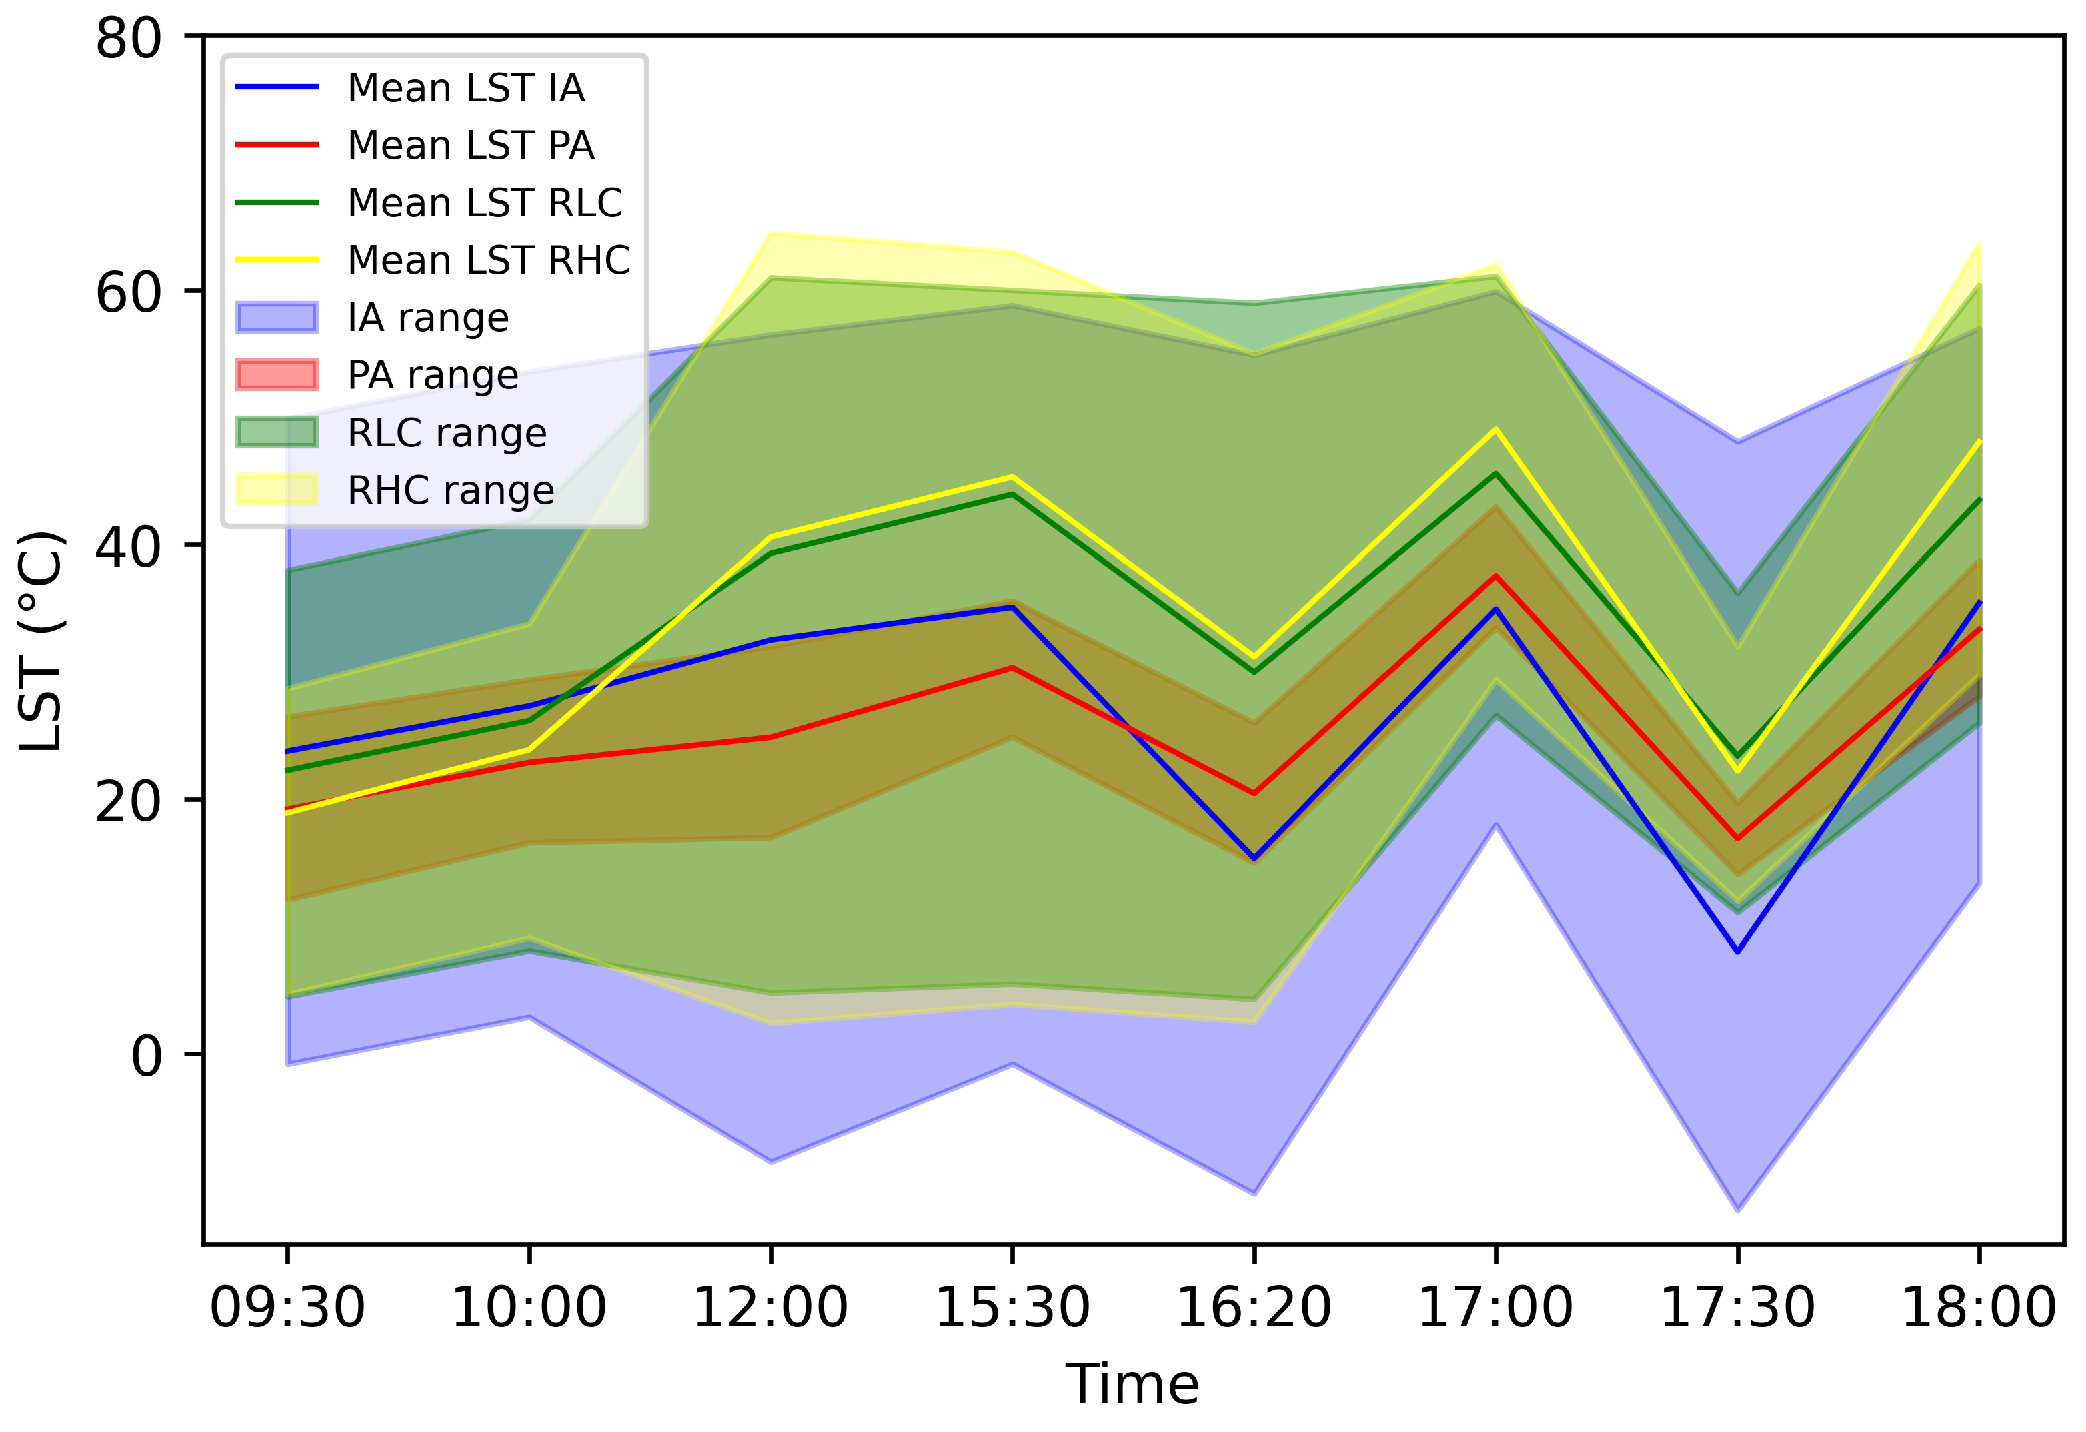
Figure 5.
Violin plot showing the distribution of LST for each LU from all eight flights.
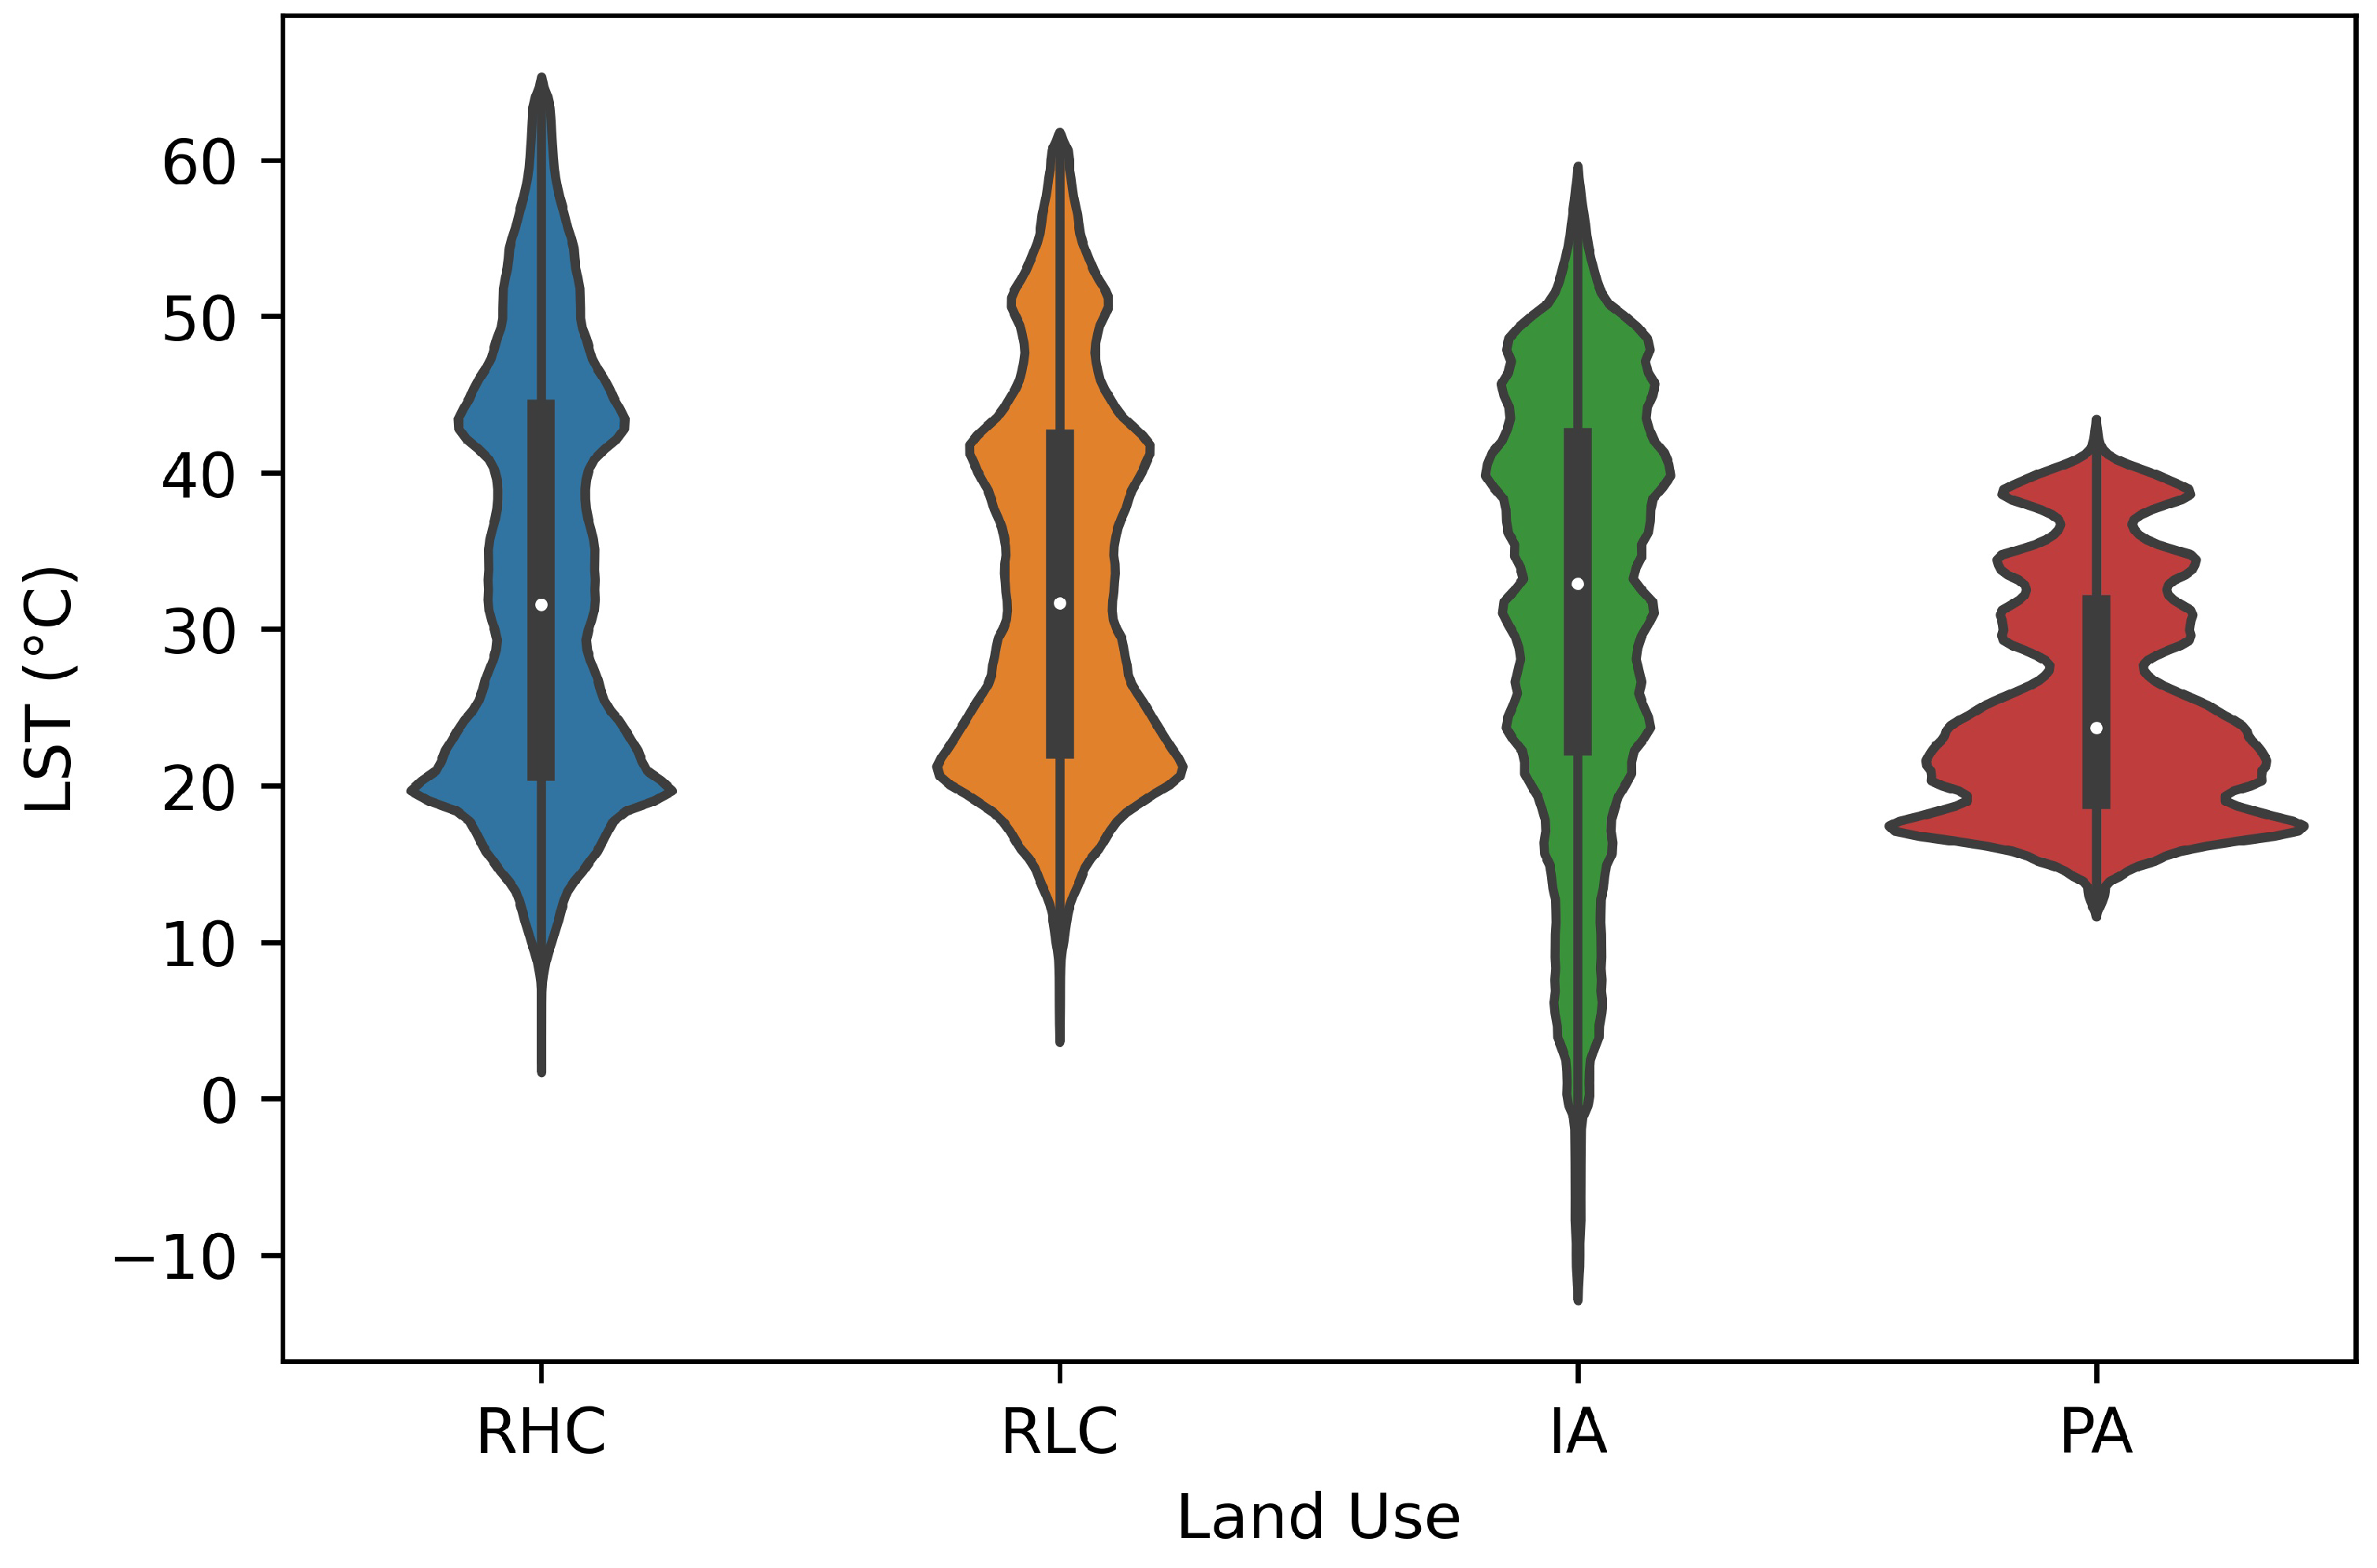
Figure 6.
Temporal variation of MUHI.
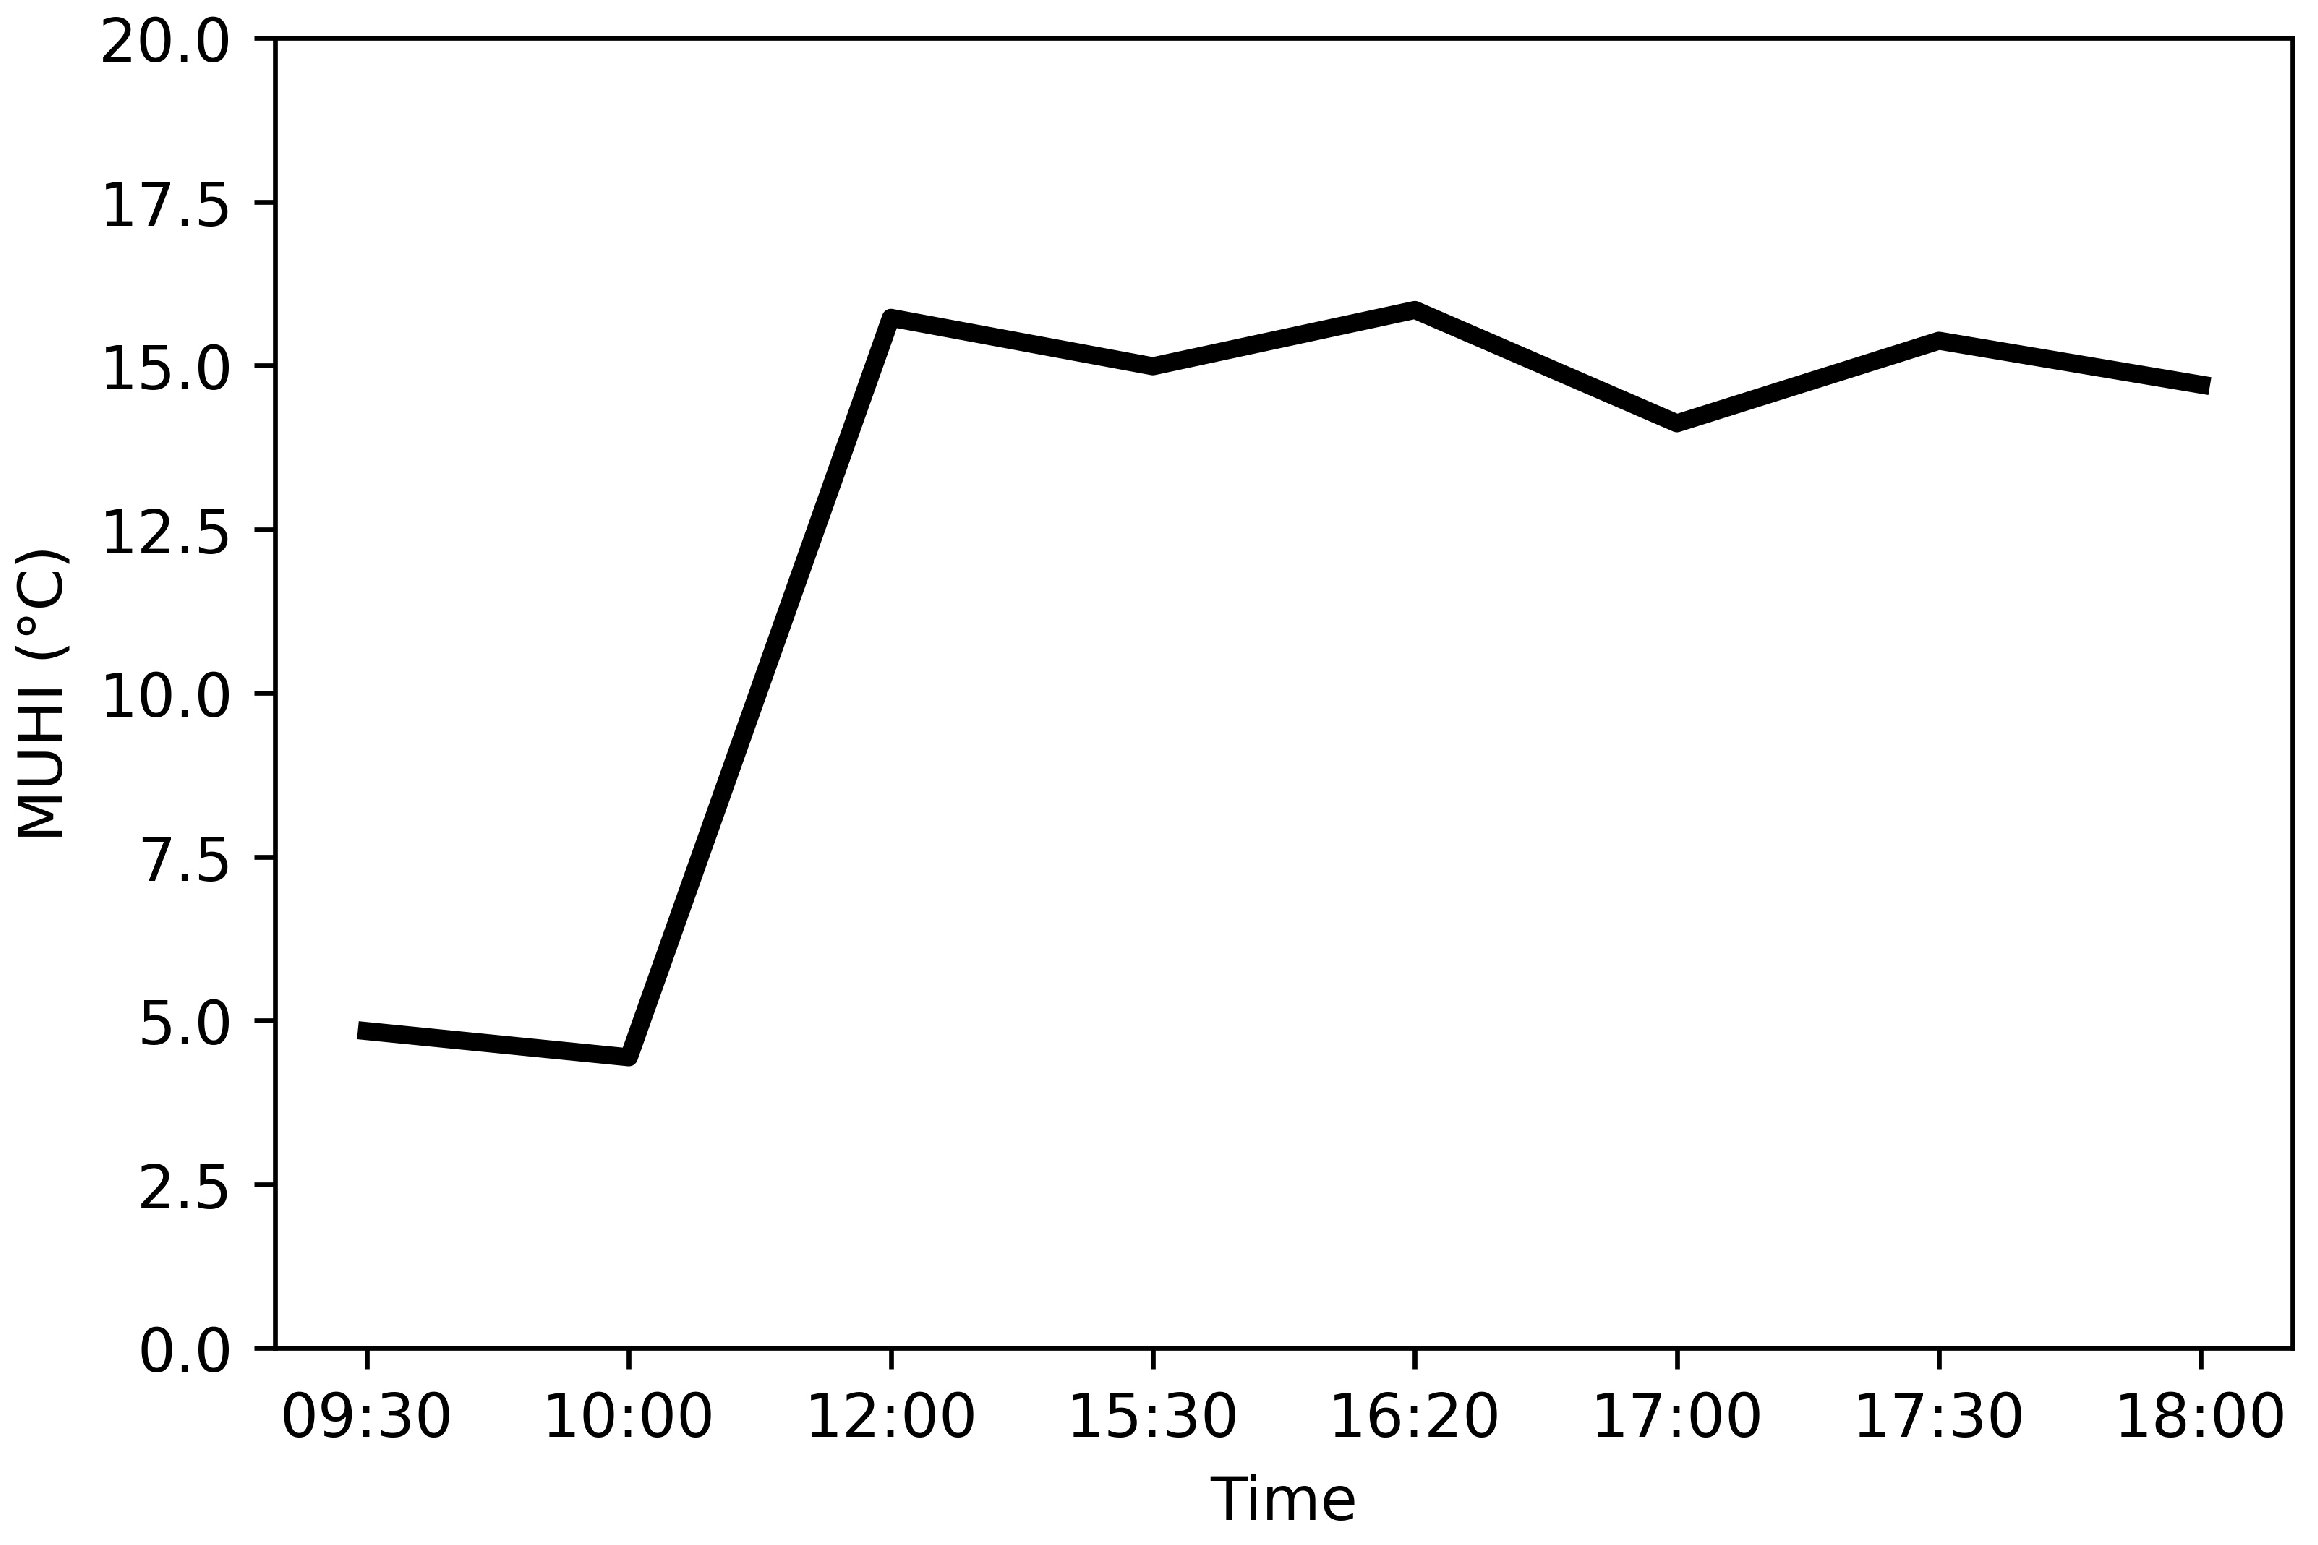
Figure 7.
Temporal variation of mean LST for different land cover in each LU. (a) Residential High Cost (b) Residential Low Cost (c) Industrial Area (d) Park Area.
Figure 7.
Temporal variation of mean LST for different land cover in each LU. (a) Residential High Cost (b) Residential Low Cost (c) Industrial Area (d) Park Area.
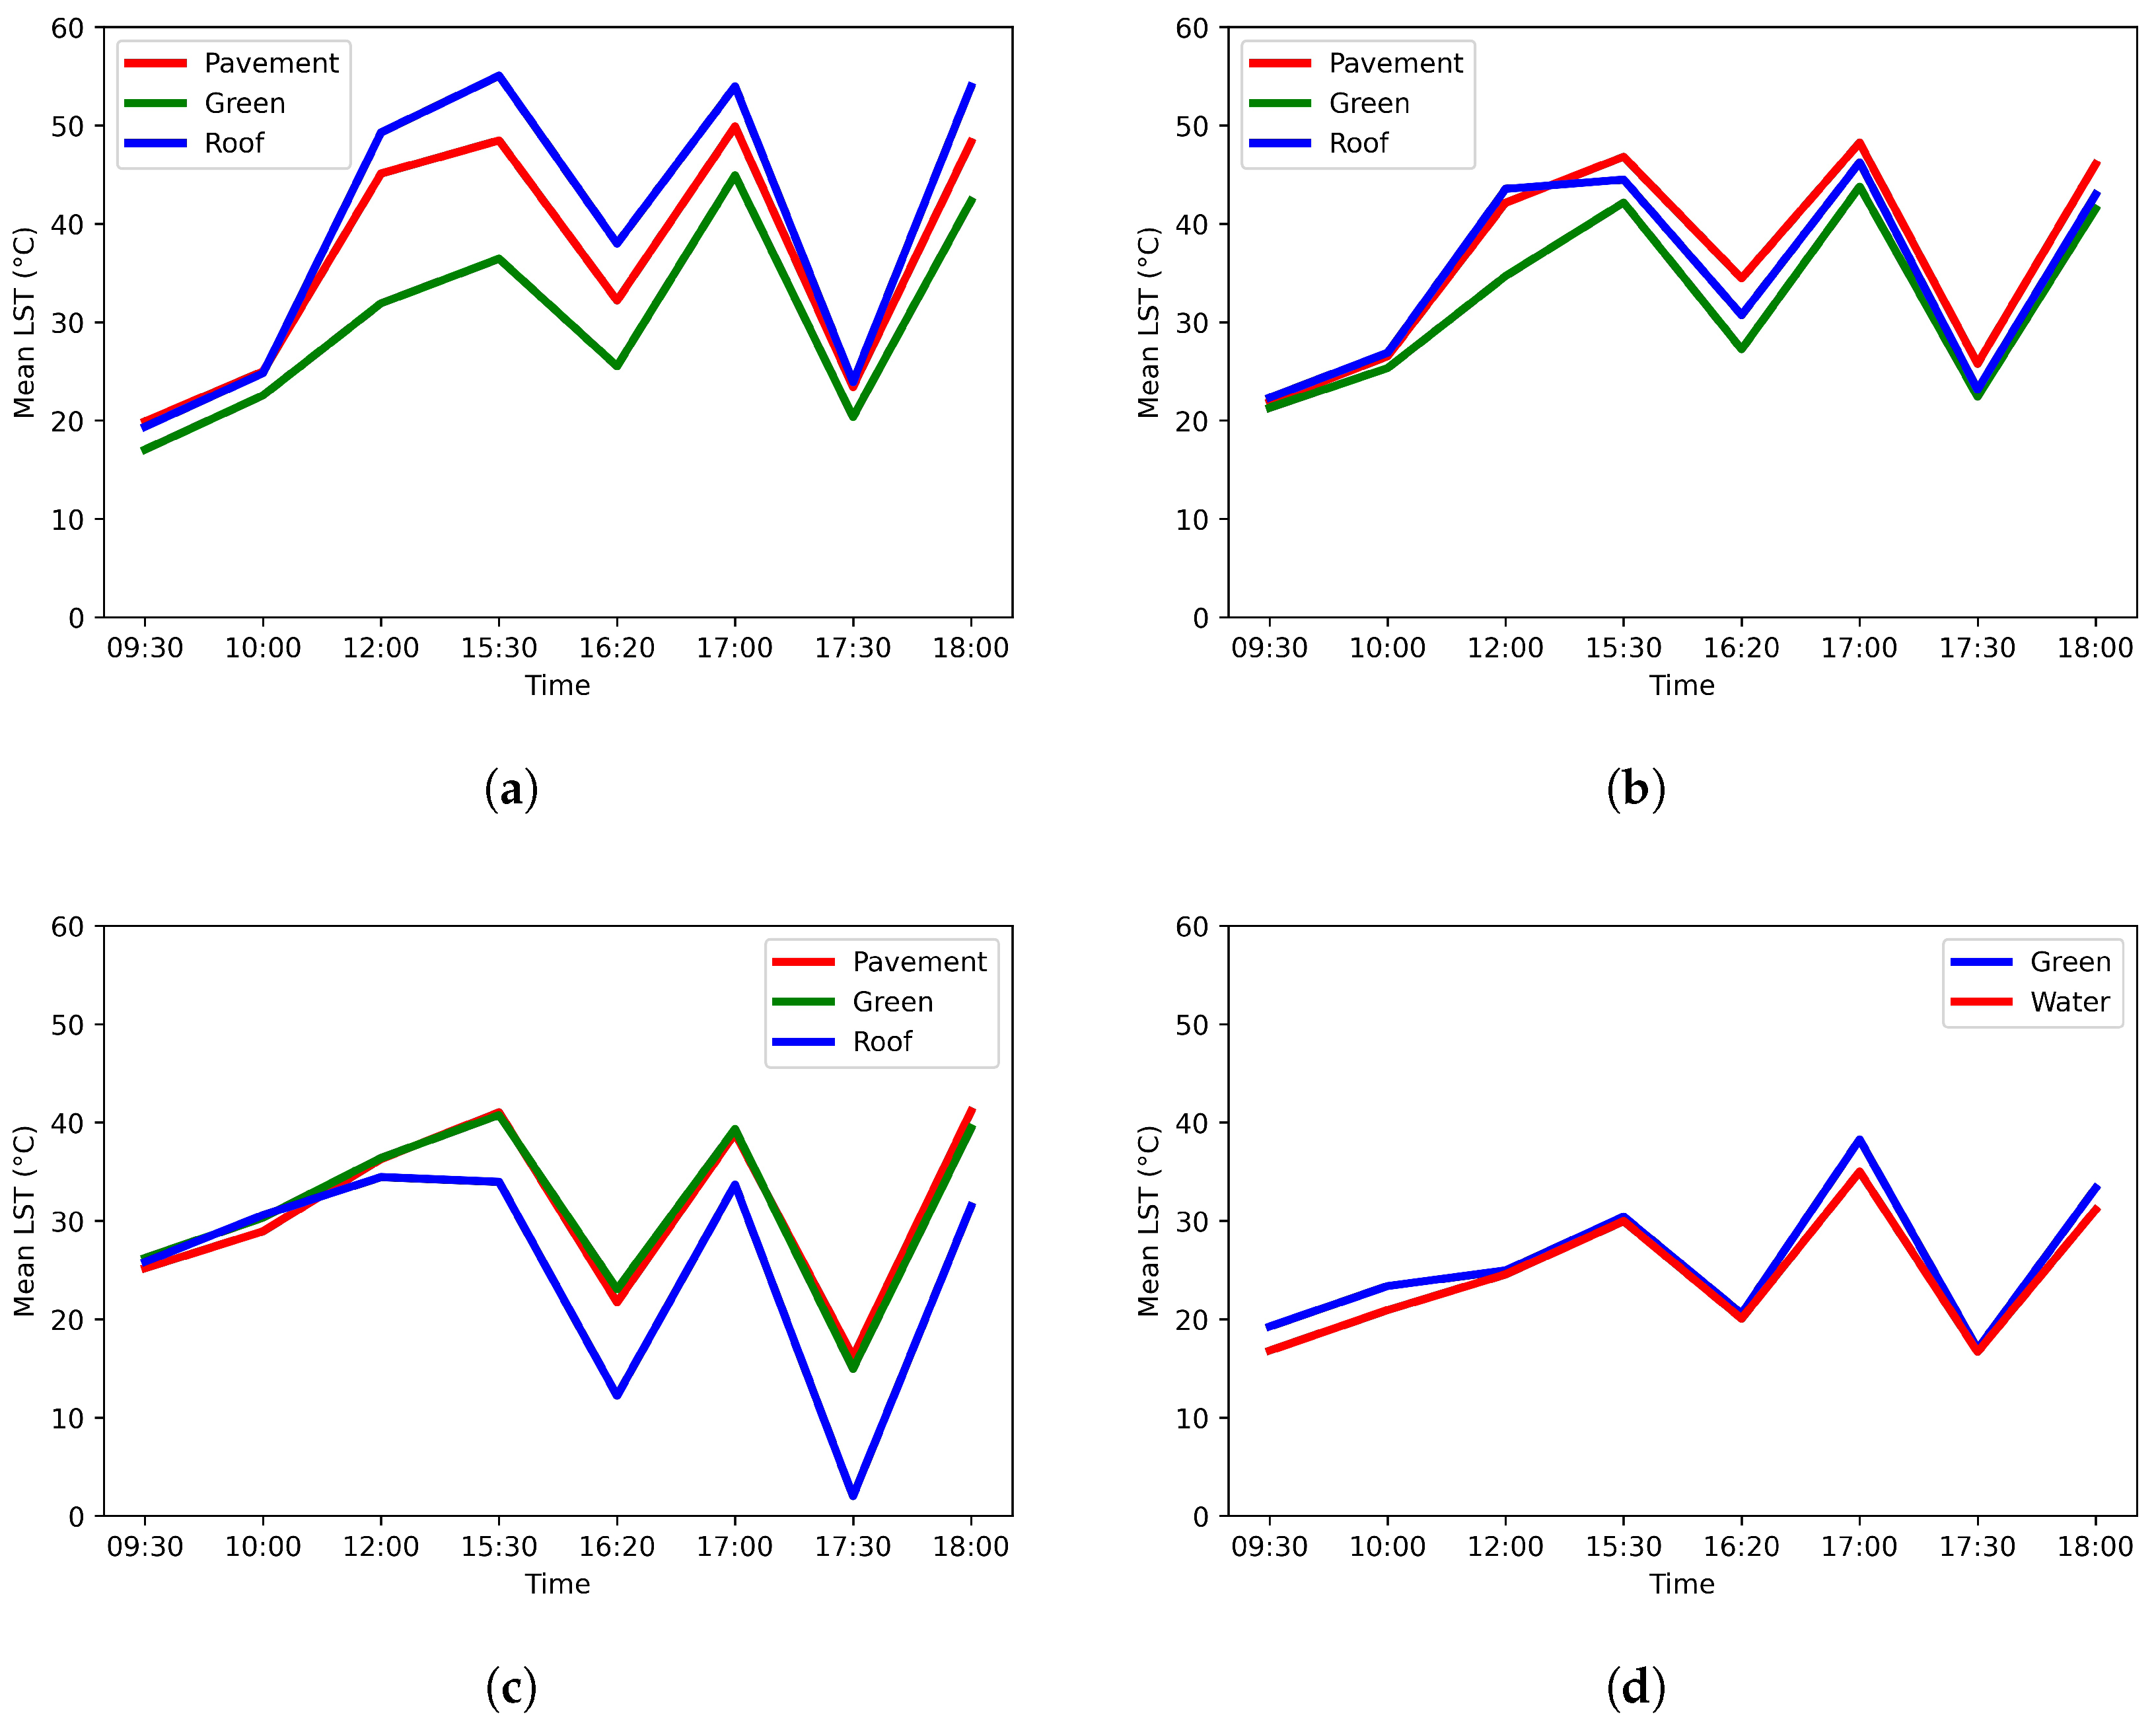
Figure 8.
Temporal variation of heat island in each LU.
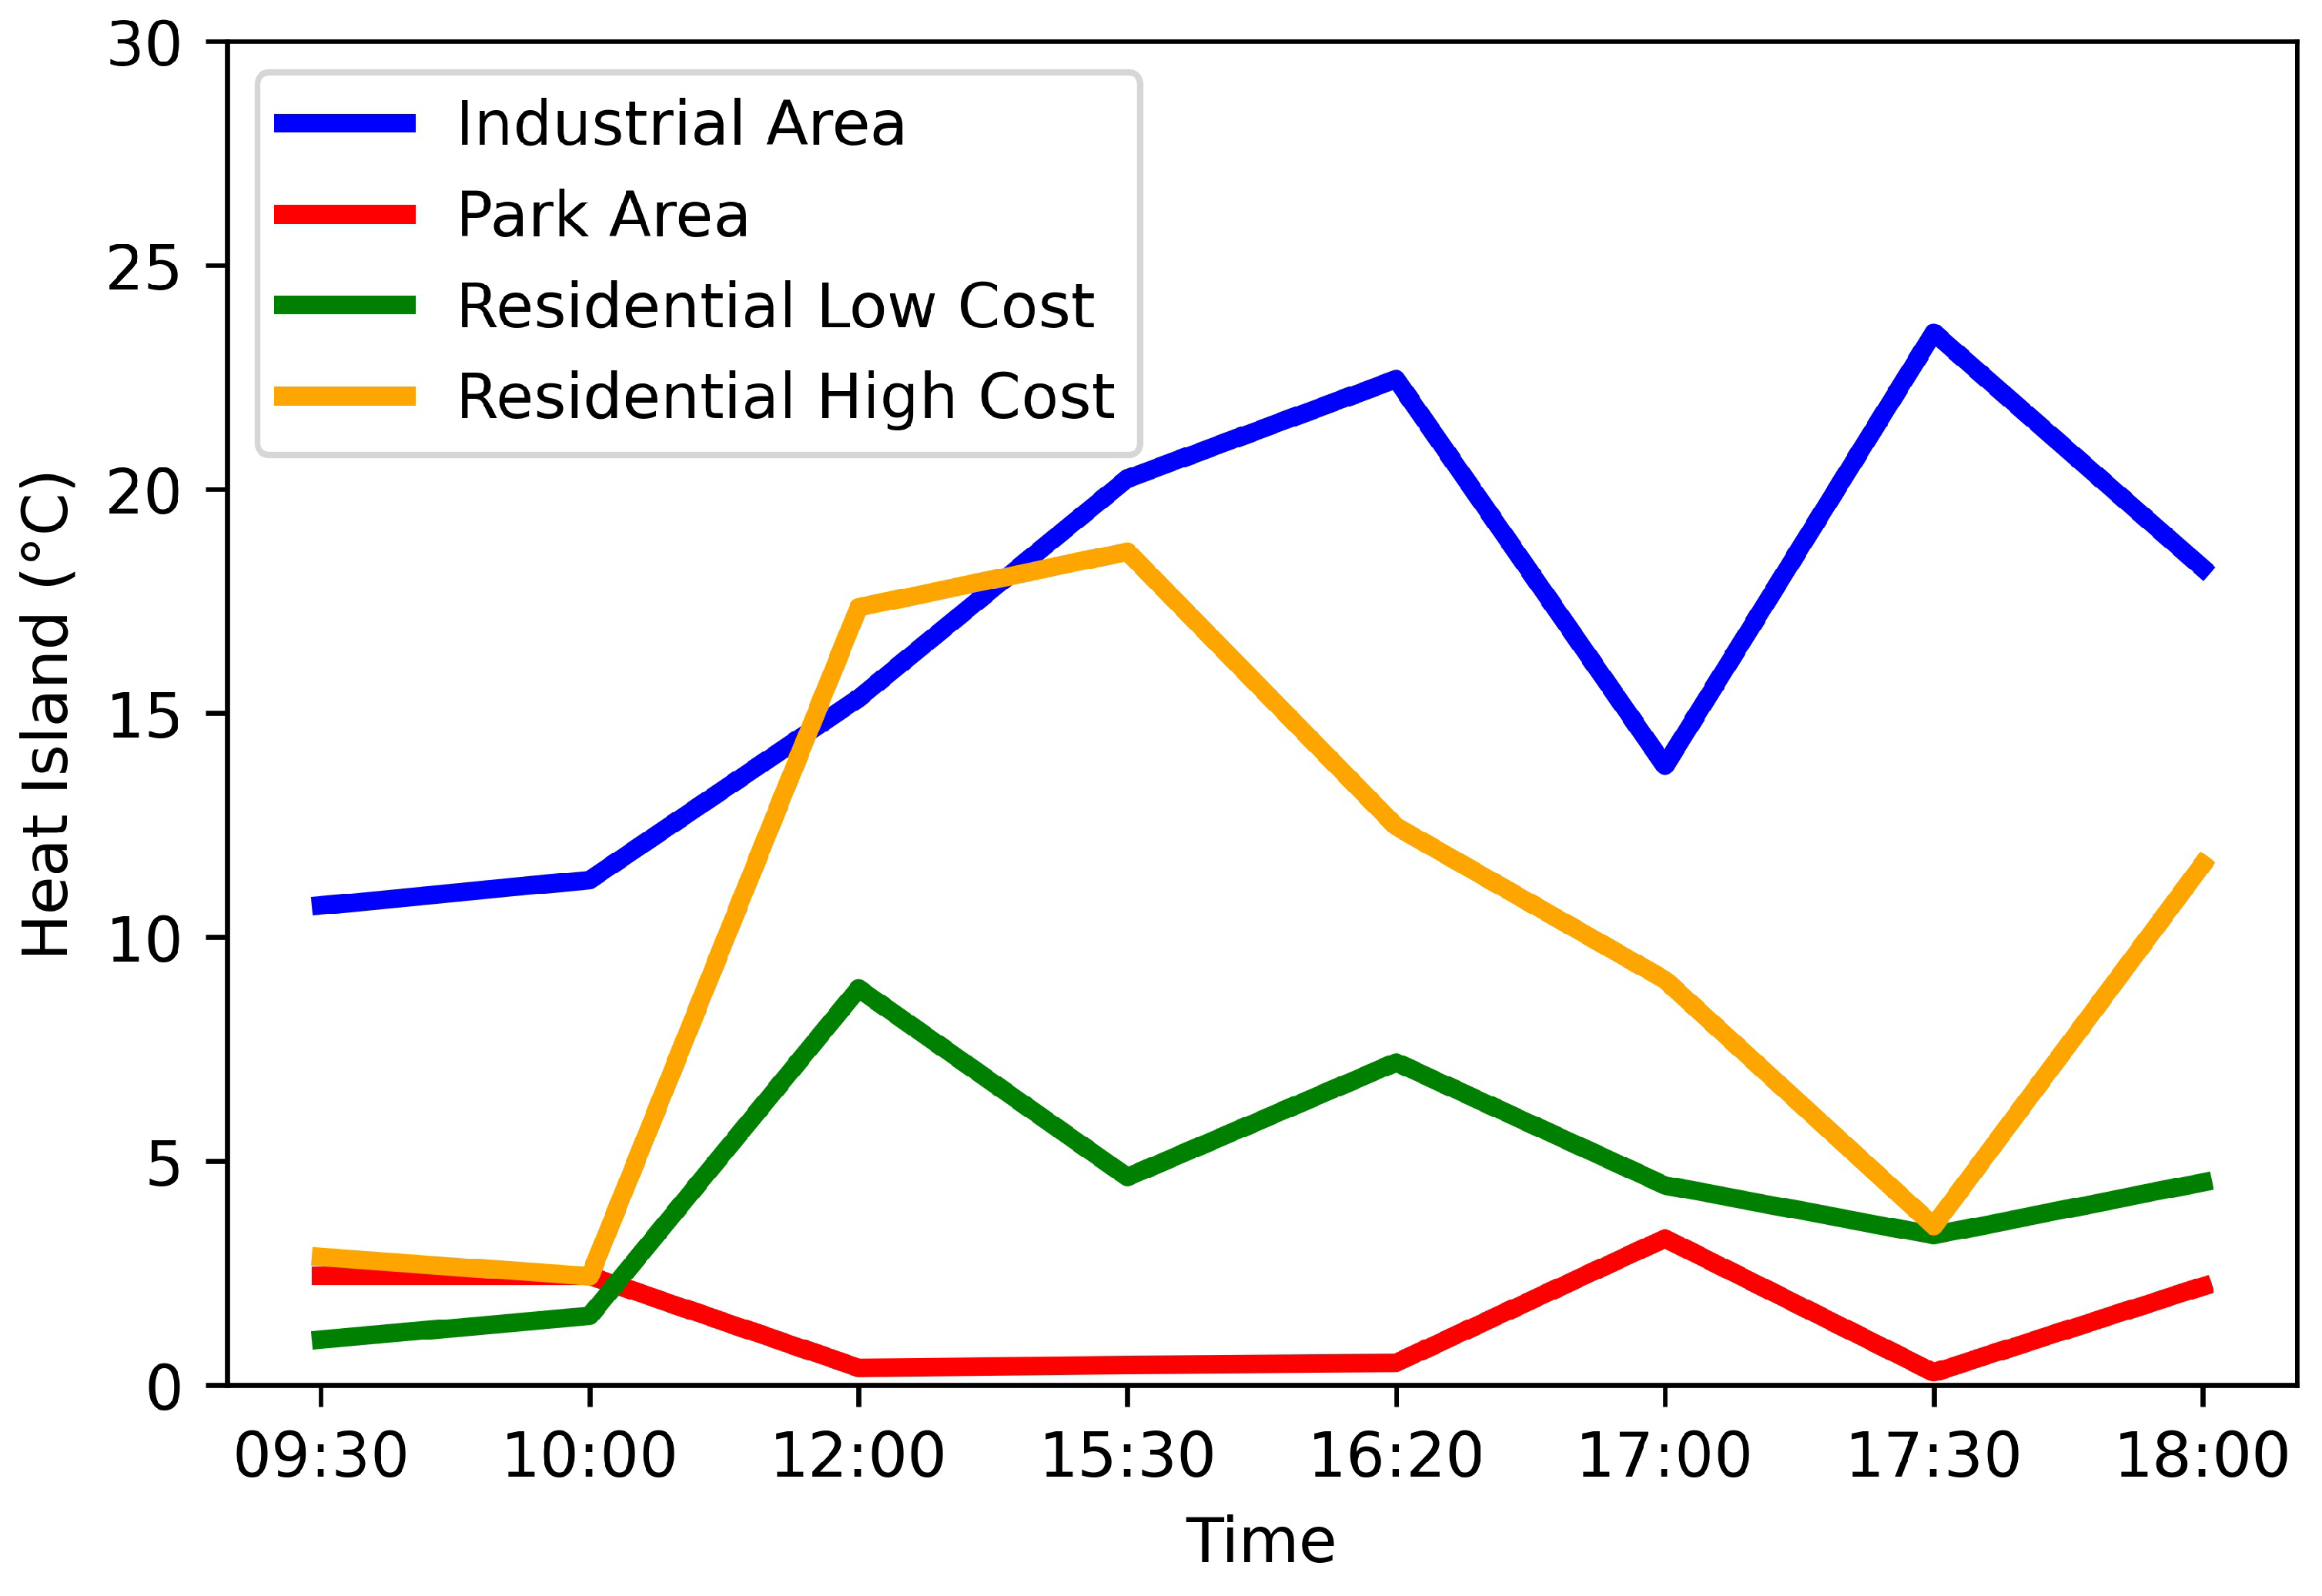
Figure 9.
LST comparison between Zenmuse H20T and Landsat on 2/3 October and 19 October. (a) LST obtained from Zenmuse H20T on 2 October and Landsat on 3 October (b) LST obtained from Zenmuse H20T and Landsat 8-9 on 19 October.
Figure 9.
LST comparison between Zenmuse H20T and Landsat on 2/3 October and 19 October. (a) LST obtained from Zenmuse H20T on 2 October and Landsat on 3 October (b) LST obtained from Zenmuse H20T and Landsat 8-9 on 19 October.

Figure 10.
Spatial variation of LST from Zenmuse H20T and Landsat. (a) LST recorded by Zenmuse H20T on 19 October from 17:00–17:30 (b) LST obtained from Landsat 8-9 on 19 October at 17:05.
Figure 10.
Spatial variation of LST from Zenmuse H20T and Landsat. (a) LST recorded by Zenmuse H20T on 19 October from 17:00–17:30 (b) LST obtained from Landsat 8-9 on 19 October at 17:05.
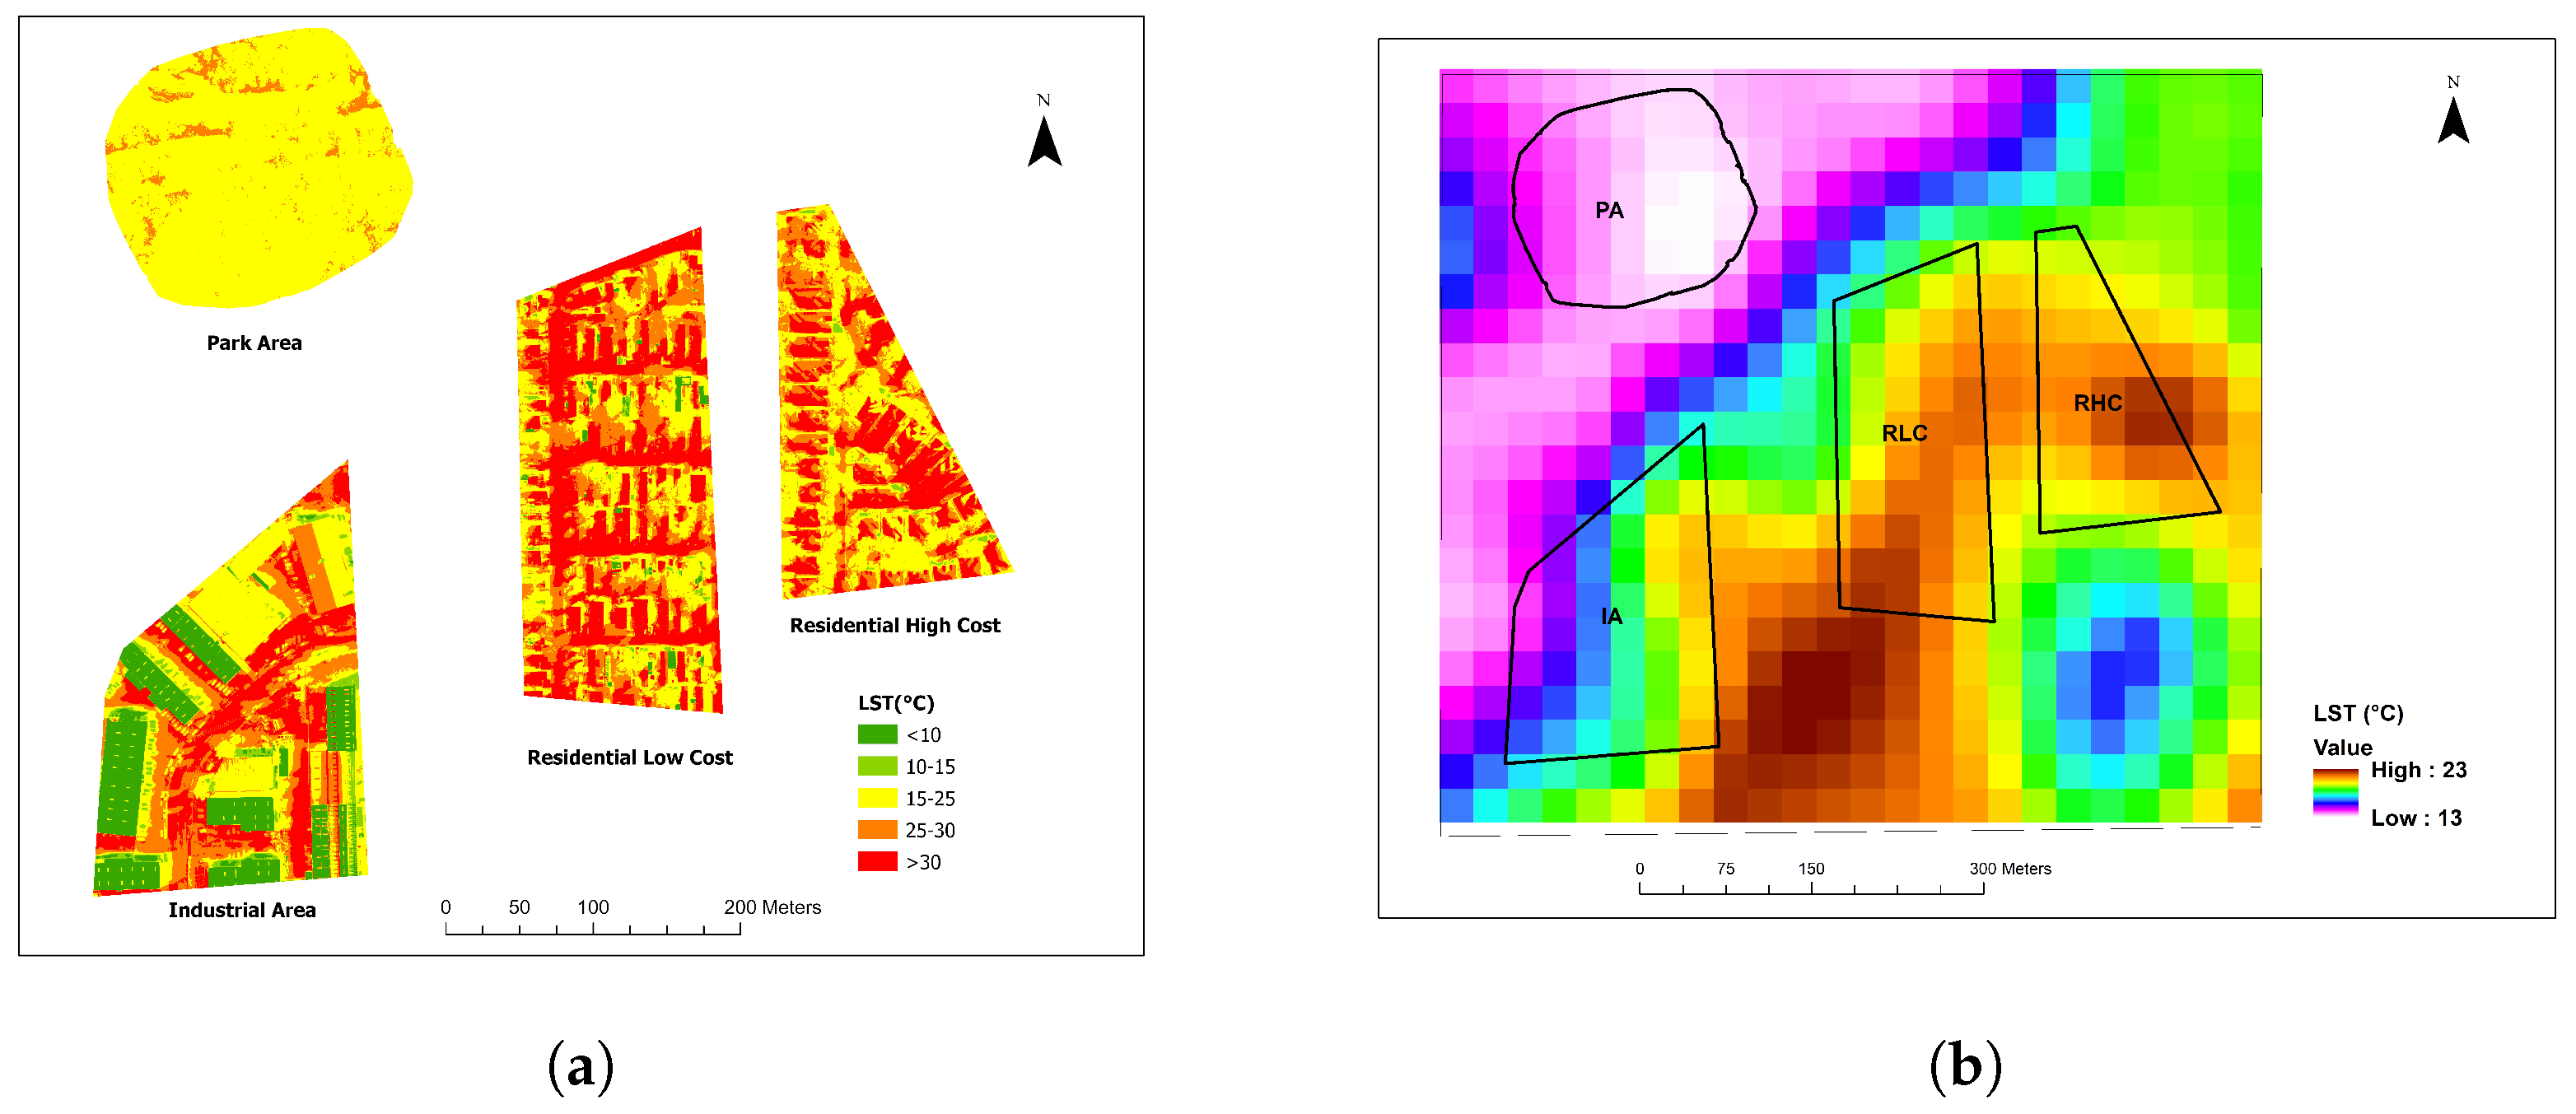
Figure 11.
Sectional variation of LST between the Zenmuse H20T and Landsat in IA on 19 October.

Table 1.
Specifications of the UAV, payload, hygrometer, and infrared thermometer.
| Item | Description |
|---|---|
| DJI Matrice 300 RTK | |
| Transmission Range | 15 Km |
| Maximum Flight Time | 55 min |
| Temperature Operating Range | −20 °C to 55 °C |
| Wind resistance | 15 m/s |
| Maximum Speed | 23 m/s |
| No of payloads | 3 |
| Night flight capability | Yes |
| Zenmuse H20T camera | |
| Wide camera resolution | 12 Mega Pixel (MP) |
| Zoom camera resolution | 20 Mega Pixel (MP) |
| Radiometric thermal camera resolution | 640 × 512 pixels |
| Night scene mode | Yes |
| Temperature operating range | −20 °C to 55 °C |
| Lens | DFOV: 40.6° |
| Spectral band | 8–14 m |
| Hygrometer | |
| Relative Humidity Range | 0.0–100.0 |
| Relative Humidity accuracy | ±3 |
| Temperature range | 0 °C to 50 °C |
| Temperature accuracy | ±1 °C |
| Infrared thermometer | |
| Emissivity | 0.1 to 1 in 0.01 step |
| Maximum Temperature | 500 °C |
| Minimum Temperature | −60 °C |
| Temperature accuracy | ±1 °C |
| Resolution | 0.1 °C |
Table 2.
Flight details with average wind speed and air temperature.
| Date | Start Time | Wind Speed (m/s) | Air Temp (°C) | Purpose |
|---|---|---|---|---|
| 9/24/2022 | 18:00 | 4.0 | 34.4 | LST Analysis |
| 10/1/2022 | 12:00 | 2.7 | 22.8 | LST Analysis |
| 10/2/2022 | 15:30 | 3.2 | 28.3 | LST Analysis |
| 10/5/2022 | 09:30 | 1.1 | 17.8 | LST Analysis |
| 10/6/2022 | 10:00 | 2.7 | 20.0 | LST Analysis |
| 10/15/2022 | 17:00 | 7.4 | 33.4 | LST Analysis |
| 10/17/2022 | 17:30 | 7.8 | 22.2 | LST Analysis |
| 10/19/2022 | 16:20 | 3.8 | 27.1 | LST Analysis |
| 2/19/2023 | 15:30 | 3.6 | 26.0 | Ground validation |
| 2/19/2023 | 16:45 | 4.0 | 25.1 | Ground validation |
| 2/21/2023 | 09:30 | 3.7 | 25.5 | Ground validation |
| 2/21/2023 | 11:45 | 4.5 | 32.9 | Ground validation |
Table 3.
Distribution of land cover area (%), emissivity and albedo in each LU.
| LU | Area | Emissivity | Albedo | |||
|---|---|---|---|---|---|---|
| Green | Roof | Pavement | Water | |||
| IA | 14.60 | 41.60 | 43.80 | 0.00 | 0.93 | 0.46 |
| RHC | 45.20 | 34.70 | 20.10 | 0.00 | 0.94 | 0.34 |
| RLC | 44.40 | 34.10 | 21.50 | 0.00 | 0.94 | 0.38 |
| PA | 77.60 | 0.00 | 0.00 | 22.40 | 0.96 | 0.36 |
Table 4.
Statistical comparison between Zenmuse H20T and in situ LST (°C) measurements.
| Time | Mean | Standard Deviation | RMSE | PBIAS | ||
|---|---|---|---|---|---|---|
| H20T | In-Situ | H20T | In-Situ | |||
| 09:30 | 20.0 | 18.7 | 3.4 | 3.1 | 1.7 | 6.7 |
| 11:45 | 31.1 | 29.4 | 4.1 | 3.6 | 3.2 | 5.5 |
| 15:30 | 22.1 | 21.9 | 2.3 | 1.6 | 1.5 | 0.9 |
| 16:45 | 23.5 | 22.0 | 1.7 | 1.3 | 1.9 | 7.2 |
Table 5.
Confusion matrix for each LU.
| Residential High Cost | ||||||
|---|---|---|---|---|---|---|
| Class | Roof | Green | Pavement | Total | U-A | |
| Roof | 30 | 1 | 1 | 32 | 0.94 | |
| Green | 4 | 46 | 1 | 51 | 0.90 | |
| Pavement | 1 | 0 | 16 | 17 | 0.94 | |
| Total | 35 | 47 | 18 | 100 | 0 | |
| P-A | 0.86 | 0.98 | 0.89 | 0 | 0.92 | |
| Residential Low Cost | ||||||
| Class | Green | Pavement | Roof | Total | U-A | |
| Green | 46 | 0 | 1 | 47 | 0.98 | |
| Pavement | 0 | 17 | 2 | 19 | 0.89 | |
| Roof | 2 | 2 | 30 | 34 | 0.88 | |
| Total | 48 | 19 | 33 | 100 | 0 | |
| P-A | 0.96 | 0.89 | 0.91 | 0 | 0.93 | |
| Industrial Area | ||||||
| Class | Roof (Cold) | Roof | Green | Pavement | Total | U-A |
| Roof (Cold) | 26 | 1 | 0 | 2 | 29 | 0.90 |
| Roof | 2 | 9 | 0 | 1 | 12 | 0.75 |
| Green | 0 | 0 | 10 | 0 | 10 | 1.00 |
| Pavement | 1 | 0 | 1 | 47 | 49 | 0.96 |
| Total | 29 | 10 | 11 | 50 | 100 | 0.00 |
| P-A | 0.90 | 0.9 | 0.91 | 0.94 | 0 | 0.92 |
| Park Area | ||||||
| Class | Green | Water | Total | U-A | ||
| Green | 73 | 1 | 74 | 0.99 | ||
| Water | 4 | 22 | 26 | 0.85 | ||
| Total | 77 | 23 | 100 | 0.00 | ||
| P-A | 0.95 | 0.96 | 0 | 0.95 | ||
Table 6.
Mean LST (°C) in each LU for 8 flights in September and October 2022.
| Time | IA | PA | RLC | RHC | IA without Cold Roof |
|---|---|---|---|---|---|
| 09:30 | 23.8 | 19.2 | 22.3 | 18.9 | 25.4 |
| 10:00 | 27.3 | 22.9 | 26.2 | 23.9 | 28.1 |
| 12:00 | 32.5 | 24.9 | 39.3 | 40.6 | 36.3 |
| 15:30 | 35.1 | 30.3 | 44.0 | 45.3 | 39.4 |
| 16:20 | 15.3 | 20.5 | 30.0 | 31.2 | 25.0 |
| 17:00 | 34.9 | 37.6 | 45.6 | 49.1 | 35.1 |
| 17:30 | 8.0 | 16.9 | 23.4 | 22.2 | 18.5 |
| 18:00 | 35.4 | 33.4 | 43.5 | 48.1 | 36.1 |
Table 7.
Statistics (LST, °C) of each LU for eight flights.
| Land Use | Mean | Min | Max | Std | Range |
|---|---|---|---|---|---|
| Industrial Area | 31.4 | −12.3 | 58.8 | 13.7 | 71.1 |
| Park Area | 25.4 | 12.1 | 43.0 | 7.2 | 30.9 |
| Residential (High-Cost) | 34.7 | 2.4 | 64.5 | 15.4 | 62.1 |
| Residential (Low-Cost) | 34.1 | 4.3 | 61.1 | 13.2 | 60.8 |
Table 8.
Mean LST (°C) of land types on 19 October.
| Type | Industrial Area | Residential (Low-Cost) | ||
|---|---|---|---|---|
| Landsat | Zenmuse H20T | Landsat | Zenmuse H20T | |
| Cold roof | 17.3 | 0.6 | ||
| Roof | 18.5 | 12.2 | 20.7 | 30.7 |
| Pavement | 17.9 | 21.7 | 20.2 | 34.5 |
| Green | 19.3 | 23.1 | 20.6 | 27.3 |
| Type | Residential (High-Cost) | Park Area | ||
| Landsat | Zenmuse H20T | Landsat | Zenmuse H20T | |
| Roof | 21.0 | 38.0 | ||
| Pavement | 20.4 | 32.2 | ||
| Green | 20.5 | 25.5 | 14.0 | 20.6 |
| Water | 14.2 | 20.1 | ||
Disclaimer/Publisher’s Note: The statements, opinions and data contained in all publications are solely those of the individual author(s) and contributor(s) and not of MDPI and/or the editor(s). MDPI and/or the editor(s) disclaim responsibility for any injury to people or property resulting from any ideas, methods, instructions or products referred to in the content. |
© 2023 by the authors. Licensee MDPI, Basel, Switzerland. This article is an open access article distributed under the terms and conditions of the Creative Commons Attribution (CC BY) license (https://creativecommons.org/licenses/by/4.0/).
Share and Cite
MDPI and ACS Style
Ahmad, J.; Eisma, J.A. Capturing Small-Scale Surface Temperature Variation across Diverse Urban Land Uses with a Small Unmanned Aerial Vehicle. Remote Sens. 2023, 15, 2042. https://doi.org/10.3390/rs15082042
AMA Style
Ahmad J, Eisma JA. Capturing Small-Scale Surface Temperature Variation across Diverse Urban Land Uses with a Small Unmanned Aerial Vehicle. Remote Sensing. 2023; 15(8):2042. https://doi.org/10.3390/rs15082042
Chicago/Turabian StyleAhmad, Junaid, and Jessica A. Eisma. 2023. "Capturing Small-Scale Surface Temperature Variation across Diverse Urban Land Uses with a Small Unmanned Aerial Vehicle" Remote Sensing 15, no. 8: 2042. https://doi.org/10.3390/rs15082042
Note that from the first issue of 2016, this journal uses article numbers instead of page numbers. See further details here.