
Enhancing FAIR Data Services in Agricultural Disaster: A Review


1
School of Resources and Environmental Engineering, Hubei University, Wuhan 430062, China
2
School of Remote Sensing and Information Engineering, Wuhan University, Wuhan 430079, China
3
Department of Geographical Sciences, University of Maryland, College Park, MD 20742, USA
4
School of Computer Science and Engineering, University of New South Wales, Sydney, NSW 2052, Australia
*
Author to whom correspondence should be addressed.
Remote Sens. 2023, 15(8), 2024; https://doi.org/10.3390/rs15082024
Submission received: 1 March 2023
/
Revised: 5 April 2023
/
Accepted: 10 April 2023
/
Published: 11 April 2023
(This article belongs to the Special Issue Recent Progress in GIS and Remote Sensing for Agricultural Applications)
Abstract
:The agriculture sector is highly vulnerable to natural disasters and climate change, leading to severe impacts on food security, economic stability, and rural livelihoods. The use of geospatial information and technology has been recognized as a valuable tool to help farmers reduce the adverse impacts of natural disasters on agriculture. Remote sensing and GIS are gaining traction as ways to improve agricultural disaster response due to recent advancements in spatial resolution, accessibility, and affordability. This paper presents a comprehensive overview of the FAIR agricultural disaster services. It holistically introduces the current status, case studies, technologies, and challenges, and it provides a big picture of exploring geospatial applications for agricultural disaster “from farm to space”. The review begins with an overview of the governments and organizations worldwide. We present the major international and national initiatives relevant to the agricultural disaster context. The second part of this review illustrates recent research on remote sensing-based agricultural disaster monitoring, with a special focus on drought and flood events. Traditional, integrative, and machine learning-based methods are highlighted in this section. We then examine the role of spatial data infrastructure and research on agricultural disaster services and systems. The generic lifecycle of agricultural disasters is briefly introduced. Eventually, we discuss the grand challenges and emerging opportunities that range from analysis-ready data to decision-ready services, providing guidance on the foreseeable future.
1. Introduction
The agricultural sector is among the most vulnerable to the impacts of natural disasters and climate change, posing significant challenges to rural communities in building resilience [1]. The effects of climate change, such as rising temperatures and extreme weather events, raise the frequency and severity of disasters. Agricultural disasters, including droughts, floods, hurricanes, and infestations, have a tremendous influence on food security, economic stability, and rural livelihoods. To effectively respond to disasters, it is essential to collaborate with multiple stakeholders and to utilize diverse data and information resources. For instance, efficient early warning systems, disaster risk reduction planning, and the development of contingency plans can assist farmers in mitigating the impacts of natural disasters on agriculture [2].
The utilization of geospatial information and technologies, such as remote sensing (RS) and geographic information systems (GIS), are gaining traction as ways to improve agricultural disaster response. This is mainly attributed to the recent advancements in spatial resolution, accessibility, and affordability. RS techniques, whether passive or active, are capable of providing reliable and immediate data over vast areas. High-resolution remote sensing imagery plays a fundamental role in delineating the impact of agricultural disasters. Meanwhile, GIS facilitates swift and accurate mapping for vulnerable communities, critical infrastructure, cropland damage, etc. In addition, rapid spatial analysis by integrating space-based satellite imagery, low-altitude images (e.g., drones), and on-the-ground statistics can provide a more comprehensive picture of the impact of a disaster and support informed decision-making. For example, combining information on crop yields and production with soil moisture levels can provide insights into the potential impact of drought on food security [3]. However, the exchange and integration of information between different organizations and systems can be hindered by a lack of interoperability, potentially diminishing the efficiency and effectiveness of disaster response efforts.
Open standards, such as those developed by the Open Geospatial Consortium (OGC) and International Organization for Standardization (ISO), may facilitate the interoperability of diverse systems and ensure that data can be readily exchanged and integrated between organizations [4]. For example, OGC provides a suite of standards that tackle various aspects of geospatial information interoperability, including data discovery, data models and encoding, services, and APIs [5]. By providing a common language and set of protocols for sharing geospatial data and information, these standards contribute to furnishing a more comprehensive picture of the situation and insights into the affected area, thereby streamlining the decision-making processes. However, despite the potential benefits of advancing agricultural resilience from farm to space, various challenges pertaining to interoperability persist. One of the main challenges is guaranteeing the relevance, timeliness, and accessibility of information to all stakeholders involved in the response, which means to ensure that the right information is available to the right people at the right time.
To envision and best support the Findable, Accessible, Interoperable, and Reusable (FAIR) agricultural disaster services, this paper aims to overview the previous efforts by taking a tour across this wide topic, dedicated to individuals with an interest in employing geospatial technologies for agricultural applications, as well as the remote sensing and GIS communities in advancing the United Nations Sustainable Development Goals (e.g., Goal 2—“Zero hunger”, Goal 11—“Sustainable cities and communities”, and Goal 13—“Climate action”) [6]. We do not linger on specific comparisons between methods or results, nor do we recommend any single approach as the definitive solution for agricultural disaster services. Instead, the scope is to provide a thorough overview of what geospatial approaches have to offer for agricultural disasters while redirecting readers to more specific papers and major references. Section 2 introduces the organizations worldwide and their initiatives, which contributes to answering the question: who are the major players, and what notable projects could researchers follow? Section 3 describes the typical studies that have examined the impacts of natural disasters on agriculture, with a special focus on agricultural droughts and floods, which contributes to answering the question: how can RS technologies be used to build a recipe for disaster indicators, and what are the current status and trends in earth observation (EO)-based methods. Section 4 summarizes the generic lifecycle of agricultural disasters, and it reviews the research on agricultural disaster services and systems, contributing to answering the question: how can GIS, cyberinfrastructure, or spatial data infrastructure (SDI) be used to enhance FAIR services. Section 5 discusses the primary challenges faced by researchers and practitioners, as well as the emerging opportunities coming along. Finally, Section 6 provides a conclusion to this paper.
2. The Major Players Worldwide
Agricultural sectors, such as crops, forests, livestock, and fisheries, are susceptible to a wide range of disasters (e.g., droughts, floods, hurricanes, storms, earthquakes, wildfires, diseases, and infestations). The international, national, and regional governments and organizations invest considerable time and effort into agricultural disaster management (Figure 1).
2.1. Intergovernmental Organizations
The United Nations (UN) plays a leading role in promoting global efforts to build agricultural resilience to natural disasters and climate change, including joint research and development initiatives, capacity-building programs, and cross-border collaborations. The UN comprises a series of funds, programmes, and specialized agencies that focus on specific areas and topics [7]. The United Nations Office for Disaster Risk Reduction (UNDRR) leads the Sendai Framework for Disaster Risk Reduction 2015–2030, which includes specific targets related to agriculture, such as enhancing early warning systems, promoting risk-sensitive development, and increasing the capacities of rural communities [8]. The United Nations Development Programme (UNDP) has launched the Global Drought Initiative to assist affected countries in constructing frameworks for mitigating and managing the effects of drought, as well as building resilient dryland [9]. The United Nations Environment Programme (UNEP) promotes nature-based solutions for reducing disaster risks, with a focus on disaster prevention [10]. UNEP also provides scientific and technical support to the United Nations Framework Convention on Climate Change (UNFCCC) [11]. The UN International Fund for Agricultural Development (IFAD) provides financial and technical assistance to rural communities in developing countries, especially helping smallholder farmers to build resilience to natural disasters [12].
The Food and Agriculture Organization (FAO) of UN has led international cooperation initiatives in agricultural monitoring and disaster risk management for years. FAO administers a series of projects on Geospatial Information for Sustainable Food Systems [13], and it periodically releases reports under the theme “The Impact of Disasters and Crises on Agriculture and Food Security” [1,14,15]. Moreover, FAO collaborates with the Economic Co-operation and Development (OECD) to manage the project Building Agricultural Resilience to Natural Disasters: Country Case Studies [2,16]. The World Meteorological Organization (WMO) of UN works to enhance the capacity of countries to provide weather and climate services. WMO and UNEP established the Intergovernmental Panel on Climate Change (IPCC), which provides guidance for policymakers and stakeholders on ways to mitigate the impacts of climate change on agriculture [17]. The Group on Earth Observations (GEO) is an intergovernmental partnership that aims to provide a common platform for the sharing of EO data and information, as well as to support Disaster Risk Reduction (DRR) [18] and Global Agriculture Monitoring (GLAM) [19]. GEO is developing the Global Earth Observation System of Systems (GEOSS) to better integrate observing systems and share data by connecting existing infrastructures using standards [20]. The World Bank provides financial support to developing countries to help build resilience to natural disasters and to enhance the capacity of rural communities. The World Bank leads many projects that support the development of agriculture risk resilience and insurance solutions. For example, Climate-Smart Agriculture (CSA) is a global initiative aimed at promoting sustainable agriculture practices and new technologies that help farmers reduce vulnerability to climate-related shocks [21].
In Europe, the European Commission’s Directorate-General for Agriculture and Rural Development (DG AGRI) provides funding for initiatives aimed at enhancing the resilience of the agricultural sectors to natural disasters, such as the European Agricultural Fund for Rural Development (EAFRD) [22] and the European Regional Development Fund (ERDF) [23]. The European Commission also manages the EO programme—Copernicus. The Copernicus Emergency Management Service provides an early warning component, which consists of the Global Flood Awareness System (GloFAS), Global Wildfire Information System (GWIS), and Global Drought Observatory (GDO) [24]. In Asia Pacific, the UN Economic and Social Commission for Asia and the Pacific (ESCAP) has launched the Risk and Resilience Portal Initiative to support climate-related and biological multi-hazards, and it provides a Data Explorer to stay updated on the hazard impacts across various regions [25]. ESCAP also published a number of reports on climate resilient infrastructure and DRR [26]. Asia-Pacific Economic Cooperation and Asia-Pacific Network for Global Change Research (APN) are other active organizations that strengthen the capacity to manage disaster risks in the region [27,28]. Africa is also susceptible to a wide range of natural disasters. The African Regional Centre for Technology (ARCT), under the auspices of UN Economic Commission for Africa (ECA), is a regional initiative aimed at enhancing the resilience of agricultural systems in Africa through technology-based approaches, including areas of drought-tolerant crops, water management, and soil conservation. FAO has also implemented several programs in Africa to improve the resilience of small-scale farmers [2]. In addition, the world’s largest global partnership of agricultural innovation networks—the Consultative Group on International Agricultural Research (CGIAR), with its 15 research institutes—continually endeavors to develop frameworks, systems, standards, strategies, and policies for agricultural services [29].
2.2. National Governments and Agencies
There are also many organizations and initiatives at the national, local, and regional levels that are working to enhance the resilience of agricultural systems to natural disasters. State/provincial departments of agriculture and local extension services play a critical role in providing information, resources, and support to farmers and communities.
In the United States, at the federal level, the US Department of Agriculture (USDA) is one of the leading organizations in providing agricultural disaster services. The USDA provides technical assistance, financial support, and educational resources to farmers and communities across the US to help them prepare for, respond to, and recover from natural disasters. The USDA National Agricultural Statistics Service (NASS) collects and analyzes data on agricultural production, prices, and other key indicators in the US, providing valuable information to farmers and policymakers. NASS operates its own geospatial programs, such as CropScape, VegScape, Crop-CASMA, and Disaster Analysis [30]. The USDA also manages the Farm Service Agency (FSA) and the Natural Resources Conservation Service (NRCS), which work to improve the resilience of agricultural lands to natural disasters and other environmental challenges [31]. The Global Agricultural and Disaster Assessment System (GADAS) also works to monitor global agricultural conditions and to assess the impact of natural disasters on agriculture [32]. The USDA Risk Management Agency (RMA) provides insurance and risk management services to farmers, including coverage for losses due to natural disasters [33]. The Federal Emergency Management Agency (FEMA), Environmental Protection Agency (EPA), National Geospatial-Intelligence Agency (NGA), and United States Agency for International Development (USAID) are other important players in building agricultural resilience to natural disasters in the US. They all provide funding and resources to help countries and communities recover from natural disasters, including agricultural lands and systems [34].
Space agencies and data centers play a crucial role in building agricultural resilience to natural disasters through their satellite and EO programs. These programs provide valuable information and data for monitoring crop growth, water resources, and soil moisture levels, enabling early warnings of potential natural disasters and supporting the development of effective risk management strategies in the agriculture sector. Prominent agencies and initiatives include the National Aeronautics and Space Administration (NASA), which manages programs, such as Landsat [35], Terra [36], Aqua [37], Moderate Resolution Imaging Spectroradiometer (MODIS) [38], Soil Moisture Active Passive (SMAP) [39], and Global Precipitation Measurement (GPM) [40]. The European Space Agency (ESA) manages the Copernicus and Sentinel missions [41], as well as the Soil Moisture and Ocean Salinity (SMOS) [42]. The National Oceanic and Atmospheric Administration (NOAA) manages the Geostationary Operational Environmental Satellites (GOES) [43], Advanced Very High Resolution Radiometer (AVHRR) [44], and the National Weather Service (NWS) [45]. The United States Geological Survey (USGS) administers the National Geospatial Program (NGP) [46] and vegetation monitoring products [47]. Additionally, these space agencies also have specific initiatives on disasters, such as NASA’s Earth Science Disasters Program [48,49] and NOAA’s Disaster Preparedness Program [50,51]. Based on the robust data capabilities, these agencies provide valuable information on: (1) vegetation health, crop distribution, and crop yields; (2) natural disasters, such as droughts, floods, and hurricanes; (3) changes in temperature, rainfall patterns, soil moisture levels, and the distribution of land and water resources. There are also some active non-governmental data centers, such as the National Drought Mitigation Center (NDMC), which provides data, maps, and tools on agricultural drought [52], as well as the Dartmouth Flood Observatory (DFO), which maintains an active global archive of large flood events from 1985 to the present [53].
In the UK, the Department for Environment, Food and Rural Affairs (DEFRA) is the primary governmental department responsible for supporting the UK agricultural sectors. DEFRA administers the Flood and Coastal Resilience Innovation Fund, Countryside Stewardship, etc. [54,55]. In Canada, the Agriculture and Agri-Food Canada (AAFC) is the primary government responsible for supporting the Canadian agricultural sectors, and it manages the AgriRecovery program that provides financial assistance to farmers. Natural Resources Canada (NRCan) is another department actively developing policies to build agricultural resilience, with a special focus on flood mapping. In China, the Ministry of Agriculture and Rural Affairs, the Ministry of Emergency Management, and the National Disaster Reduction Center of China (NDRCC) are the major governments for promoting the development of agriculture and implementing disaster reduction, and they have launched a number of initiatives, such as the Sharing and Learning on Community Based Disaster Management in Asia Programme (CBDM Asia) [56]. The aforementioned examples are merely a selection, and actually, many countries have their own national departments and agencies, providing coordinated responses to natural disasters and financial assistance to farmers who have suffered losses. The researchers could choose to follow and contribute to them according to their locations.
2.3. International Standard Organizations
The international standard organizations are not specifically focused on agricultural disaster services. However, their standards and initiatives do play a crucial role by improving interoperability and data sharing between organizations and systems. The standard organizations always work closely with international governments and space agencies, such as the UN, World Bank, NASA, and ESA, to support the development of geospatial data standards for disaster resilience.
The Open Geospatial Consortium is a leading international organization that develops and promotes standards for geospatial information sharing. The OGC’s efforts in building agricultural resilience to natural disasters are focused on making the geospatial data and services FAIR. One of the key initiatives of the OGC is the Standards Program, which develops the standards for data discovery, data models and encoding, services and APIs, and sensors, etc. [5]. These standards enable efficient information sharing in a seamless manner for emergency responders and decision-makers. Another OGC initiative is the Domain Working Group (DWG). The DWGs bring together organizations and experts from the public and private sectors to collaborate on the development of geospatial standards and best practices. For example, the Emergency and Disaster Management DWG is working on standards for incident management, damage assessment, and evacuation planning, and the Meteorology and Oceanography DWG is dedicated to improving collection, analysis, and dissemination of hazard information in a timely and useful fashion [57]. In addition, OGC Collaborative Solutions and Innovation Program (COSI), such as the Disaster Pilot (2019, 2021, 2023) and Climate Resilience Pilot 2021–2026, provide funding and support to development, which focuses on demonstrating innovative geospatial technologies for early warning systems and emergency response [58].
The ISO has released international standards for a wide range of industries, including both agriculture and disaster. ISO standards provide guidance to government and non-governmental organizations on risk management (ISO 31000) [59], incident management (ISO 22320) [60], public warning (ISO 22322) [61], and food safety management (ISO 22000) [62]. For instance, ISO 31000 provides an effective decision-making framework for managing risks associated with natural disasters, which can be applied to agricultural sectors. ISO 22000 provides a systematic approach to managing food safety, including the prevention of food contamination and the protection of food quality during and after a disaster. In addition, standards developed by ISO/TC 211 are exclusive for geographic information, which can be used to build an interoperable geospatial framework for agriculture disaster information services and systems, such as geographic metadata (ISO 19115) [63], encoding (ISO 19118) [64], data quality (ISO 19157) [65], and services (ISO 19119) [66].
There are also other standard organizations focusing on developing and promoting standards for geospatial and EO data exchange. For example, the Federal Geographic Data Committee (FGDC) has developed the National Spatial Data Infrastructure (NSDI) Strategic Plan 2021–2024, which ensures open standards-based interoperability to enable geospatial shared services [67]. W3C Spatial Data on the Web Working Group has developed a number of specifications and best practices that encourage better sharing of spatial data on the Web, as well as the use of Linked Data and the Resource Description Framework (RDF) [68]. The Committee on Data of the International Science Council (CODATA) also works to advance geospatial research data that are intelligently open [69].
3. EO-Based Agricultural Disaster Research: Case Studies
Over the past decades, agricultural drought and flood have been, undoubtedly, the predominant types that have sparked considerable scientific efforts. Therefore, we have selected the typical studies of agriculture disasters, with a special focus on the impacts of crops and vegetation, to illustrate the comprehensive capabilities of remote sensing for predicting, monitoring, and assessing agricultural disasters.
3.1. Agricultural Drought
Agricultural drought (also referred to as vegetation drought) represents soil moisture deficiency in vegetation, which is usually driven by meteorological drought (insufficient precipitation) [70,71,72]. The occurrence of agricultural drought is influenced by various natural factors, such as precipitation, temperature, and topography, as well as anthropogenic factors, including crop distribution, crop varieties, and growth conditions. EO-based agricultural drought monitoring has become increasingly important in recent years for assessing the probability of drought and estimating vegetation health and crop yields. Remote sensing technologies, such as satellites and drones, are used to observe and analyze various aspects of drought, including vegetation conditions, soil moisture, precipitation patterns, etc. Geospatial modeling and analysis also play a key role in drought monitoring, as they can be used to map vegetation cover and to estimate the spread of drought-affected areas. Digital elevation models and hydrological modeling are two of the most common techniques used in this regard. Artificial intelligence (AI) and big data technologies, such as machine learning (ML) and deep learning (DL), are also increasingly being used to assess agricultural drought, which leverages vast amounts of data collected from remote sensing, ground measurements, and other sources. As illustrated in Figure 2, the following subsections are some typical studies categorized by the methods used in EO-based agricultural drought monitoring.
3.1.1. Remote Sensing-Based Agricultural Drought Indicators
Remote sensing-based vegetation indices are the most common approaches for monitoring agricultural drought, as they offer the potential for large-scale and timely monitoring of vegetation health and stress from satellite imagery. Remote sensing-based indices naturally integrate soil moisture or vegetation information into agricultural drought indicators, which are difficult to directly gauge from field observations [73].
The Normalized Difference Vegetation Index (NDVI) is the most well-established index to estimate agriculture drought, and its history can be dated back to the late 20th century. NDVI is calculated by comparing the reflectance of red and near-infrared wavelengths that can be used to measure the greenness of vegetation, which is an indicator of plant stress within the rootzone [74]. Numerous studies, based on NDVI-based drought monitoring, have been conducted by using a broad range of multispectral sensors, such as Advanced Very High-Resolution Radiometer (AVHRR), Landsat, MODIS, Sentinel-2, Quickbird, and RapidEye [75,76,77,78,79,80]. The studies also cover global to regional scales [81,82]. However, NDVI is insensitive to dense vegetation areas, and it is sensitive to soil background variations. The standalone NDVI-based method has limitations regarding long term change, improved vegetation indices, such as Vegetation Condition Index (VCI) [83], Vegetation Health Index (VHI) [84], Enhanced Vegetation Index (EVI) [85], and Temperature Vegetation Drought Index (TVDI) [86], which have been proposed. For example, Barretta et al. calculated the three-month VCI from MODIS and Landsat for drought early warning in Kenya [87]. Zhong et al. utilized the weekly VHI from AVHRR to investigate the long-term spatiotemporal characteristics of vegetative drought in the Contiguous United States (CONUS) [88]. VCI and VHI have also been widely used in a combined way, with other indices, such as Gross Primary Productivity (GPP) [89,90]. Additionally, efforts have been made to apply evaluations among different indices, and the advantage of the multivariate index approach is that it has different sensitivities to vegetation type and density [91,92,93]. For example, Wu et al. [94] evaluated the agricultural drought frequency change and agricultural drought area change based on the use of Palmer drought severity index (PDSI) [95] and VHI.
Soil moisture plays a vital role in maintaining the sustained healthiness of vegetation, and variations in soil moisture can be captured by quantiles or anomalies. An increasing trend of recent studies utilizes soil moisture as the basis to assess agricultural drought conditions by leveraging microwave remote sensing data, such as SMAP, SMOS, ASMR-E, and Sentinel-3 [96,97]. For instance, Xu et al. assimilated the SMAP soil moisture data into a hydrologic model to provide more reliable surface soil moisture over the CONUS. The authors also developed a novel drought index and found that it captures the flash drought earlier than the USDM in the use case, thus performing a high correlation with the yield loss of wheat [98]. Martínez-Fernández et al. calculated the soil water deficit for agricultural drought monitoring by using the SMOS L2 time series [99]. Moreover, efforts have also been made to develop improved indices, such as the Soil Moisture Condition Index (SMCI), Microwave Integrated Drought Index (MIDI) [100], Soil Moisture Agricultural Drought Index (SMADI) [101,102], and High Resolution Soil Moisture Drought Index (HSMDI) [103]. However, limitations also exist due to the relatively short-term soil moisture data archives compared to vegetation indices or surface temperature data. Thermal and hyperspectral imagery, in combination with optical data, are promising in effectively enhancing the early warning capabilities, and such approaches discriminate the causes of regional crop stress in a quantitative manner, as well as the severity of the stress in terms of impacts on final yield [104,105].
Overall, most studies are generally focused on specific geographical regions prone to drought, and only a few drought indices have been applied at a global scale. This limitation arises from the lack of standardized, ground-truthed databases for drought and crop yield, which make validation challenging [106].
3.1.2. Integrative Methods for Drought Monitoring
These methods integrate multiple data sources, including remote sensing data, in-situ observations, and meteorological data, to provide a more comprehensive and accurate view of agricultural drought conditions in either morphological or biophysical ways [107,108]. For example, Brown et al. proposed the Vegetation Drought Response Index (VegDRI) by integrating the Standardized Precipitation Index (SPI) [109], PDSI, NDVI, and Land Cover. VegDRI exploits the strengths of both remote sensing and climate-based drought monitoring, and it has been widely applied to develop models and to assess drought at the national scale [110]. Zhang et al. proposed a multi-sensor integrated framework based on the analysis of the agricultural drought evolution process, and they further developed a novel index, named the Process-based Accumulated Drought Index (PADI), to quantify the accumulative drought impacts on crops [111].
The integrative methods draw upon both remote sensing data and ground-based data sources as parameters. Ground-based monitoring involves the use of in situ instruments (e.g., weather stations and soil moisture sensors) to collect climate data. Ground measurements are a valuable source of qualitative data, especially in areas with challenging topography or dense vegetation [108]. For instance, the rootzone soil moisture deficits can hardly be measured with remote sensing data alone. Cao et al. developed an agricultural drought index based on a vegetation–soil water deficit, with the combination of soil moisture and potential evapotranspiration [112]. Similarly, taking the consideration of precipitation and evaporation effects, SPI and Standardized Precipitation Evapotranspiration Index (SPEI) [113] are other highly-used factors combined by a number of studies [114,115,116,117]. For example, Yuan et al. identified varying degrees of preseason drought and analyzed the sensitivity of the vegetation spring phenology by using EVI and SPEI [118], while Ren et al. analyzed the effects of heat and drought stress on wheat harvest date based on SPEI and PDSI [119]. Remote sensing parameters, such as temperature-related indicators from the Land Surface Temperature (LST) and the Temperature Condition Index (TCI), are also commonly used to construct multivariate composite indices [120]. For example, Amani et al. proposed a new index called Temperature-Vegetation-Soil Moisture Dryness Index (TVMDI) by using NDVI, LST, and soil moisture data [121]. Cai et al. developed the Scaled Drought Condition Index (SDCI) by combining VCI, TCI, and Precipitation Condition Index (PCI) [122]. Kloos et al. conducted a correlation analysis between NDVI and LST, and they applied the TCI, VCI, and VHI to evaluate agricultural yield anomalies in Bavaria, Germany [123]. Bento et al. proposed a multi-scalar drought index to disentangle the contributions of VCI and TCI on vegetation health over drylands [124].
As evidenced, researchers have exerted considerable efforts to establish comprehensive indices for drought monitoring. Due to the data availability, as well as spatial and temporal resolution, passive remote sensing-based approaches have been most widely used. Normally, the researchers have to trade off spatial and temporal resolution when selecting the data sources, and certain variables even have a contradictory effect on drought prediction models, which is a key challenge of integrative methods. However, new opportunities have arisen with the advent of combined-sensor products, such as the ESA Climate Change Initiative (CCI) Soil Moisture [125], which has already shown high potential for multi-spatiotemporal scale drought monitoring [126,127,128]. In addition, it is important to note that appropriate agricultural practices can prevent agricultural drought even after severe meteorological droughts. Climate variables (e.g., SPI and SPEI) are not always reliable indicators for agricultural drought and should not be used straightforwardly to verify agricultural drought indices [129].
3.1.3. Machine Learning and AI-Based Methods
In recent years, machine learning and AI-based methods have become increasingly popular for assessing the severity of drought conditions and devising strategies for mitigation. By leveraging ML/DL algorithms, data from satellite imagery, weather forecasts, and other sources can be analyzed to detect areas of drought. Some studies have focused on using traditional ML methods, such as random forest (RF) and support vector machines (SVM), while others have explored DL approaches, such as artificial neural networks (ANN) and deep neural networks (DNN), to process large datasets, improve accuracy, and generate insights for agricultural drought monitoring and assessment [130,131].
A number of studies have been conducted to demonstrate the effectiveness of ML and AI-based methods for agricultural drought monitoring, based on the integration of multi-source remote sensing data [132]. For instance, Zhao et al. applied SVM, bias-corrected random forest (BRF), and extreme gradient boosting (XGBoost) to estimate agricultural drought based on SPEI in Shandong, China [133]. Prodhan et al. employed a deep forwarded neural network (DFNN) with the consideration of precipitation, vegetation, and soil factors, and they evaluated agricultural drought by using SMDI during crop phenology stages [134]. Shen et al. also used a DFNN to construct a comprehensive drought monitoring model, which is applicable in the monitoring of agricultural drought [135]. Areffian et al. demonstrated the effects of drought on vegetation cover based on SPI and MODIS NDVI by using ANN [136]. Ghazaryan et al. assessed the drought impact and spatiotemporal patterns of crop conditions at the field scale. They used logistic regression to evaluate the drought-induced variability of remotely sensed parameters for different crop growth stages [137]. Bayissa et al. developed a high resolution vegetation outlook model for the Upper Blue Nile basin, and this model is able to predict the vegetation condition during the main crop-growing season based on a rule-based regression tree approach [138]. With the aim to determine whether various remotely-sensed drought factors could be effectively used for monitoring agricultural drought in south-eastern Australia, Feng et al. proposed a reproduced SPEI by adopting RF, SVM, and multi-layer perceptron neural network as the regression models [139]. Park et al. developed drought indicators through the blending of six drought factors using RF, boosted regression trees (BRT), and Cubist, and the six factors were selected from sixteen candidates by using the relative importance as weights [140].
ML-based methods can be used to identify areas at risk of agricultural drought, enabling better prediction and early warning systems. For instance, Rahmati et al. developed new approaches to predict agricultural drought hazard with advanced ML models, including regression trees, BRT, RF, SVM, multivariate adaptive regression splines (MARS), and flexible discriminant analysis (FDA). Eight severe droughts over the period 1994–2013 in Queensland, Australia were used as the use cases [141]. Dao et al. integrated full spectra and derivative spectra with three ML algorithms (RF, SVM, and DNN) for early drought detection and classification [142]. Zhang et al. employed extremely randomized trees (ERT), extreme learning machine (ELM), and Model, developed by H2O.deep learning(H2O.DL), to model and predict droughts at different time scales [143]. Aghelpour et al. proposed a novel model for predicting agricultural drought based on PDSI time series, and they used the dragonfly algorithm (DA) to optimize the parameters of SVM [144]. Tian et al. used the support vector regression (SVR) model, incorporating SPEI, to predict the agricultural droughts in the Xiangjiang River basin. They also analyzed the relationship between soil moisture and drought [145].
In addition, ML models are also capable of providing more accurate insights into the drought impact on crop yields, which is invaluable for agricultural decision-makers. To this end, Bouras et al. developed a cereal yield forecasting model by using both using linear (multiple linear regression, MLR) and non-linear (SVM, RF, and XGBoost) ML algorithms [146]. Zambranoa et al. used freely available, near-real-time (NRT) data sources from MODIS to predict agricultural productivity in Chile, with two approaches—linear regression and the DL model [147]. A study by An et al. proposed a method that uses a deep convolutional neural network (DCNN) to classify maize drought stress [148]. Mann et al. proposed a data fusion method by combining remote sensing data with agricultural survey data, and they predicted the maize and wheat losses from drought using RF [149].
Furthermore, hybrid models and ensemble approaches that combine ML and crop models have also been found to improve the accuracy of drought predictions. For example, Li et al. presented a novel method to estimate regional wheat drought risk for insurance applications, and they established a drought vulnerability assessment system by coupling the MCWLA crop growth model [150] with statistical models (RF and MLR) [151].
In general, data preprocessing and feature selection are considered critical steps for improving the accuracy and efficiency of the aforementioned methods. Although ML and AI-based methods have the potential to revolutionize the ways of agricultural drought monitoring and forecasting, the lack of high-quality ground truth data remains a major challenge for developing ML models. Moreover, the accuracy and reliability challenges posed by DL models, which can evaluate the intricate relationship between drought variables and crop growth, remain an ongoing issue.
3.2. Agricultural Flood
Flood disasters have been identified as one of the most impactful natural disasters on agriculture due to their sudden onset, broad distribution, frequent occurrence, and severe damage. In recent years, crop losses caused by flood disasters have been extensive worldwide. Effective monitoring of flood disasters is of utmost importance for disaster management agencies to facilitate disaster prevention, prediction, and post-disaster recovery efforts. Furthermore, it facilitates the agricultural sector in tracking the agricultural product market, food prices, grain security, and policy-making. High-precision flood disaster simulation and prediction is an essential approach for preventing and mitigating agricultural flood disasters. As illustrated in Figure 3, the primary methods for agricultural flood disaster monitoring include remote sensing indices modeling, based on crop phenology, geoscientific modeling, founded on disaster-causing processes (such as hydrological and hydraulic models), and data-driven methods (such as machine learning and AI-based techniques). Model-driven methods have the advantage of explicit physical interpretation, but they may be restricted by imprecise modeling expressions and data requirements. In contrast, data-driven methods, although lacking interpretability on biophysical meaning, typically perform with higher accuracy than model-driven methods.
3.2.1. Remote Sensing-Based Agricultural Flood Monitoring
Remote sensing-based modeling is a common approach to assess crop damage caused by floods, and it typically involves two key steps: (1) extracting and mapping the disaster-causing factors and related indicators (e.g., flood extent, depth, and duration) and (2) evaluating the vulnerability of affected crops [152].
Numerous studies have been conducted to rapidly extract flood inundation areas under complex climatic conditions, as summarized below. Optical remote sensing-based extraction methods have been explored in a number of studies, leveraging long-term Landsat TM, AVHRR, MODIS, high-resolution Sentinel, and Gaofen satellite imagery [153,154]. The Normalized Difference Water Index (NDWI) is a widely used index for extracting water bodies [155]. Optical remote sensing-based methods offer several advantages, such as numerous data sources, high spatial and spectral resolution, and frequent revisits. However, they are susceptible to adverse weather conditions and cloud cover [156]. Several studies have also explored synthetic aperture radar (SAR)-based extraction methods, utilizing Sentinel-1, Radatsat, Envisat, and TerraSAR data, which provide all-weather capability, penetrate through vegetation and clouds, but at a higher cost, and are affected by changes in backscattering and discontinuous data acquisition [157,158,159]. Tsyganskaya et al. summarized the insights about the relationships between SAR parameters and environmental conditions for flooded vegetation detection [160]. Other studies have focused on optimizing flood data products, such as the NRT global flood observation products provided by the DFO and FEMA, as well as their validation [161]. Furthermore, studies have been conducted on rapid flood mapping using soil moisture and precipitation data [162,163]. Some studies have also used multi-satellite data to achieve more accurate and comprehensive results [164,165].
Once the flood inundation indicators have been determined, there are traditional GIS analysis methods available for assessing crop vulnerability to flooding, such as geospatial overlay. Additionally, there are sophisticated modeling and estimation approaches that consider various factors, such as crop type and vulnerability index, as well as historical statistics [166,167,168]. Remote sensing-based modeling presents a notable advantage in analyzing the dynamic changes of crops in both time and space, with a relatively mature process and application experience. However, these methods have limitations in monitoring the growth process of crops and evaluating yield loss due to less consideration of phenological mechanisms.
Regarding crop yield loss assessment, several methods utilize crop growth models for simulation calculations, including the WOrld FOod STudies (WOFOST) model [169], the Agricultural Production Systems sIMulator (APSIM) model [170], etc. Furthermore, some enhanced models are specifically designed to assess crop yield reduction resulting from floods. For Example, the Agriculture Flood Damage Analysis (AGDAM) model is one of the most preferred models, which considers flood duration and the time of year for agricultural flood loss quantification, and it was developed by the US Army Corps of Engineers (USACE) [171,172]. Yildirim and Demir presented a comprehensive assessment of agricultural flood risk in Iowa, US, by leveraging AGDAM [172]. Molinari et al. proposed a conceptual model, named AGRIDE-c, for the estimation of flood damage to crops [173]. Li et al. developed a process-based crop model to estimate the waterlogging damage to wheat yield [174]. These models generally require a large number of input parameters and necessitate data preprocessing and assimilation, with a relatively high level of complexity. In a different study, Rahman et al. proposed a novel index, named the Disaster Vegetation Damage Index (DVDI), to estimate the crop-specific damage that occurs immediately after flood events [175].
3.2.2. Coupling Hydrological Models with Earth Observation Data
The use of hydrological models is also a common method for monitoring and assessing agricultural floods. These models provide a means of simulating flood conditions, gaining an understanding of the disaster process, and estimating the impact of flood depth [176,177]. Typically, natural disaster factors, such as rainfall, temperature, and terrain, are input into the model, which then outputs hydrological and hydraulic information, as well as flood indicators [178]. Several well established hydrological models and tools exist to facilitate this process, such as the TOPography based hydrological MODEL (TOPMODEL) [179], Storm Water Management Model (SWMM) [180], Soil and Water Assessment Tool (SWAT) [181], Rapid Flood Spreading Model (RFSM) [182], and Height Above the Nearest Drainage (HAND) [183,184,185].
Recent studies have aimed to enhance flood monitoring and assessment in agricultural areas by coupling hydrological models with remote sensing, ground observation, and Digital Elevation Model (DEM) data [186,187]. For instance, Hendrawan and Komori developed flood vulnerability curves for rice crops by using a two-dimensional hydrodynamic model and remote sensing data (e.g., NDVI and EVI). The authors found that the relationship between the intensity of flood parameters and the degree of rice crop yield loss fits logarithmic regression functions, demonstrating that flood depth is the most significant parameter in loss estimation [188]. Psomiadis et al. utilized Sentinel-1 and Landsat imagery in collaboration with a one-dimensional hydraulic model to assess flood impact in agricultural areas. They employed a case study of a major flood event that occurred in Sperchios river catchment in Greece, which is characterized by extensive farming activity [189]. Chen et al. proposed a quantitative and spatial evaluation framework to facilitate the identification of historical flood characteristics that influence crop losses. They developed an empirical model, based on vegetation indices from mid-high spatial and temporal remote sensing data in association with agricultural statistics data. Additionally, they employed a rainfall-runoff model and a two-dimensional hydraulic model to implement a routing scheme for surface runoff. The authors found that the flow velocity of flood was the most influential factor that caused corn, rice, and soybean yield losses in the mountainous regions [190].
In summary, the aforementioned studies demonstrate that the integration of hydrological models with remote sensing holds promise in elevating the comprehensiveness of flood assessments by providing richer information. While these models make better use of distributed data and physical processes, they often require substantial data and computational power. Moreover, hydraulic models are susceptible to imprecise modeling expression, model generalization, and initial condition uncertainty, which may impede their accuracy in certain scenarios.
3.2.3. Machine Learning and AI-Based Methods
In recent years, there has been a discernible upsurge in the adoption of machine learning and AI-based methods for agricultural flood monitoring and assessment. Classic methods, such as RF, SVM, and ANN, have been successfully applied to flood monitoring and prediction, and they have even exhibited effectiveness for long-term flood forecasting [191]. Although the biophysical interpretation of ML methods is not explicit, they tend to manifest superior performance compared to model-driven methods [192].
Substantial evidence from long-term studies reveals a notable linear correlation between the vegetation index (or its cumulative value) during the crop growing season and the crop yield [193]. Many researchers have utilized NDVI data to establish regression models that describe crop yield relationships. For example, Shrestha et al. utilized a linear regression model to estimate flood impact on corn yield at the field level, with the use of MODIS NDVI and UDSA Cropland Data Layer (CDL) [194]. Similarly, Chen et al. proposed a systematic approach and developed an empirical regression model to identify influential factors controlling flood damage extent on crop yields [195]. Wang et al. developed an integrated disturbance index to detect the impact of flood on crop production, and they also investigated the relationship between flood indicators and loss extent by using the RF model [196]. Another study by Li et al. also utilized the RF model to generate a post-flood recovery map based on Sentinel-1/2 imagery, which could help reduce the agricultural failure cost to a great extent [197]. Lazin et. al developed a model based on CNN to assess the cropland damage area by floods at the county level, which can be further applied to forecast the impacts in the upcoming season [198]. Phan et al. proposed a framework to quickly estimate the rice areas damaged by flooding, and they also applied a SVM classifier on time–series Sentinel 1A imagery to produce a rice-flooding frequency map over the Red River Delta [199].
Overall, these studies demonstrate the potential of machine learning and AI-based methods for agricultural flood monitoring and assessment. By feeding remote sensing data to the ML model, these methods can provide timely information regarding flood extent, severity, and impact on crops. However, further research is needed to validate and refine these methods, as well as to apply cutting-edge technologies that can address the challenges of agricultural flooding in various regions and contexts.
4. Cyberinfrastructure for Agricultural Disaster Resilience
4.1. Disaster Lifecycle: The Role of Agriculture
Natural disasters can have devastating consequences on agricultural development, often wiping out years of progress in a single event. This situation is further aggravated by increased agricultural activity in high-risk areas. In order to effectively manage agricultural disasters, a comprehensive understanding of their occurrence and evolution cycle is necessary. The disaster lifecycle is a framework that describes the various stages of disaster risk management, including preparedness, response, recovery, and mitigation [8]. Each stage is associated with different objectives and requires the coordination of a variety of resources and strategies. Furthermore, to gain a deeper understanding of the agricultural disaster lifecycle, we summarize the key points into the following four stages:
- (1)
- Disaster risk identification and awareness
Risk identification in the agriculture sector entails analyzing potential hazards (e.g., their location, intensity, frequency, and probability), as well as evaluating exposure and vulnerability conditions (e.g., physical, socio-economic, and environmental aspects) [200]. For example, this involves establishing multi-hazard vulnerability profiles and sector-specific maps, with a priority on the risks and exposure levels of farming communities. Additionally, knowledge sharing and awareness raising initiatives are of paramount importance. This involves expanding activities, education, and training for farmers and communities to reduce vulnerabilities of natural disasters in agriculture. For example, seasonal forecasting and advisories can help farmers make appropriate decisions, such as adjusting their cultivation practices or selecting drought-resistant varieties to ensure their food security and income.
- (2)
- Disaster prevention and preparedness
To ensure effective disaster prevention and preparedness for the agriculture sector, it is essential to focus on accurate prediction and monitoring capabilities, as well as the knowledge and strategies necessary to respond to disasters. Preparedness activities for the agricultural sector include national/local emergency preparedness planning, specific contingency plans, simulation drills and exercises, equipment and material supplies, establishment of evacuation coordination mechanisms, rapid risk assessment, and dissemination of public information [2]. Regular monitoring and forecasting of disaster time and likelihood is also critical. For example, strong connections should be established with multiple disaster warning systems to implement adequate forecasts regarding disaster risks before they occur, while simultaneously strengthening the resilience of farmers, communities, and relevant stakeholders. In addition, disaster prevention measures can be implemented at the farm level, such as using crop varieties that are more resilient to floods or droughts, as well as implementing conservation practices (e.g., conservation tillage). Social protection schemes and risk insurance can further assist in reducing farmers’ vulnerability and exposure to financial impacts, as well as potential food security risks. For example, crop insurance can assist farmers in diversifying the risk of income loss.
- (3)
- Disaster emergence response and impact assessment
Emergency response refers to immediate interventions taken after a disaster. It aims to provide impact assessment and emergency assistance to affected communities and preserve the integrity of their property and assets [1]. For example, using remote sensing imagery to expeditiously assess agricultural damage can provide a more granular and nuanced understanding of the disaster situation, locate field assessments in hotspots, and detect potential changes in yields. In addition, emergency response efforts for agriculture also include providing resources, such as food, seeds, fertilizers, and tools, to safeguard post-disaster agricultural livelihoods.
- (4)
- Disaster recovery and reconstruction
The disaster recovery stage aims to rebuild and restore normal agricultural operations by rehabilitating and reconstructing physical, economic, and social assets. The primary objective of this phase is to mitigate the impacts of the disaster by restoring damaged infrastructure and agricultural production. Key activities include assessing and quantifying agricultural losses, as well as implementing longer-term post-disaster measures, such as rehabilitation or reconstruction of disaster-resilient agricultural infrastructure (e.g., drainage and irrigation systems).
4.2. Disaster SDI
The proliferation of remote sensing systems and the innovation of remarkable AI algorithms has extremely improved the indicator recipes for disaster response. However, disasters, such as droughts and floods, still inflict unprecedented socio-economic consequences. A critical gap is that these systems are not seamlessly connected as parts of a common SDI.
A SDI can be described as a network of interconnected technologies, policies, and institutional arrangements designed to facilitate the discovery, sharing, access, and use of geospatial information. Specifically, a disaster SDI is designed to access and share disaster-related data, information, and knowledge in a standardized manner, and it enables decision-makers, field responders, and the affected public to make informed decisions and to take effective actions to enhance disaster resilience. The OGC is actively promoting the development of disaster SDI, which brings together the disaster SDI puzzle pieces that facilitate the right information to the right person at the right time, forming a pattern that can adapt to any disaster or region. The OGC Disaster Pilot 2021 Engineering Report demonstrated the value chain of a disaster SDI, and it also highlighted the role of the Analysis Ready Data (ARD) [201] and Decision Ready Information (DRI) in that context [202]. The disaster ARD is characterized by the state of readiness, or near-readiness, of any dataset to be transformed and integrated into applications across diverse domains.
Achieving interoperability in the field of agricultural disaster resilience is a complex task, as it requires the integration of multiple technologies. In order to effectively respond to disasters and to mitigate their impacts, it is necessary to have a system in place that allows for seamless communication and collaboration between various stakeholders (e.g., farmers, governments, non-profit organizations, and research institutions). Several efforts have been made to promote the development of SDI with the use of geospatial data in a range of fields, including disaster management. The FGDC has played a major role in supporting the Global Spatial Data Infrastructure (GSDI) Association. Through the GeoPlatform initiative, FGDC has provided a centralized platform to publish, share, and assess the authoritative geospatial data and services across different levels of communities (e.g., federal, state, local, tribal) [203,204]. Additionally, studies have explored the application of disaster SDI [205,206,207,208,209].
4.3. Existing Research on Agricultural Disaster Services and Systems
To facilitate the efficient delivery of disaster ready indicators to relevant stakeholders, it is crucial to develop reliable systems and tools for easily accessing and directing visualizing. Prior efforts on cyberinfrastructure and SDI have been proven efficient in enhancing data products’ dissemination. In this regard, we reviewed the existing literature on agricultural disaster services and systems, with a special focus on interoperability, to further scrutinize the challenges of geospatial data exchange and information sharing in disaster responses.
Efforts have been made to provide interoperable data services for cropland and vegetation [210,211]. For example, the Global Information and Early Warning System on Food and Agriculture (GIEWS), administered by FAO, disseminates the major food crop condition data at the global scale (e.g., NDVI anomaly, VCI, VHI, Drought Intensity, and Agricultural Stress Index) [212]. GEO and the University of Maryland developed the Global Agricultural Monitoring (GEOGLAM) Crop Monitor for Early Warning, which provides global agro-climatic condition data services for seven major crops (maize, rice, wheat, beans, cassava, millet, sorghum, teff, and groundnut) in 49 producer countries [213,214]. The Anomaly Hot Spots of Agricultural Production (ASAP), launched by the European Commission, serves as an online early warning system to identify hotspots of agricultural production anomaly [215]. ASAP provides the SPI, NDVI, and NDVI anomalies cumulated over the growing season. CropScape is a web service-based system for CONUS cropland data dissemination, managed by the USDA and George Mason University [216,217,218]. CropScape provides the annual CDL data and a series of tools for on-demand data downloading, map customization, and statistical analysis. Several efforts have been made to validate and to refine the CDL on CropScape by using ML methods [219,220]. VegScape is a web service-based system for monitoring vegetation condition cover CONUS, and VegScape provides NRT vegetation index data products, such as NDVI, VCI, and Mean-referenced Vegetation Condition Index (MVCI) [221]. Crop-CASMA is a data service application system that facilitates the retrieval, analysis, and sharing of soil moisture data for the CONUS [222,223]. CropWatch is a global crop monitoring system that determines key crop production indicators, such as crop acreage, crop condition, crop production, cropping intensity, and crop planting proportion [224].
Several well known drought information systems worldwide have been established to provide meteorological and agricultural drought indicators. Examples include the Global Drought Information System (GDIS) [225], Global Integrated Drought Monitoring and Prediction System (GIDMaPS) [226], US Drought Monitor (USDM) [227], European Drought Observatory (EDO) [228], and African Flood and Drought Monitor (AFDM) [229]. Table 1 displays a series of global and regional drought indicators provided by the aforementioned systems. In addition, Sun et al. introduced the Global Agricultural Drought Monitoring and Forecasting System (GADMFS), which provided a cyberinfrastructure framework for vegetation drought monitoring, with the indicators derived from satellite-based datasets by using OGC WMS, and WCS [230,231]. Yan et al. implemented an operational drought monitoring system for China, which supports the statistical analysis based on VCI, TCI, and VHI [232]. Peng et al. demonstrated the advantages of web services in delivering on-demand agricultural drought analysis [233].
Furthermore, several studies have proposed flood monitoring systems to enhance prediction and response capabilities. For instance, The Oak Ridge National Laboratory proposed a HPC-powered cyberinfrastructure that adopts machine learning methods for timely and high-resolution hydrometeorological predictions [234]. Di et al. developed an EO-based flood crop loss assessment cyber-service system, RF-CLASS, for supporting flood-related crop statistics and insurance decision-making. The system is implemented with interoperable specifications to facilitate automatic data fetching from NASA EO data systems [161,235]. Zhang et al. proposed an approach to enable interoperable model sharing on the web by coupling OGC Open Modelling Interface (OpenMI) and Web Processing Service (WPS). The TOPMODEL and SWMM5 services are implemented as the use cases [236,237]. Similarly, Qiu et al. developed a flood disaster management system (FDMS) by leveraging OpenMI standard, and the system provides disaster reduction capabilities that cover the entire workflow, including rainfall monitoring, hydrological simulation, runoff prediction, risk assessment, inundation simulation, inundation extraction, and loss assessment. The authors also used an ontology-based approach to automatically link flood models with appropriate datasets as inputs [238]. Zhai et al. proposed a Sensor Web and web service-based framework to support active flood disaster monitoring [239]. Yang et al. developed an observation task chain representation model that describes an eight-tuple observation task, as well as the sensor planning service of remote sensing satellites on a flood monitoring use case [240]. Demir et al. provided an overview of the Iowa Flood Information System (IFIS), which was designed as a generalized flood cyberinfrastructure [241].
Exploring the geospatial big data computational technologies (e.g., Google Earth Engine (GEE) [242] and Geospatial Data Cube (GDC)) for managing and analyzing large-scale datasets has become a research focus [243,244,245]. GEE has been used for in-season crop type identification and cropland extent mapping, with different emphases on automation workflow [220,246], specific crop type [247,248], and regional application [249,250]. Zhang et al. proposed an add-on toolkit for GEE, which derive CDL-based data products and simplify on-demand agricultural land use modeling [251]. Additionally, Li and Demir proposed a U-Net-based method to extract flood extent by utilizing GEE and SAR imagery [252]. Scheip and Wegmann developed a global open-access hazard mapping application base on GEE—HazMapper, which identifies the impacted vegetation areas from a natural disaster based on the relative difference in NDVI [253]. Khan and Gilani proposed a global scale drought severity index (DSI), and they used GEE for global drought mapping and monitoring from 2001 to 2019 [254,255]. Liu et al. developed a rapid extraction method for monitoring agricultural disasters at the regional scale, and they used MODIS vegetation index products from the period 2005–2019 based on GEE [256]. Furthermore, researchers have established the methodology of using GDC and ML models for agriculture monitoring [257], determining the decrease extent of cropped area [258], generating value-added products in rapid disaster mapping [259], and supporting flood disaster recovery [260].

Table 1.
Summary of typical studies of agricultural disaster services and systems.
| System | Functionality | Data | Region | Standard |
|---|---|---|---|---|
| GEOGLAM [213] | Provide reliable information on early warning and crop conditions | Synthesis of crop condition map, season-specific map | Globe | / |
| GIEWS [212] | Disseminate the major food crop condition data at the global scale | NDVI Anomaly, VCI, VHI, ASI, and precipitation | Globe | / |
| CropScape [218] | Explore and disseminate geospatial cropland data products for decision support | CDL, crop frequency | CONUS | WMS, WFS, WCS, WPS |
| VegScape [221] | US vegetation condition monitoring | NDVI, VCI, MVCI, RMVCI, and RVCI | CONUS | WMS, WCS, WFS |
| GDIS [225] | Drought monitoring, forecasting, impacts, history, research, and education | NADM (North American), CDI (European), DI, SPI, SPEI, EDDI, VHI, ESI, and GRACE-based soil moisture (surface and rootzone) | Globe | / |
| GIDMaPS [226] | Near-real-time drought indicators for monitoring and prediction | SPI, SSI, and MSDI | Globe | / |
| U.S. Drought Monitor [227] | Weekly US drought map with five classifications | USDM, DSCI | CONUS | / |
| EDO [228] | Drought-relevant maps of indicators derived from precipitation, satellite, and modelled soil moisture measurement | CDI, SPI, SMI, PDSI, DI, fAPAR, Low-Flow Index, Daily temperature, and Fire Danger | Europe | WMS |
| AFDM [229] | Drought information for the current date and the past one month | Soil Moisture Index | Africa | / |
| GADMFS [231] | Cyberinfrastructure framework for vegetation drought monitoring and forecasting | NDVI, VCI, and VHI | Globe | WMS, WFS, WCS, WPS |
| RFCLASS [235] | EO-based flood crop loss assessment for supporting flood-related crop statistics and insurance decision-making | VCI, MVCI, and DVDI | CONUS | WMS, WFS, WCS |
| Crop-CASMA [223] | Soil moisture data analysis, visualization, and sharing | SMAP-based soil moisture (surface and rootzone) | CONUS | WMS, WFS, WCS, WPS |
| GeoPlatform [204] | Publish, share, and assess the authoritative geospatial data and services across different levels of communities | Flood extent, flood depth grids, ESI, fire heat extent, and hurricane lane | CONUS | OpenAPI, STAC, ISO 19139 |
| FDMS [238] | Rainfall monitoring, hydrological simulation, runoff prediction, risk assessment, inundation extraction, and loss assessment | NDWI, flood extent, and runoff | China | WMS, WFS, OpenMI |
| GeoDR [208] | Rapid awareness, information extraction, impact assessment, and decision recommendation for disaster emergency response | NDWI, flood extent | China | WMS, WPS |
Some of the readily accessible data/products were listed, while its derived data were not included here. “NDVI—Normalized Difference Vegetation Index; VCI—Vegetation Condition Index; VHI—Vegetation Health Index; ASI—Agricultural Stress Index; MVCI—Mean-referenced Vegetation Condition Index; RMVCI—Ratio to Median Vegetation Condition Index; RVCI—Ratio to previous-year Vegetation Condition Index; GPCC—Global Precipitation Climatology Centre; NADM—North American Drought Monitor; CDI—Combined Drought Indicator; DI—Global Drought Index; SPI—Standardized Precipitation Index; SPEI—Standardized Precipitation Evapotranspiration Index; EDDI—Evaporative Demand Drought Index; ESI = Evaporative Stress Index; SSI—Standardized Soil Moisture Index; SMI—Soil Moisture Index; MSDI—Multivariate Standardized Drought Index; DSCI—Drought Severity and Coverage Index; USDM—Percent Area in U.S. Drought Monitor Categories; fAPAR—Fraction of Absorbed Photosynthetically Active Radiation; WMS—Web Map Service; WCS—Web Coverage Service; WFS—Web Feature Service; WPS—Web Processing Service; OpenMI—Open Modelling Interface; STAC—SpatioTemporal Asset Catalog”.
5. FAIR Agricultural Disaster Services—Challenges and Opportunities
In the new era of data-driven agricultural disaster resilience, the development of innovative platforms and services can enable efficient geoscientific data utilization and foster deep learning. As the use of geospatial information and technologies continues to expand, it becomes increasingly imperative to adopt standards-based approaches in disaster response efforts. To facilitate the delivery from ARD to DRI, a lucid value-enhancement pipeline has been identified by the communities. As delineated in Figure 4, this section highlights some major challenges and the way forward from the FAIR perspective.
5.1. Data Discovery and Access
With the emergence of new agricultural data platforms and geoprocessing functionalities, data discovery remains a challenge. A major hurdle is the lack of standardized metadata, which hinders users from efficiently accessing and discovering datasets and services. For instance, when users endeavor to search for all the available imagery in a particular area, they need to sift through diverse sites from multiple providers, and each imagery catalog exhibits a slightly different way of representing its data, thereby complicating the discovery process. Currently, limited catalogs provide comprehensive and up-to-date information on geospatial datasets related to agricultural disasters. To tackle this challenge, developing metadata profiles and catalog services based on the existing efforts and standards, such as OGC API—Records [261] and SpatioTemporal Asset Catalog (STAC) [262], are promising solutions. STAC aims to develop a common language for searching imagery, as well as a catalog approach. STAC can complement Cloud Optimized Geotiff (COG) [263] with additional metadata, thereby formalizing the modern paradigm of accessing data through the Cloud. Moreover, data access needs to consider all possible output data type structures (e.g., feature, coverage, multi-dimensional dataset, or data cube), as well as the query parameters for pre-filtering. The new series of OGC APIs for data access and retrieval, such as the OGC API—Environmental Data Retrieval (EDR) [264] and Data Access and Processing API (DAPA) [265], can provide lightweight interfaces to access the complex agro-disaster resources.
5.2. Analysis Ready Data
Analysis ready data are key components in making the geospatial data FAIR. Preparing interdisciplinary resources, such as remote sensing data for analysis readiness, can be time-consuming and resource-intensive, especially in the aftermath of a disaster. ARD can streamline this process by providing users with pre-processed and formatted data, in advance for reusability across a broad range of disaster analytical tasks [266]. Moreover, ARD can be integrated into a Geospatial Data Cube, which enables EO data with large-scale analysis. Previous studies have demonstrated that GDC emphasizes the datasets having a common definition of orthogonal space, time, and phenomenon axes, which is promising for aligning multi-source data with different spatial and temporal resolutions [243]. A good example would be combining the drought observations or predictions made at different resolutions to provide a comprehensive perspective. However, there are still a number of challenges for researcher to dig through, such as defining ARD for vector and tabular data, as well as establishing an interoperable GDC metadata model and API that support the handling of various GDCs [267,268].
5.3. Data and Harmonization
Understanding the evolution and history of specific disasters is key to predicting and assessing future occurrences [269]. To provide timely support for decision-making on agricultural disaster risk management and emergency response, it is essential to enhance efforts to integrate earth observation, crop growth, climate modeling, hydrological simulation, and machine learning. The production of DRI requires the integration of models, datasets, and analytical processes from different disciplines, such as agroecology, meteorology, hydrology, and geology. Given the vast amount of long-term spatial and temporal data resources, what data exchange formats need to be supported at the various interfaces? Zarr is a sophisticated format, originating from the ocean science community, and it has been gaining popularity for storing multidimensional array data on the Cloud [270]. The Zarr library has also been used to optimize access to HDF5 and NetCDF4 formats within Cloud environments [271]. Moreover, COG has emerged as a fundamental format for storing geospatial raster data on the Cloud-based systems. COG enables web clients to request a specific piece of an image, instead of necessitating access the entire image. Moreover, how should one harmonize differences and uncertainties to facilitate scientific discoveries and predictions? A possible direction is to leverage the modeling frameworks and interfaces, such as OpenMI standard, which is widely used to couple diverse models and runtime data exchange through well-defined interfaces. Extending and improving such frameworks can support models that involve multiple simulation phases and time-step computations (e.g., hydrological model) [237], further enhancing the interaction among various agricultural disaster-related models in a distributed environment.
5.4. Data Processing
The agro-disaster data have grown significantly in terms of quantity, diversity, and complexity, which severely restricts the improvement of emergency response capabilities. This data heterogeneity challenge can be bridged with data semantics and a knowledge graph, which is essential for ensuring value-enhancement data processing. For example, during a flash flood emergency response, a powerful value-added service chain needs to be integrated from various atom service functions. The traditional process-oriented construction method is too rigid to adapt to the flexible characteristics of remote sensing data processing. To address the complex relationships among various entities in the disaster domain, such as the evolution of disaster events, the correlation of spatiotemporal data, and the integration of model services, it is essential to delineate the interconnections between events, tasks, data, models, and services, thereby forming a comprehensive disaster knowledge graph. This approach can further promote the construction of a knowledge-driven processing service chain. Moreover, all disaster recipes and knowledge resources can combine together as a knowledge package, which substantially support reproducible EO science [272,273].
Machine learning and AI-based methods play an increasing role in the context of agricultural disaster applications. To facilitate the value-added processing pipeline, it is crucial to describe the ML models and corresponding training data in a proper manner. One of the top priorities for efficient ML algorithms is the availability of high-quality training datasets. However, the limited interoperability and discoverability of training datasets have become a significant bottleneck in ML-based EO applications. To address this issue, a rising new standard from OGC is the Training Data Markup Language for Artificial Intelligence (TrainingDML-AI) [274], which focuses on developing the model and encodings for geospatial ML training data, providing the potential for an AI-ready data exchange format. Furthermore, another challenge is the full-stack ML workflow, which means linking all the preprocessing, training and testing, and post-processing steps into an automated pipeline [275]. For example, this involves deploying ML models with OGC API—processes that enhance agricultural disaster services and which involve how to ingest training models and to develop extensions for the special production phases of ML.
5.5. Data Quality
Data quality is a broad concept that may refer to data accuracy, completeness, timeliness, relevance, consistency, provenance, and fit-for-purpose. To enhance the utilization of geospatial information in agricultural disaster resilience efforts, it is important to highlight the challenge posed by data quality. Agriculture may require higher resolution imagery compared to other sectors, especially when smallholder farming systems are affected. Ground truthing is essential and necessary at different stages to assess the immediate and longer-term cropland impacts of a disaster. To ensure data quality, remote sensing analyses must be in conjunction with ground truthing activities, such as on-site measurements, agricultural surveys, administrative data, and stakeholder questionnaires. However, collection and sharing of ground truthing still poses challenges, both in terms of improving the quality of on-the-ground observation and enhancing the effectiveness of RS approaches. In addition, data provenance can play a critical role in promoting data quality. Data provenance can help detect and correct errors that may arise during data collection, processing, or analysis. By providing transparency and accountability in the data creation and management process, data provenance can ensure that the data are accurate, reliable, and trustworthy. In this regard, long-term support is necessary to achieve full traceability from high-level data products back to the original raw data.
6. Conclusions
On our planet, 2.6 billion people draw their livelihoods mostly from agriculture. Natural hazards and disasters disproportionately affect the small-scale farmers, fishers, and forest-dependent communities who produce over half of the world’s agricultural production. Focusing on applications to agricultural disasters, this paper overviews the cutting-edge research and progress of geospatial data science, and it seeks to address four key questions. (1) Who are the major players worldwide, and what notable projects could researchers follow? (2) What are the most impactful disaster types on agriculture? How can earth-observing remote sensing technologies help build the recipe for agricultural disaster indicators? (3) How can GIS and SDI help enhance FAIR agricultural disaster services and systems? (4) What are the current challenges and the way forward? By answering these questions, this review highlights the state-of-the-art technologies that have been used in various stages of the disaster lifecycle, along with the obstacles. One limitation of this review is that it predominantly concentrates on research conducted within the last five years. This duration has been chosen to focus on the most recent and advanced technologies for this topic. Another one is that we have selected the most impactful agricultural disaster types as case studies to avoid the paper overly being lengthy. The research and development of agricultural disaster SDI and FAIR services remain in their infancy, and the grand challenges ranging from analysis-ready data to innovative AI models to decision-ready services derive numerous opportunities for government, academia, and industry. Ongoing efforts to explore, implement, and adapt these new opportunities to disaster risk reduction in agriculture, as well as post-disaster rehabilitation, are sparking innovation today, and they will continue to do so for the foreseeable future.
Author Contributions
Conceptualization, L.H.; investigation, L.H. and Z.F.; resources, M.Z. and L.H.; writing—original draft preparation, L.H.; writing—review and editing, Y.S. and J.L.; coordinated and contributed to the edits of all the sections, L.H., C.Z. and M.Z.; funding acquisition, L.H. and M.Z. All authors have read and agreed to the published version of the manuscript.
Funding
This research was funded by the National Natural Science Foundation of China under Grant No.42001330.
Data Availability Statement
Not applicable.
Acknowledgments
The authors take this opportunity to thank the members of the editorial board and anonymous reviewers for their insightful comments and suggestions. Additionally, great thanks are given to all the colleagues in OGC Disaster Pilot who have generously provided their valuable inspiration and advice throughout the writing process of this paper.
Conflicts of Interest
The authors declare no conflict of interest.
Abbreviations
This table lists all the abbreviations and acronyms used in this paper.
| AAFC | Agriculture and Agri-Food Canada |
| AGDAM | Agriculture Flood Damage Analysis |
| ANN | Artificial Neural Network |
| APSIM | Agricultural Production Systems sIMulator |
| ARCT | African Regional Centre for Technology |
| ARD | Analysis Ready Data |
| ASAP | Anomaly Hot Spots of Agricultural Production |
| ASI | Agricultural Stress Index |
| AVHRR | Advanced Very High Resolution Radiometer |
| BRT | Boosted Regression Trees |
| CDI | Combined Drought Indicator |
| CDL | Cropland Data Layer |
| CGIAR | Consultative Group on International Agricultural Research |
| CODATA | Committee on Data of the International Science Council |
| CONUS | Contiguous United States |
| COSI | Collaborative Solutions and Innovation Program |
| DAPA | Data Access and Processing API |
| DCNN | Deep Convolutional Neural Network |
| DEFRA | Department for Environment, Food and Rural Affairs |
| DFNN | Deep Forwarded Neural Network |
| DG AGRI | Directorate-General for Agriculture and Rural Development |
| DFO | Dartmouth Flood Observatory |
| DRR | Disaster Risk Reduction |
| DRI | Decision Ready Information |
| DWG | Domain Working Group |
| EAFRD | European Agricultural Fund for Rural Development |
| EDDI | Evaporative Demand Drought Index |
| EDR | Environmental Data Retrieval |
| EO | Earth Observation |
| EPA | Environmental Protection Agency |
| ESA | European Space Agency |
| ESCAP | Economic and Social Commission for Asia and the Pacific |
| ESI | Evaporative Stress Index |
| EVI | Enhanced Vegetation Index |
| FAIR | Findable, Accessible, Interoperable, and Reusable |
| FAO | Food and Agriculture Organization |
| FEMA | Federal Emergency Management Agency |
| FGDC | Federal Geographic Data Committee |
| fAPAR | Fraction of Absorbed Photosynthetically Active Radiation |
| FSA | Farm Service Agency |
| GADAS | Global Agricultural & Disaster Assessment System |
| GADMFS | Global Agricultural Drought Monitoring and Forecasting System |
| GDC | Geospatial Data Cube |
| GDO | Global Drought Observatory |
| GDIS | Global Drought Information System |
| GEE | Google Earth Engine |
| GEO | Group on Earth Observations |
| GEOSS | Global Earth Observation System of Systems |
| GIDMaPS | Global Integrated Drought Monitoring and Prediction System |
| GIEWS | Global Information and Early Warning System on Food and Agriculture |
| GLAM | Global Agriculture Monitoring |
| GloFAS | Global Flood Awareness System |
| GPCC | Global Precipitation Climatology Centre |
| GPP | Gross Primary Productivity |
| GSDI | Global Spatial Data Infrastructure |
| GWIS | Global Wildfire Information System |
| HAND | Height Above the Nearest Drainage |
| HSMDI | High Resolution Soil Moisture Drought Index |
| IFAD | International Fund for Agricultural Development |
| IPCC | Intergovernmental Panel on Climate Change |
| ISO | International Organization for Standardization |
| LST | Land Surface Temperature |
| MODIS | Moderate Resolution Imaging Spectroradiometer |
| MSDI | Multivariate Standardized Drought Index |
| MVCI | Mean-referenced Vegetation Condition Index |
| NADM | North American Drought Monitor |
| NASA | National Aeronautics and Space Administration |
| NASS | National Agricultural Statistics Service |
| NDMC | National Drought Mitigation Center |
| NDVI | Normalized Difference Vegetation Index |
| NDWI | Normalized Difference Water Index |
| NGA | National Geospatial-Intelligence Agency |
| NGP | National Geospatial Program |
| NOAA | National Oceanic and Atmospheric |
| NDRCC | National Disaster Reduction Center of China |
| NRCan | Natural Resources Canada |
| NSDI | National Spatial Data Infrastructure |
| NWS | National Weather Service |
| OGC | Open Geospatial Consortium |
| OpenMI | Open Modelling Interface |
| PADI | Process-based Accumulated Drought Index |
| PCI | Precipitation Condition Index |
| PDSI | Palmer Drought Severity Index |
| RDF | Resource Description Framework |
| RF | Random Forest |
| RFSM | Rapid Flood Spreading Model |
| RMA | Risk Management Agency |
| RMVCI | Ratio to Median Vegetation Condition Index |
| RVCI | Ratio to previous-year Vegetation Condition Index |
| SDI | Spatial Data Infrastructure |
| SMADI | Soil Moisture Agricultural Drought Index |
| SMAP | Soil Moisture Active Passive |
| SMCI | Soil Moisture Condition Index |
| SMI | Soil Moisture Index |
| SMOS | Soil Moisture and Ocean Salinity |
| SPEI | Standardized Precipitation Evapotranspiration Index |
| SPI | Standardized Precipitation Index |
| SSI | Standardized Soil Moisture Index |
| STAC | SpatioTemporal Asset Catalog |
| SVR | Support Vector Regression |
| SVM | Support Vector Machines |
| SWAT | Soil & Water Assessment Tool |
| SWMM | Storm Water Management Model |
| TCI | Temperature Condition Index |
| TOPMODEL | TOPography based hydrological MODEL |
| TVDI | Temperature Vegetation Drought Index |
| TVMDI | Temperature-Vegetation-Soil Moisture Dryness Index |
| UNDP | United Nations Development Programme |
| UNDRR | United Nations Office for Disaster Risk Reduction |
| UNEP | United Nations Environment Programme |
| UNFCCC | United Nations Framework Convention on Climate Change |
| USDA | United States Department of Agriculture |
| USDM | United States Drought Monitor |
| USGS | United States Geological Survey |
| USAID | United States Agency for International Development |
| VCI | Vegetation Condition Index |
| VHI | Vegetation Health Index |
| WCS | Web Coverage Service |
| WFS | Web Feature Service |
| WMO | World Meteorological Organization |
| WMS | Web Map Service |
| WOFOST | WOrld FOod STudies |
| WPS | Web Processing Service |
References
- FAO. The Impact of Disasters and Crises on Agriculture and Food Security. 2021. Available online: http://www.fao.org/documents/card/en/c/cb3673en (accessed on 14 February 2023).
- OECD; Food and Agriculture Organization of the United Nations. Building Agricultural Resilience to Natural Hazard-Induced Disasters: Insights from Country Case Studies; OECD Publishing: Paris, France, 2021. [Google Scholar]
- USDA. Drought Recovery and Risk Management Resources. Available online: https://www.farmers.gov/protection-recovery/drought (accessed on 15 February 2023).
- Yue, P.; Ramachandran, R.; Baumann, P.; Khalsa, S.J.S.; Deng, M.; Jiang, L. Recent Activities in Earth Data Science. IEEE Geosci. Remote Sens. Mag. 2016, 4, 84–89. [Google Scholar] [CrossRef]
- OGC. Standards. Available online: https://www.ogc.org/standards/ (accessed on 18 February 2023).
- United Nations. Sustainable Development Goals Report. 2022. Available online: https://unstats.un.org/sdgs/report/2022/ (accessed on 12 March 2023).
- UN System. Available online: https://www.un.org/en/about-us/un-system (accessed on 13 February 2023).
- United Nations. Sendai Framework for Disaster Risk Reduction 2015–2030. Available online: https://www.undrr.org/publication/sendai-framework-disaster-risk-reduction-2015-2030 (accessed on 13 February 2023).
- United Nations Development Programme. The Drought Initiative. Available online: https://www.undp.org/policy-centre/nairobi/resilience-building-support (accessed on 13 February 2023).
- United Nations Environment Programme. Disaster Risk Reduction. Available online: http://www.unep.org/explore-topics/disasters-conflicts/what-we-do/risk-reduction (accessed on 14 February 2023).
- United Nations Framework Convention on Climate Change. Available online: https://unfccc.int/ (accessed on 14 February 2023).
- IFAD Strategic Framework. Available online: https://www.ifad.org/en/strategic-framework (accessed on 14 February 2023).
- Food and Agriculture Organization of the United Nations. Geospatial Information for Sustainable Food Systems. Available online: https://www.fao.org/geospatial/projects/en/ (accessed on 14 February 2023).
- FAO. The Impact of Natural Hazards and Disasters on Agriculture and Food Security and Nutrition: A Call for Action to Build Resilient Livelihoods. Available online: https://www.fao.org/3/i4434e/i4434e.pdf (accessed on 14 February 2023).
- FAO. The Impact of Disasters and Crises on Agriculture and Food Security. 2017. Available online: https://www.fao.org/3/i8656en/i8656en.pdf (accessed on 14 February 2023).
- Building Agricultural Resilience to Natural Disasters. GCP/GLO/986/ITA. Available online: https://www.fao.org/publications/card/en/c/CB8758EN/ (accessed on 14 February 2023).
- IPCC—Intergovernmental Panel on Climate Change. Available online: https://www.ipcc.ch/ (accessed on 13 February 2023).
- GEO—Earth Observation for Disaster Risk Reduction. Available online: https://www.earthobservations.org/area.php?a=dr (accessed on 17 February 2023).
- GEOGLAM Crop Monitor. Available online: https://cropmonitor.org/ (accessed on 21 February 2023).
- GEOSS Portal. Available online: https://www.geoportal.org/?m:activeLayerTileId=osm&f:dataSource=dab (accessed on 17 February 2023).
- World Bank. Climate-Smart Agriculture. Available online: https://www.worldbank.org/en/topic/climate-smart-agriculture (accessed on 14 February 2023).
- European Agricultural Fund for Rural Development (EAFRD). Available online: https://commission.europa.eu/funding-tenders/find-funding/eu-funding-programmes/european-agricultural-fund-rural-development-eafrd_en (accessed on 17 February 2023).
- European Regional Development Fund (ERDF). Available online: https://commission.europa.eu/funding-tenders/find-funding/eu-funding-programmes/european-regional-development-fund-erdf_en (accessed on 17 February 2023).
- Copernicus Emergency Management Service. Available online: https://emergency.copernicus.eu/ (accessed on 17 February 2023).
- ESCAP. Asia Pacific Risk & Resilience Portal. Available online: https://rrp.unescap.org/ (accessed on 17 February 2023).
- ESCAP. Building Resilience to Disasters: Reports. Available online: https://www.unescap.org/taxonomy/term/868 (accessed on 17 February 2023).
- APN. Risk and Resilience. Available online: https://www.apn-gcr.org/themes/risk-and-resilience/ (accessed on 19 February 2023).
- ADPC. Reducing Disaster Risks Amidst the COVID-19 Pandemic. Available online: https://www.adpc.net/igo/category/ID1710/doc/2021-p73Wo0-ADPC-Annual_Report_2020_ADPC.pdf (accessed on 19 February 2023).
- CGIAR. Initiative Explorer. Available online: https://www.cgiar.org/research/cgiar-portfolio/initiatives-explorer/ (accessed on 17 February 2023).
- USDA National Agricultural Statistics Service (NASS). Research and Science. Available online: https://www.nass.usda.gov/Research_and_Science/ (accessed on 17 February 2023).
- USDA Farm Service Agency (FSA). Disaster Assistance Programs. Available online: https://fsa.usda.gov/programs-and-services/disaster-assistance-program/index (accessed on 17 February 2023).
- USDA Foreign Agricultural Service. Global Agricultural & Disaster Assessment System. Available online: https://geo.fas.usda.gov/GADAS/index.html (accessed on 4 April 2023).
- USDA RMA. Emergency Relief Program and Natural Disaster Resources. Available online: https://www.rma.usda.gov/en/News-Room/Continuing-Interest/Emergency-Relief-Program-and-Natural-Disaster-Resources (accessed on 17 February 2023).
- EPA. Natural Disasters. Available online: https://www.epa.gov/natural-disasters (accessed on 14 February 2023).
- NASA. Landsat Science. Available online: https://landsat.gsfc.nasa.gov/ (accessed on 18 February 2023).
- NASA Terra. The EOS Flagship. Available online: https://terra.nasa.gov/ (accessed on 18 February 2023).
- NASA Aqua. Earth-Observing Satellite Mission. Available online: https://aqua.nasa.gov/ (accessed on 18 February 2023).
- NASA MODIS. Available online: https://modis.gsfc.nasa.gov/ (accessed on 18 February 2023).
- NASA SMAP. Available online: https://smap.jpl.nasa.gov/ (accessed on 18 February 2023).
- NASA Global Precipitation Measurement Mission. Available online: https://gpm.nasa.gov/ (accessed on 18 February 2023).
- Sentinel Online—Missions. Available online: https://sentinels.copernicus.eu/web/sentinel/missions (accessed on 18 February 2023).
- ESA SMOS. Available online: https://earth.esa.int/eogateway/missions/smos (accessed on 18 February 2023).
- NOAA Geostationary Operational Environmental Satellites (GOES). Available online: https://www.ospo.noaa.gov/Operations/GOES/index.html (accessed on 18 February 2023).
- NOAA AVHRR. Available online: https://www.avl.class.noaa.gov/release/data_available/avhrr/index.htm (accessed on 18 February 2023).
- NOAA National Weather Service. Available online: https://www.weather.gov/ (accessed on 18 February 2023).
- USGS. National Geospatial Program. Available online: https://www.usgs.gov/programs/national-geospatial-program (accessed on 18 February 2023).
- USGS Vegetation Drought Response Index (VegDRI). Available online: https://www.usgs.gov/centers/eros/science/usgs-eros-archive-vegetation-monitoring-vegetation-drought-response-index (accessed on 24 March 2022).
- NASA Applied Sciences. Disaster Activations. Available online: http://appliedsciences.nasa.gov/what-we-do/disasters/disaster-activations (accessed on 24 March 2022).
- NASA Earth Science Disasters Program. Available online: https://www.nasa.gov/centers/ames/earthscience/nasa-earth-science-disasters-program (accessed on 24 March 2022).
- NOAA. Disaster Preparedness. Available online: https://response.restoration.noaa.gov/disaster-preparedness (accessed on 18 February 2023).
- NOAA & NIDIS. Agricultural Drought. Available online: https://www.drought.gov/topics/agriculture (accessed on 14 February 2023).
- National Drought Mitigation Center. U.S. Drought Monitor. Available online: https://droughtmonitor.unl.edu/ (accessed on 15 February 2023).
- Dartmouth Flood Observatory. Global Active Archive of Large Flood Events, 1985-Present. Available online: https://floodobservatory.colorado.edu/Archives/index.html (accessed on 14 February 2023).
- UK.gov. Flood and Coastal Resilience Innovation Fund. Available online: https://www.gov.uk/guidance/flood-and-coastal-resilience-innovation-programme (accessed on 18 February 2023).
- UK.gov. Countryside Stewardship. Available online: https://www.gov.uk/environment/countryside-stewardship (accessed on 18 February 2023).
- NDRCC. Sharing and Learning on Community Based Disaster Management in Asia Programme (CBDM Asia). Available online: https://en.ndrcc.org.cn/jzsqxm/index.jhtml (accessed on 18 February 2023).
- OGC. Domain Working Groups. Available online: https://www.ogc.org/about/committees/dwg/ (accessed on 18 February 2023).
- OGC. Active Initiatives. Available online: https://www.ogc.org/innovation/active/ (accessed on 18 February 2023).
- ISO 31000—Risk Management. Available online: https://www.iso.org/iso-31000-risk-management.html (accessed on 18 February 2023).
- ISO 22320:2018—Security and Resilience—Emergency Management — Guidelines for Incident Management. Available online: https://www.iso.org/standard/67851.html (accessed on 18 February 2023).
- ISO 22322:2022—Security and Resilience—Emergency Management—Guidelines for Public Warning. Available online: https://www.iso.org/standard/84558.html (accessed on 18 February 2023).
- ISO 22000—Food Safety Management. Available online: https://www.iso.org/iso-22000-food-safety-management.html (accessed on 18 February 2023).
- ISO 19115-1:2014—Geographic Information—Metadata—Part 1: Fundamentals. Available online: https://www.iso.org/standard/53798.html (accessed on 18 February 2023).
- ISO 19118:2011—Geographic Information—Encoding. Available online: https://www.iso.org/standard/44212.html (accessed on 18 February 2023).
- ISO 19157:2013—Geographic Information—Data Quality. Available online: https://www.iso.org/standard/32575.html (accessed on 18 February 2023).
- ISO 19119:2016—Geographic Information—Services. Available online: https://www.iso.org/standard/59221.html (accessed on 18 February 2023).
- FGDC. National Spatial Data Infrastructure Strategic Plan 2021–2024. Available online: https://www.fgdc.gov/nsdi-plan (accessed on 18 February 2023).
- W3C Spatial Data on the Web Working Group. Available online: https://www.w3.org/2021/sdw/ (accessed on 18 February 2023).
- CODATA Initiatives. Available online: https://codata.org/initiatives/ (accessed on 14 February 2023).
- Liu, X.; Zhu, X.; Pan, Y.; Li, S.; Liu, Y.; Ma, Y. Agricultural Drought Monitoring: Progress, Challenges, and Prospects. J. Geogr. Sci. 2016, 26, 750–767. [Google Scholar] [CrossRef] [Green Version]
- AghaKouchak, A.; Farahmand, A.; Melton, F.S.; Teixeira, J.; Anderson, M.C.; Wardlow, B.D.; Hain, C.R. Remote Sensing of Drought: Progress, Challenges and Opportunities. Rev. Geophys. 2015, 53, 452–480. [Google Scholar] [CrossRef] [Green Version]
- NDMC. Types of Drought. Available online: https://drought.unl.edu/Education/DroughtIn-depth/TypesofDrought.aspx (accessed on 21 February 2023).
- West, H.; Quinn, N.; Horswell, M. Remote Sensing for Drought Monitoring & Impact Assessment: Progress, Past Challenges and Future Opportunities. Remote Sens. Environ. 2019, 232, 111291. [Google Scholar]
- Tucker, C.J. Red and Photographic Infrared Linear Combinations for Monitoring Vegetation. Remote Sens. Environ. 1979, 8, 127–150. [Google Scholar] [CrossRef] [Green Version]
- Gutman, G.G. Vegetation Indices from AVHRR: An Update and Future Prospects. Remote Sens. Environ. 1991, 35, 121–136. [Google Scholar] [CrossRef]
- Krofcheck, D.J.; Eitel, J.U.H.; Vierling, L.A.; Schulthess, U.; Hilton, T.M.; Dettweiler-Robinson, E.; Pendleton, R.; Litvak, M.E. Detecting Mortality Induced Structural and Functional Changes in a Piñon-Juniper Woodland Using Landsat and RapidEye Time Series. Remote Sens. Environ. 2014, 151, 102–113. [Google Scholar] [CrossRef]
- Lu, J.; Carbone, G.J.; Gao, P. Mapping the Agricultural Drought Based on the Long-Term AVHRR NDVI and North American Regional Reanalysis (NARR) in the United States, 1981–2013. Appl. Geogr. 2019, 104, 10–20. [Google Scholar] [CrossRef]
- Shahriar Pervez, M.; Budde, M.; Rowland, J. Mapping Irrigated Areas in Afghanistan over the Past Decade Using MODIS NDVI. Remote Sens. Environ. 2014, 149, 155–165. [Google Scholar] [CrossRef] [Green Version]
- West, H.; Quinn, N.; Horswell, M.; White, P. Assessing Vegetation Response to Soil Moisture Fluctuation under Extreme Drought Using Sentinel-2. Water 2018, 10, 838. [Google Scholar] [CrossRef] [Green Version]
- Zribi, M.; Dridi, G.; Amri, R.; Lili-Chabaane, Z. Analysis of the Effects of Drought on Vegetation Cover in a Mediterranean Region through the Use of SPOT-VGT and TERRA-MODIS Long Time Series. Remote Sens. 2016, 8, 992. [Google Scholar] [CrossRef] [Green Version]
- Mu, Q.; Zhao, M.; Kimball, J.S.; McDowell, N.G.; Running, S.W. A Remotely Sensed Global Terrestrial Drought Severity Index. Bull. Am. Meteorol. Soc. 2013, 94, 83–98. [Google Scholar] [CrossRef] [Green Version]
- Sayago, S.; Ovando, G.; Bocco, M. Landsat Images and Crop Model for Evaluating Water Stress of Rainfed Soybean. Remote Sens. Environ. 2017, 198, 30–39. [Google Scholar] [CrossRef]
- Kogan, F.N. Droughts of the Late 1980s in the United States as Derived from NOAA Polar-Orbiting Satellite Data. Bull. Am. Meteorol. Soc. 1995, 76, 655–668. [Google Scholar] [CrossRef]
- Kogan, F. World Droughts in the New Millennium from AVHRR-Based Vegetation Health Indices. Eos Trans. Am. Geophys. Union 2002, 83, 557–563. [Google Scholar] [CrossRef]
- Huete, A.; Didan, K.; Miura, T.; Rodriguez, E.P.; Gao, X.; Ferreira, L.G. Overview of the Radiometric and Biophysical Performance of the MODIS Vegetation Indices. Remote Sens. Environ. 2002, 83, 195–213. [Google Scholar] [CrossRef]
- Sandholt, I.; Rasmussen, K.; Andersen, J. A Simple Interpretation of the Surface Temperature/Vegetation Index Space for Assessment of Surface Moisture Status. Remote Sens. Environ. 2002, 79, 213–224. [Google Scholar] [CrossRef]
- Barrett, A.B.; Duivenvoorden, S.; Salakpi, E.E.; Muthoka, J.M.; Mwangi, J.; Oliver, S.; Rowhani, P. Forecasting Vegetation Condition for Drought Early Warning Systems in Pastoral Communities in Kenya. Remote Sens. Environ. 2020, 248, 111886. [Google Scholar] [CrossRef]
- Zhong, S.; Di, L.; Sun, Z.; Xu, Z.; Guo, L. Investigating the Long-Term Spatial and Temporal Characteristics of Vegetative Drought in the Contiguous United States. IEEE J. Sel. Top. Appl. Earth Obs. Remote Sens. 2019, 12, 836–848. [Google Scholar] [CrossRef]
- Wagle, P.; Xiao, X.; Torn, M.S.; Cook, D.R.; Matamala, R.; Fischer, M.L.; Jin, C.; Dong, J.; Biradar, C. Sensitivity of Vegetation Indices and Gross Primary Production of Tallgrass Prairie to Severe Drought. Remote Sens. Environ. 2014, 152, 1–14. [Google Scholar] [CrossRef]
- Doughty, R.; Xiao, X.; Wu, X.; Zhang, Y.; Bajgain, R.; Zhou, Y.; Qin, Y.; Zou, Z.; McCarthy, H.; Friedman, J.; et al. Responses of Gross Primary Production of Grasslands and Croplands under Drought, Pluvial, and Irrigation Conditions during 2010–2016, Oklahoma, USA. Agric. Water Manag. 2018, 204, 47–59. [Google Scholar] [CrossRef]
- Prabhakara, K.; Hively, W.D.; McCarty, G.W. Evaluating the Relationship between Biomass, Percent Groundcover and Remote Sensing Indices across Six Winter Cover Crop Fields in Maryland, United States. Int. J. Appl. Earth Obs. Geoinf. 2015, 39, 88–102. [Google Scholar] [CrossRef] [Green Version]
- Um, M.-J.; Kim, Y.; Park, D. Evaluation and Modification of the Drought Severity Index (DSI) in East Asia. Remote Sens. Environ. 2018, 209, 66–76. [Google Scholar] [CrossRef]
- Zhang, L.; Jiao, W.; Zhang, H.; Huang, C.; Tong, Q. Studying Drought Phenomena in the Continental United States in 2011 and 2012 Using Various Drought Indices. Remote Sens. Environ. 2017, 190, 96–106. [Google Scholar] [CrossRef]
- Wu, B.; Ma, Z.; Yan, N. Agricultural Drought Mitigating Indices Derived from the Changes in Drought Characteristics. Remote Sens. Environ. 2020, 244, 111813. [Google Scholar] [CrossRef]
- Dai, A.; Trenberth, K.E.; Qian, T. A Global Dataset of Palmer Drought Severity Index for 1870–2002: Relationship with Soil Moisture and Effects of Surface Warming. J. Hydrometeorol. 2004, 5, 1117–1130. [Google Scholar] [CrossRef] [Green Version]
- Eswar, R.; Das, N.N.; Poulsen, C.; Behrangi, A.; Swigart, J.; Svoboda, M.; Entekhabi, D.; Yueh, S.; Doorn, B.; Entin, J. SMAP Soil Moisture Change as an Indicator of Drought Conditions. Remote Sens. 2018, 10, 788. [Google Scholar]
- Mishra, A.; Vu, T.; Veettil, A.V.; Entekhabi, D. Drought Monitoring with Soil Moisture Active Passive (SMAP) Measurements. J. Hydrol. 2017, 552, 620–632. [Google Scholar] [CrossRef]
- Xu, L.; Abbaszadeh, P.; Moradkhani, H.; Chen, N.; Zhang, X. Continental Drought Monitoring Using Satellite Soil Moisture, Data Assimilation and an Integrated Drought Index. Remote Sens. Environ. 2020, 250, 112028. [Google Scholar] [CrossRef]
- Martínez-Fernández, J.; González-Zamora, A.; Sánchez, N.; Gumuzzio, A.; Herrero-Jiménez, C.M. Satellite Soil Moisture for Agricultural Drought Monitoring: Assessment of the SMOS Derived Soil Water Deficit Index. Remote Sens. Environ. 2016, 177, 277–286. [Google Scholar] [CrossRef]
- Zhang, A.; Jia, G. Monitoring Meteorological Drought in Semiarid Regions Using Multi-Sensor Microwave Remote Sensing Data. Remote Sens. Environ. 2013, 134, 12–23. [Google Scholar] [CrossRef]
- Sánchez, N.; González-Zamora, Á.; Piles, M.; Martínez-Fernández, J. A New Soil Moisture Agricultural Drought Index (SMADI) Integrating MODIS and SMOS Products: A Case of Study over the Iberian Peninsula. Remote Sens. 2016, 8, 287. [Google Scholar] [CrossRef] [Green Version]
- Sánchez, N.; González-Zamora, A.; Martínez-Fernández, J.; Piles, M.; Pablos, M.; Wardlow, B.; Tadesse, T.; Svoboda, M. Preliminary Assessment of an Integrated SMOS and MODIS Application for Global Agricultural Drought Monitoring. In Proceedings of the 2017 IEEE International Geoscience and Remote Sensing Symposium (IGARSS), Fort Worth, TX, USA, 23–28 July 2017. [Google Scholar]
- Park, S.; Im, J.; Park, S.; Rhee, J. Drought Monitoring Using High Resolution Soil Moisture through Multi-Sensor Satellite Data Fusion over the Korean Peninsula. Agric. For. Meteorol. 2017, 237–238, 257–269. [Google Scholar] [CrossRef]
- Shivers, S.W.; Roberts, D.A.; McFadden, J.P. Using Paired Thermal and Hyperspectral Aerial Imagery to Quantify Land Surface Temperature Variability and Assess Crop Stress within California Orchards. Remote Sens. Environ. 2019, 222, 215–231. [Google Scholar] [CrossRef]
- Qin, Q.; Wu, Z.; Zhang, T.; Sagan, V.; Zhang, Z.; Zhang, Y.; Zhang, C.; Ren, H.; Sun, Y.; Xu, W.; et al. Optical and Thermal Remote Sensing for Monitoring Agricultural Drought. Remote Sens. 2021, 13, 5092. [Google Scholar] [CrossRef]
- Sánchez, N.; González-Zamora, Á.; Martínez-Fernández, J.; Piles, M.; Pablos, M. Integrated Remote Sensing Approach to Global Agricultural Drought Monitoring. Agric. For. Meteorol. 2018, 259, 141–153. [Google Scholar] [CrossRef]
- Ghazaryan, G.; König, S.; Rezaei, E.E.; Siebert, S.; Dubovyk, O. Analysis of Drought Impact on Croplands from Global to Regional Scale: A Remote Sensing Approach. Remote Sens. 2020, 12, 4030. [Google Scholar] [CrossRef]
- Jiao, W.; Wang, L.; McCabe, M.F. Multi-Sensor Remote Sensing for Drought Characterization: Current Status, Opportunities and a Roadmap for the Future. Remote Sens. Environ. 2021, 256, 112313. [Google Scholar] [CrossRef]
- McKee, T.B.; Doesken, N.J.; Kleist, J. The Relationship of Drought Frequency and Duration to Time Scales. In Proceedings of the Eighth Conference on Applied Climatology, Anaheim, CA, USA, 17–22 January 1993. [Google Scholar]
- Brown, J.F.; Wardlow, B.D.; Tadesse, T.; Hayes, M.J.; Reed, B.C. The Vegetation Drought Response Index (VegDRI): A New Integrated Approach for Monitoring Drought Stress in Vegetation. GIScience Remote Sens. 2008, 45, 16–46. [Google Scholar] [CrossRef]
- Zhang, X.; Chen, N.; Li, J.; Chen, Z.; Niyogi, D. Multi-Sensor Integrated Framework and Index for Agricultural Drought Monitoring. Remote Sens. Environ. 2017, 188, 141–163. [Google Scholar] [CrossRef] [Green Version]
- Cao, Y.; Chen, S.; Wang, L.; Zhu, B.; Lu, T.; Yu, Y. An Agricultural Drought Index for Assessing Droughts Using a Water Balance Method: A Case Study in Jilin Province, Northeast China. Remote Sens. 2019, 11, 1066. [Google Scholar] [CrossRef] [Green Version]
- Vicente-Serrano, S.M.; Beguería, S.; López-Moreno, J.I. A Multiscalar Drought Index Sensitive to Global Warming: The Standardized Precipitation Evapotranspiration Index. J. Clim. 2010, 23, 1696–1718. [Google Scholar] [CrossRef] [Green Version]
- Bezdan, J.; Bezdan, A.; Blagojević, B.; Mesaroš, M.; Pejić, B.; Vranešević, M.; Pavić, D.; Nikolić-Đorić, E. SPEI-Based Approach to Agricultural Drought Monitoring in Vojvodina Region. Water 2019, 11, 1481. [Google Scholar] [CrossRef] [Green Version]
- Hao, Z.; AghaKouchak, A. Multivariate Standardized Drought Index: A Parametric Multi-Index Model. Adv. Water Resour. 2013, 57, 12–18. [Google Scholar] [CrossRef] [Green Version]
- Son, B.; Park, S.; Im, J.; Park, S.; Ke, Y.; Quackenbush, L.J. A New Drought Monitoring Approach: Vector Projection Analysis (VPA). Remote Sens. Environ. 2021, 252, 112145. [Google Scholar] [CrossRef]
- Szewczak, K.; Łoś, H.; Pudełko, R.; Doroszewski, A.; Gluba, Ł.; Łukowski, M.; Rafalska-Przysucha, A.; Słomiński, J.; Usowicz, B. Agricultural Drought Monitoring by MODIS Potential Evapotranspiration Remote Sensing Data Application. Remote Sens. 2020, 12, 3411. [Google Scholar] [CrossRef]
- Yuan, M.; Zhao, L.; Lin, A.; Wang, L.; Li, Q.; She, D.; Qu, S. Impacts of Preseason Drought on Vegetation Spring Phenology across the Northeast China Transect. Sci. Total Environ. 2020, 738, 140297. [Google Scholar] [CrossRef]
- Ren, S.; Qin, Q.; Ren, H.; Sui, J.; Zhang, Y. Heat and Drought Stress Advanced Global Wheat Harvest Timing from 1981–2014. Remote Sens. 2019, 11, 971. [Google Scholar] [CrossRef] [Green Version]
- Rhee, J.; Im, J.; Carbone, G.J. Monitoring Agricultural Drought for Arid and Humid Regions Using Multi-Sensor Remote Sensing Data. Remote Sens. Environ. 2010, 114, 2875–2887. [Google Scholar] [CrossRef]
- Amani, M.; Salehi, B.; Mahdavi, S.; Masjedi, A.; Dehnavi, S. Temperature-Vegetation-Soil Moisture Dryness Index (TVMDI). Remote Sens. Environ. 2017, 197, 1–14. [Google Scholar] [CrossRef]
- Cai, S.; Zuo, D.; Wang, H.; Xu, Z.; Wang, G.; Yang, H. Assessment of Agricultural Drought Based on Multi-Source Remote Sensing Data in a Major Grain Producing Area of Northwest China. Agric. Water Manag. 2023, 278, 108142. [Google Scholar] [CrossRef]
- Kloos, S.; Yuan, Y.; Castelli, M.; Menzel, A. Agricultural Drought Detection with MODIS Based Vegetation Health Indices in Southeast Germany. Remote Sens. 2021, 13, 3907. [Google Scholar] [CrossRef]
- Bento, V.A.; Gouveia, C.M.; DaCamara, C.C.; Libonati, R.; Trigo, I.F. The Roles of NDVI and Land Surface Temperature When Using the Vegetation Health Index over Dry Regions. Glob. Planet. Chang. 2020, 190, 103198. [Google Scholar] [CrossRef]
- Dorigo, W.; Wagner, W.; Albergel, C.; Albrecht, F.; Balsamo, G.; Brocca, L.; Chung, D.; Ertl, M.; Forkel, M.; Gruber, A.; et al. ESA CCI Soil Moisture for Improved Earth System Understanding: State-of-the Art and Future Directions. Remote Sens. Environ. 2017, 203, 185–215. [Google Scholar] [CrossRef]
- Liu, Y.; Liu, Y.; Wang, W. Inter-Comparison of Satellite-Retrieved and Global Land Data Assimilation System-Simulated Soil Moisture Datasets for Global Drought Analysis. Remote Sens. Environ. 2019, 220, 1–18. [Google Scholar] [CrossRef]
- Sawada, Y. Quantifying Drought Propagation from Soil Moisture to Vegetation Dynamics Using a Newly Developed Ecohydrological Land Reanalysis. Remote Sens. 2018, 10, 1197. [Google Scholar] [CrossRef] [Green Version]
- Zhang, Z.; Xu, W.; Shi, Z.; Qin, Q. Establishment of a Comprehensive Drought Monitoring Index Based on Multisource Remote Sensing Data and Agricultural Drought Monitoring. IEEE J. Sel. Top. Appl. Earth Obs. Remote Sens. 2021, 14, 2113–2126. [Google Scholar] [CrossRef]
- Wu, B.; Zhang, M.; Zeng, H.; Tian, F.; Potgieter, A.B.; Qin, X.; Yan, N.; Chang, S.; Zhao, Y.; Dong, Q.; et al. Challenges and Opportunities in Remote Sensing-Based Crop Monitoring: A Review. Natl. Sci. Rev. 2022, 10, nwac290. [Google Scholar] [CrossRef]
- Mohammed, S.; Elbeltagi, A.; Bashir, B.; Alsafadi, K.; Alsilibe, F.; Alsalman, A.; Zeraatpisheh, M.; Széles, A.; Harsányi, E. A Comparative Analysis of Data Mining Techniques for Agricultural and Hydrological Drought Prediction in the Eastern Mediterranean. Comput. Electron. Agric. 2022, 197, 106925. [Google Scholar] [CrossRef]
- Prodhan, F.A.; Zhang, J.; Hasan, S.S.; Pangali Sharma, T.P.; Mohana, H.P. A Review of Machine Learning Methods for Drought Hazard Monitoring and Forecasting: Current Research Trends, Challenges, and Future Research Directions. Environ. Model. Softw. 2022, 149, 105327. [Google Scholar] [CrossRef]
- Hanadé Houmma, I.; El Mansouri, L.; Gadal, S.; Garba, M.; Hadria, R. Modelling Agricultural Drought: A Review of Latest Advances in Big Data Technologies. Geomat. Nat. Hazards Risk 2022, 13, 2737–2776. [Google Scholar] [CrossRef]
- Zhao, Y.; Zhang, J.; Bai, Y.; Zhang, S.; Yang, S.; Henchiri, M.; Seka, A.M.; Nanzad, L. Drought Monitoring and Performance Evaluation Based on Machine Learning Fusion of Multi-Source Remote Sensing Drought Factors. Remote Sens. 2022, 14, 6398. [Google Scholar] [CrossRef]
- Prodhan, F.A.; Zhang, J.; Yao, F.; Shi, L.; Pangali Sharma, T.P.; Zhang, D.; Cao, D.; Zheng, M.; Ahmed, N.; Mohana, H.P. Deep Learning for Monitoring Agricultural Drought in South Asia Using Remote Sensing Data. Remote Sens. 2021, 13, 1715. [Google Scholar] [CrossRef]
- Shen, R.; Huang, A.; Li, B.; Guo, J. Construction of a Drought Monitoring Model Using Deep Learning Based on Multi-Source Remote Sensing Data. Int. J. Appl. Earth Obs. Geoinf. 2019, 79, 48–57. [Google Scholar] [CrossRef]
- Areffian, A.; Eslamian, S.; Sadr, M.K.; Khoshfetrat, A. Monitoring the Effects of Drought on Vegetation Cover and Ground Water Using MODIS Satellite Images and ANN. KSCE J. Civ. Eng. 2021, 25, 1095–1105. [Google Scholar] [CrossRef]
- Ghazaryan, G.; Dubovyk, O.; Graw, V.; Kussul, N.; Schellberg, J. Local-Scale Agricultural Drought Monitoring with Satellite-Based Multi-Sensor Time-Series. GIScience Remote Sens. 2020, 57, 704–718. [Google Scholar] [CrossRef]
- Bayissa, Y.; Tadesse, T.; Demisse, G. Building A High-Resolution Vegetation Outlook Model to Monitor Agricultural Drought for the Upper Blue Nile Basin, Ethiopia. Remote Sens. 2019, 11, 371. [Google Scholar] [CrossRef] [Green Version]
- Feng, P.; Wang, B.; Liu, D.L.; Yu, Q. Machine Learning-Based Integration of Remotely-Sensed Drought Factors Can Improve the Estimation of Agricultural Drought in South-Eastern Australia. Agric. Syst. 2019, 173, 303–316. [Google Scholar] [CrossRef]
- Park, S.; Im, J.; Jang, E.; Rhee, J. Drought Assessment and Monitoring through Blending of Multi-Sensor Indices Using Machine Learning Approaches for Different Climate Regions. Agric. For. Meteorol. 2016, 216, 157–169. [Google Scholar] [CrossRef]
- Rahmati, O.; Falah, F.; Dayal, K.S.; Deo, R.C.; Mohammadi, F.; Biggs, T.; Moghaddam, D.D.; Naghibi, S.A.; Bui, D.T. Machine Learning Approaches for Spatial Modeling of Agricultural Droughts in the South-East Region of Queensland Australia. Sci. Total Environ. 2020, 699, 134230. [Google Scholar] [CrossRef]
- Dao, P.D.; He, Y.; Proctor, C. Plant Drought Impact Detection Using Ultra-High Spatial Resolution Hyperspectral Images and Machine Learning. Int. J. Appl. Earth Obs. Geoinf. 2021, 102, 102364. [Google Scholar] [CrossRef]
- Zhang, Q.; Shi, R.; Singh, V.P.; Xu, C.-Y.; Yu, H.; Fan, K.; Wu, Z. Droughts across China: Drought Factors, Prediction and Impacts. Sci. Total Environ. 2022, 803, 150018. [Google Scholar] [CrossRef]
- Aghelpour, P.; Mohammadi, B.; Mehdizadeh, S.; Bahrami-Pichaghchi, H.; Duan, Z. A Novel Hybrid Dragonfly Optimization Algorithm for Agricultural Drought Prediction. Stoch Env. Res. Risk Assess 2021, 35, 2459–2477. [Google Scholar] [CrossRef]
- Tian, Y.; Xu, Y.-P.; Wang, G. Agricultural Drought Prediction Using Climate Indices Based on Support Vector Regression in Xiangjiang River Basin. Sci. Total Environ. 2018, 622–623, 710–720. [Google Scholar] [CrossRef]
- Bouras, E.H.; Jarlan, L.; Er-Raki, S.; Balaghi, R.; Amazirh, A.; Richard, B.; Khabba, S. Cereal Yield Forecasting with Satellite Drought-Based Indices, Weather Data and Regional Climate Indices Using Machine Learning in Morocco. Remote Sens. 2021, 13, 3101. [Google Scholar] [CrossRef]
- Zambrano, F.; Vrieling, A.; Nelson, A.; Meroni, M.; Tadesse, T. Prediction of Drought-Induced Reduction of Agricultural Productivity in Chile from MODIS, Rainfall Estimates, and Climate Oscillation Indices. Remote Sens. Environ. 2018, 219, 15–30. [Google Scholar] [CrossRef]
- An, J.; Li, W.; Li, M.; Cui, S.; Yue, H. Identification and Classification of Maize Drought Stress Using Deep Convolutional Neural Network. Symmetry 2019, 11, 256. [Google Scholar] [CrossRef] [Green Version]
- Mann, M.L.; Warner, J.M.; Malik, A.S. Predicting High-Magnitude, Low-Frequency Crop Losses Using Machine Learning: An Application to Cereal Crops in Ethiopia. Clim. Chang. 2019, 154, 211–227. [Google Scholar] [CrossRef] [Green Version]
- Tao, F.; Zhang, Z.; Liu, J.; Yokozawa, M. Modelling the Impacts of Weather and Climate Variability on Crop Productivity over a Large Area: A New Super-Ensemble-Based Probabilistic Projection. Agric. For. Meteorol. 2009, 149, 1266–1278. [Google Scholar] [CrossRef]
- Li, Z.; Zhang, Z.; Zhang, L. Improving Regional Wheat Drought Risk Assessment for Insurance Application by Integrating Scenario-Driven Crop Model, Machine Learning, and Satellite Data. Agric. Syst. 2021, 191, 103141. [Google Scholar] [CrossRef]
- Di, L.; Üstündağ, B. (Eds.) Agro-Geoinformatics: Theory and Practice; Springer Remote Sensing/Photogrammetry; Springer International Publishing: Cham, Switzerland, 2021; ISBN 978-3-030-66386-5. [Google Scholar]
- Rahman, M.S.; Di, L. A Systematic Review on Case Studies of Remote-Sensing-Based Flood Crop Loss Assessment. Agriculture 2020, 10, 131. [Google Scholar] [CrossRef] [Green Version]
- Hu, L.; Fang, Z.; Zhang, M.; Jiang, L.; Yue, P. Facilitating Typhoon-Triggered Flood Disaster-Ready Information Delivery Using SDI Services Approach—A Case Study in Hainan. Remote Sens. 2022, 14, 1832. [Google Scholar] [CrossRef]
- Gao, B. NDWI—A Normalized Difference Water Index for Remote Sensing of Vegetation Liquid Water from Space. Remote Sens. Environ. 1996, 58, 257–266. [Google Scholar] [CrossRef]
- Tran, H.; Nguyen, P.; Ombadi, M.; Hsu, K.; Sorooshian, S.; Andreadis, K. Improving Hydrologic Modeling Using Cloud-Free MODIS Flood Maps. J. Hydrometeorol. 2019, 20, 2203–2214. [Google Scholar] [CrossRef] [Green Version]
- Shirzaei, M.; Khoshmanesh, M.; Ojha, C.; Werth, S.; Kerner, H.; Carlson, G.; Sherpa, S.F.; Zhai, G.; Lee, J.-C. Persistent Impact of Spring Floods on Crop Loss in U.S. Midwest. Weather Clim. Extrem. 2021, 34, 100392. [Google Scholar] [CrossRef]
- Moya, L.; Endo, Y.; Okada, G.; Koshimura, S.; Mas, E. Drawback in the Change Detection Approach: False Detection during the 2018 Western Japan Floods. Remote Sens. 2019, 11, 2320. [Google Scholar] [CrossRef] [Green Version]
- Boryan, C.G.; Yang, Z.; Sandborn, A.; Willis, P.; Haack, B. Operational Agricultural Flood Monitoring with Sentinel-1 Synthetic Aperture Radar. In Proceedings of the IGARSS 2018–2018 IEEE International Geoscience and Remote Sensing Symposium, Valencia, Spain, 22–27 July 2018. [Google Scholar]
- Tsyganskaya, V.; Martinis, S.; Marzahn, P.; Ludwig, R. SAR-Based Detection of Flooded Vegetation—A Review of Characteristics and Approaches. Int. J. Remote Sens. 2018, 39, 2255–2293. [Google Scholar] [CrossRef]
- Lin, L.; Di, L.; Tang, J.; Yu, E.; Zhang, C.; Rahman, M.S.; Shrestha, R.; Kang, L. Improvement and Validation of NASA/MODIS NRT Global Flood Mapping. Remote Sens. 2019, 11, 205. [Google Scholar] [CrossRef] [Green Version]
- Rahman, M.S.; Di, L.; Yu, E.; Lin, L.; Zhang, C.; Tang, J. Rapid Flood Progress Monitoring in Cropland with NASA SMAP. Remote Sens. 2019, 11, 191. [Google Scholar] [CrossRef] [Green Version]
- Wang, Y.; Liu, G.; Guo, E.; Yun, X. Quantitative Agricultural Flood Risk Assessment Using Vulnerability Surface and Copula Functions. Water 2018, 10, 1229. [Google Scholar] [CrossRef] [Green Version]
- Zhang, M.; Liu, D.; Wang, S.; Xiang, H.; Zhang, W. Multisource Remote Sensing Data-Based Flood Monitoring and Crop Damage Assessment: A Case Study on the 20 July 2021 Extraordinary Rainfall Event in Henan, China. Remote Sens. 2022, 14, 5771. [Google Scholar] [CrossRef]
- Bofana, J.; Zhang, M.; Wu, B.; Zeng, H.; Nabil, M.; Zhang, N.; Elnashar, A.; Tian, F.; da Silva, J.M.; Botão, A.; et al. How Long Did Crops Survive from Floods Caused by Cyclone Idai in Mozambique Detected with Multi-Satellite Data. Remote Sens. Environ. 2022, 269, 112808. [Google Scholar] [CrossRef]
- Zhang, H.; Fang, W.; Zhang, H.; Yu, L. Assessment of Direct Economic Losses of Flood Disasters Based on Spatial Valuation of Land Use and Quantification of Vulnerabilities: A Case Study on the 2014 Flood in Lishui City of China. Nat. Hazards Earth Syst. Sci. 2021, 21, 3161–3174. [Google Scholar] [CrossRef]
- Valverde-Arias, O.R.; Esteve, P.; Tarquis, A.M.; Garrido, A. Remote Sensing in an Index-Based Insurance Design for Hedging Economic Impacts on Rice Cultivation. Nat. Hazards Earth Syst. Sci. 2020, 20, 345–362. [Google Scholar] [CrossRef] [Green Version]
- Triet, N.V.K.; Dung, N.V.; Merz, B.; Apel, H. Towards Risk-Based Flood Management in Highly Productive Paddy Rice Cultivation—Concept Development and Application to the Mekong Delta. Nat. Hazards Earth Syst. Sci. 2018, 18, 2859–2876. [Google Scholar] [CrossRef] [Green Version]
- van Diepen, C.A.; Wolf, J.; van Keulen, H.; Rappoldt, C. WOFOST: A Simulation Model of Crop Production. Soil Use Manag. 1989, 5, 16–24. [Google Scholar] [CrossRef]
- Keating, B.A.; Carberry, P.S.; Hammer, G.L.; Probert, M.E.; Robertson, M.J.; Holzworth, D.; Huth, N.I.; Hargreaves, J.N.G.; Meinke, H.; Hochman, Z.; et al. An Overview of APSIM, a Model Designed for Farming Systems Simulation. Eur. J. Agron. 2003, 18, 267–288. [Google Scholar] [CrossRef] [Green Version]
- Maroof, M.A.S. Assessing the Influence of Parameters for Agricultural Flood Loss Estimation in the Middle Cedar River Watershed, Iowa. Master’s Thesis, University of Iowa, Iowa City, IA, USA, 2016. [Google Scholar]
- Yildirim, E.; Demir, I. Agricultural Flood Vulnerability Assessment and Risk Quantification in Iowa. Sci. Total Environ. 2022, 826, 154165. [Google Scholar] [CrossRef]
- Molinari, D.; Scorzini, A.R.; Gallazzi, A.; Ballio, F. AGRIDE-c, a Conceptual Model for the Estimation of Flood Damage to Crops: Development and Implementation. Nat. Hazards Earth Syst. Sci. 2019, 19, 2565–2582. [Google Scholar] [CrossRef] [Green Version]
- Li, S.; Tompkins, A.M.; Lin, E.; Ju, H. Simulating the Impact of Flooding on Wheat Yield—Case Study in East China. Agric. For. Meteorol. 2016, 216, 221–231. [Google Scholar] [CrossRef]
- Rahman, M.S.; Di, L.; Yu, E.; Lin, L.; Yu, Z. Remote Sensing Based Rapid Assessment of Flood Crop Damage Using Novel Disaster Vegetation Damage Index (DVDI). Int. J. Disaster Risk Sci. 2021, 12, 90–110. [Google Scholar] [CrossRef]
- Zhang, Z.; Liang, J.; Zhou, Y.; Huang, Z.; Jiang, J.; Liu, J.; Yang, L. A Multi-Strategy-Mode Waterlogging-Prediction Framework for Urban Flood Depth. Nat. Hazards Earth Syst. Sci. 2022, 22, 4139–4165. [Google Scholar] [CrossRef]
- Cohen, S.; Raney, A.; Munasinghe, D.; Loftis, J.D.; Molthan, A.; Bell, J.; Rogers, L.; Galantowicz, J.; Brakenridge, G.R.; Kettner, A.J.; et al. The Floodwater Depth Estimation Tool (FwDET v2.0) for Improved Remote Sensing Analysis of Coastal Flooding. Nat. Hazards Earth Syst. Sci. 2019, 19, 2053–2065. [Google Scholar] [CrossRef] [Green Version]
- Teng, J.; Jakeman, A.J.; Vaze, J.; Croke, B.F.W.; Dutta, D.; Kim, S. Flood Inundation Modelling: A Review of Methods, Recent Advances and Uncertainty Analysis. Environ. Model. Softw. 2017, 90, 201–216. [Google Scholar] [CrossRef]
- Beven, K.J.; Kirkby, M.J. A Physically Based, Variable Contributing Area Model of Basin Hydrology/Un Modèle à Base Physique de Zone d’appel Variable de l’hydrologie Du Bassin Versant. Hydrol. Sci. Bull. 1979, 24, 43–69. [Google Scholar] [CrossRef] [Green Version]
- Gironás, J.; Roesner, L.A.; Rossman, L.A.; Davis, J. A New Applications Manual for the Storm Water Management Model (SWMM). Environ. Model. Softw. 2010, 25, 813–814. [Google Scholar] [CrossRef]
- Zhang, Y.; Hou, J.; Gu, J.; Huang, C.; Li, X. SWAT-Based Hydrological Data Assimilation System (SWAT-HDAS): Description and Case Application to River Basin-Scale Hydrological Predictions. J. Adv. Model. Earth Syst. 2017, 9, 2863–2882. [Google Scholar] [CrossRef] [Green Version]
- Falter, D.; Vorogushyn, S.; Lhomme, J.; Apel, H.; Gouldby, B.; Merz, B. Hydraulic Model Evaluation for Large-Scale Flood Risk Assessments. Hydrol. Process. 2013, 27, 1331–1340. [Google Scholar] [CrossRef] [Green Version]
- Liu, Y.; Maidment, D.; Tarboton, D.; Zheng, X.; Yildirim, A.; Sazib, N.; Wang, S. A CyberGIS Approach to Generating High-Resolution Height Above Nearest Drainage (HAND) Raster for National Flood Mapping. In Proceedings of the Third International Conference on CyberGIS and Geospatial Data Science, Urbana, IL, USA, 26–28 July 2019. [Google Scholar]
- Li, Z.; Mount, J.; Demir, I. Accounting for Uncertainty in Real-Time Flood Inundation Mapping Using HAND Model: Iowa Case Study. Nat. Hazards 2022, 112, 977–1004. [Google Scholar] [CrossRef]
- Hu, A.; Demir, I. Real-Time Flood Mapping on Client-Side Web Systems Using HAND Model. Hydrology 2021, 8, 65. [Google Scholar] [CrossRef]
- Xu, C.; Yang, J.; Wang, L. Application of Remote-Sensing-Based Hydraulic Model and Hydrological Model in Flood Simulation. Sustainability 2022, 14, 8576. [Google Scholar] [CrossRef]
- Araújo, P.; Amaro, V.; Silva, R.; Lopes, A.B. Delimitation of Flood Areas Based on a Calibrated a DEM and Geoprocessing: Case Study on the Uruguay River, Itaqui, Southern Brazil. Nat. Hazards Earth Syst. Sci. 2019, 19, 237–250. [Google Scholar] [CrossRef] [Green Version]
- Hendrawan, V.; Komori, D. Developing Flood Vulnerability Curve for Rice Crop Using Remote Sensing and Hydrodynamic Modeling. Int. J. Disaster Risk Reduct. 2021, 54, 102058. [Google Scholar] [CrossRef]
- Psomiadis, E.; Diakakis, M.; Soulis, K.X. Combining SAR and Optical Earth Observation with Hydraulic Simulation for Flood Mapping and Impact Assessment. Remote Sens. 2020, 12, 3980. [Google Scholar] [CrossRef]
- Chen, H.; Liang, Z.; Liu, Y.; Liang, Q.; Xie, S. Integrated Remote Sensing Imagery and Two-Dimensional Hydraulic Modeling Approach for Impact Evaluation of Flood on Crop Yields. J. Hydrol. 2017, 553, 262–275. [Google Scholar] [CrossRef] [Green Version]
- Munawar, H.S.; Hammad, A.W.A.; Waller, S.T. A Review on Flood Management Technologies Related to Image Processing and Machine Learning. Autom. Constr. 2021, 132, 103916. [Google Scholar] [CrossRef]
- Mosavi, A.; Ozturk, P.; Chau, K. Flood Prediction Using Machine Learning Models: Literature Review. Water 2018, 10, 1536. [Google Scholar] [CrossRef] [Green Version]
- Zhou, X.; Zheng, H.; Xu, X.; He, J.; Ge, X.; Yao, X.; Cheng, T.; Zhu, Y.; Cao, W.; Tian, Y. Predicting Grain Yield in Rice Using Multi-Temporal Vegetation Indices from UAV-Based Multispectral and Digital Imagery. ISPRS J. Photogramm. Remote Sens. 2017, 130, 246–255. [Google Scholar] [CrossRef]
- Shrestha, R.; Di, L.; Yu, E.; Kang, L.; Shao, Y.; Bai, Y. Regression Model to Estimate Flood Impact on Corn Yield Using MODIS NDVI and USDA Cropland Data Layer. J. Integr. Agric. 2017, 16, 398–407. [Google Scholar] [CrossRef] [Green Version]
- Chen, H.; Liang, Q.; Liang, Z.; Liu, Y.; Xie, S. Remote-Sensing Disturbance Detection Index to Identify Spatio-Temporal Varying Flood Impact on Crop Production. Agric. For. Meteorol. 2019, 269, 180–191. [Google Scholar] [CrossRef]
- Wang, X.; Liu, Z.; Chen, H. Investigating Flood Impact on Crop Production under a Comprehensive and Spatially Explicit Risk Evaluation Framework. Agriculture 2022, 12, 484. [Google Scholar] [CrossRef]
- Li, M.; Zhang, T.; Tu, Y.; Ren, Z.; Xu, B. Monitoring Post-Flood Recovery of Croplands Using the Integrated Sentinel-1/2 Imagery in the Yangtze-Huai River Basin. Remote Sens. 2022, 14, 690. [Google Scholar] [CrossRef]
- Lazin, R.; Shen, X.; Anagnostou, E. Estimation of Flood-Damaged Cropland Area Using a Convolutional Neural Network. Environ. Res. Lett. 2021, 16, 054011. [Google Scholar] [CrossRef]
- Phan, A.; Ha, D.; Man, C.; Nguyen, T.; Bui, H.; Nguyen, T. Rapid Assessment of Flood Inundation and Damaged Rice Area in Red River Delta from Sentinel 1A Imagery. Remote Sens. 2019, 11, 2034. [Google Scholar] [CrossRef] [Green Version]
- UNDRR. Annual Report 2021. Available online: https://www.undrr.org/publication/annual-report-2021 (accessed on 27 February 2023).
- Siqueira, A.; Lewis, A.; Thankappan, M.; Szantoi, Z.; Goryl, P.; Labahn, S.; Ross, J.; Hosford, S.; Mecklenburg, S.; Tadono, T.; et al. CEOS Analysis Ready Data For Land—An Overview on the Current and Future Work. In Proceedings of the IGARSS 2019–2019 IEEE International Geoscience and Remote Sensing Symposium, Yokohama, Japan, 28 July–2 August 2019. [Google Scholar]
- OGC. Disaster Pilot 2021 Engineering Report. Available online: https://docs.ogc.org/per/21-064.html (accessed on 24 March 2022).
- Disasters Community on GeoPlatform. Federal Geographic Data Committee. Available online: https://www.fgdc.gov/initiatives/disaster-risk-resilience/disasters-community-geoplatform (accessed on 24 March 2022).
- GeoPlatform Hub Template. Available online: https://disasters-geoplatform.hub.arcgis.com/ (accessed on 24 March 2022).
- Sun, Z.; Di, L.; Hao, H.; Wu, X.; Tong, D.; Zhang, C.; Virgei, C.; Fang, H.; Yu, E.; Tan, X.; et al. CyberConnector: A Service-Oriented System for Automatically Tailoring Multisource Earth Observation Data to Feed Earth Science Models. Earth Sci. Inf. 2018, 11, 1–17. [Google Scholar] [CrossRef]
- Sun, Z.; Di, L.; Gaigalas, J. SUIS: Simplify the Use of Geospatial Web Services in Environmental Modelling. Environ. Model. Softw. 2019, 119, 228–241. [Google Scholar] [CrossRef]
- Jiang, W.; Wang, F.; Zheng, X.; Zheng, X.; Qiao, X.; Li, X.; Meng, Q. Toward Interoperable Multi-Hazard Modeling: A Disaster Management System for Disaster Model Service Chain. Int. J. Disaster Risk Sci. 2022, 13, 862–877. [Google Scholar] [CrossRef]
- Fang, Z.; Yue, P.; Zhang, M.; Xie, J.; Wu, D.; Jiang, L. A Service-Oriented Collaborative Approach to Disaster Decision Support by Integrating Geospatial Resources and Task Chain. Int. J. Appl. Earth Obs. Geoinf. 2023, 117, 103217. [Google Scholar] [CrossRef]
- Damalas, A.; Mettas, C.; Evagorou, E.; Giannecchini, S.; Iasio, C.; Papadopoulos, M.; Konstantinou, A.; Hadjimitsis, D. Development and Implementation of a DECATASTROPHIZE Platform and Tool for the Management of Disasters or Multiple Hazards. Int. J. Disaster Risk Reduct. 2018, 31, 589–601. [Google Scholar] [CrossRef]
- Fritz, S.; See, L.; Bayas, J.C.L.; Waldner, F.; Jacques, D.; Becker-Reshef, I.; Whitcraft, A.; Baruth, B.; Bonifacio, R.; Crutchfield, J.; et al. A Comparison of Global Agricultural Monitoring Systems and Current Gaps. Agric. Syst. 2019, 168, 258–272. [Google Scholar] [CrossRef]
- Nakalembe, C.; Becker-Reshef, I.; Bonifacio, R.; Hu, G.; Humber, M.L.; Justice, C.J.; Keniston, J.; Mwangi, K.; Rembold, F.; Shukla, S.; et al. A Review of Satellite-Based Global Agricultural Monitoring Systems Available for Africa. Glob. Food Secur. 2021, 29, 100543. [Google Scholar] [CrossRef]
- FAO. Global Information and Early Warning System on Food and Agriculture (GIEWS). Available online: https://www.fao.org/giews (accessed on 19 February 2023).
- Becker-Reshef, I.; Justice, C.; Barker, B.; Humber, M.; Rembold, F.; Bonifacio, R.; Zappacosta, M.; Budde, M.; Magadzire, T.; Shitote, C.; et al. Strengthening Agricultural Decisions in Countries at Risk of Food Insecurity: The GEOGLAM Crop Monitor for Early Warning. Remote Sens. Environ. 2020, 237, 111553. [Google Scholar] [CrossRef]
- Becker-Reshef, I.; Justice, C.; Whitcraft, A.K.; Jarvis, I. Geoglam: A Geo Initiative on Global Agricultural Monitoring. In Proceedings of the IGARSS 2018-2018 IEEE International Geoscience and Remote Sensing Symposium, Valencia, Spain, 22–27 July 2018. [Google Scholar]
- Rembold, F.; Meroni, M.; Urbano, F.; Lemoine, G.; Kerdiles, H.; Perez-Hoyos, A.; Csak, G. ASAP—Anomaly Hot Spots of Agricultural Production, a New Early Warning Decision Support System Developed by the Joint Research Centre. In Proceedings of the 2017 9th International Workshop on the Analysis of Multitemporal Remote Sensing Images (MultiTemp), Brugge, Belgium, 27–29 June 2017. [Google Scholar]
- Boryan, C.; Yang, Z.; Mueller, R.; Craig, M. Monitoring US Agriculture: The US Department of Agriculture, National Agricultural Statistics Service, Cropland Data Layer Program. Geocarto Int. 2011, 26, 341–358. [Google Scholar] [CrossRef]
- Han, W.; Yang, Z.; Di, L.; Zhang, B.; Peng, C. Enhancing Agricultural Geospatial Data Dissemination and Applications Using Geospatial Web Services. IEEE J. Sel. Top. Appl. Earth Obs. Remote Sens. 2014, 7, 4539–4547. [Google Scholar] [CrossRef]
- Han, W.; Yang, Z.; Di, L.; Mueller, R. CropScape: A Web Service Based Application for Exploring and Disseminating US Conterminous Geospatial Cropland Data Products for Decision Support. Comput. Electron. Agric. 2012, 84, 111–123. [Google Scholar] [CrossRef]
- Lin, L.; Di, L.; Zhang, C.; Guo, L.; Di, Y.; Li, H.; Yang, A. Validation and Refinement of Cropland Data Layer Using a Spatial-Temporal Decision Tree Algorithm. Sci. Data 2022, 9, 63. [Google Scholar] [CrossRef]
- Zhang, C.; Di, L.; Lin, L.; Li, H.; Guo, L.; Yang, Z.; Yu, E.G.; Di, Y.; Yang, A. Towards Automation of In-Season Crop Type Mapping Using Spatiotemporal Crop Information and Remote Sensing Data. Agric. Syst. 2022, 201, 103462. [Google Scholar] [CrossRef]
- Zhang, C.; Yang, Z.; Di, L.; Yu, E.G.; Zhang, B.; Han, W.; Lin, L.; Guo, L. Near-Real-Time MODIS-Derived Vegetation Index Data Products and Online Services for CONUS Based on NASA LANCE. Sci. Data 2022, 9, 477. [Google Scholar] [CrossRef]
- Hu, L.; Di, L.; Yu, E.; Yue, P.; Tang, J.; Lin, L.; Zhang, C.; Sun, Z.; Hu, R.; Shrestha, R.; et al. Developing Geospatial Web Service and System for SMAP Soil Moisture Monitoring. In Proceedings of the 2017 6th International Conference on Agro-Geoinformatics, Fairfax, VA, USA, 7–10 August 2017. [Google Scholar]
- Zhang, C.; Yang, Z.; Zhao, H.; Sun, Z.; Di, L.; Bindlish, R.; Liu, P.; Colliander, A.; Mueller, R.; Crow, W.; et al. Crop-CASMA: A Web Geoprocessing and Map Service Based Architecture and Implementation for Serving Soil Moisture and Crop Vegetation Condition Data over U.S. Cropland. Int. J. Appl. Earth Obs. Geoinf. 2022, 112, 102902. [Google Scholar] [CrossRef]
- Wu, B.; Meng, J.; Li, Q.; Yan, N.; Du, X.; Zhang, M. Remote Sensing-Based Global Crop Monitoring: Experiences with China’s CropWatch System. Int. J. Digit. Earth 2014, 7, 113–137. [Google Scholar] [CrossRef]
- Heim, R.R.; Brewer, M.J. The Global Drought Monitor Portal: The Foundation for a Global Drought Information System. Earth Interact. 2012, 16, 1–28. [Google Scholar] [CrossRef]
- Hao, Z.; AghaKouchak, A.; Nakhjiri, N.; Farahmand, A. Global Integrated Drought Monitoring and Prediction System. Sci. Data 2014, 1, 140001. [Google Scholar] [CrossRef] [PubMed] [Green Version]
- Svoboda, M.; LeComte, D.; Hayes, M.; Heim, R.; Gleason, K.; Angel, J.; Rippey, B.; Tinker, R.; Palecki, M.; Stooksbury, D.; et al. The Drought Monitor. Bull. Am. Meteorol. Soc. 2002, 83, 1181–1190. [Google Scholar] [CrossRef] [Green Version]
- EDO. EDO European Drought Observatory—JRC European Commission. Available online: http://edo.jrc.ec.europa.eu/edov2/php/index.php?id=1000 (accessed on 13 June 2017).
- Sheffield, J.; Wood, E.; Chaney, N.; Guan, K.; Sadri, S.; Yuan, X.; Olang, L.; Amani, A.; Ali, A.; Demuth, S.; et al. A Drought Monitoring and Forecasting System for Sub-Sahara African Water Resources and Food Security. Bull. Am. Meteorol. Soc. 2014, 95, 861–882. [Google Scholar] [CrossRef]
- Deng, M.; Di, L.; Han, W.; Yagci, A.L.; Peng, C.; Heo, G. Web-Service-Based Monitoring and Analysis of Global Agricultural Drought. Photogramm. Eng. Remote Sens. 2013, 79, 929–943. [Google Scholar] [CrossRef]
- Sun, Z.; Di, L.; Fang, H.; Guo, L.; Yu, E.; Tang, J.; Zhao, H.; Gaigalas, J.; Zhang, C.; Lin, L.; et al. Advanced Cyberinfrastructure for Agricultural Drought Monitoring. In Proceedings of the 2019 8th International Conference on Agro-Geoinformatics (Agro-Geoinformatics), Istanbul, Turkey, 16–19 July 2019. [Google Scholar]
- Yan, N.; Wu, B.; Boken, V.K.; Chang, S.; Yang, L. A Drought Monitoring Operational System for China Using Satellite Data: Design and Evaluation. Geomat. Nat. Hazards Risk 2016, 7, 264–277. [Google Scholar] [CrossRef]
- Peng, C.; Deng, M.; Di, L.; Han, W. Delivery of Agricultural Drought Information via Web Services. Earth Sci. Inform. 2015, 8, 527–538. [Google Scholar] [CrossRef]
- Xu, H.; Allen-Dumas, M.; Berres, A.; Kurte, K.; Liu, Y.; Zhang, G.; Sanyal, J. A HPC Theory-Guided Machine Learning Cyberinfrastructure for Communicating Hydrometeorological Data across Scales; Oak Ridge National Lab: Oak Ridge, TN, USA, 2021. [Google Scholar]
- Di, L.; Yu, E.G.; Kang, L.; Shrestha, R.; BAI, Y. RF-CLASS: A Remote-Sensing-Based Flood Crop Loss Assessment Cyber-Service System for Supporting Crop Statistics and Insurance Decision-Making. J. Integr. Agric. 2017, 16, 408–423. [Google Scholar] [CrossRef]
- Yue, P.; Zhang, M.; Tan, Z. A Geoprocessing Workflow System for Environmental Monitoring and Integrated Modelling. Environ. Model. Softw. 2015, 69, 128–140. [Google Scholar] [CrossRef]
- Zhang, M.; Jiang, L.; Yue, P.; Gong, J. Interoperable Web Sharing of Environmental Models Using OGC Web Processing Service and Open Modeling Interface (OpenMI). Environ. Model. Softw. 2020, 133, 104838. [Google Scholar] [CrossRef]
- Qiu, L.; Du, Z.; Zhu, Q.; Fan, Y. An Integrated Flood Management System Based on Linking Environmental Models and Disaster-Related Data. Environ. Model. Softw. 2017, 91, 111–126. [Google Scholar] [CrossRef]
- Zhai, X.; Yue, P.; Zhang, M. A Sensor Web and Web Service-Based Approach for Active Hydrological Disaster Monitoring. IJGI 2016, 5, 171. [Google Scholar] [CrossRef] [Green Version]
- Yang, C.; Luo, J.; Hu, C.; Tian, L.; Li, J.; Wang, K. An Observation Task Chain Representation Model for Disaster Process-Oriented Remote Sensing Satellite Sensor Planning: A Flood Water Monitoring Application. Remote Sens. 2018, 10, 375. [Google Scholar] [CrossRef] [Green Version]
- Demir, I.; Krajewski, W.F. Towards an Integrated Flood Information System: Centralized Data Access, Analysis, and Visualization. Environ. Model. Softw. 2013, 50, 77–84. [Google Scholar] [CrossRef]
- Gorelick, N.; Hancher, M.; Dixon, M.; Ilyushchenko, S.; Thau, D.; Moore, R. Google Earth Engine: Planetary-Scale Geospatial Analysis for Everyone. Remote Sens. Environ. 2017, 202, 18–27. [Google Scholar] [CrossRef]
- Gao, F.; Yue, P.; Cao, Z.; Zhao, S.; Shangguan, B.; Jiang, L.; Hu, L.; Fang, Z.; Liang, Z. A Multi-Source Spatio-Temporal Data Cube for Large-Scale Geospatial Analysis. Int. J. Geogr. Inf. Sci. 2022, 36, 1853–1884. [Google Scholar] [CrossRef]
- Lewis, A.; Oliver, S.; Lymburner, L.; Evans, B.; Wyborn, L.; Mueller, N.; Raevksi, G.; Hooke, J.; Woodcock, R.; Sixsmith, J.; et al. The Australian Geoscience Data Cube—Foundations and Lessons Learned. Remote Sens. Environ. 2017, 202, 276–292. [Google Scholar] [CrossRef]
- Tzotsos, A.; Karmas, A.; Merticariu, V.; Misev, D.; Baumann, P. A Datacube Approach to Agro-Geoinformatics. In Proceedings of the 2017 6th International Conference on Agro-Geoinformatics, Fairfax, VA, USA, 7–10 August 2017. [Google Scholar]
- Xiong, J.; Thenkabail, P.S.; Gumma, M.K.; Teluguntla, P.; Poehnelt, J.; Congalton, R.G.; Yadav, K.; Thau, D. Automated Cropland Mapping of Continental Africa Using Google Earth Engine Cloud Computing. ISPRS J. Photogramm. Remote Sens. 2017, 126, 225–244. [Google Scholar] [CrossRef] [Green Version]
- Cao, J.; Zhang, Z.; Tao, F.; Zhang, L.; Luo, Y.; Zhang, J.; Han, J.; Xie, J. Integrating Multi-Source Data for Rice Yield Prediction across China Using Machine Learning and Deep Learning Approaches. Agric. For. Meteorol. 2021, 297, 108275. [Google Scholar] [CrossRef]
- Chen, N.; Yu, L.; Zhang, X.; Shen, Y.; Zeng, L.; Hu, Q.; Niyogi, D. Mapping Paddy Rice Fields by Combining Multi-Temporal Vegetation Index and Synthetic Aperture Radar Remote Sensing Data Using Google Earth Engine Machine Learning Platform. Remote Sens. 2020, 12, 2992. [Google Scholar] [CrossRef]
- Gumma, M.K.; Thenkabail, P.S.; Teluguntla, P.G.; Oliphant, A.; Xiong, J.; Giri, C.; Pyla, V.; Dixit, S.; Whitbread, A.M. Agricultural Cropland Extent and Areas of South Asia Derived Using Landsat Satellite 30-m Time-Series Big-Data Using Random Forest Machine Learning Algorithms on the Google Earth Engine Cloud. GIScience Remote Sens. 2020, 57, 302–322. [Google Scholar] [CrossRef] [Green Version]
- Xiong, J.; Thenkabail, P.S.; Tilton, J.C.; Gumma, M.K.; Teluguntla, P.; Oliphant, A.; Congalton, R.G.; Yadav, K.; Gorelick, N. Nominal 30-m Cropland Extent Map of Continental Africa by Integrating Pixel-Based and Object-Based Algorithms Using Sentinel-2 and Landsat-8 Data on Google Earth Engine. Remote Sens. 2017, 9, 1065. [Google Scholar] [CrossRef] [Green Version]
- Zhang, C.; Di, L.; Yang, Z.; Lin, L.; Hao, P. AgKit4EE: A Toolkit for Agricultural Land Use Modeling of the Conterminous United States Based on Google Earth Engine. Environ. Model. Softw. 2020, 129, 104694. [Google Scholar] [CrossRef]
- Li, Z.; Demir, I. U-Net-Based Semantic Classification for Flood Extent Extraction Using SAR Imagery and GEE Platform: A Case Study for 2019 Central US Flooding 2022. Sci. Total Environ. 2023, 869, 161757. [Google Scholar] [CrossRef]
- Scheip, C.M.; Wegmann, K.W. HazMapper: A Global Open-Source Natural Hazard Mapping Application in Google Earth Engine. Nat. Hazards Earth Syst. Sci. 2021, 21, 1495–1511. [Google Scholar] [CrossRef]
- Khan, R.; Gilani, H. Global Drought Monitoring with Drought Severity Index (DSI) Using Google Earth Engine. Appl. Clim. 2021, 146, 411–427. [Google Scholar] [CrossRef]
- Khan, R.; Gilani, H. Global Drought Monitoring with Big Geospatial Datasets Using Google Earth Engine. Env. Sci Pollut Res. 2021, 28, 17244–17264. [Google Scholar] [CrossRef]
- Liu, Z.; Liu, H.; Luo, C.; Yang, H.; Meng, X.; Ju, Y.; Guo, D. Rapid Extraction of Regional-Scale Agricultural Disasters by the Standardized Monitoring Model Based on Google Earth Engine. Sustainability 2020, 12, 6497. [Google Scholar] [CrossRef]
- Drivas, T.; Sitokonstantinou, V.; Tsardanidis, I.; Koukos, A.; Kontoes, C.; Karathanassi, V. A Data Cube of Big Satellite Image Time-Series for Agriculture Monitoring. In Proceedings of the 2022 IEEE 14th Image, Video, and Multidimensional Signal Processing Workshop (IVMSP), Nafplio, Greece, 26–29 June 2022. [Google Scholar]
- Wardle, J.A.; Sagan, V.; Mohammed, F. Using Open Data Cube on the Cloud to Investigate Food Security by Means of Cropland Changes in Djibouti. In Proceedings of the The International Archives of the Photogrammetry, Remote Sensing and Spatial Information Sciences, Nice, France, 6–11 June 2022. [Google Scholar]
- Cheng, M.C.; Chiou, C.R.; Chen, B.; Liu, C.; Lin, H.C.; Shih, I.L.; Chung, C.H.; Lin, H.Y.; Chou, C.Y. Open Data Cube (ODC) in Taiwan: The Initiative and Protocol Development. In Proceedings of the IGARSS 2019—2019 IEEE International Geoscience and Remote Sensing Symposium, Yokohama, Japan, 28 July–2 August 2019. [Google Scholar]
- Killough, B.; Lubawy, A.; Dyke, G.; Rosenqvist, A. The Open Data Cube Sandbox: A Tool to Support Flood Disaster Response and Recovery. In Proceedings of the IGARSS 2022–2022 IEEE International Geoscience and Remote Sensing Symposium, Kuala Lumpur, Malaysia, 17–22 July 2022. [Google Scholar]
- OGC API. Records. Available online: https://ogcapi.ogc.org/records/ (accessed on 28 February 2023).
- STAC: SpatioTemporal Asset Catalogs. Available online: https://stacspec.org/en/ (accessed on 28 February 2023).
- Cloud Optimized GeoTIFF: An Imagery Format for Cloud-Native Geospatial Processing. Available online: https://www.cogeo.org/ (accessed on 4 April 2023).
- OGC API. EDR. Available online: https://ogcapi.ogc.org/edr/ (accessed on 28 February 2023).
- OGC. Testbed-16: Data Access and Processing API Engineering Report 2021. Available online: http://docs.opengeospatial.org/per/20-025r1.html (accessed on 28 February 2023).
- OGC. Testbed-16: Analysis Ready Data Engineering Report 2021. Available online: http://docs.opengeospatial.org/per/20-041.html (accessed on 28 February 2023).
- OGC. Testbed 17: Geo Data Cube API Engineering Report 2022. Available online: http://docs.ogc.org/per/21-027.html (accessed on 28 February 2023).
- OGC. Geodatacube Standard Working Group Charter 2023. Available online: https://portal.ogc.org/files/?artifact_id=103144&version=1 (accessed on 28 February 2023).
- Deep-Time Digital Earth White Paper. Available online: https://www.ddeworld.org/news/detail/135 (accessed on 8 February 2023).
- Zarr: Chunked, Compressed, N-Dimensional Arrays. Available online: https://zarr.dev/ (accessed on 4 April 2023).
- Cloud-Performant NetCDF4/HDF5 Reading with the Zarr Library. Available online: https://medium.com/pangeo/cloud-performant-reading-of-netcdf4-hdf5-data-using-the-zarr-library-1a95c5c92314 (accessed on 4 April 2023).
- GEO Knowledge Hub: An Open-Source Digital Repository of Open, Authoritative and Reproducible Knowledge. Available online: https://gkhub.earthobservations.org/ (accessed on 4 April 2023).
- OGC. Testbed-18: Identifiers for Reproducible Science Summary Engineering Report. 2023. Available online: https://docs.ogc.org/per/22-020.html (accessed on 4 April 2023).
- OGC. Candidate Training Data Markup Language for Artificial Intelligence (TrainingDML-AI) Part 1: Conceptual Model Standard (23-008r1). Available online: https://portal.ogc.org/files/104166 (accessed on 4 April 2023).
- OGC. Testbed-18: Machine Learning Training Data Engineering Report 2023. Available online: http://docs.opengeospatial.org/per/22-020.html (accessed on 4 April 2023).
Figure 1.
The major players worldwide.
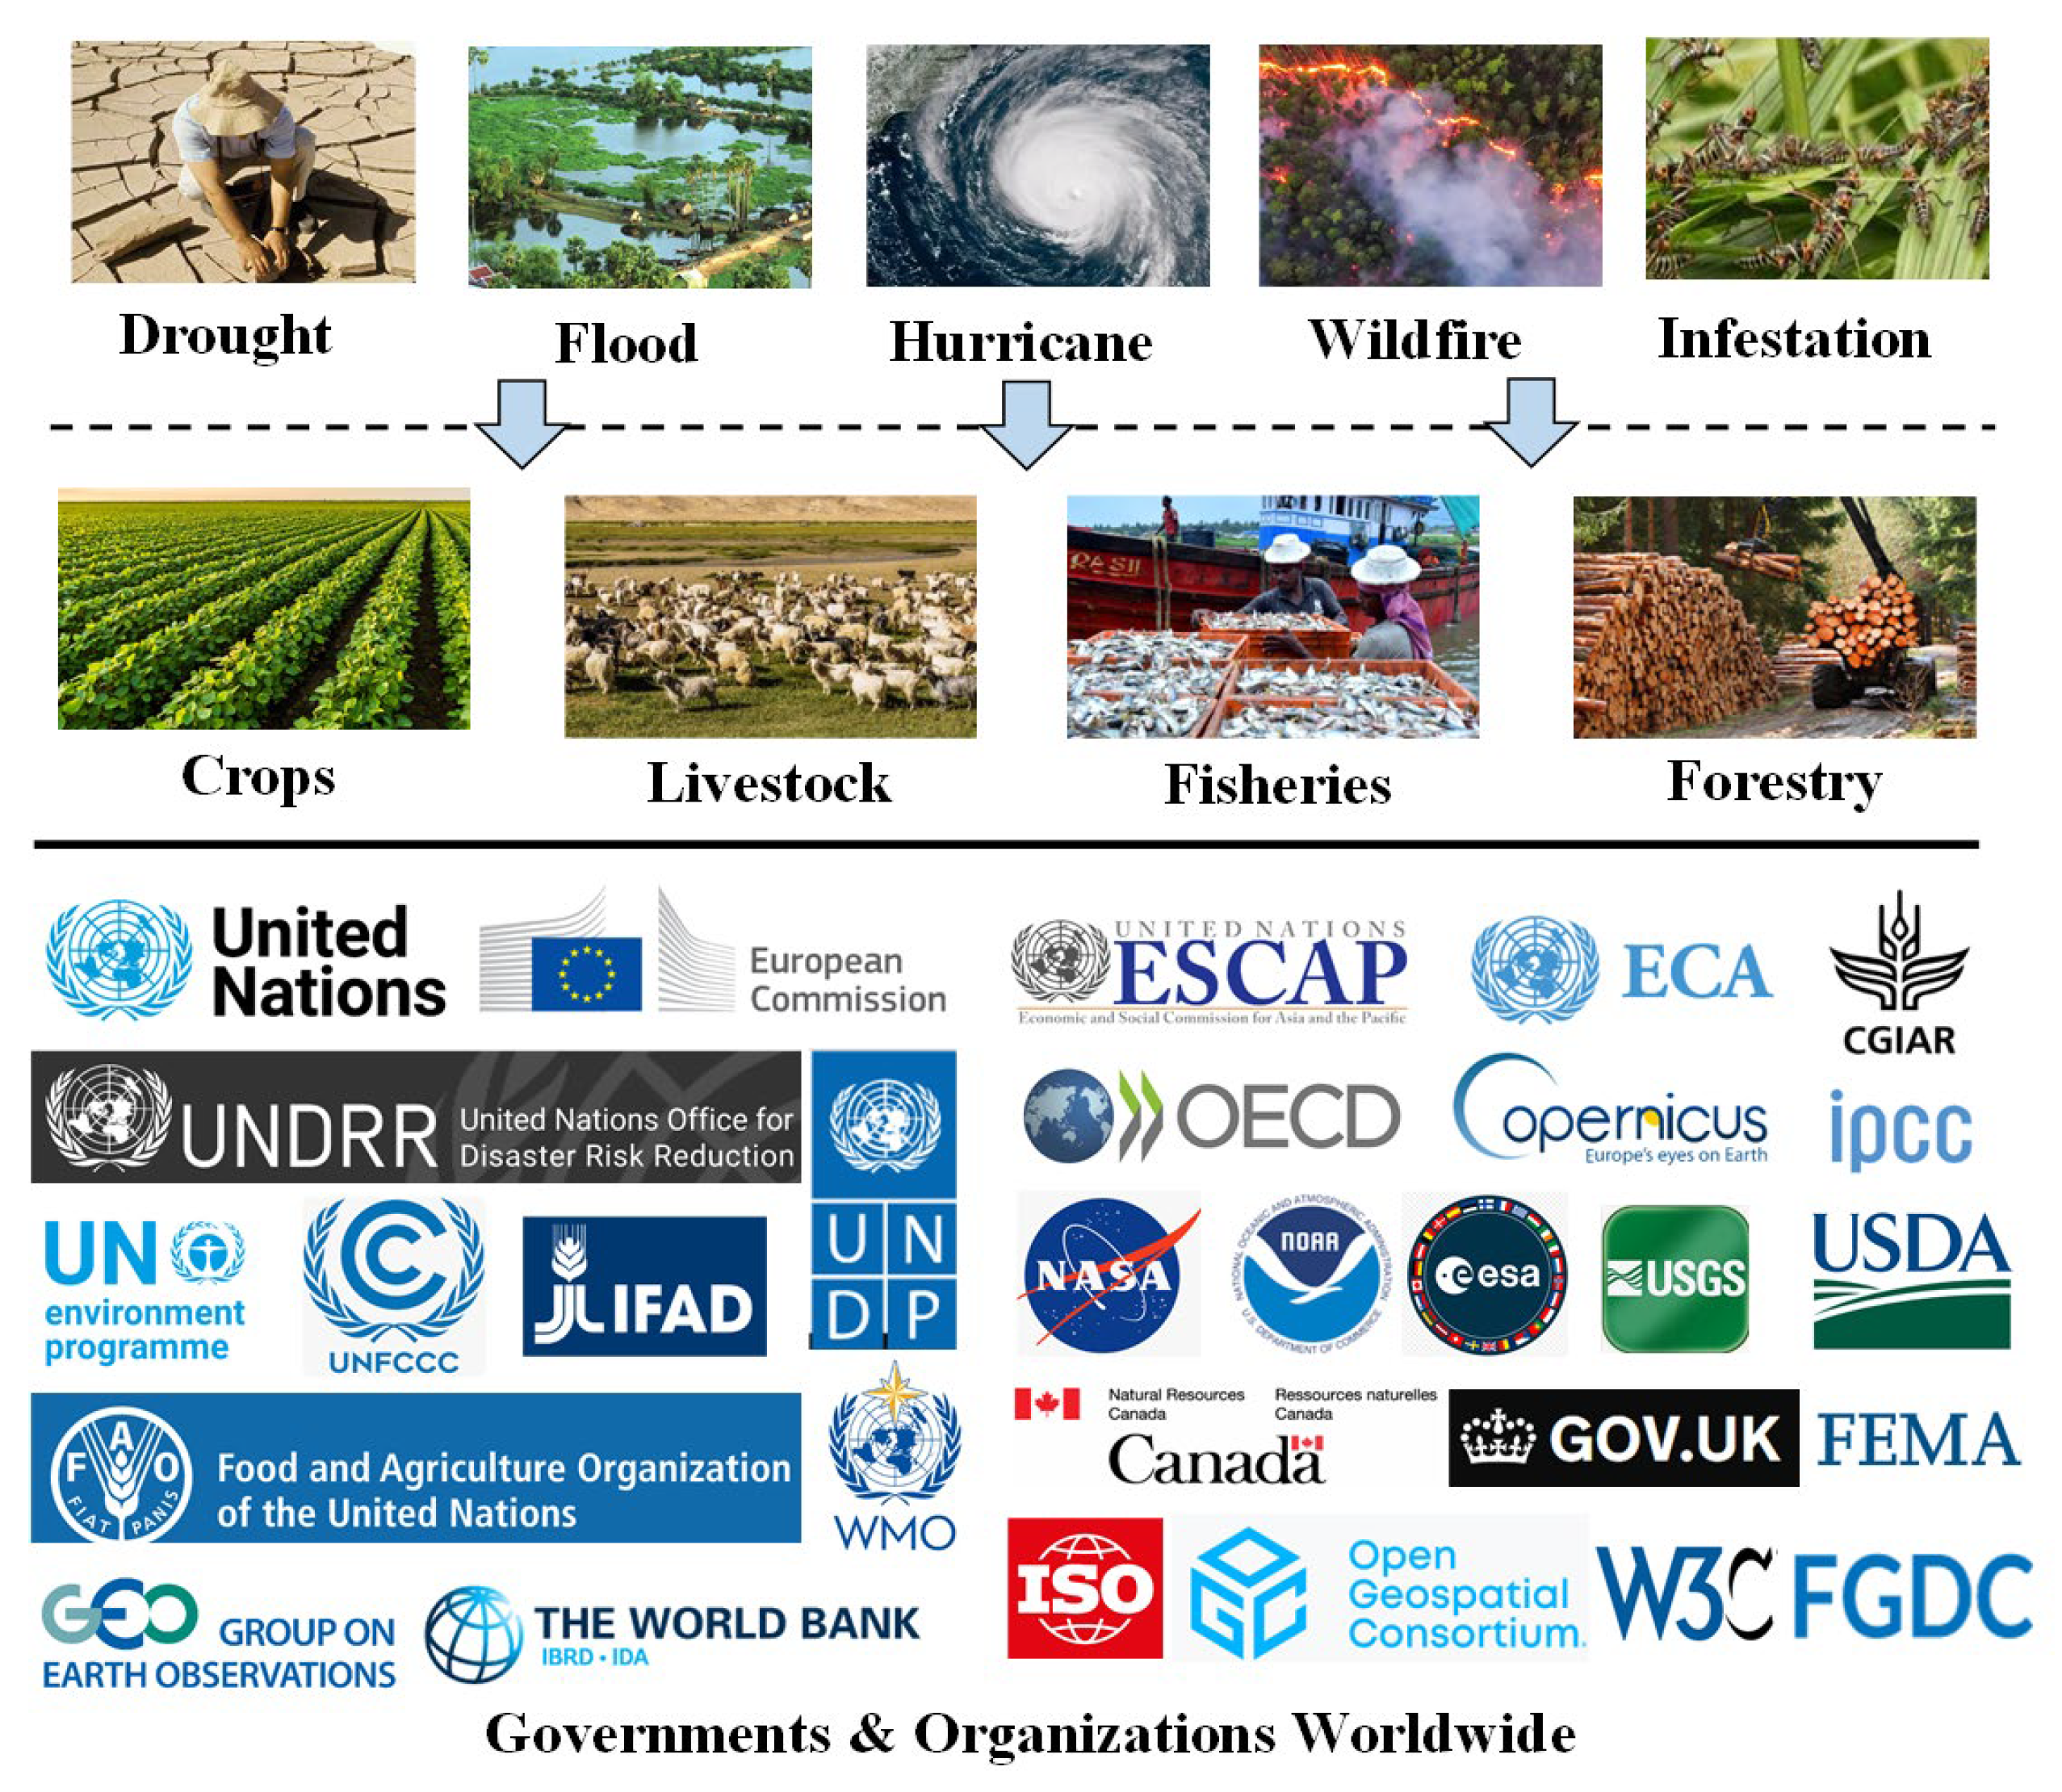
Figure 2.
EO-based agricultural drought monitoring and assessment.
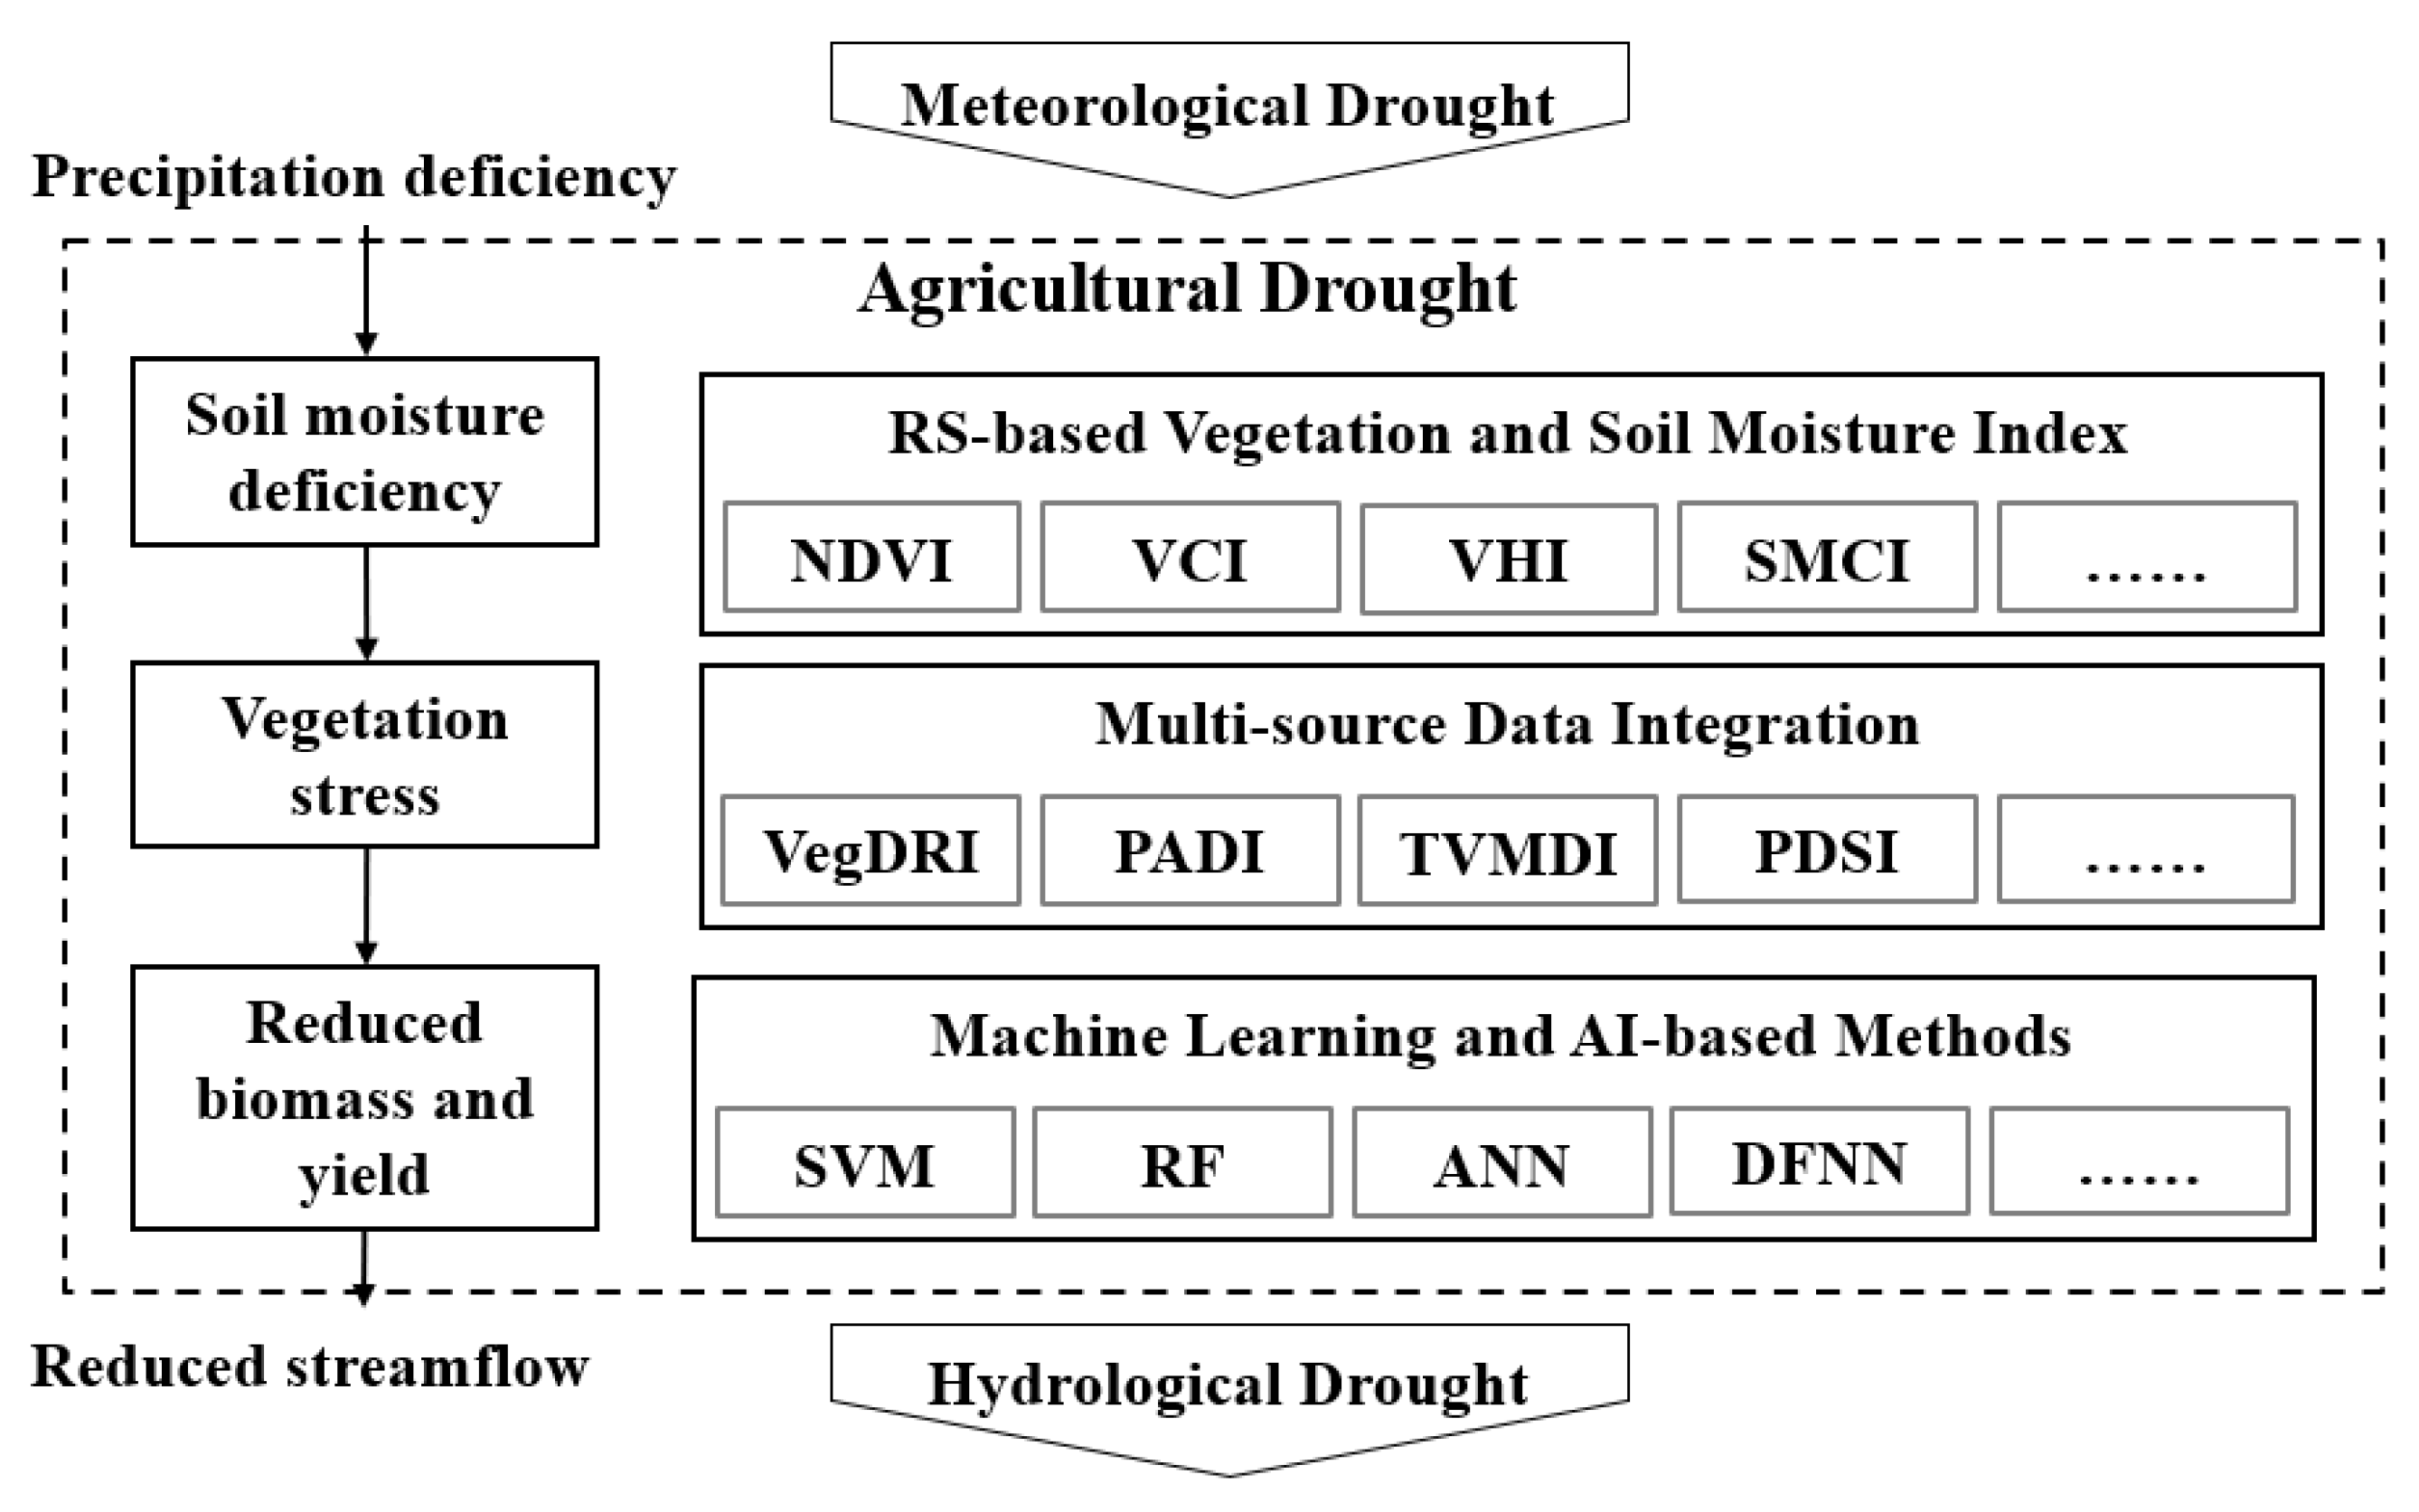
Figure 3.
Agricultural flood disaster monitoring and assessment.
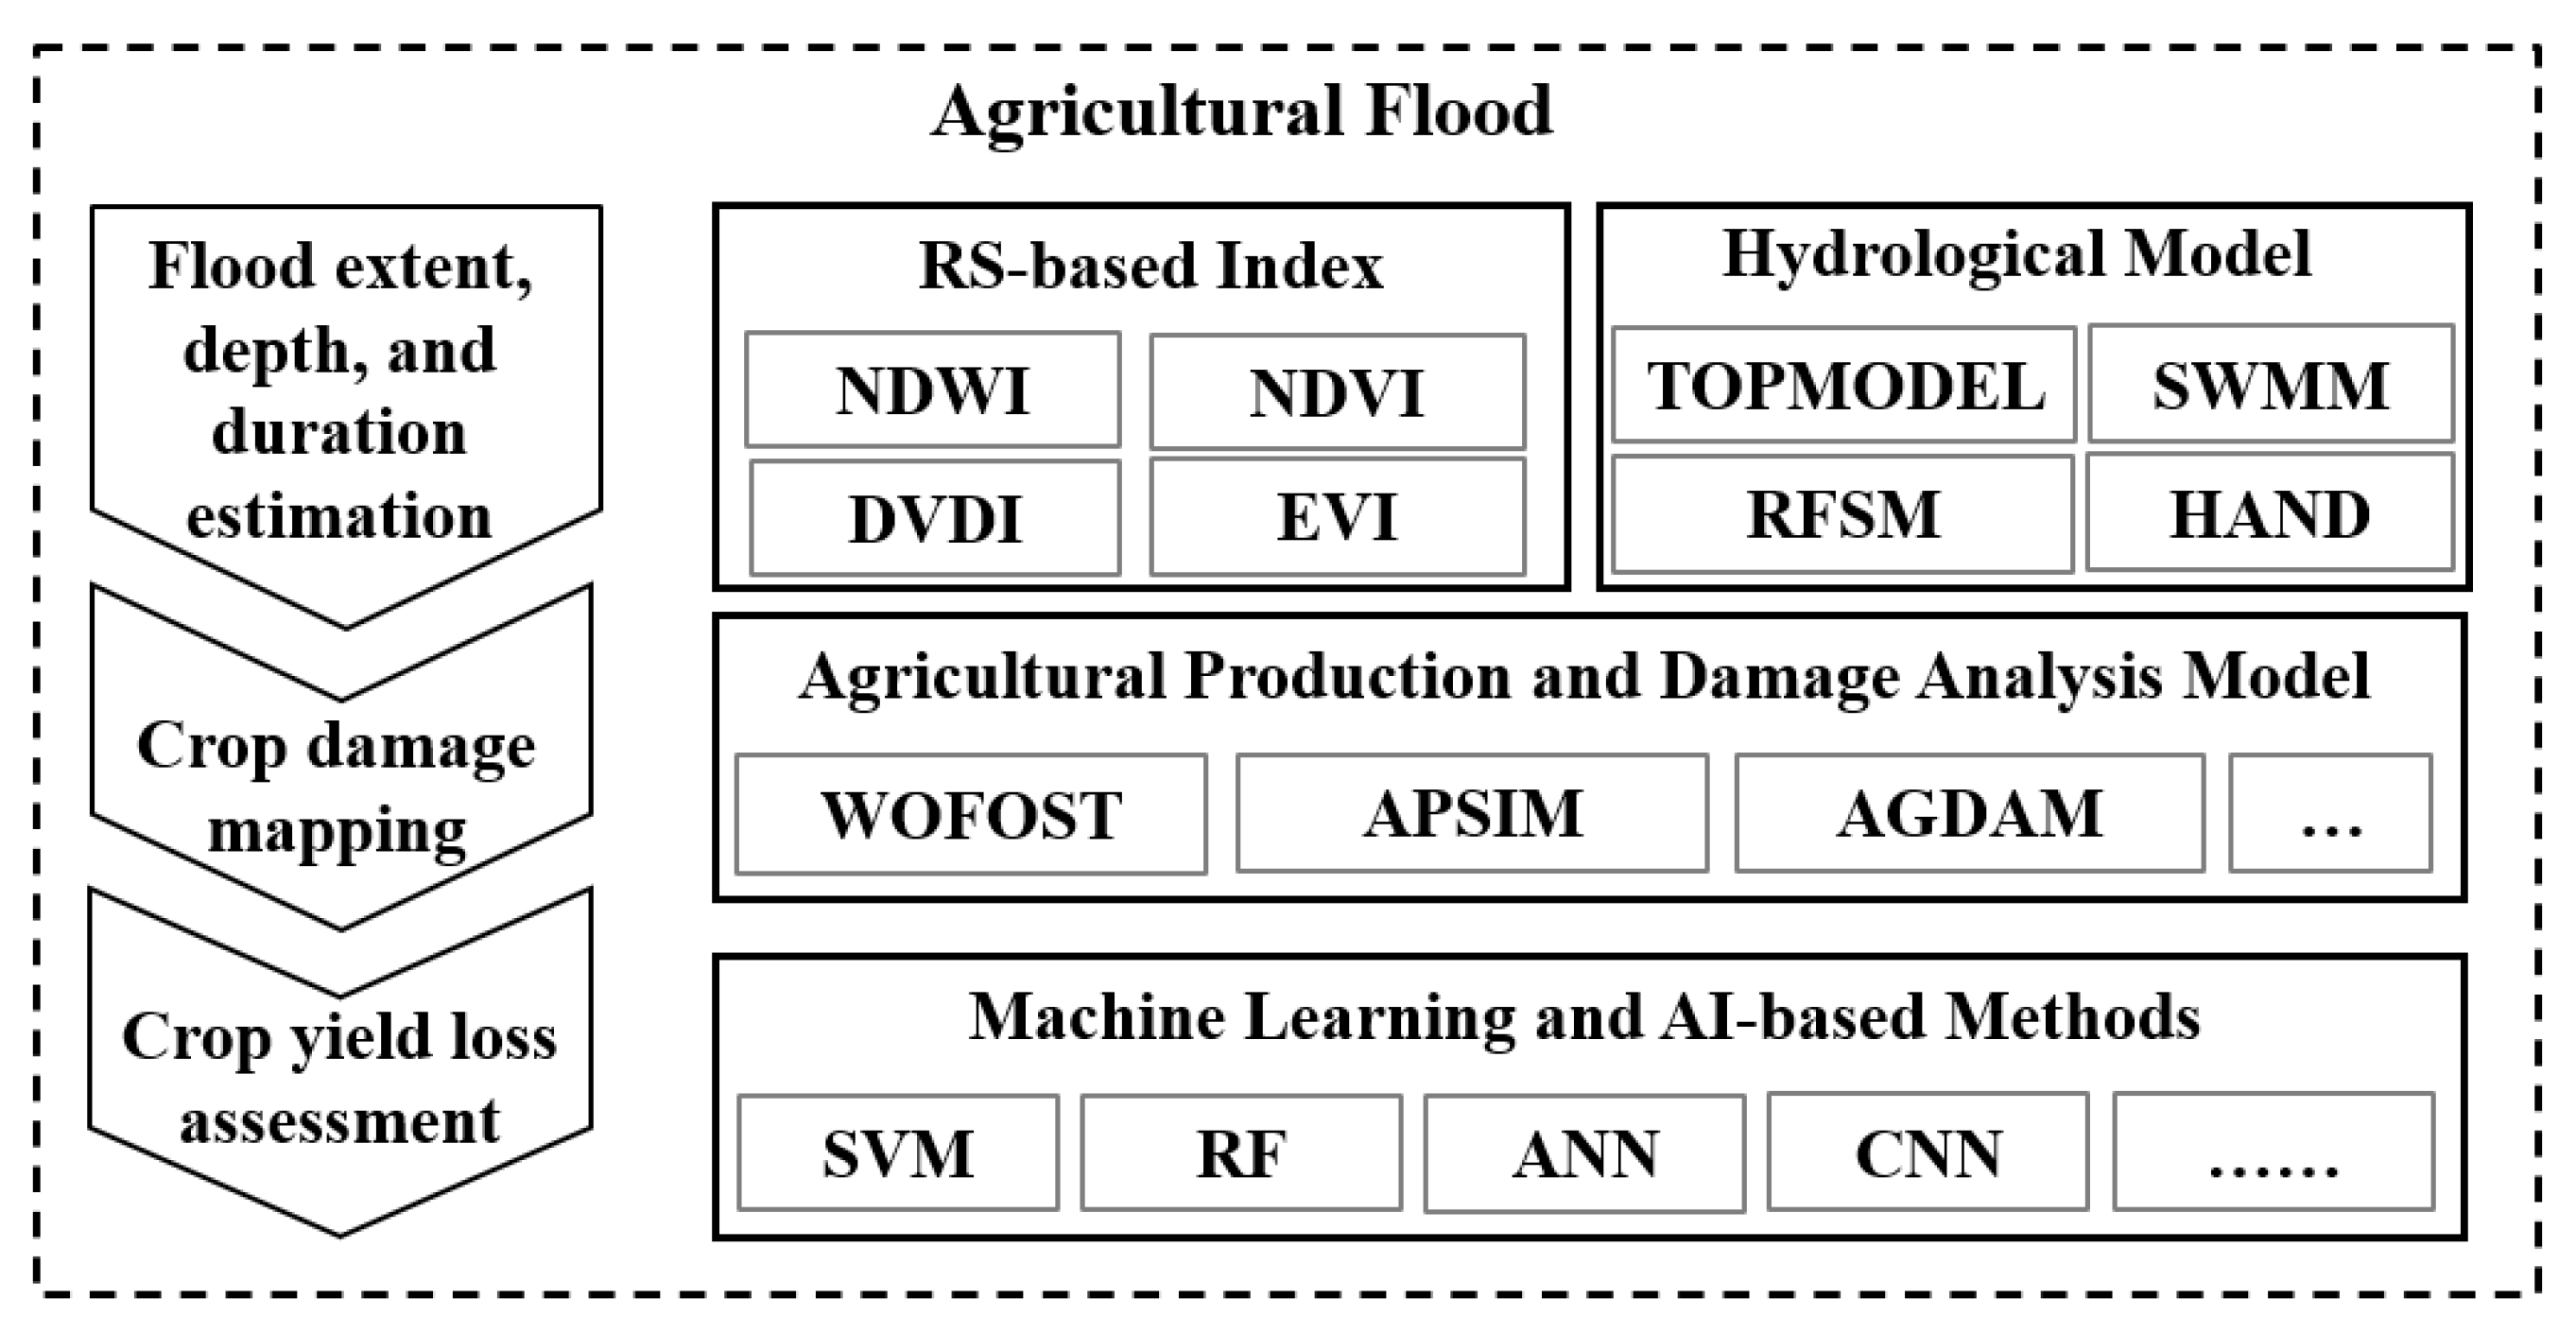
Figure 4.
Challenges and Opportunities.

Disclaimer/Publisher’s Note: The statements, opinions and data contained in all publications are solely those of the individual author(s) and contributor(s) and not of MDPI and/or the editor(s). MDPI and/or the editor(s) disclaim responsibility for any injury to people or property resulting from any ideas, methods, instructions or products referred to in the content. |
© 2023 by the authors. Licensee MDPI, Basel, Switzerland. This article is an open access article distributed under the terms and conditions of the Creative Commons Attribution (CC BY) license (https://creativecommons.org/licenses/by/4.0/).
Share and Cite
MDPI and ACS Style
Hu, L.; Zhang, C.; Zhang, M.; Shi, Y.; Lu, J.; Fang, Z. Enhancing FAIR Data Services in Agricultural Disaster: A Review. Remote Sens. 2023, 15, 2024. https://doi.org/10.3390/rs15082024
AMA Style
Hu L, Zhang C, Zhang M, Shi Y, Lu J, Fang Z. Enhancing FAIR Data Services in Agricultural Disaster: A Review. Remote Sensing. 2023; 15(8):2024. https://doi.org/10.3390/rs15082024
Chicago/Turabian StyleHu, Lei, Chenxiao Zhang, Mingda Zhang, Yuming Shi, Jiasheng Lu, and Zhe Fang. 2023. "Enhancing FAIR Data Services in Agricultural Disaster: A Review" Remote Sensing 15, no. 8: 2024. https://doi.org/10.3390/rs15082024
Note that from the first issue of 2016, this journal uses article numbers instead of page numbers. See further details here.