
Accuracy Assessment of Surveying Strategies for the Characterization of Microtopographic Features That Influence Surface Water Flooding
 ,
,
Abstract
:
1. Introduction
2. Materials and Methods
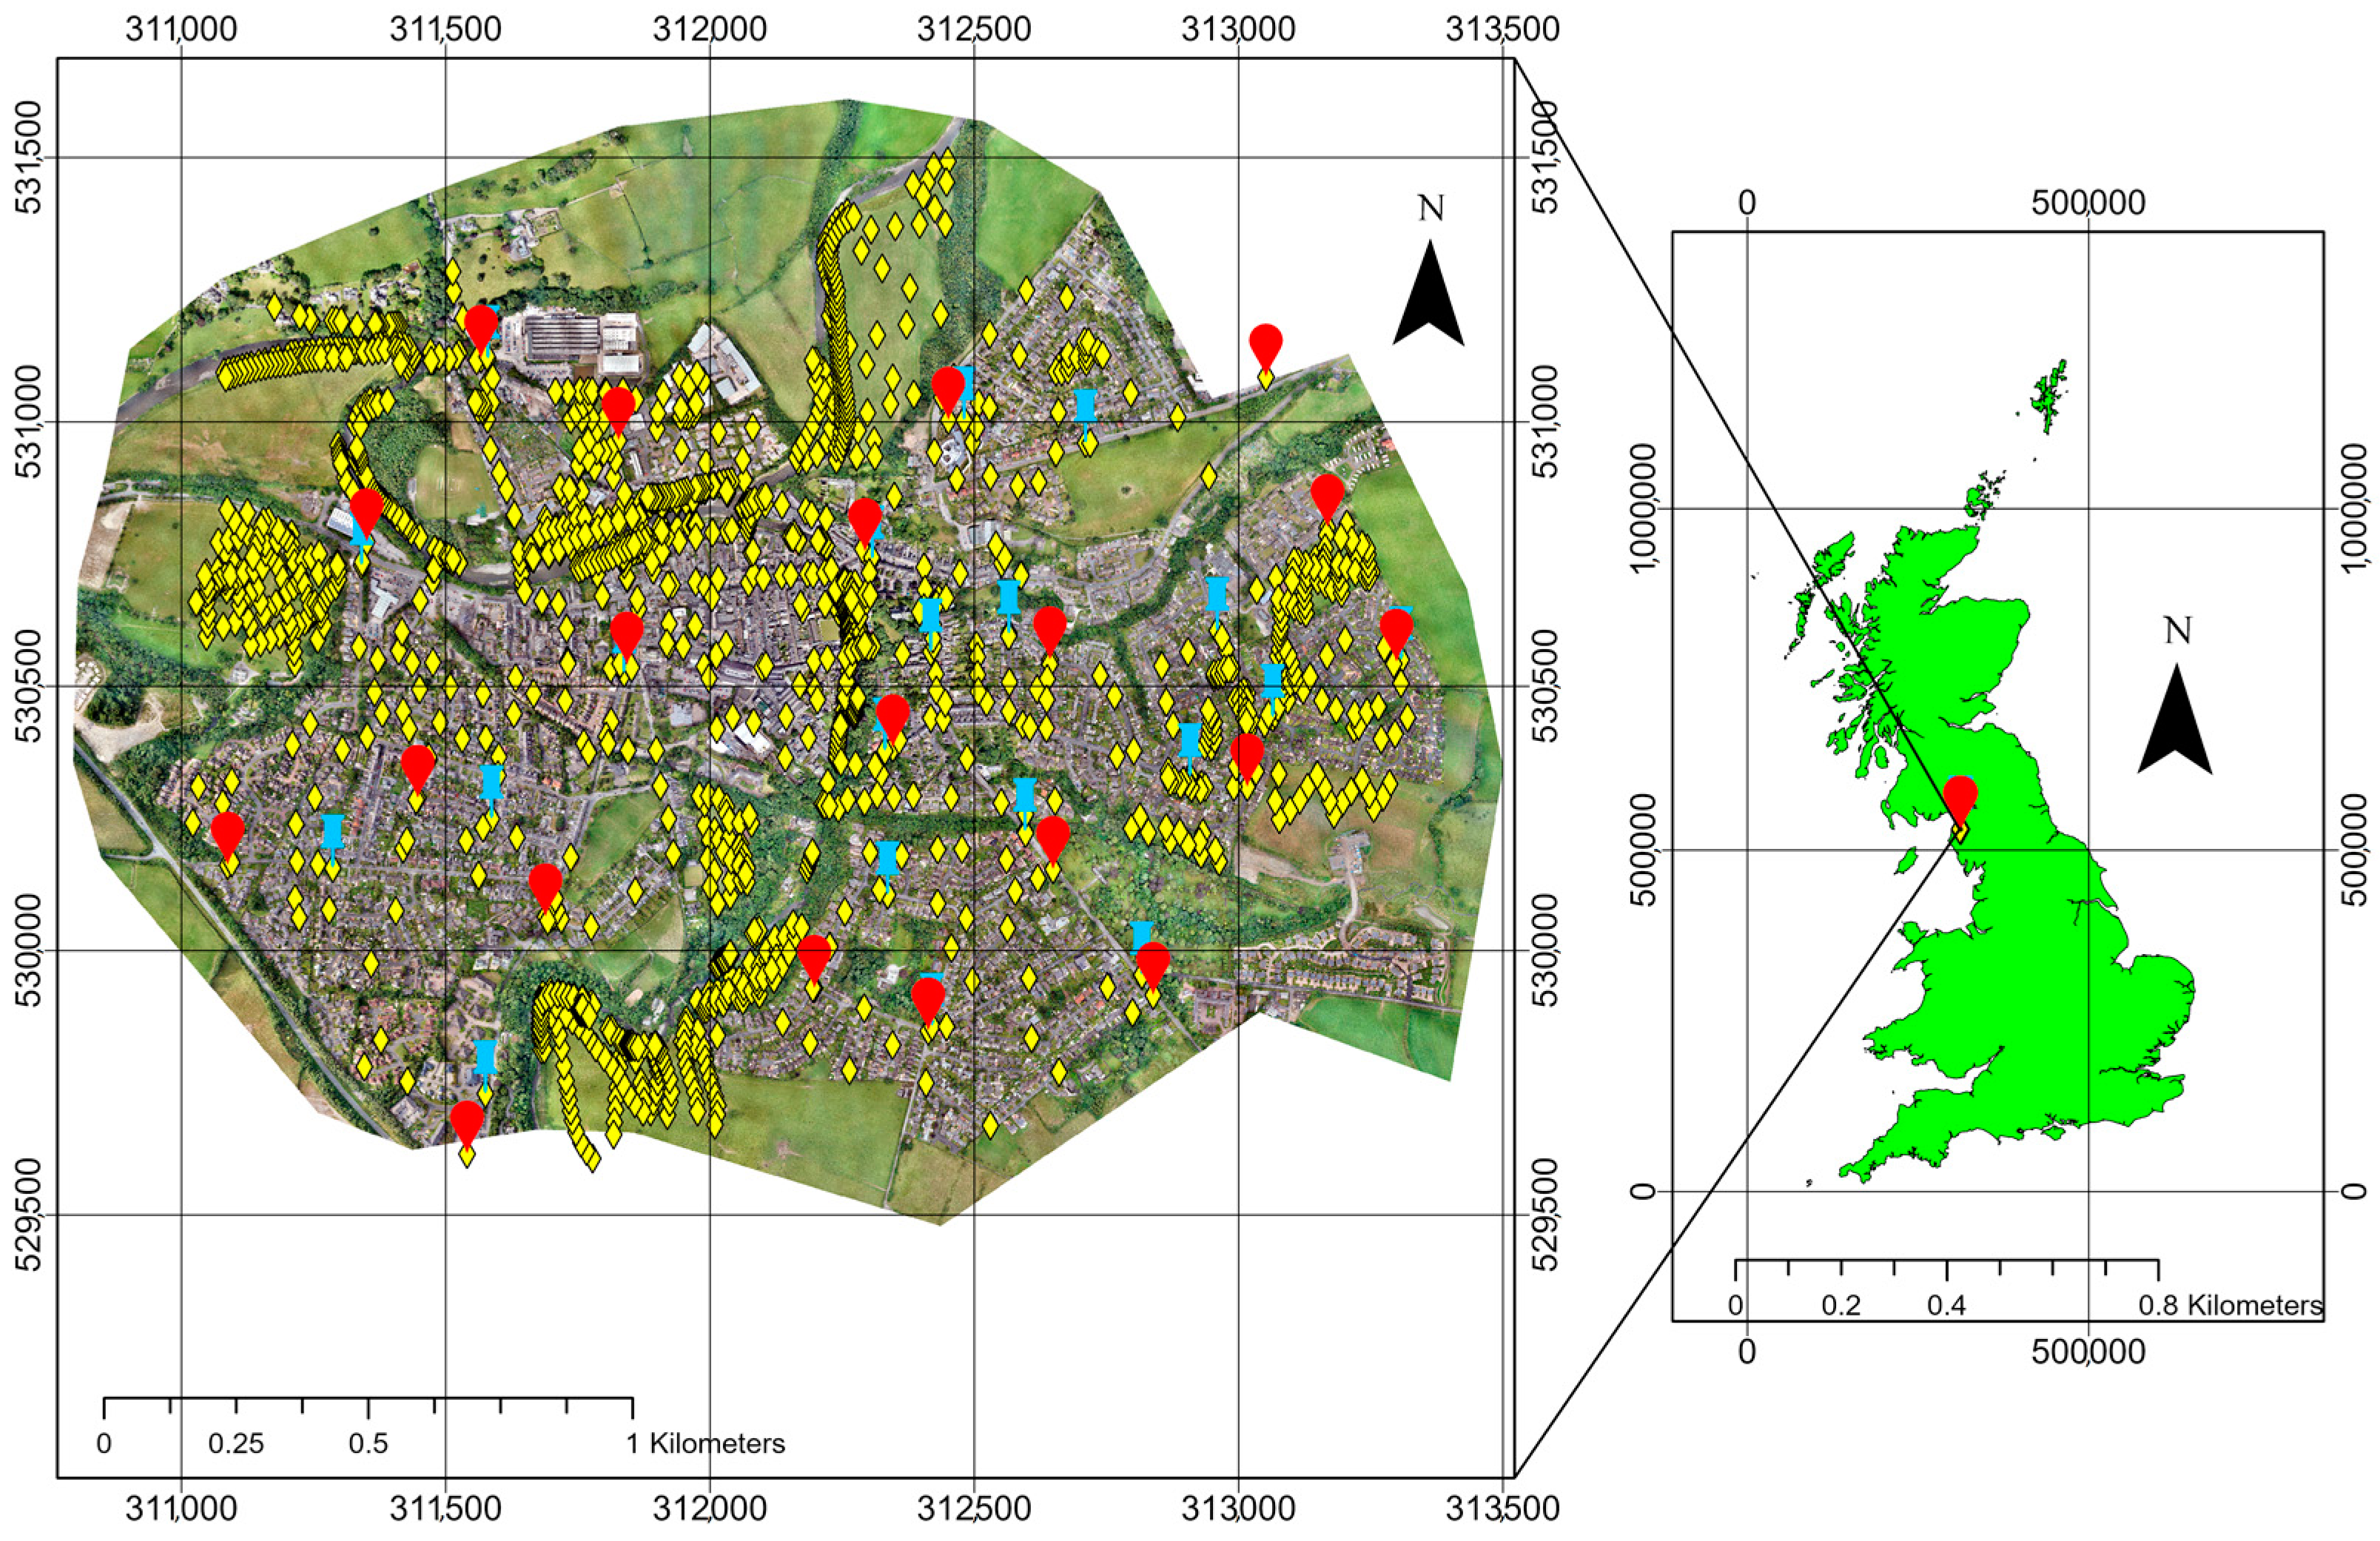
2.1. Study Area
2.2. Data Collection
2.2.1. UAS–RGB Data (Survey Strategy S1)
2.2.2. LiDAR Data (Survey Strategy S2)
2.2.3. RTK–GPS Data
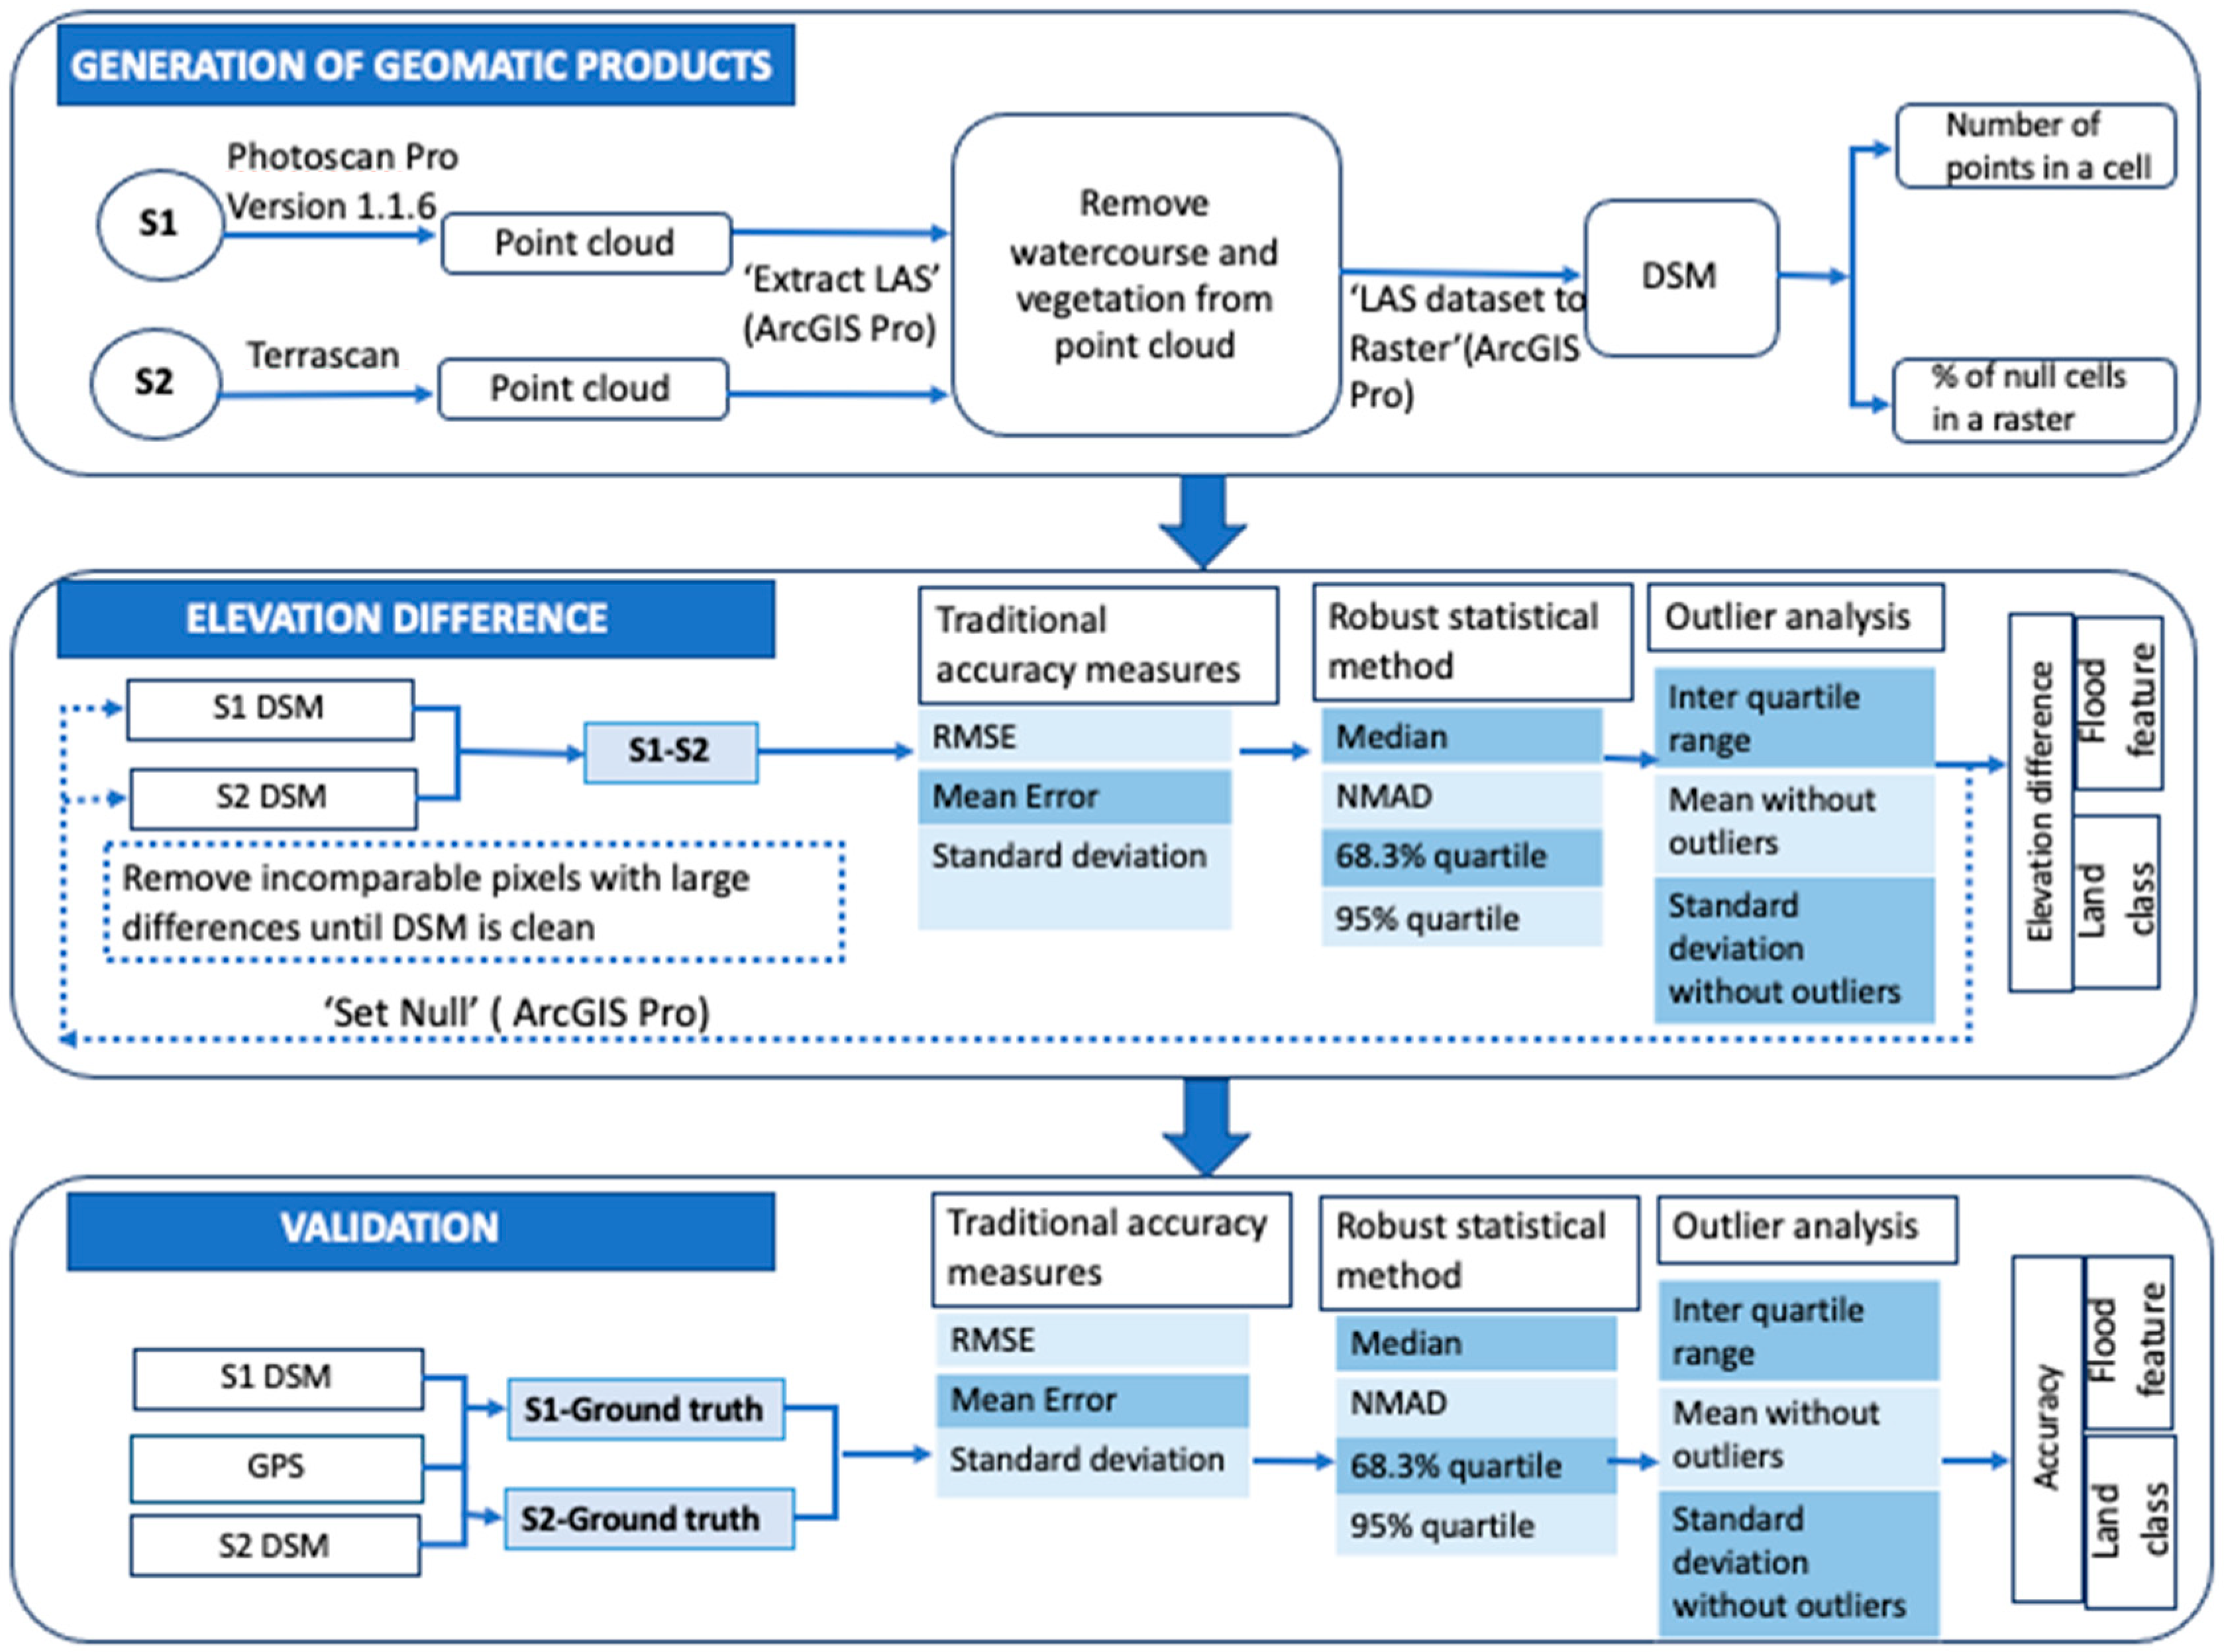
2.3. Data Processing
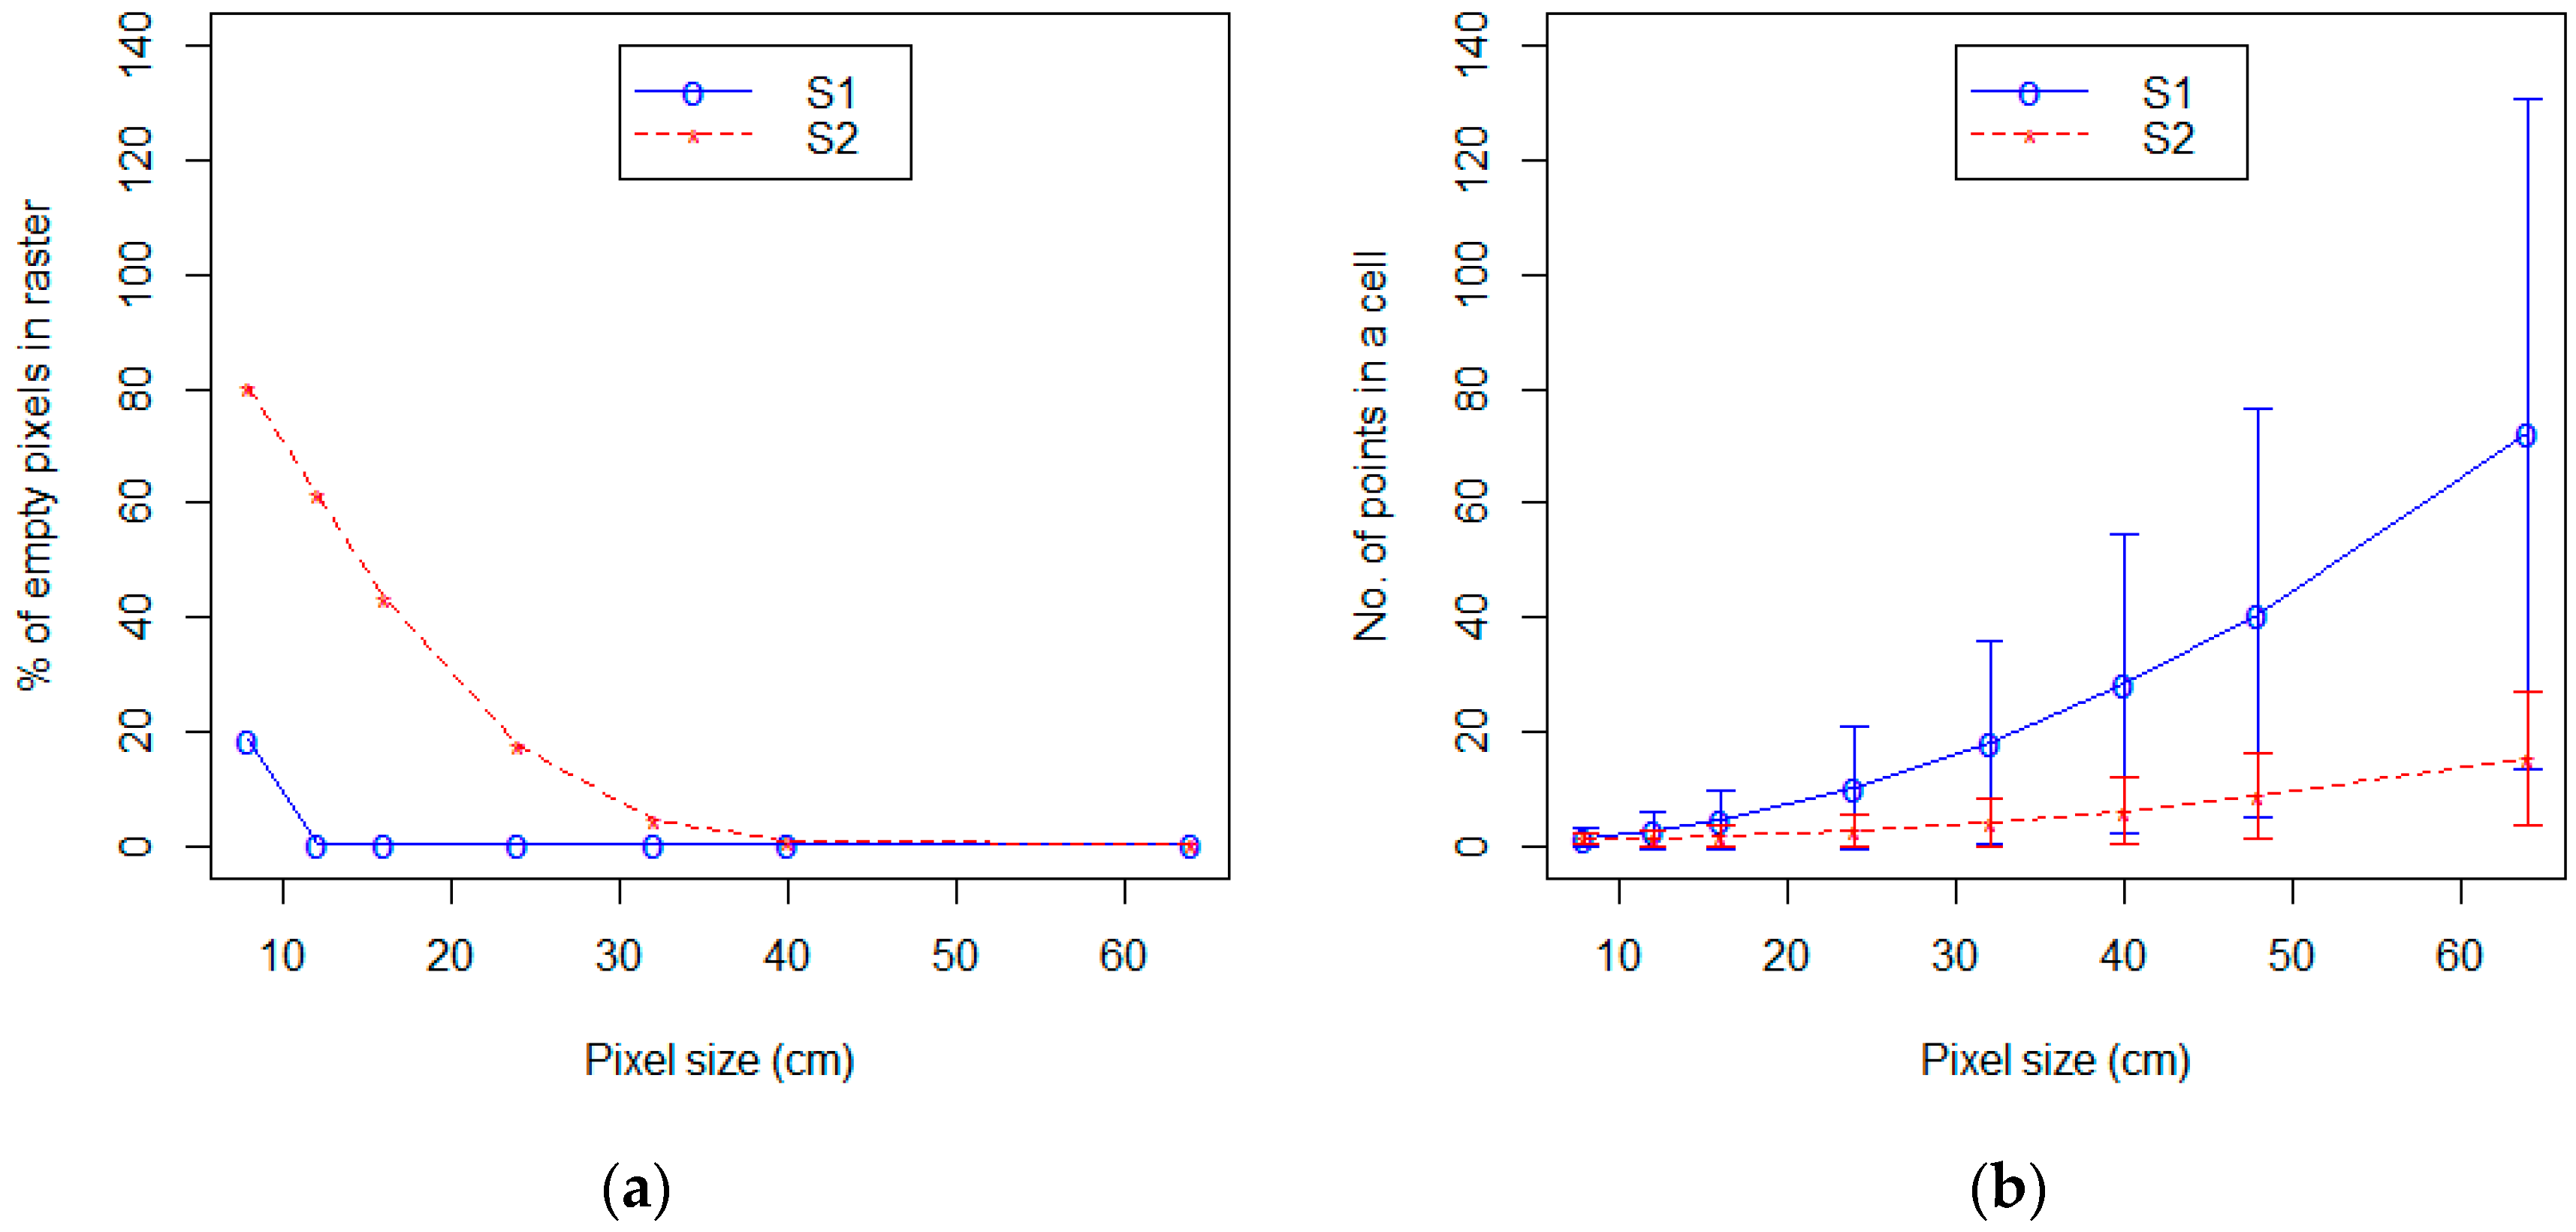
2.3.1. Pixel Size Determination for S1 and S2
2.3.2. Difference in Elevation between S1 and S2
2.3.3. Validation
3. Results
3.1. Pixel Size Determination for S1 and S2
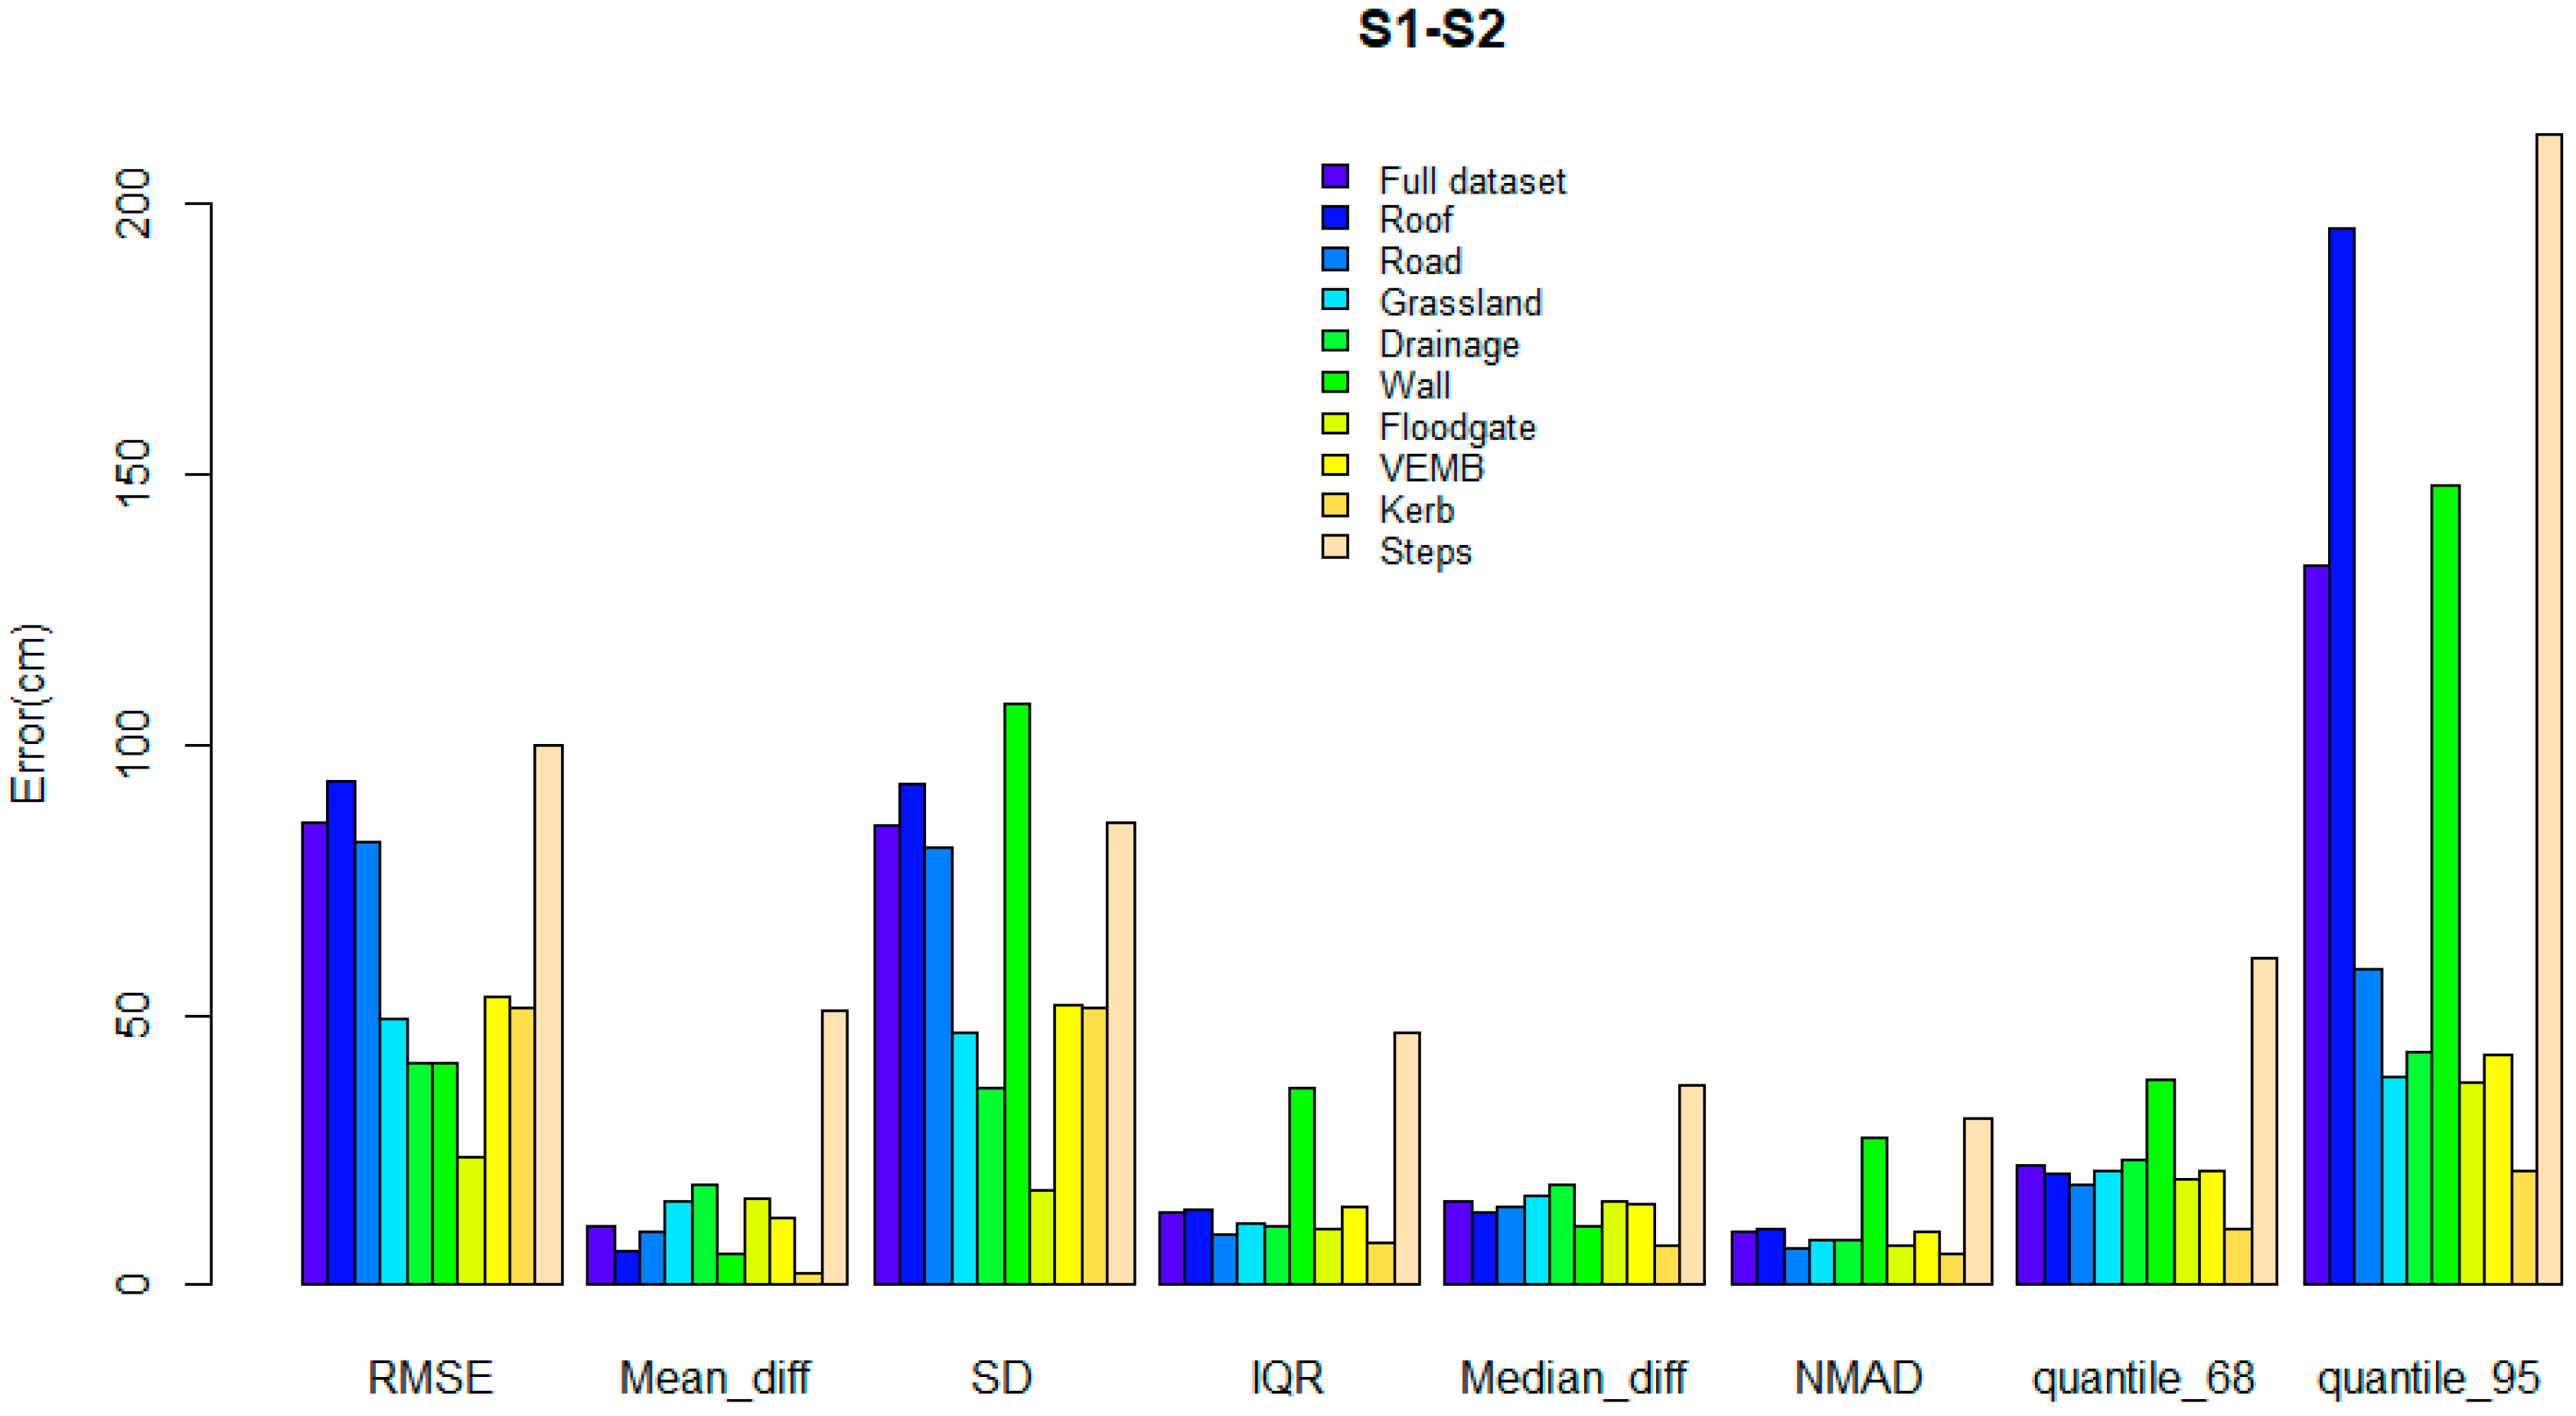
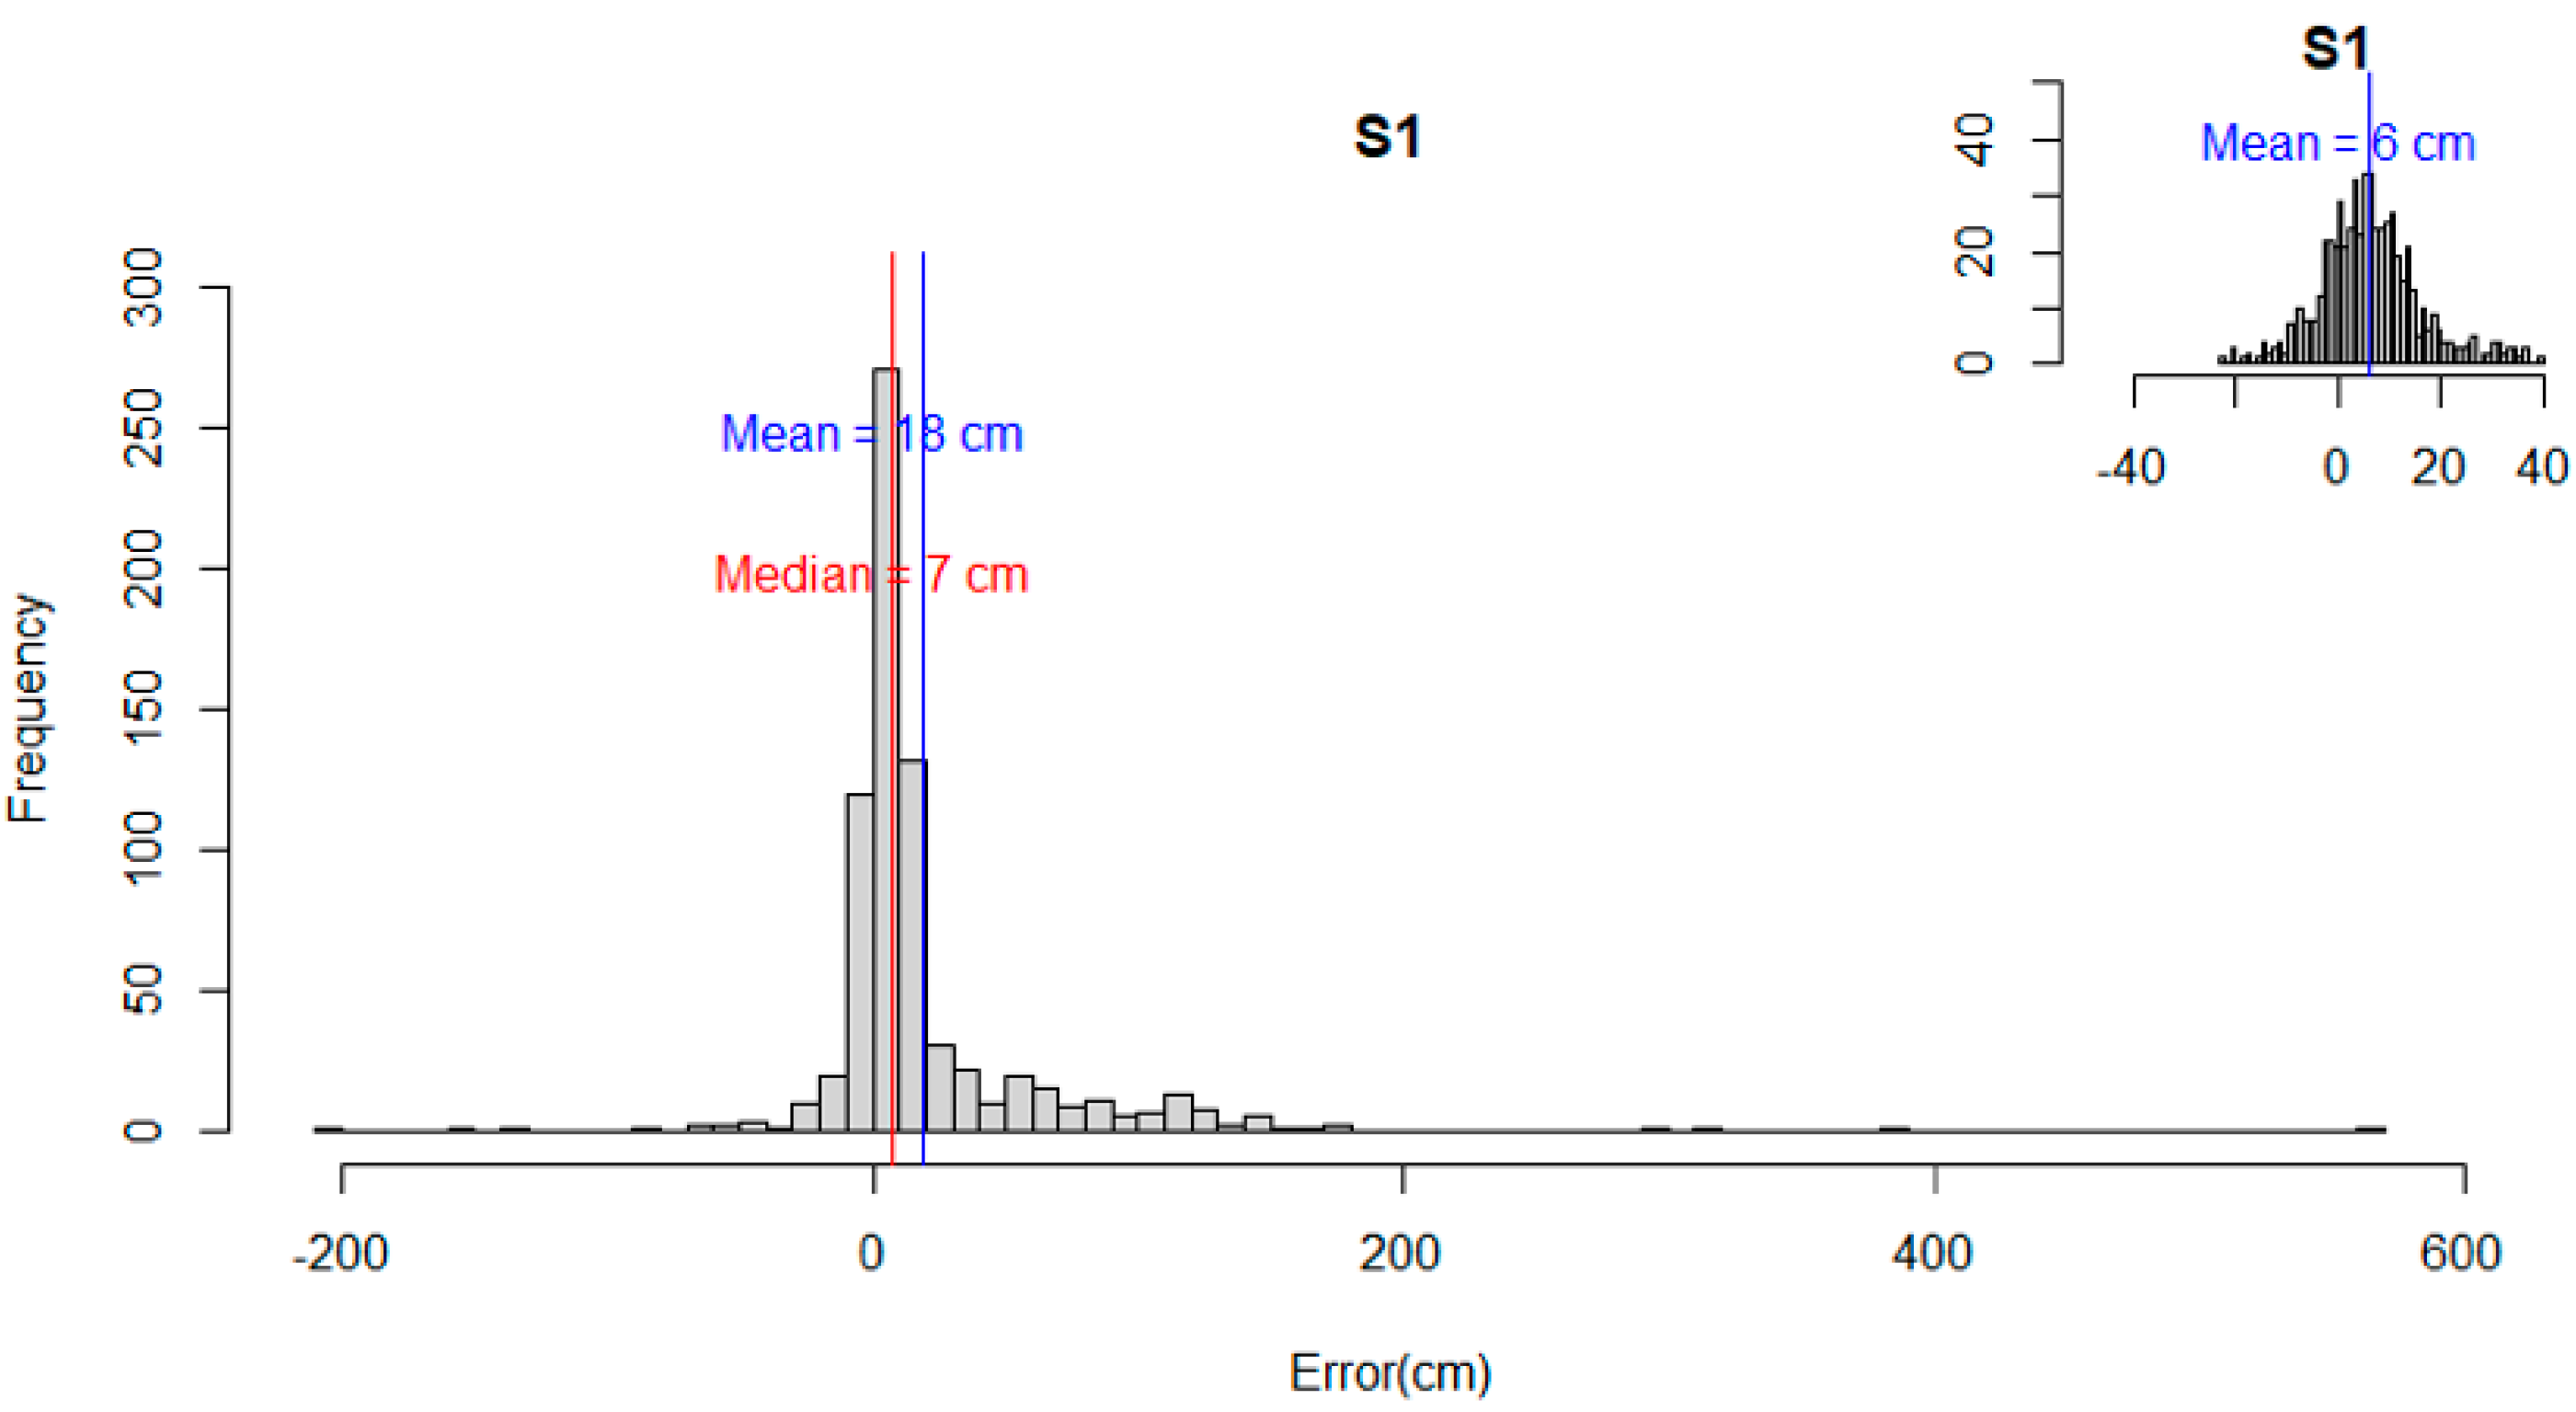
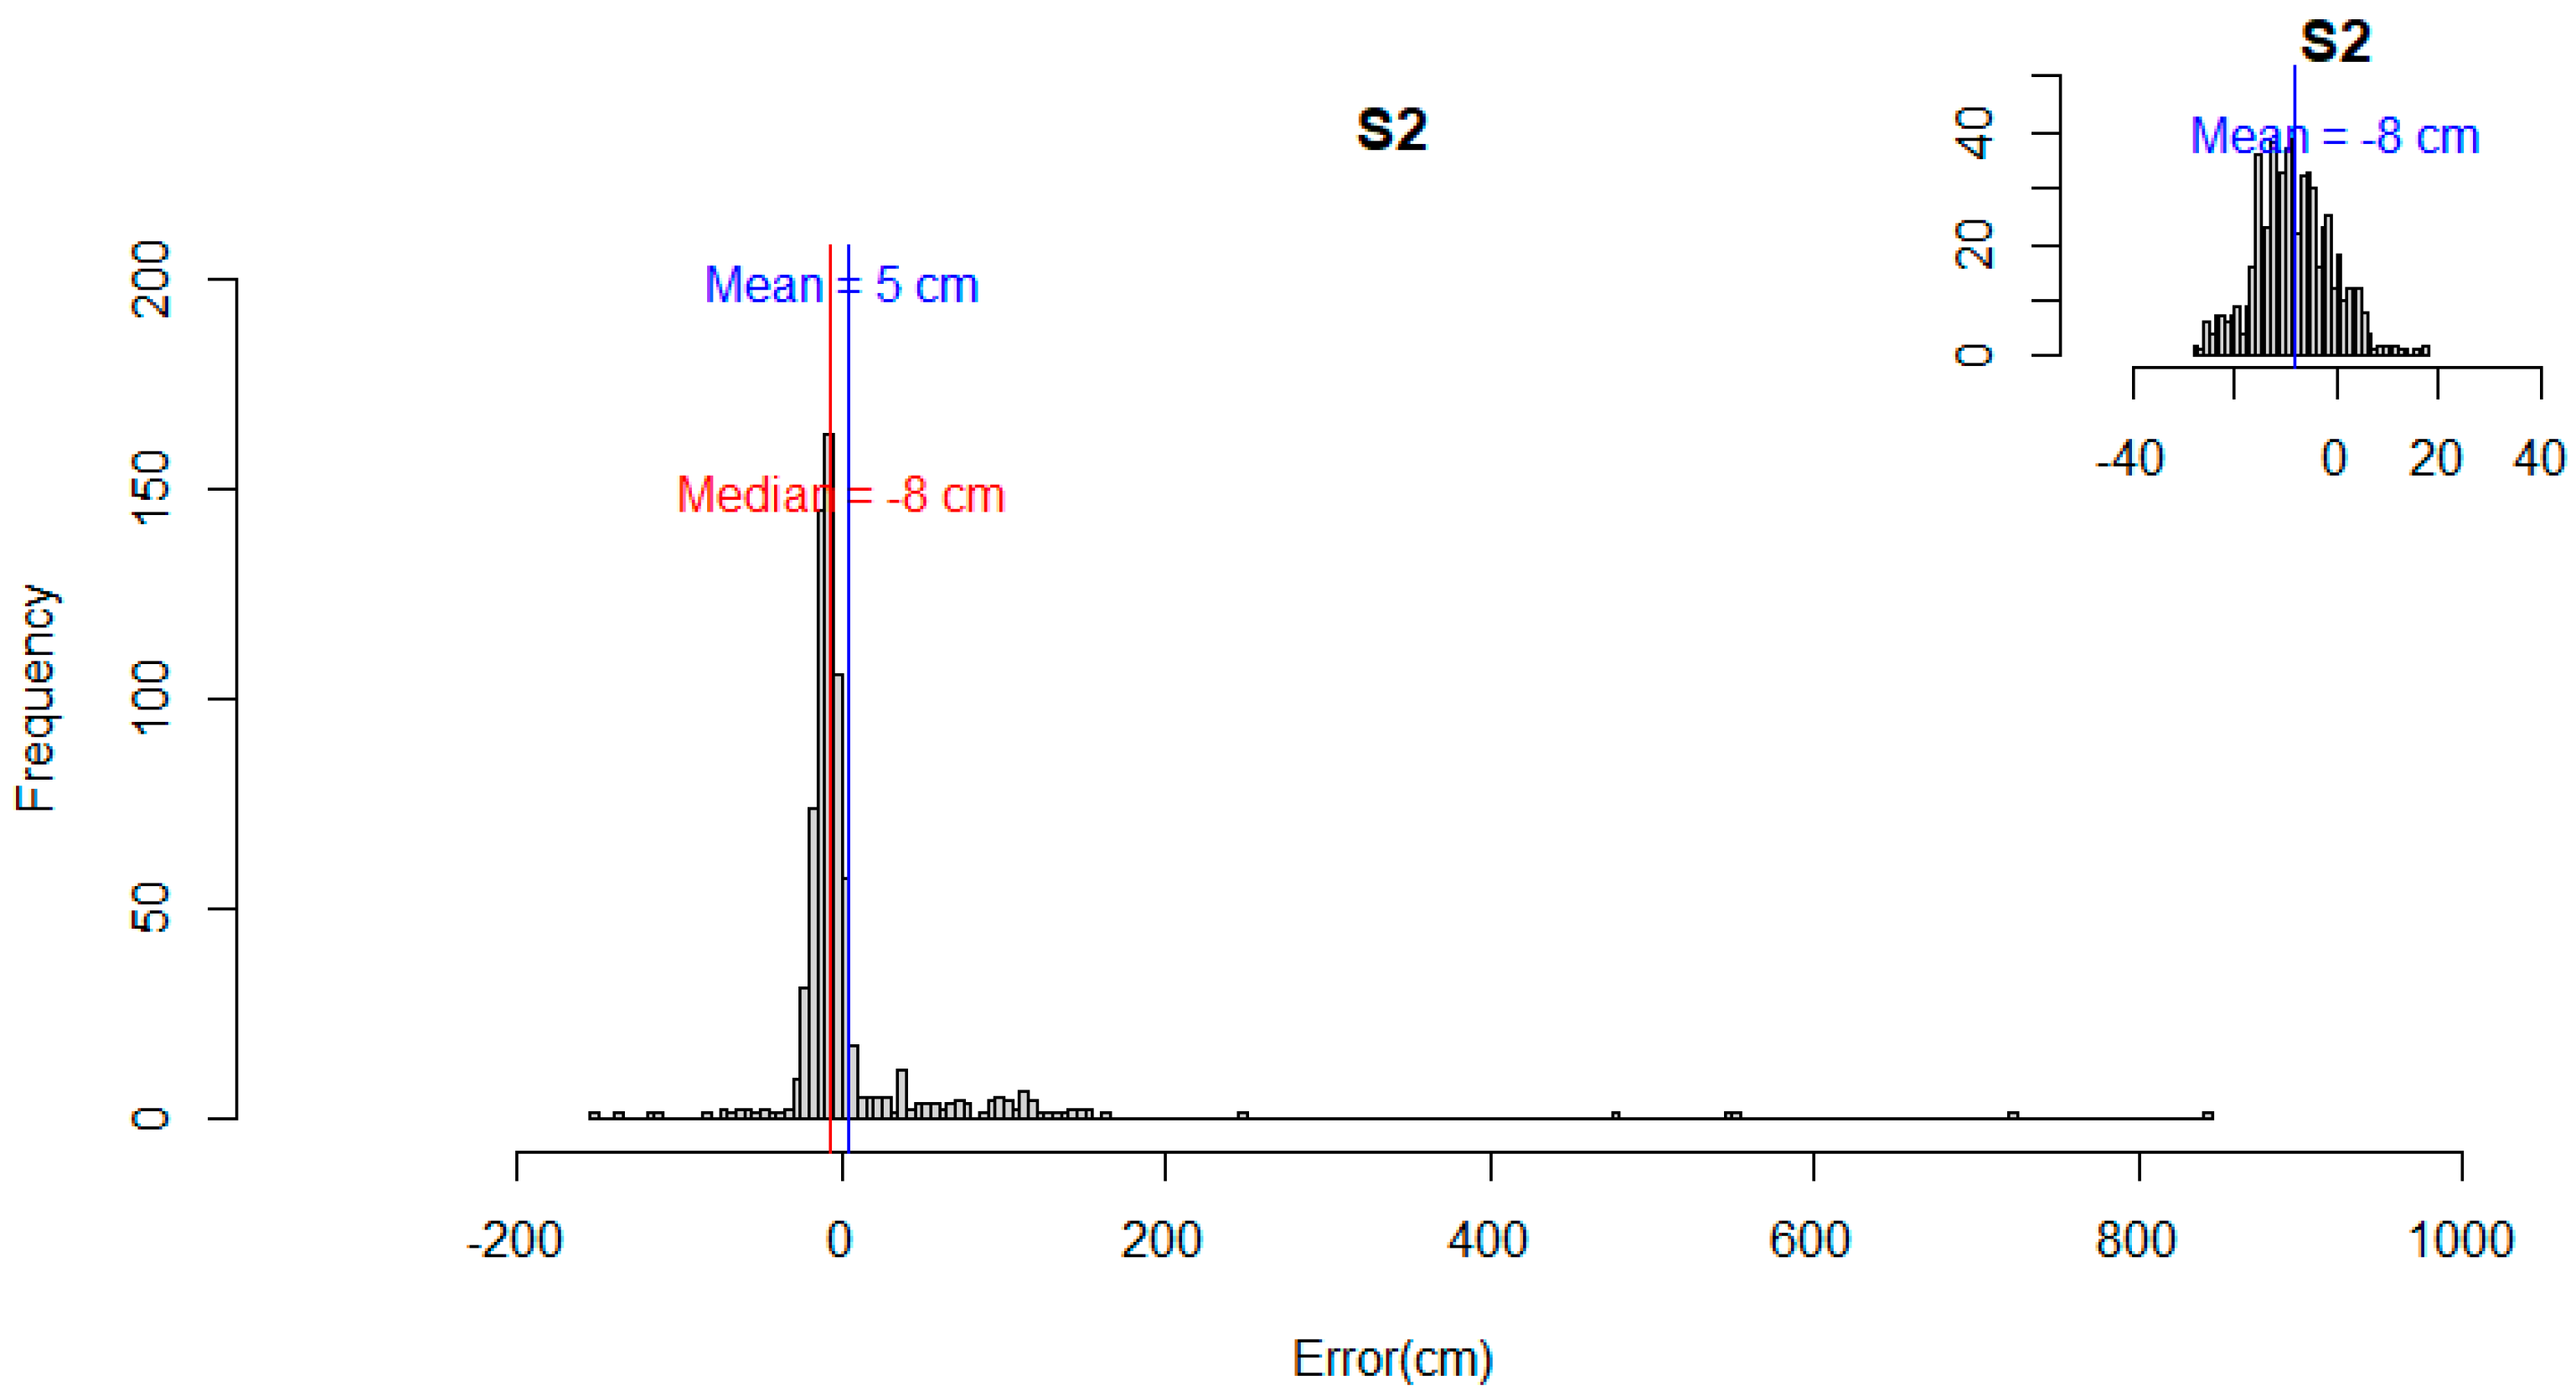
3.2. Difference in Elevation between S1 and S2
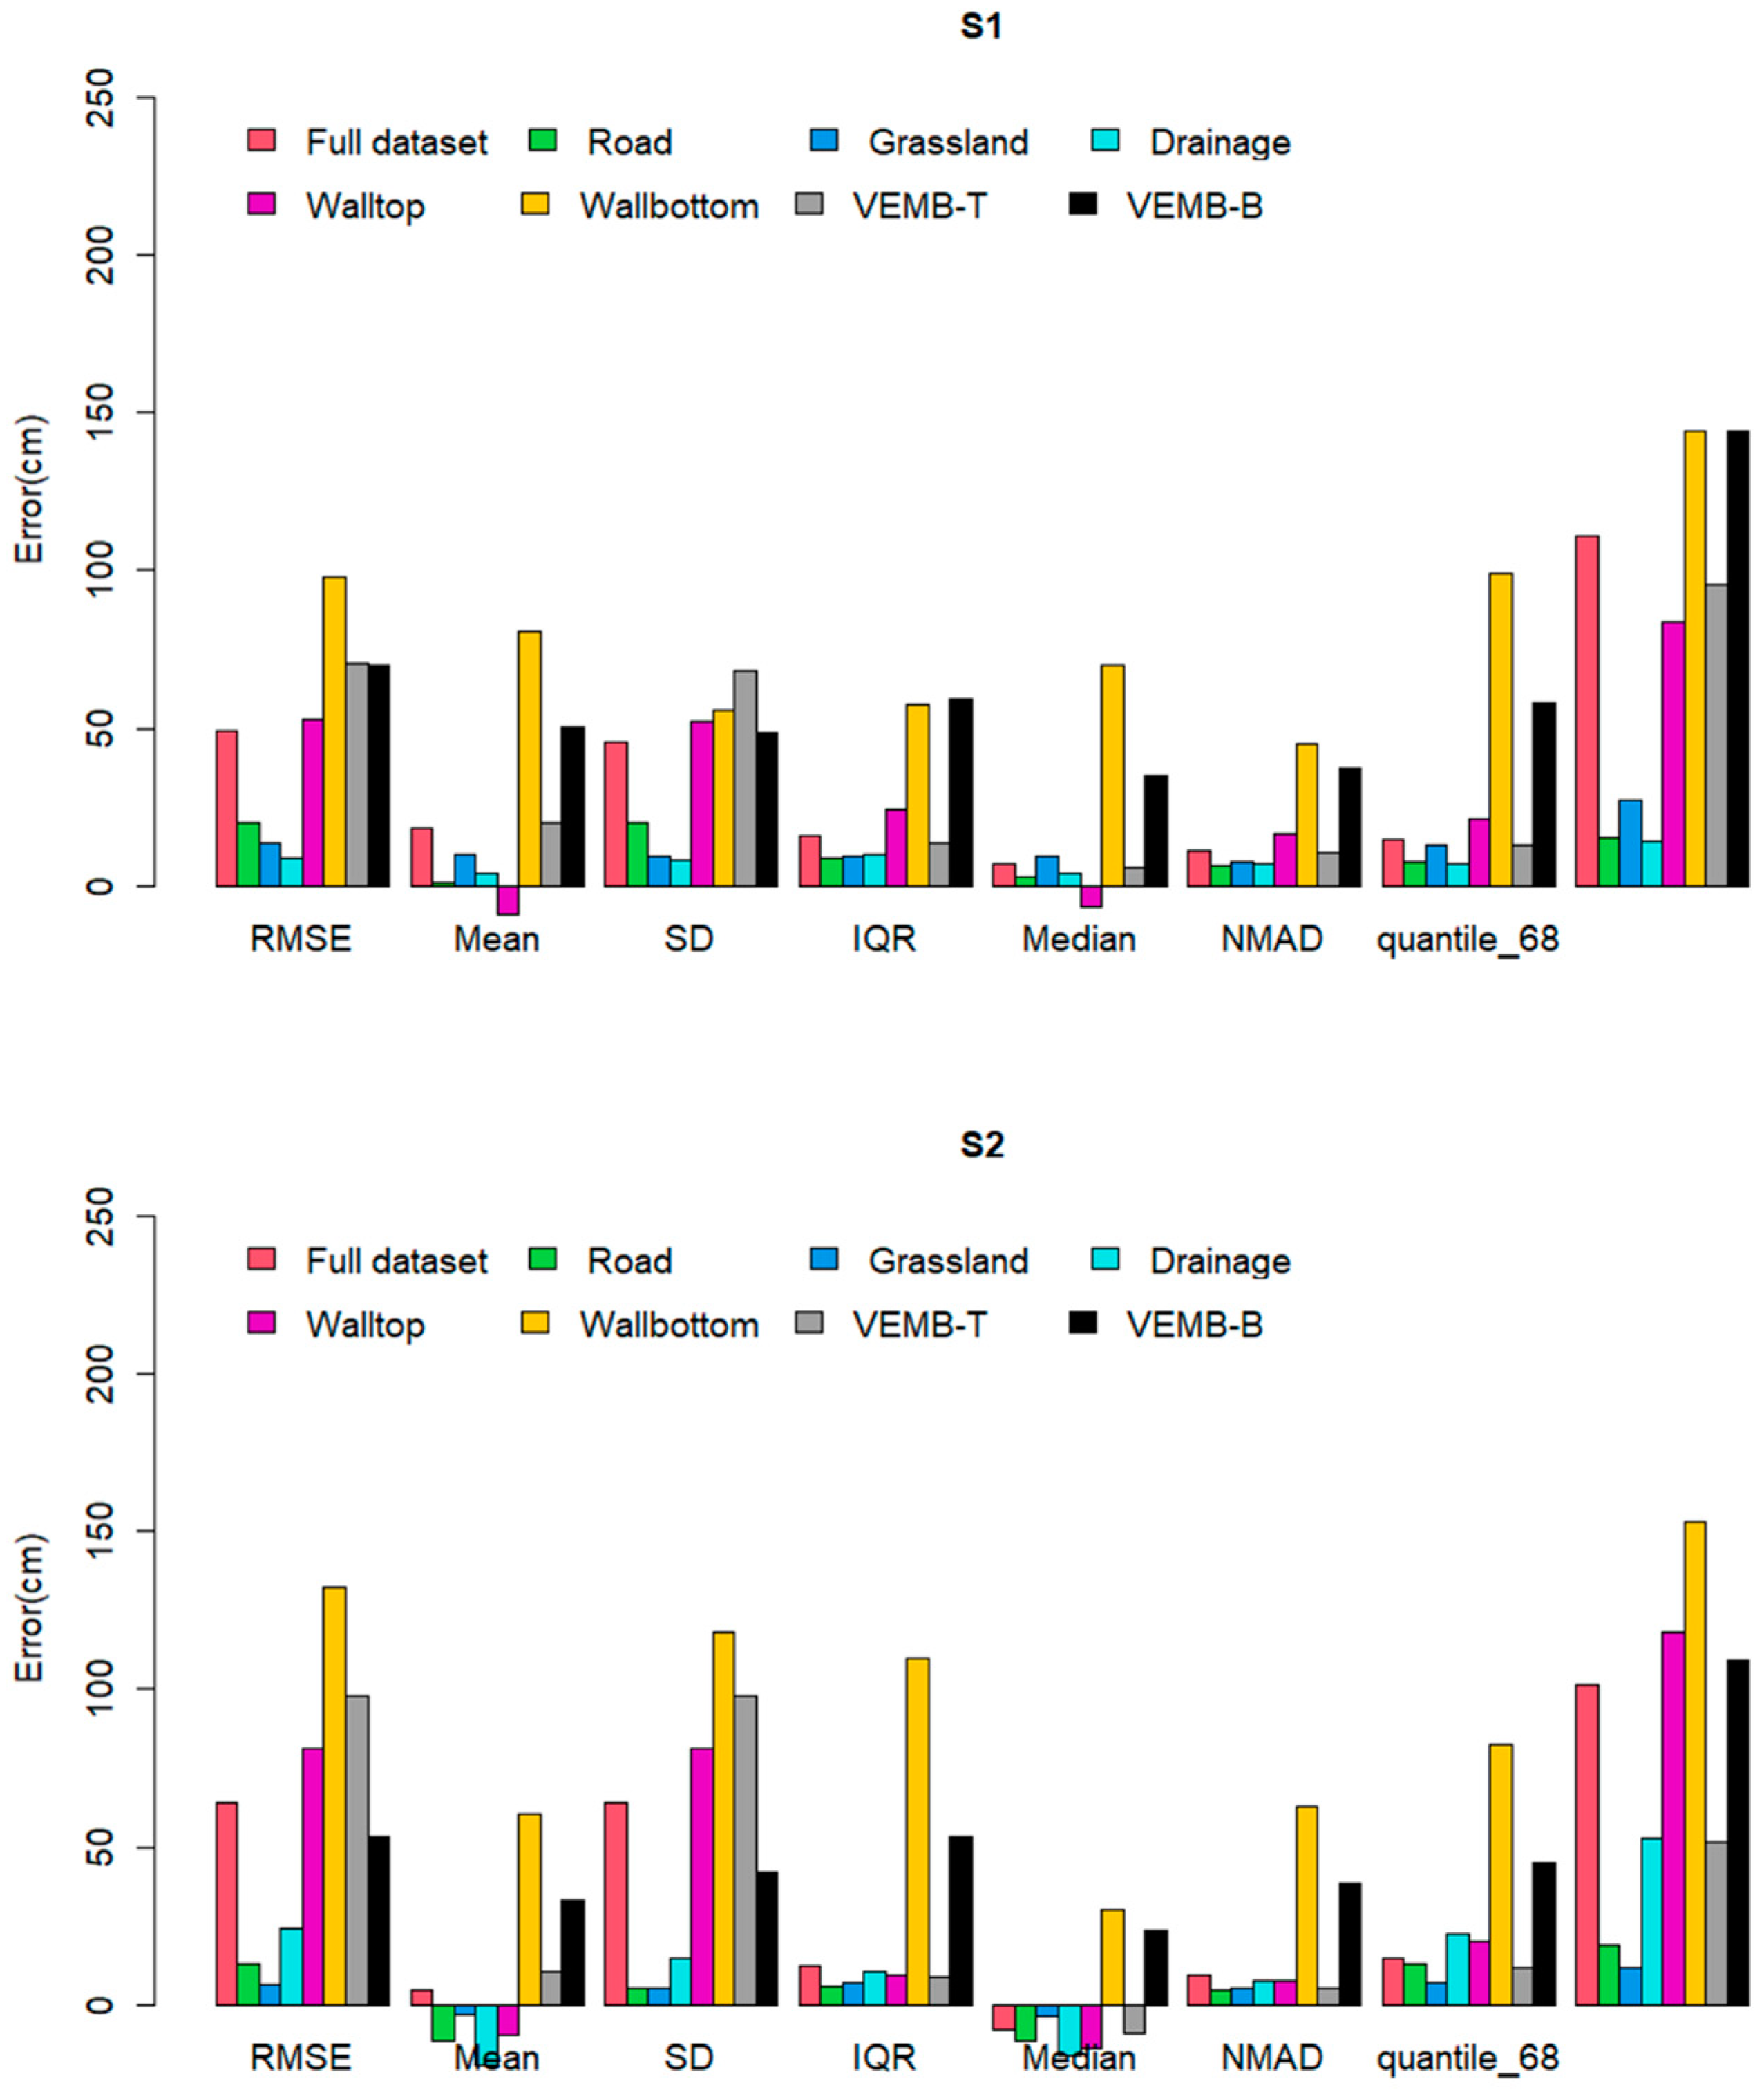
3.3. Validation
4. Discussion
4.1. Framework Development
4.2. Limitations and Future Work
5. Conclusions
Author Contributions
Funding
Data Availability Statement
Acknowledgments
Conflicts of Interest
References
- World Meteorological Organisation WMO. Provisional State of the Global Climate 2022. Available online: https://library.wmo.int/index.php?lvl=notice_display&id=22156#.ZCj4ktOS2Um (accessed on 16 May 2021).
- Kendon, M.; McCarthy, M.; Jevrejeva, S.; Matthews, A.; Sparks, T.; Garforth, J. State of the UK Climate 2019. Int. J. Climatol. 2020, 40, 1–69. [Google Scholar] [CrossRef]
- Environment Agency Surface Water: The Biggest Flood Risk of All. Available online: https://www.gov.uk/government/news/surface-water-the-biggest-flood-risk-of-all (accessed on 16 May 2021).
- Environment Agency Social Deprivation and the Likelihood of Flooding. Available online: http://www.gov.uk/government/organisations/environme (accessed on 25 August 2021).
- Environment Agency Flooding in England: A National Assessment of Flood Risk. Available online: www.environment-agency.gov.uk (accessed on 25 August 2021).
- Hunter, N.; Dale, A.; Hankin, B.; Lamb, R.; Lowis, A. Framework and Tools for Local Flood Risk Assessment: Project Report SC070059/R3; Environment Agency: Bristol, UK, 2014.
- Dottori, F.; di Baldassarre, G.; Todini, E. Detailed Data Is Welcome, but with a Pinch of Salt: Accuracy, Precision, and Uncertainty in Flood Inundation Modeling. Water Resour. Res. 2013, 49, 6079–6085. [Google Scholar] [CrossRef]
- Smith, R.C. Uncertainty Quantification: Theory, Implementation, and Applications; Siam: Philadelphia, PA, USA, 2013; Volume 12. [Google Scholar]
- Box, W.; Järvelä, J.; Västilä, K. Flow Resistance of Floodplain Vegetation Mixtures for Modelling River Flows. J. Hydrol. 2021, 601, 126593. [Google Scholar] [CrossRef]
- Fewtrell, T.J.; Duncan, A.; Sampson, C.C.; Neal, J.C.; Bates, P.D. Benchmarking Urban Flood Models of Varying Complexity and Scale Using High Resolution Terrestrial LiDAR Data. Phys. Chem. Earth 2011, 36, 281–291. [Google Scholar] [CrossRef]
- Yu, D.; Lane, S.N. Urban Fluvial Flood Modelling Using a Two-Dimensional Diffusion-Wave Treatment, Part 2: Development of a Sub-Grid-Scale Treatment. Process 2006, 20, 1567–1583. [Google Scholar] [CrossRef]
- Aronica, G.T.; Lanza, L.G. Drainage Efficiency in Urban Areas: A Case Study. Hydrol. Process 2005, 19, 1105–1119. [Google Scholar] [CrossRef]
- Palla, A.; Colli, M.; Candela, A.; Aronica, G.T.; Lanza, L.G. Pluvial Flooding in Urban Areas: The Role of Surface Drainage Efficiency. J. Flood Risk Manag. 2018, 11, S663–S676. [Google Scholar] [CrossRef]
- Backes, D.; Schumann, G.; Teferele, F.N.; Boehm, J. Towards a High-Resolution Drone-Based 3D Mapping Dataset to Optimise Flood Hazard Modelling. Int. Arch. Photogramm. Remote Sens. Spat. Inf. Sci. 2019, XLII-2-W13, 181–187. [Google Scholar] [CrossRef] [Green Version]
- Fewtrell, T.J.; Bates, P.D.; Horritt, M.; Hunter, N.M. Evaluating the Effect of Scale in Flood Inundation Modelling in Urban Environments. Hydrol. Process. Int. J. 2008, 22, 5107–5118. [Google Scholar] [CrossRef]
- Guo, K.; Guan, M.; Yu, D. Urban Surface Water Flood Modelling-a Comprehensive Review of Current Models and Future Challenges. Hydrol. Earth Syst. Sci. 2021, 25, 2843–2860. [Google Scholar] [CrossRef]
- Yu, D.; Lane, S.N. Interactions between Subgrid-Scale Resolution, Feature Representation and Grid-Scale Resolution in Flood Inundation Modelling. Hydrol. Process 2011, 25, 36–53. [Google Scholar] [CrossRef] [Green Version]
- Utlu, M.; Özdemir, H. How Much Spatial Resolution Do We Need to Model a Local Flood Event? Benchmark Testing Based on UAV Data from Biga River (Turkey). Arab. J. Geosci. 2020, 13, 1293. [Google Scholar] [CrossRef]
- Ozdemir, H.; Sampson, C.C.; De Almeida, G.A.M.; Bates, P.D. Evaluating Scale and Roughness Effects in Urban Flood Modelling Using Terrestrial LIDAR Data. Hydrol. Earth Syst. Sci. 2013, 17, 4015–4030. [Google Scholar] [CrossRef] [Green Version]
- Muthusamy, M.; Casado, M.R.; Salmoral, G.; Irvine, T.; Leinster, P. A Remote Sensing Based Integrated Approach to Quantify the Impact of Fluvial and Pluvial Flooding in an Urban Catchment. Remote Sens. 2019, 11, 577. [Google Scholar] [CrossRef] [Green Version]
- Muthusamy, M.; Casado, M.R.; Butler, D.; Leinster, P. Understanding the Effects of Digital Elevation Model Resolution in Urban Fluvial Flood Modelling. J. Hydrol. 2021, 596, 126088. [Google Scholar] [CrossRef]
- Roosevelt, C.H. Mapping Site-Level Microtopography with Real- Time Kinematic Global Navigation Satellite Systems (RTK GNSS) and Unmanned Aerial Vehicle Photogrammetry (UAVP). Open Archaeol. 2015, 1, 29–53. [Google Scholar] [CrossRef]
- Brubaker, K.M.; Myers, W.L.; Drohan, P.J.; Miller, D.A.; Boyer, E.W. The Use of LiDAR Terrain Data in Characterizing Surface Roughness and Microtopography. Appl. Environ. Soil Sci. 2013, 2013. [Google Scholar] [CrossRef]
- Mazzoleni, M.; Paron, P.; Reali, A.; Juizo, D.; Manane, J.; Brandimarte, L. Testing UAV-Derived Topography for Hydraulic Modelling in a Tropical Environment. Nat. Hazards 2020, 103, 139–163. [Google Scholar] [CrossRef]
- Sampson, C.C.; Fewtrell, T.J.; Duncan, A.; Shaad, K.; Horritt, M.S.; Bates, P.D. Use of Terrestrial Laser Scanning Data to Drive Decimetric Resolution Urban Inundation Models. Adv. Water Resour. 2012, 41, 1–17. [Google Scholar] [CrossRef]
- Agüera-Vega, F.; Agüera-Puntas, M.; Martínez-Carricondo, P.; Mancini, F.; Carvajal, F. Effects of Point Cloud Density, Interpolation Method and Grid Size on Derived Digital Terrain Model Accuracy at Micro Topography Level. Int. J. Remote Sens. 2020, 2020, 8281–8299. [Google Scholar] [CrossRef]
- Kopyść, P.T. The Use of Aerial Lidar and Structure from Motion (SFM) Photogrammetry Data in Analyzing Microtopographic Changes on Hiking Trails on the Example of Kielce (Poland). Carpathian J. Earth Environ. Sci. 2020, 15, 461–470. [Google Scholar] [CrossRef]
- Leitão, J.P.; de Sousa, L.M. Towards the Optimal Fusion of High-Resolution Digital Elevation Models for Detailed Urban Flood Assessment. J. Hydrol. 2018, 561, 651–661. [Google Scholar] [CrossRef]
- Leitão, J.P.; de Vitry, M.M.; Scheidegger, A.; Rieckermann, J. Assessing the Quality of Digital Elevation Models Obtained from Mini Unmanned Aerial Vehicles for Overland Flow Modelling in Urban Areas. Hydrol. Earth Syst. Sci. 2016, 20, 1637–1653. [Google Scholar] [CrossRef] [Green Version]
- Annis, A.; Nardi, F.; Petroselli, A.; Apollonio, C.; Arcangeletti, E.; Tauro, F.; Belli, C.; Bianconi, R.; Grimaldi, S. UAV-DEMs for Small-Scale Flood Hazard Mapping. Water 2020, 12, 1717. [Google Scholar] [CrossRef]
- Hashemi-Beni, L.; Gebrehiwot, A.A. Flood Extent Mapping: An Integrated Method Using Deep Learning and Region Growing Using UAV Optical Data. IEEE J. Sel. Top Appl. Earth Obs. Remote Sens. 2021, 14, 2127–2135. [Google Scholar] [CrossRef]
- Hashemi-Beni, L.; Jones, J.; Thompson, G.; Johnson, C.; Gebrehiwot, A. Challenges and Opportunities for UAV-Based Digital Elevation Model Generation for Flood-Risk Management: A Case of Princeville, North Carolina. Sensors 2018, 18, 3843. [Google Scholar] [CrossRef] [Green Version]
- National LIDAR Programme-Data.Gov.Uk. Available online: https://www.data.gov.uk/dataset/f0db0249-f17b-4036-9e65-309148c97ce4/national-lidar-programme (accessed on 24 August 2022).
- Nex, F.; Rinaudo, F. LiDAR or Photogrammetry? Integration Is the Answer. Ital. J. Remote Sens. 2011, 43, 107–121. [Google Scholar] [CrossRef] [Green Version]
- Abily, M.; Duluc, C.-M. Photogrammetric and LiDAR Data for High Resolution Runoff Modeling over Industrial and Urban Sites. In 2013 IAHR World Congress; Tsinghua University Press: Beijing, China, 2013. [Google Scholar]
- Zawadzka, J.; Truckell, I.; Khouakhi, A.; Rivas Casado, M.; Alexakis, D. Detection of Flood Damage in Urban Residential Areas Using Object-Oriented UAV Image Analysis Coupled with Tree-Based Classifiers. Remote Sens. 2021, 13, 3913. [Google Scholar] [CrossRef]
- Wedajo, G.K. LiDAR DEM Data for Flood Mapping and Assessment; Opportunities and Challenges: A Review. J. Remote Sens. GIS 2017, 06, 210. [Google Scholar] [CrossRef]
- Trepekli, K.; Friborg, T.; Balstrøm, T.; Fog, B.; Allotey, A.; Kofie, R.Y.; Møller-Jensen, L. UAV-LiDAR Observations Increase the Precision of Urban Flood Modelling in Accra by Detecting Critical Micro-Topographic Features. In Proceedings of the EGU General Assembly 2021, online, 19–30 April 2021. [Google Scholar] [CrossRef]
- Villanueva, J.R.E.; Martínez, L.I.; Montiel, J.I.P. DEM Generation from Fixed-Wing UAV Imaging and LiDAR-Derived Ground Control Points for Flood Estimations. Sensors 2019, 19, 3205. [Google Scholar] [CrossRef] [Green Version]
- Salmoral, G.; Casado, M.R.; Muthusamy, M.; Butler, D.; Menon, P.P.; Leinster, P. Guidelines for the Use of Unmanned Aerial Systems in Flood Emergency Response. Water 2020, 12, 521. [Google Scholar] [CrossRef] [Green Version]
- Office for National Statistics Population Estimates for the UK, England and Wales, Scotland and Northern Ireland. Available online: https://www.ons.gov.uk/peoplepopulationandcommunity/populationandmigration/populationestimates/bulletins/annualmidyearpopulationestimates/mid2020#local-area-population-change (accessed on 29 July 2021).
- Population Statistics. Available online: http://citypopulation.de/en/uk/northwestengland/cumbria/E34004122__cockermouth/ (accessed on 4 November 2021).
- Cumbria County Council. Cumbria Resilience A Review of Recovery Processes Following Storm Desmond’s Impacts on Cumbria (5 Th/6 Th Dec 2015); Cumbria County Council: Carlisle, UK, 2018.
- Casado, M.R.; Irvine, T.; Johnson, S.; Palma, M.; Leinster, P. The Use of Unmanned Aerial Vehicles to Estimate Direct Tangible Losses to Residential Properties from Flood Events: A Case Study of Cockermouth Following the Desmond Storm. Remote Sens. 2018, 10, 1548. [Google Scholar] [CrossRef] [Green Version]
- Cockermouth, Cumbria, United Kingdom Historical Weather Almanac. Available online: https://www.worldweatheronline.com/cockermouth-weather-history/cumbria/gb.aspx (accessed on 5 November 2021).
- Galaxy|Teledyne Geospatial. Available online: http://www.teledyneoptech.com/en/products/airborne-survey/galaxy/ (accessed on 1 April 2022).
- Formulario Para Peticion de Mensajes Aeronauticos. Available online: https://ogimet.com/metars.phtml.en (accessed on 1 April 2022).
- Chow, T.E.; Hodgson, M.E. Effects of Lidar Post-Spacing and DEM Resolution to Mean Slope Estimation. Int. J. Geogr. Inf. Sci. 2009, 23, 1277–1295. [Google Scholar] [CrossRef]
- Höhle, J.; Höhle, M. Accuracy Assessment of Digital Elevation Models by Means of Robust Statistical Methods. ISPRS J. Photogramm. Remote Sens. 2009, 64, 398–406. [Google Scholar] [CrossRef] [Green Version]
- OS MasterMap® Topography Layer [FileGeoDatabase Geospatial Data], Scale 1:1250, Tiles: GB, Updated: 6 August 2020, Ordnance Survey (GB), Using: EDINA Digimap Ordnance Survey Service. Available online: https://Digimap.Edina.Ac.Uk (accessed on 17 June 2021).
- Feng, Y.; Xiao, Q.; Brenner, C.; Peche, A.; Yang, J.; Feuerhake, U.; Sester, M. Determination of Building Flood Risk Maps from LiDAR Mobile Mapping Data. Comput. Environ. Urban Syst. 2022, 93, 101759. [Google Scholar] [CrossRef]
- Chen, K.; Blong, R. Extracting Building Features from High Resolution Aerial Imagery for Natural Hazards Risk Assessment; Extracting Building Features from High Resolution Aerial Imagery for Natural Hazards Risk Assessment. Int. Geosci. Remote Sens. Symp. (IGARSS) 2002, 4, 2039–2041. [Google Scholar] [CrossRef]
- Vacca, G.; Dessì, A.; Sacco, A. The Use of Nadir and Oblique UAV Images for Building Knowledge. ISPRS Int. J. Geo-Inf. 2017, 6, 393. [Google Scholar] [CrossRef] [Green Version]
- Piech, I.; Ruzyczka, A. Generating of Building Facades Orthophotoplans with UAV and Terrestrial Photos. IOP Conf. Ser. Earth Environ. Sci. 2019, 221, 012074. [Google Scholar] [CrossRef]
- Sinagra, M.; Nasello, C.; Tucciarelli, T. Urban Flood Prediction through GIS-Based Dual-Coupled Hydraulic Models. Hydrology 2022, 9, 174. [Google Scholar] [CrossRef]
- Shrestha, A.; Mascaro, G.; Garcia, M. Effects of Stormwater Infrastructure Data Completeness and Model Resolution on Urban Flood Modeling. J. Hydrol. 2022, 607, 127498. [Google Scholar] [CrossRef]
- 25 Year Environment Plan Annual Progress Report-April 2021 to March 2022; HH Associates Ltd.: London, UK, 2021; ISBN 978-1-5286-3643-8.
- DEFRA. Measuring Environmental Change: Outcome Indicator Framework for the 25 Year Environment Plan; DEFRA: London, UK, 2019.
- Shen, D.; Wang, J.; Cheng, X.; Rui, Y.; Ye, S. Integration of 2-D Hydraulic Model and High-Resolution Lidar-Derived DEM for Floodplain Flow Modeling. Hydrol. Earth Syst. Sci. 2015, 19, 3605–3616. [Google Scholar] [CrossRef] [Green Version]
- Schumann, G.J.P.; Bates, P.D. Editorial: The Need for a High-Accuracy, Open-Access Global Digital Elevation Model. Front. Earth Sci. 2020, 8, 544. [Google Scholar] [CrossRef]
- Backes, D.J.; Teferle, F.N. Multiscale Integration of High-Resolution Spaceborne and Drone-Based Imagery for a High-Accuracy Digital Elevation Model Over Tristan Da Cunha. Front. Earth Sci. 2020, 8, 319. [Google Scholar] [CrossRef]
- Lama, G.F.C.; Errico, A.; Francalanci, S.; Solari, L.; Preti, F.; Chirico, G.B. Evaluation of Flow Resistance Models Based on Field Experiments in a Partly Vegetated Reclamation Channel. Geosciences 2020, 10, 47. [Google Scholar] [CrossRef] [Green Version]
- Comparison of Aerial Surveying with a Manned Aircraft or UAS for Mapping and 3D Modelling?|Geo-Matching.Com. Available online: https://geo-matching.com/content/comparison-of-aerial-surveying-with-a-manned-aircraft-or-uas-for-mapping-and-3d-modelling (accessed on 24 February 2023).


| Parameter | Specifications |
|---|---|
| Topographic laser | 1064 nm-near-infrared |
| Laser classification | Class IV (US FDA 21 CFR 1040.10 and 1040.11; IEC/EN 60825-1) |
| Beam divergence | 0.25 mrad (1/e) |
| Operating altitudes (1,2,3,4) | 634–1474 m AGL, nominal |
| Effective pulse repetition frequency | 400–550 Hz |
| Laser range precision | <0.008 m, 1 σ |
| Scan angle (FOV) | 36–60° |
| Swath width | 0–115% of AGL |
| Scan frequency | 100 Hz |
| Absolute horizontal accuracy (2,3) | 1/10,000 × altitude; 1 σ |
| Absolute elevation accuracy (2,3) | <0.03–0.20 m RMSE from 150–4700 m AGL |
| Land Use | Analysis | Description |
|---|---|---|
| Road * (343 points) | D and V | Paved roads, including streets and highways. |
| Grassland*(585 points) | D and V | Areas dominated by grass where the soil has more permeability than the manmade road. |
| Roofs | D | All manmade structures including residential and commercial. |
| Microtopographic features | Analysis | Description |
| Drainage * (210 points) | D and V | Inlet point that collects surface water to discharge into sewers. Gully points along roads. |
| Wall * (431 points) | D and V | A structure constructed around the boundary of a property that controls or stops the flow of water. It also includes flood management structures. |
| Flood gate * (11 points) | D and V | A gate structure that can be opened and closed and prevents the flow of water into the property. |
| Vegetated crest * (451 points) | D and V | A raised embankment that controls the water from rivers. |
| Road Kerb | D | A raised edge of a paved road that guides surface water into drainage features. |
| Steps | D | A physical barrier that stops entry of surface water into properties. |
| Statistic | Equation |
|---|---|
| RMSEe | |
| Mean error | |
| Standard deviation | |
| Median | |
| NMAD | ) |
| 68.3% Quantile | |
| 95% Quantile |
Disclaimer/Publisher’s Note: The statements, opinions and data contained in all publications are solely those of the individual author(s) and contributor(s) and not of MDPI and/or the editor(s). MDPI and/or the editor(s) disclaim responsibility for any injury to people or property resulting from any ideas, methods, instructions or products referred to in the content. |
© 2023 by the authors. Licensee MDPI, Basel, Switzerland. This article is an open access article distributed under the terms and conditions of the Creative Commons Attribution (CC BY) license (https://creativecommons.org/licenses/by/4.0/).
Share and Cite
Ramachandran, R.; Bajón Fernández, Y.; Truckell, I.; Constantino, C.; Casselden, R.; Leinster, P.; Rivas Casado, M. Accuracy Assessment of Surveying Strategies for the Characterization of Microtopographic Features That Influence Surface Water Flooding. Remote Sens. 2023, 15, 1912. https://doi.org/10.3390/rs15071912
Ramachandran R, Bajón Fernández Y, Truckell I, Constantino C, Casselden R, Leinster P, Rivas Casado M. Accuracy Assessment of Surveying Strategies for the Characterization of Microtopographic Features That Influence Surface Water Flooding. Remote Sensing. 2023; 15(7):1912. https://doi.org/10.3390/rs15071912
Chicago/Turabian StyleRamachandran, Rakhee, Yadira Bajón Fernández, Ian Truckell, Carlos Constantino, Richard Casselden, Paul Leinster, and Mónica Rivas Casado. 2023. "Accuracy Assessment of Surveying Strategies for the Characterization of Microtopographic Features That Influence Surface Water Flooding" Remote Sensing 15, no. 7: 1912. https://doi.org/10.3390/rs15071912