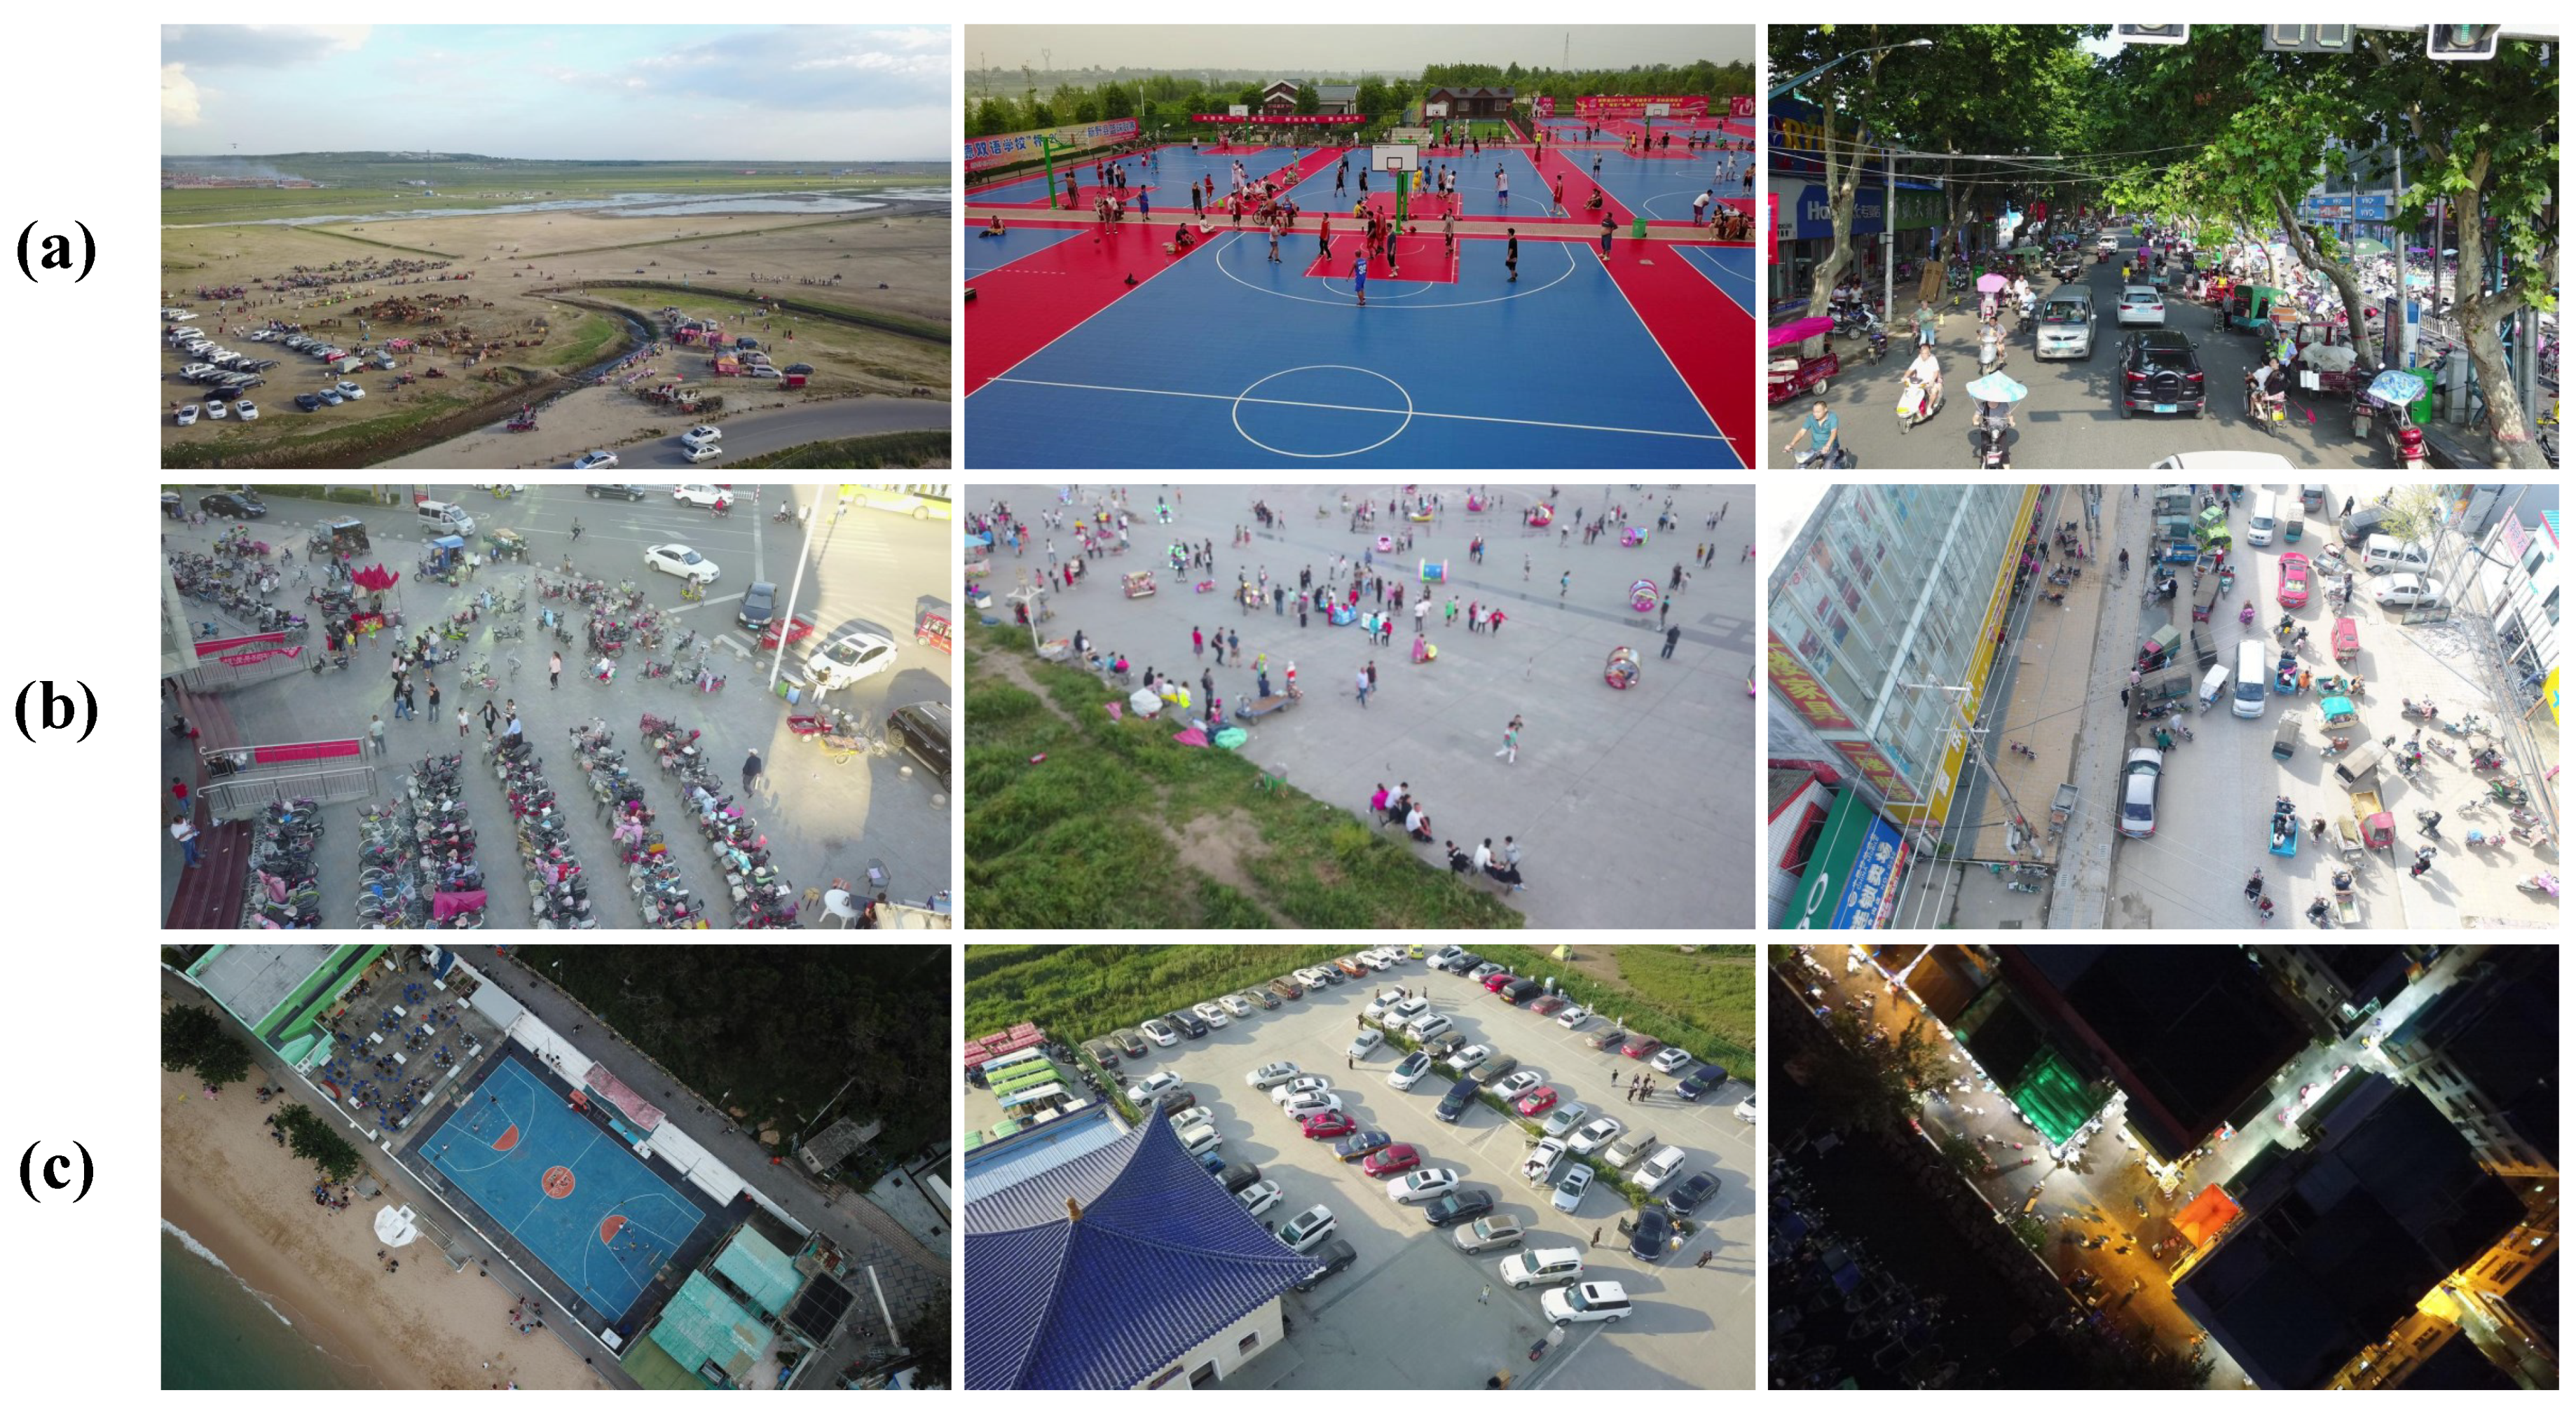
Figure 1.
Intuitive cases to explain the three main problems in object detection in drone-captured images. The cases in row (a), (b), and (c), respectively, show the size variation, high-density, and large coverage of objects in drone-captured images.
Figure 1.
Intuitive cases to explain the three main problems in object detection in drone-captured images. The cases in row (a), (b), and (c), respectively, show the size variation, high-density, and large coverage of objects in drone-captured images.
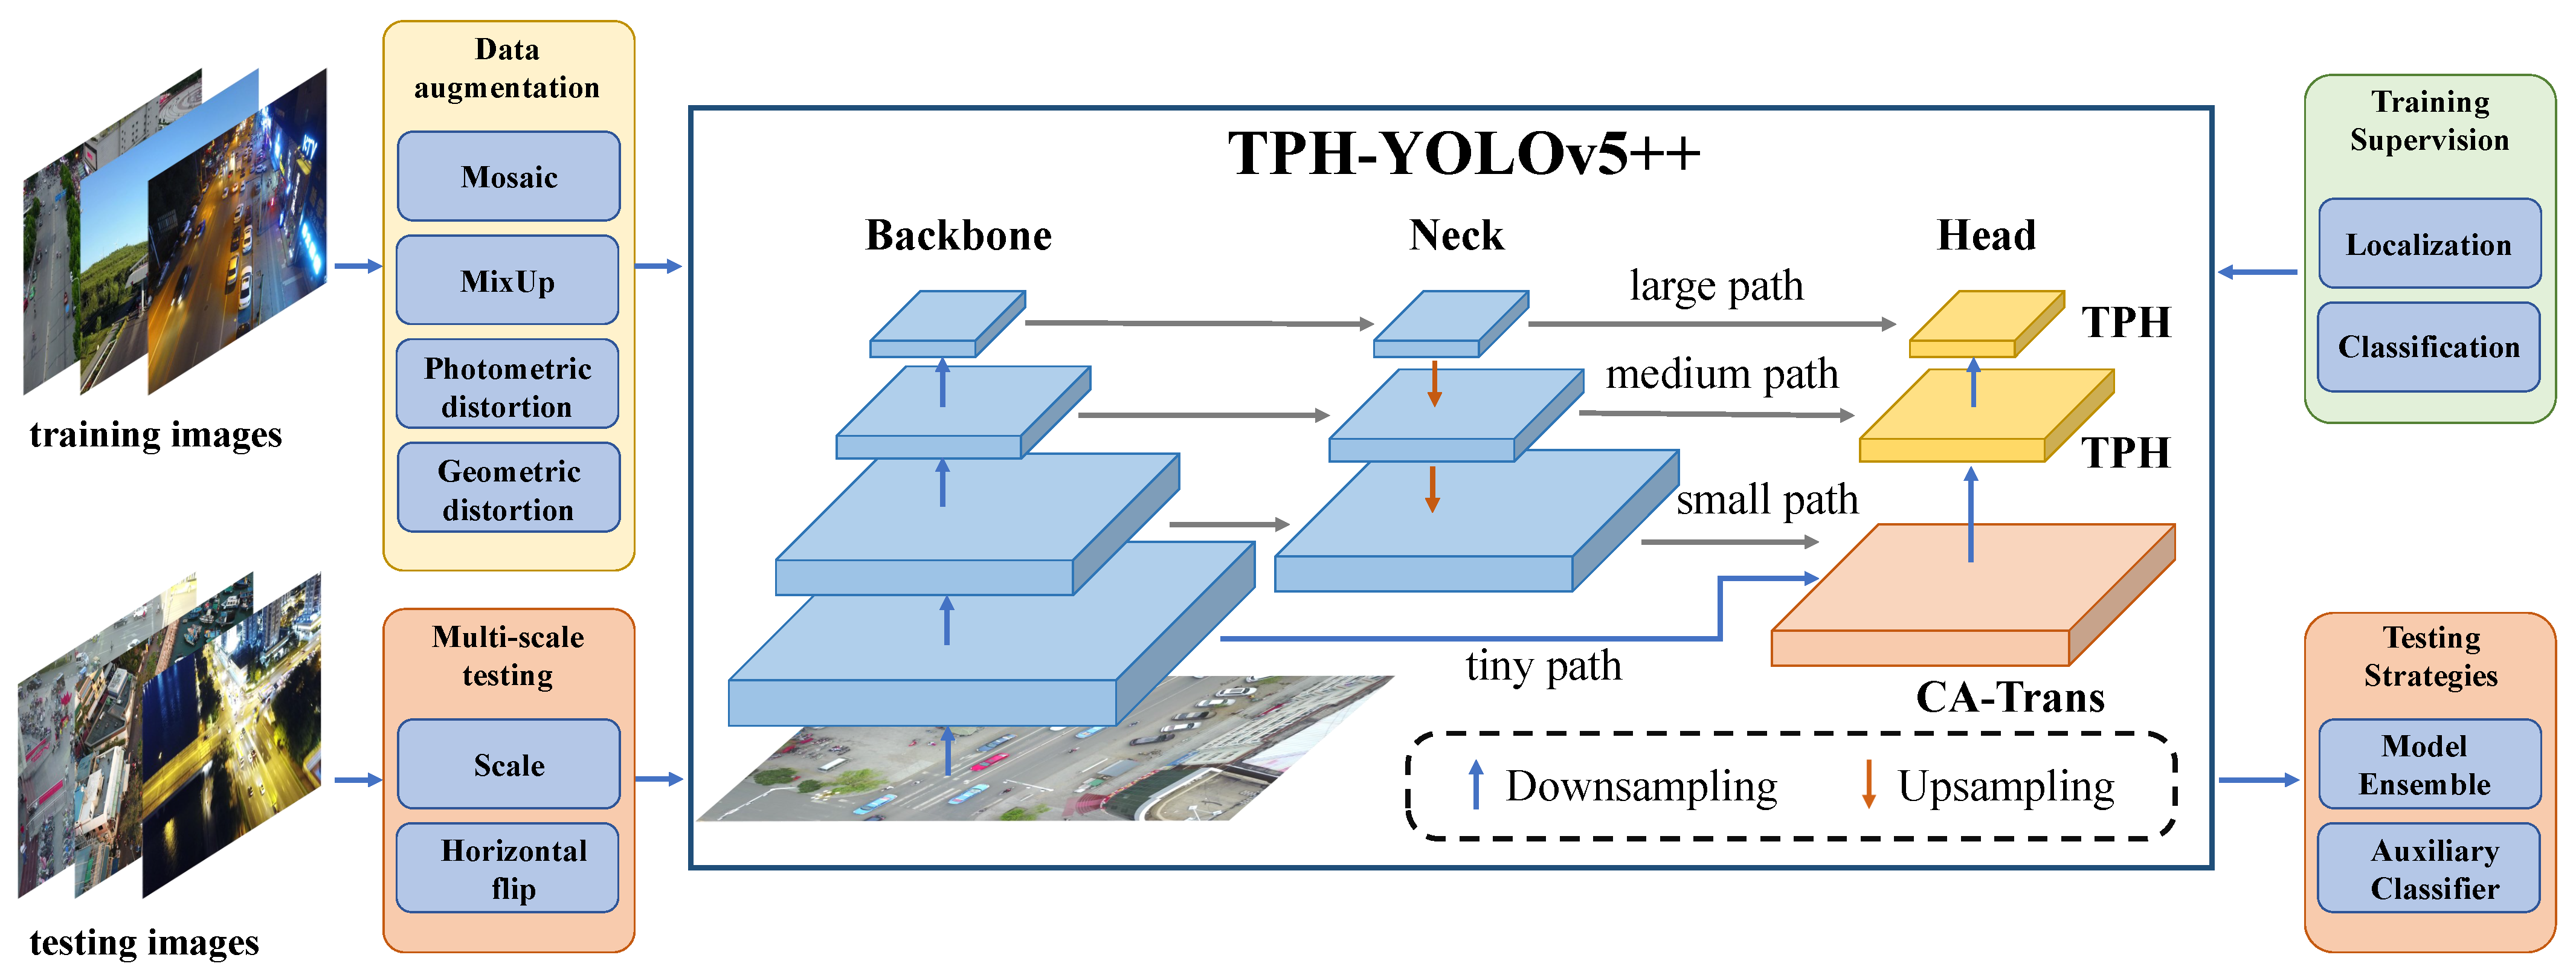
Figure 2.
Overview of the working pipeline using TPH-YOLOv5++. Compared to the original YOLOv5, our TPH-YOLOv5 proposes an addition prediction head, four transformer prediction heads (TPH), and tricks to improve detection performance. Based on TPH-YOLOv5, TPH-YOLOv5++ designs a cross-layer asymmetric transformer (CA-Trans) to replace the tiny object detection head and transfer knowledge to the small object detection head.
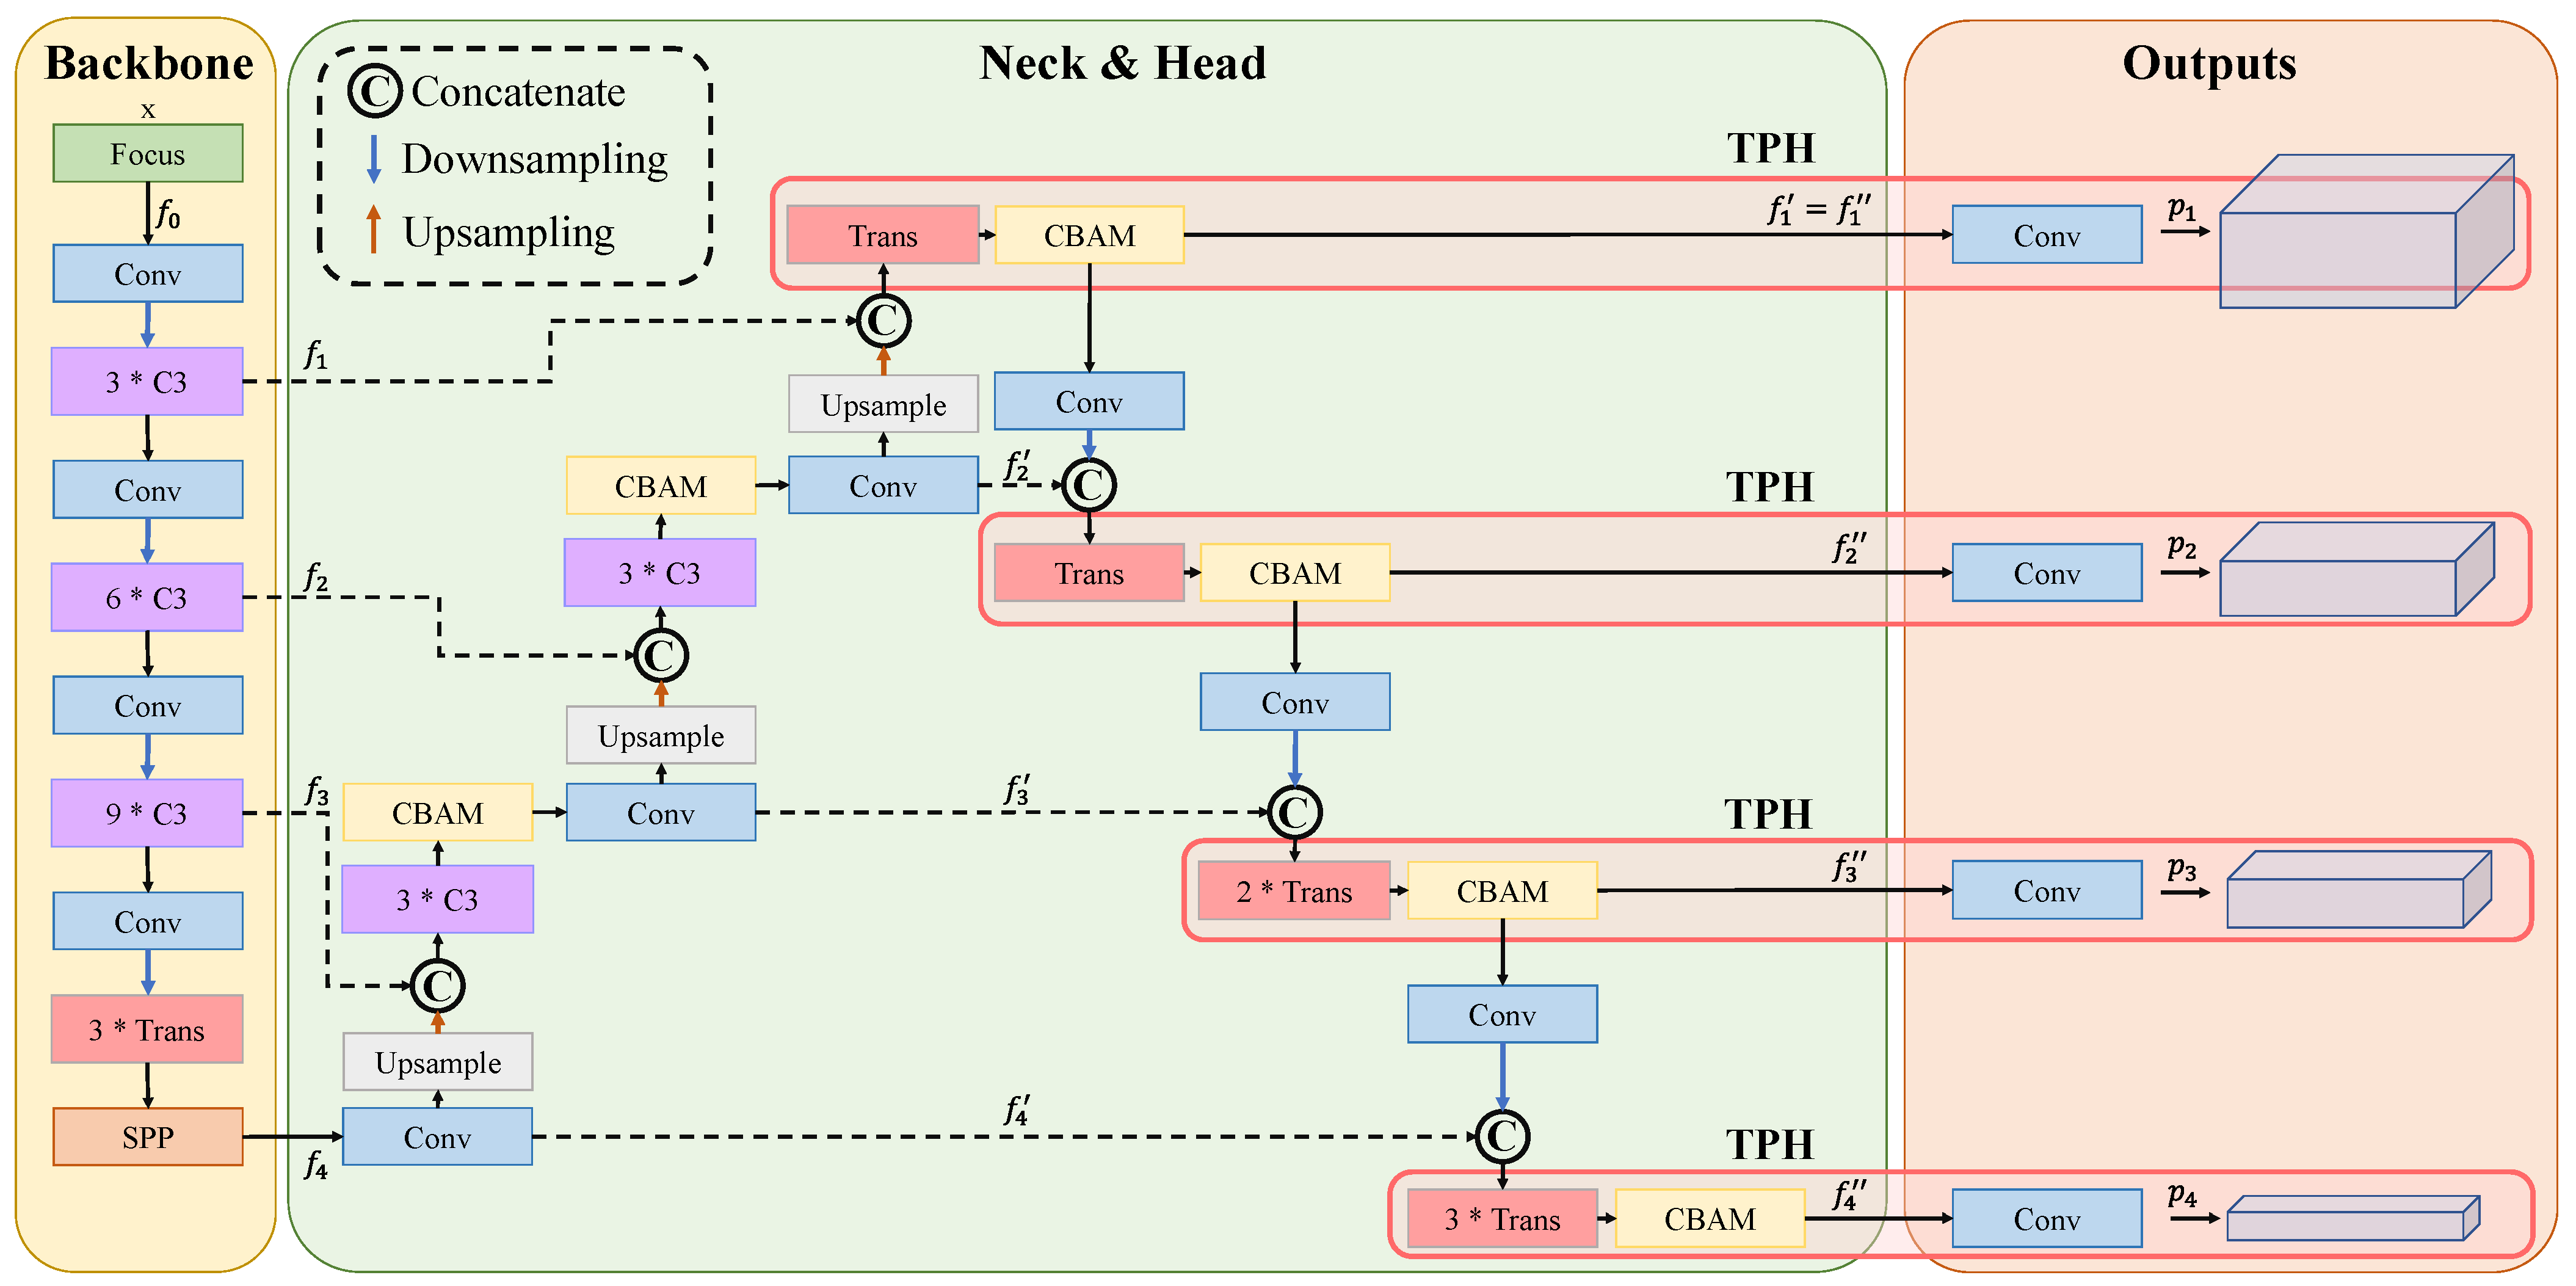
Figure 3.
The architecture of TPH-YOLOv5. TPH-YOLOv5 introduces an additional head, transformer prediction head (TPH), and convolutional block attention module (CBAM). Four prediction heads are named tiny, small, medium, and large heads, and the branches before these heads are tiny, small, medium, and large paths.
Figure 4.
The distributions of confidence of each prediction bounding box generated by four prediction heads. The bounding boxes are split into correct boxes and wrong boxes. The first and second row are the distributions of correct and wrong boxes, respectively.
Figure 4.
The distributions of confidence of each prediction bounding box generated by four prediction heads. The bounding boxes are split into correct boxes and wrong boxes. The first and second row are the distributions of correct and wrong boxes, respectively.
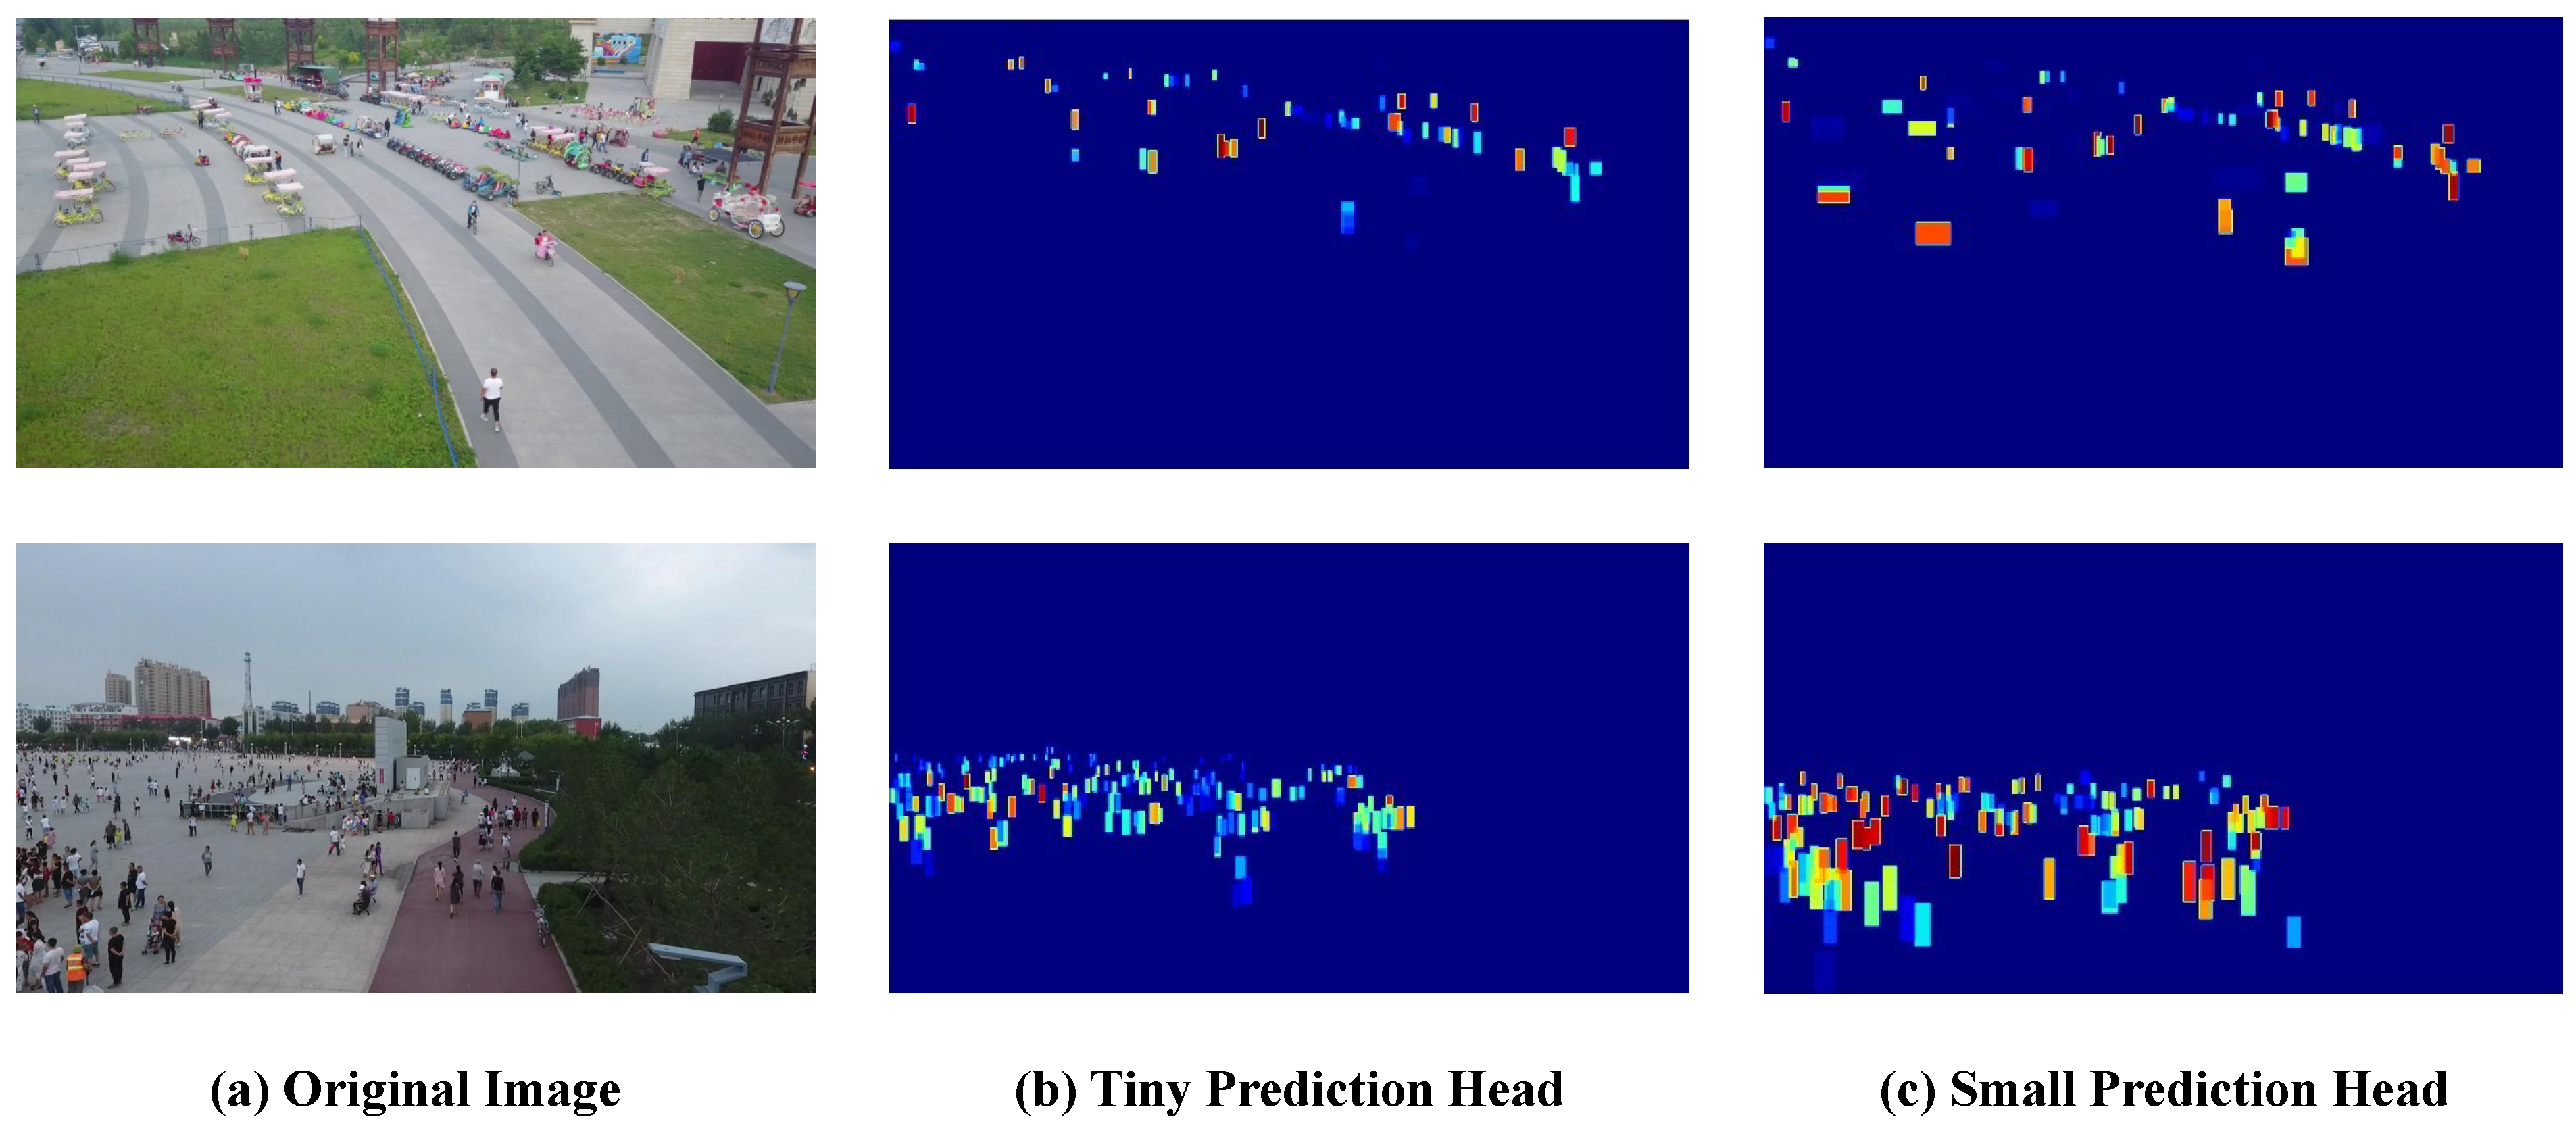
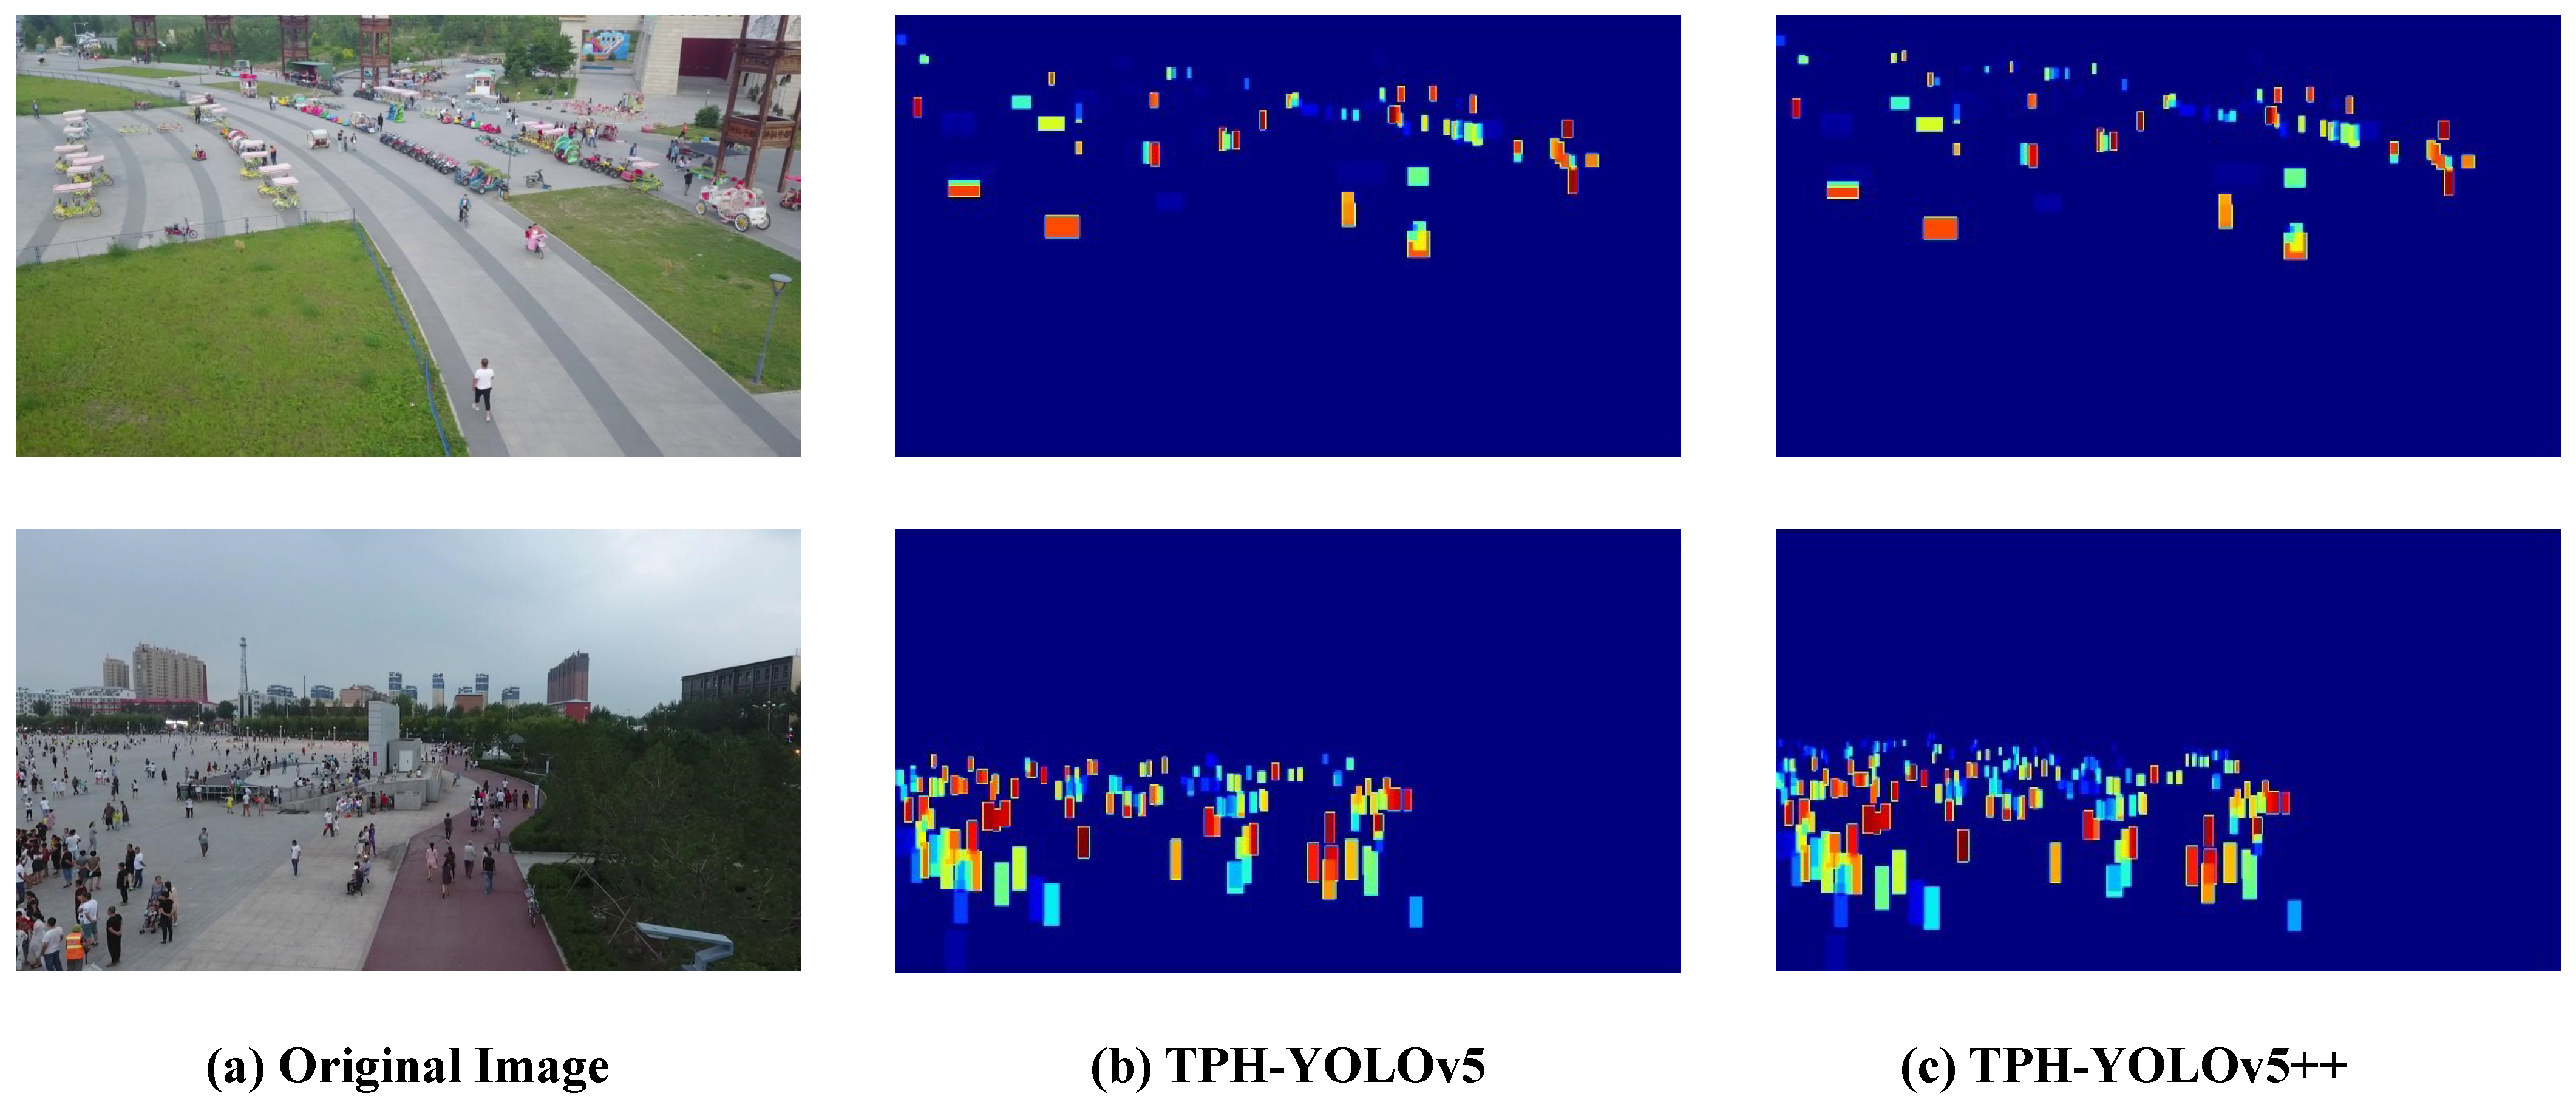
Figure 5.
Two cases of spatial distributions of correct bounding boxes generated by tiny and small heads. The color of each pixel denotes the average confidence of correct boxes covering the pixel. If the confidence is high, the color tends towards red, otherwise it tends towards blue.
Figure 5.
Two cases of spatial distributions of correct bounding boxes generated by tiny and small heads. The color of each pixel denotes the average confidence of correct boxes covering the pixel. If the confidence is high, the color tends towards red, otherwise it tends towards blue.
Figure 6.
The overall architecture of TPH-YOLOv5++. Different from the TPH-YOLOv5, TPH-YOLOv5++ removes the additional head and introduces the CA-Trans to enrich the features of small paths. The CA-Trans takes and as inputs and outputs . After a Conv. layer, a new is predicted to absorb the best of the original and .
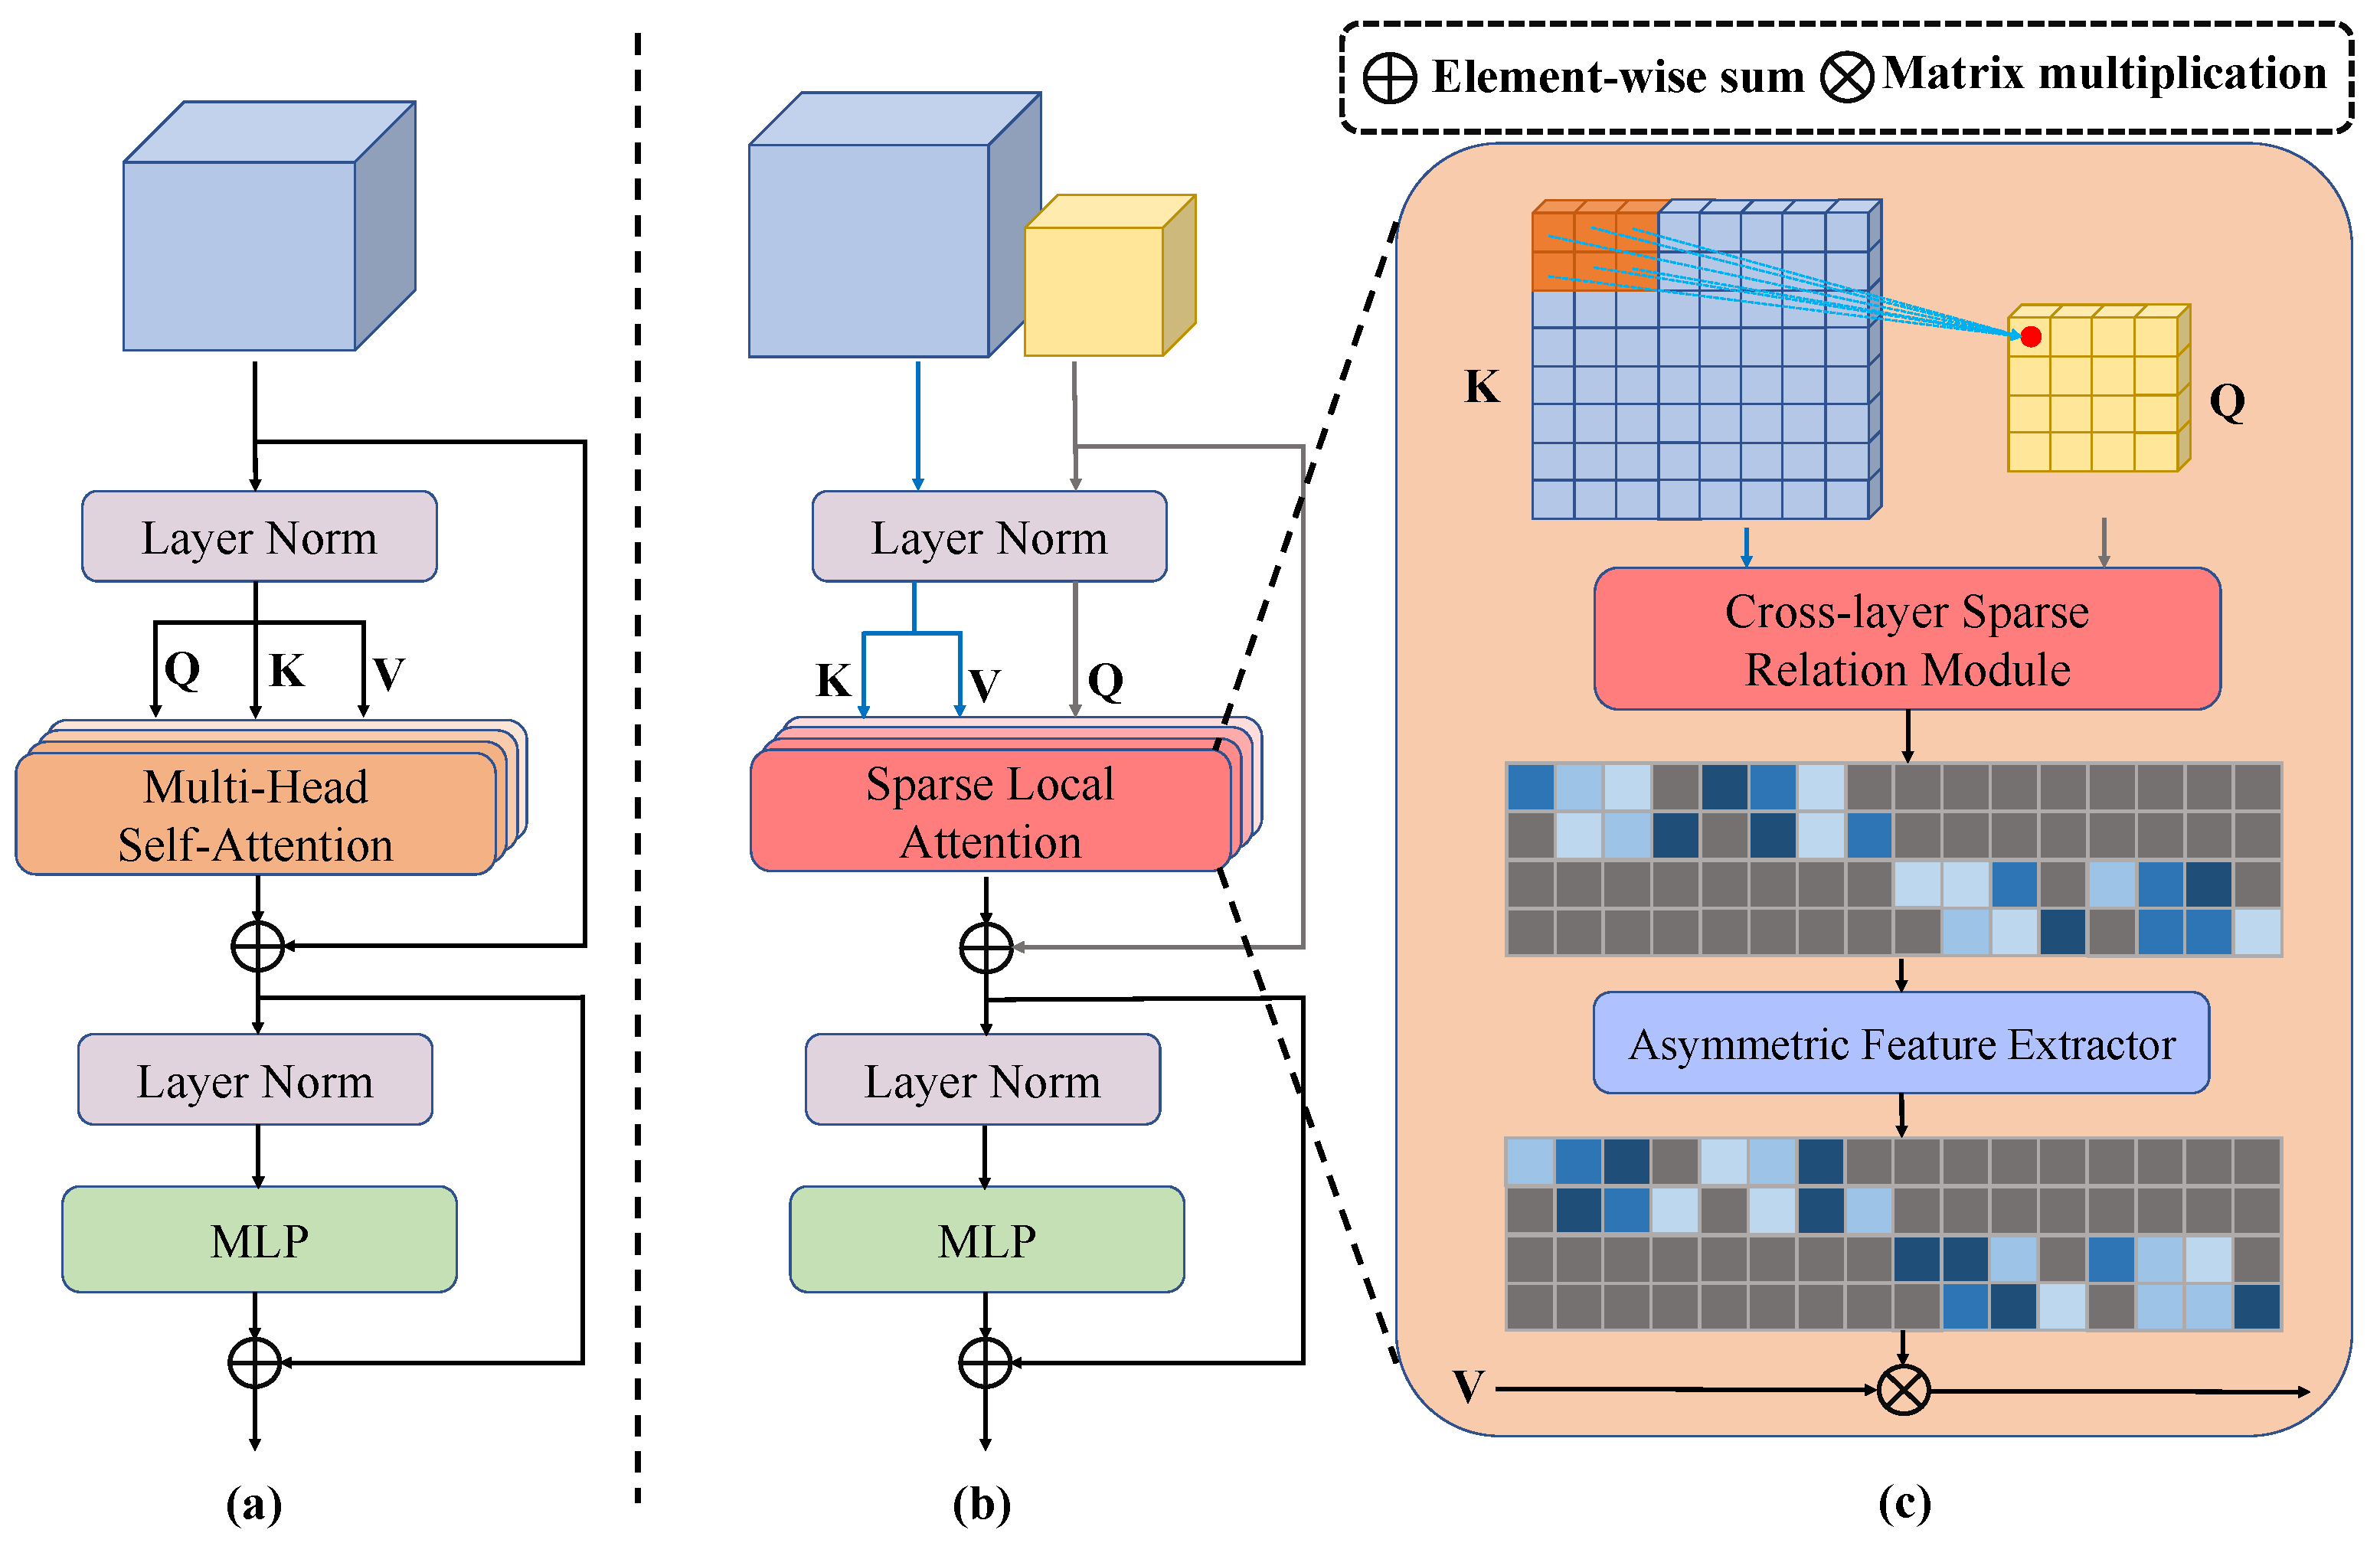
Figure 7.
Overview of the CA-Trans module. (a) is the vanilla ViT module that generates Q, K, and V from a single feature map and uses multi-head self-attention (MHSA) to obtain attentions. (b) shows the architecture of our CA-Trans, where K and V are generated from , while Q is generated from . Otherwise, we replace the MHSA with the sparse local attention (SLA) to extract attentions between two different layers. (c) is the SLA. By introducing the cross-layer sparse relation module (CSRM) and asymmetric feature extractor (AFE), our CA-Trans can efficiently extract asymmetric information between two paths and enrich the features of small paths.
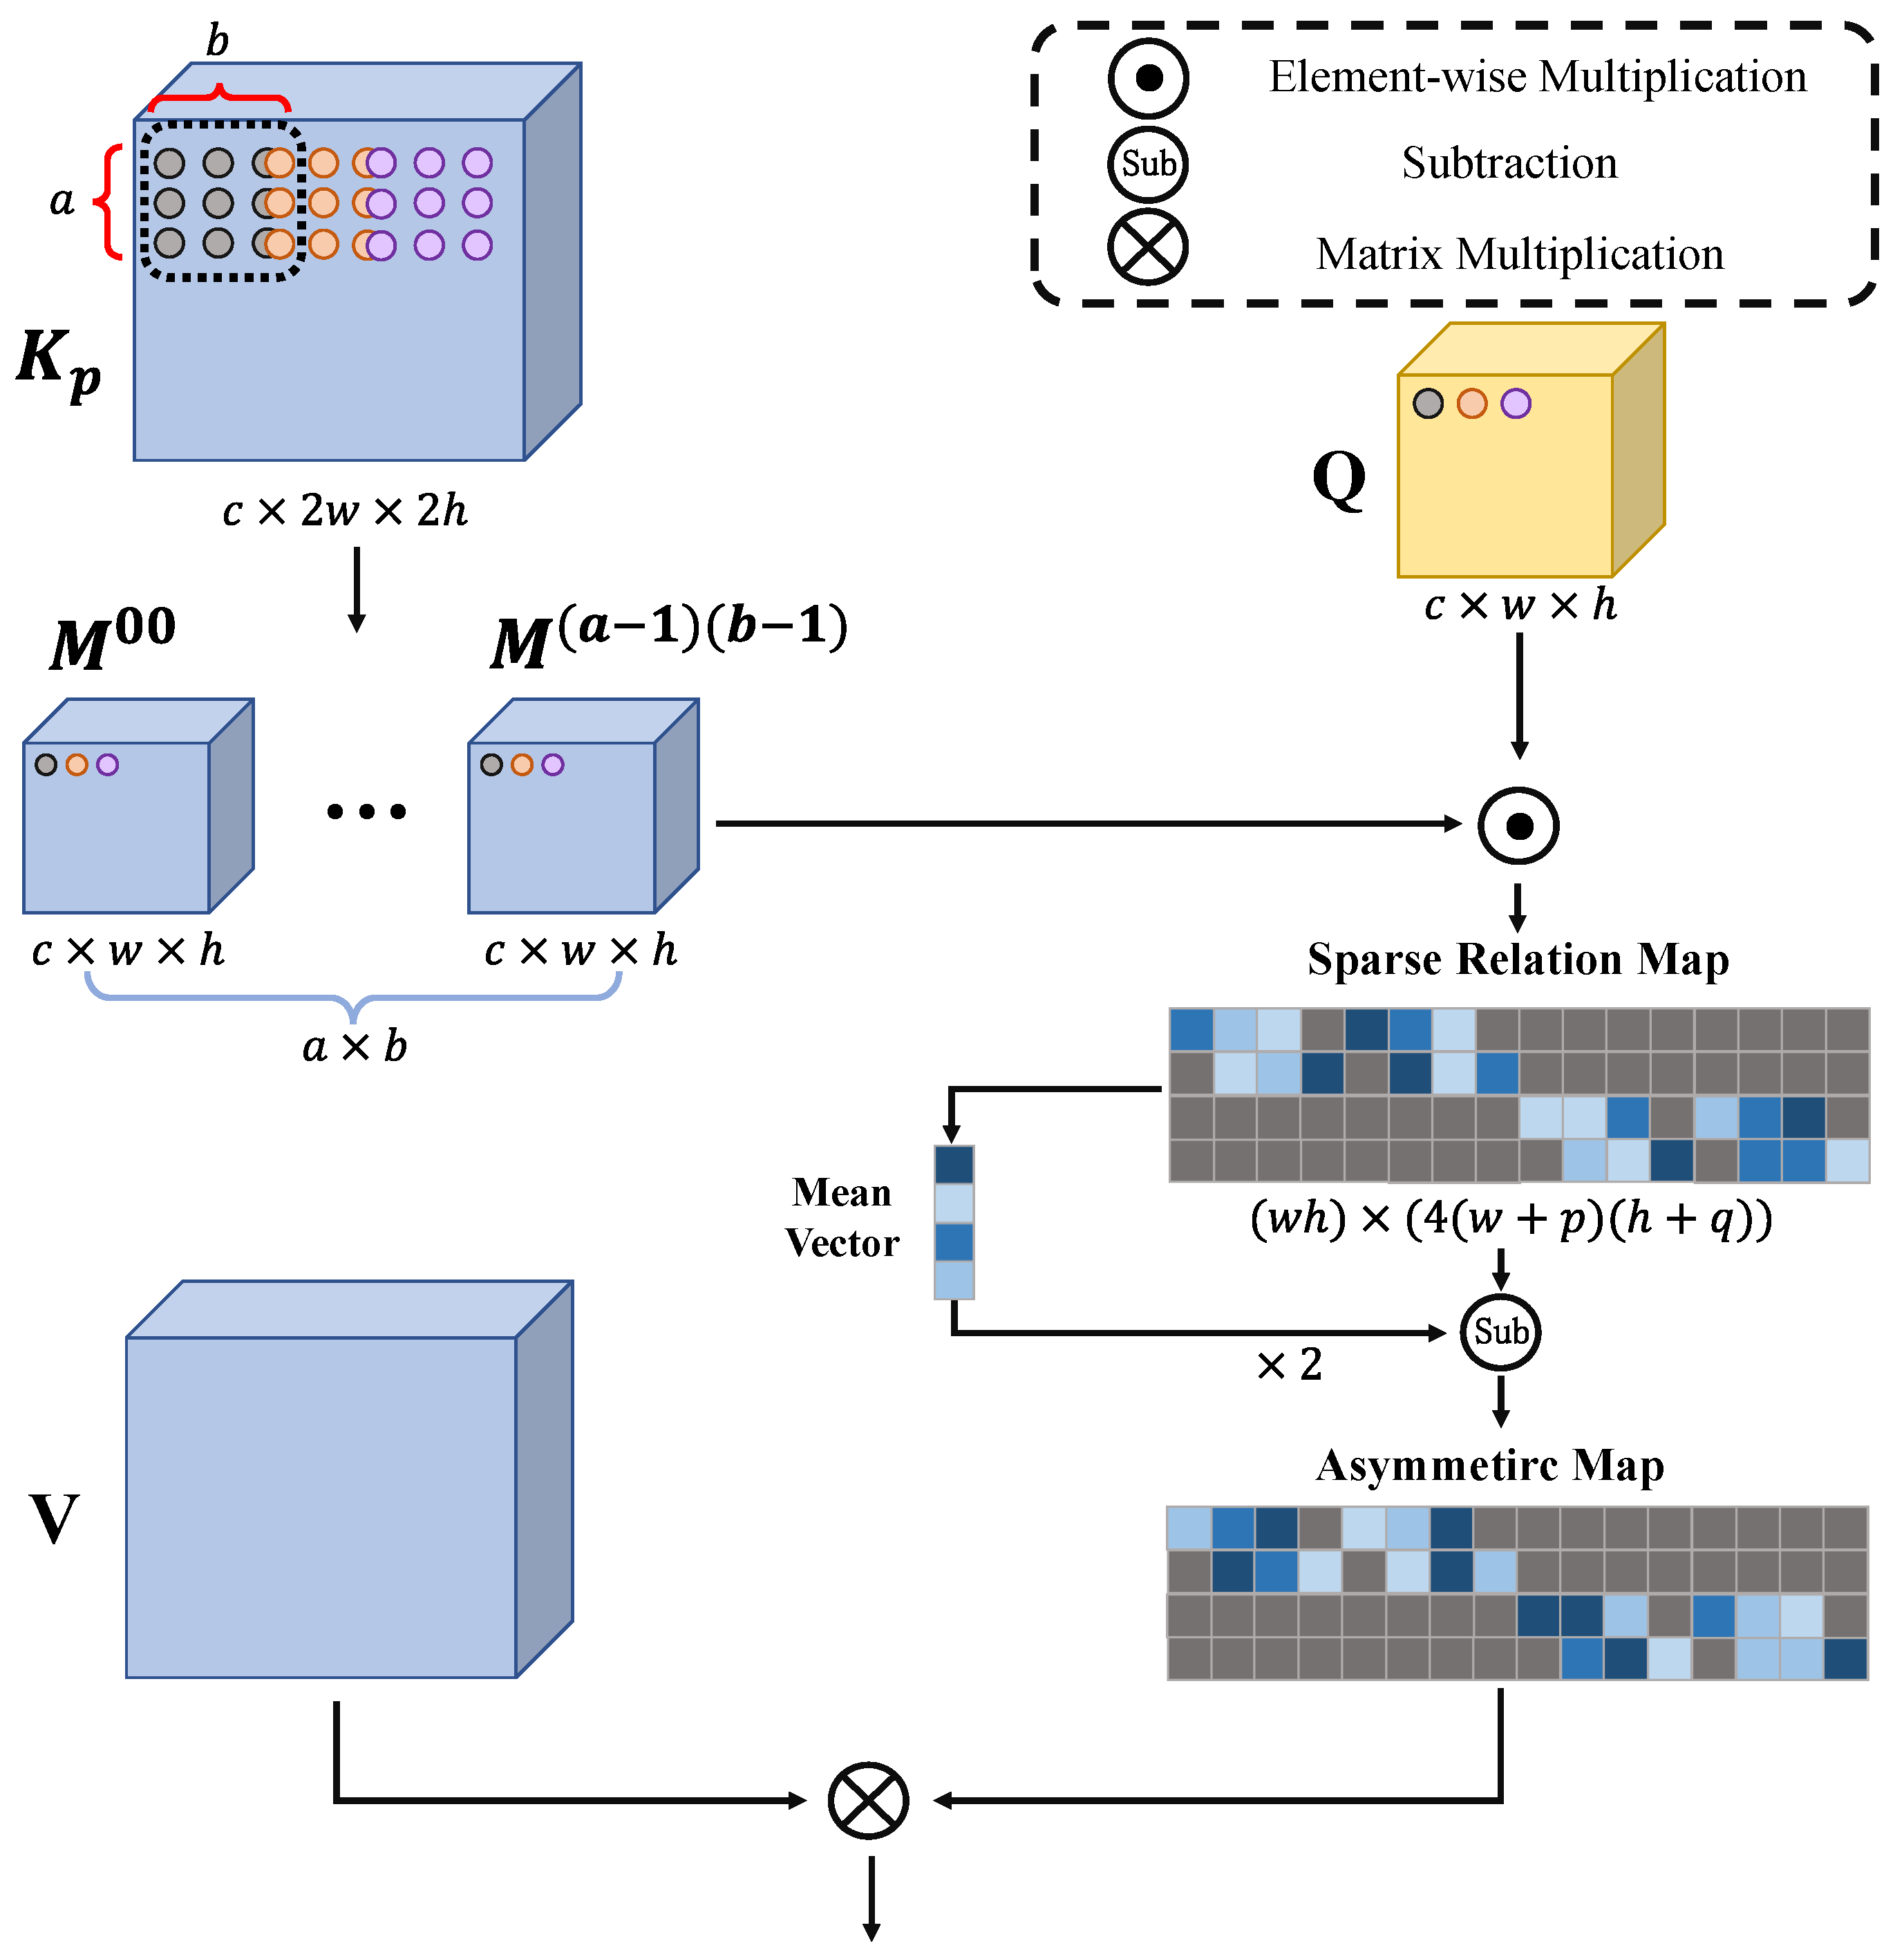
Figure 8.
The architecture of SLA with three inputs: , Q, and V. The is generated from K after padding with zeros. After using a sparse relation extraction and an inverse method, the V values are multiplied by the asymmetric map to obtain the final output.
Figure 8.
The architecture of SLA with three inputs: , Q, and V. The is generated from K after padding with zeros. After using a sparse relation extraction and an inverse method, the V values are multiplied by the asymmetric map to obtain the final output.
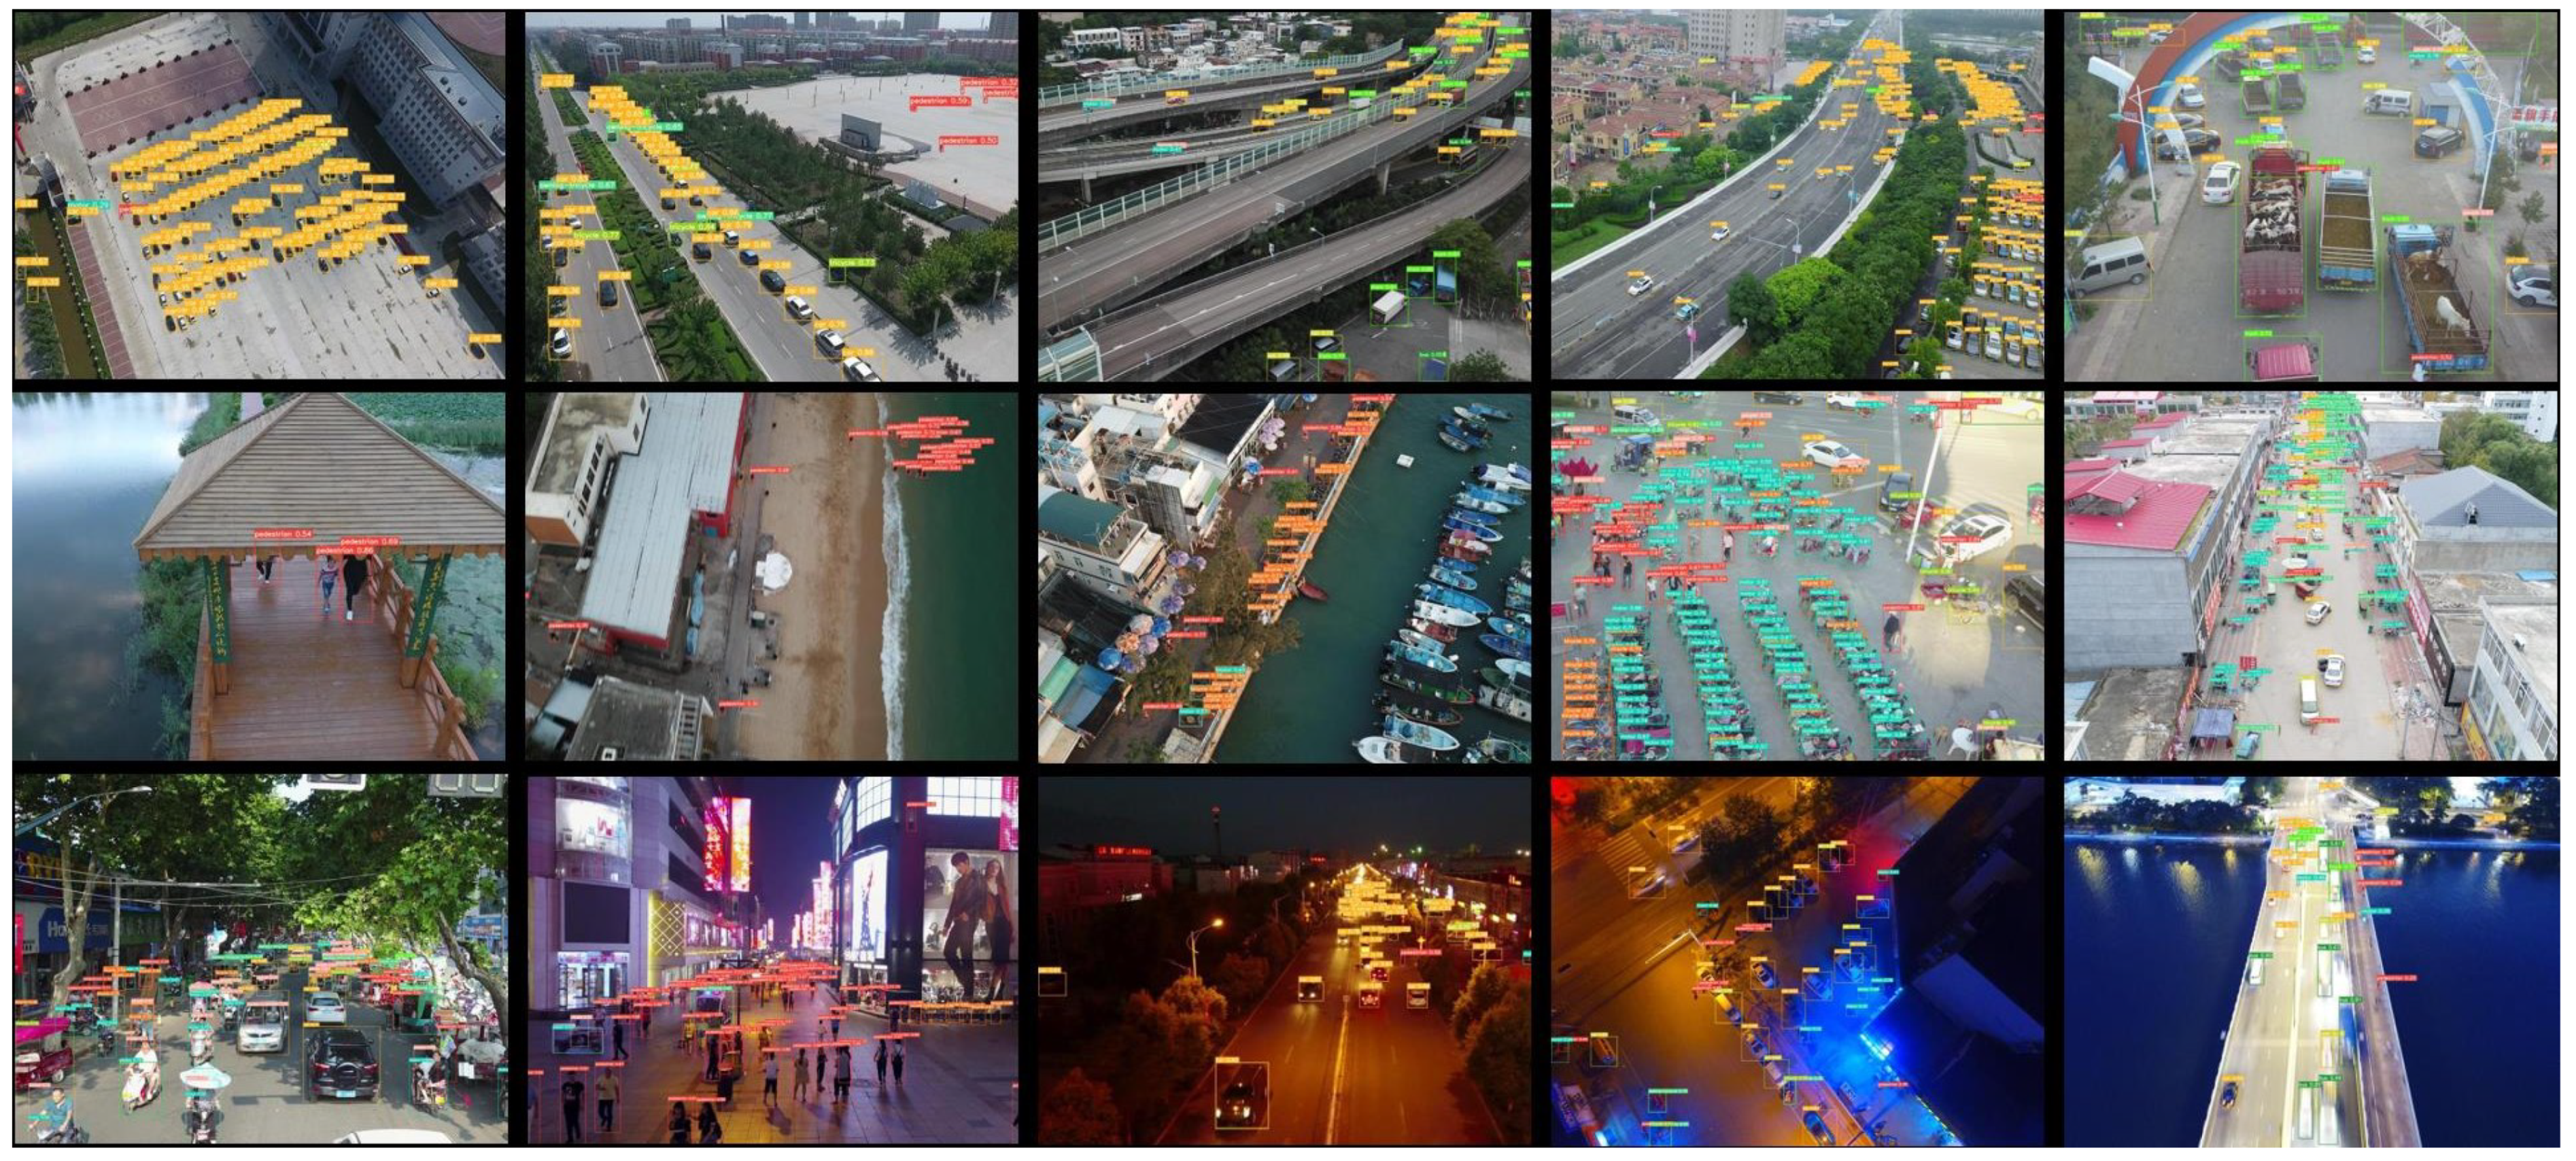
Figure 9.
Qualitative results of the proposed TPH-YOLOv5++ on the VisDrone2021 test-challenge set. Different categories use bounding boxes with different colors. The performance is good at localizing tiny objects, dense objects, and objects blurred by motion.
Figure 9.
Qualitative results of the proposed TPH-YOLOv5++ on the VisDrone2021 test-challenge set. Different categories use bounding boxes with different colors. The performance is good at localizing tiny objects, dense objects, and objects blurred by motion.
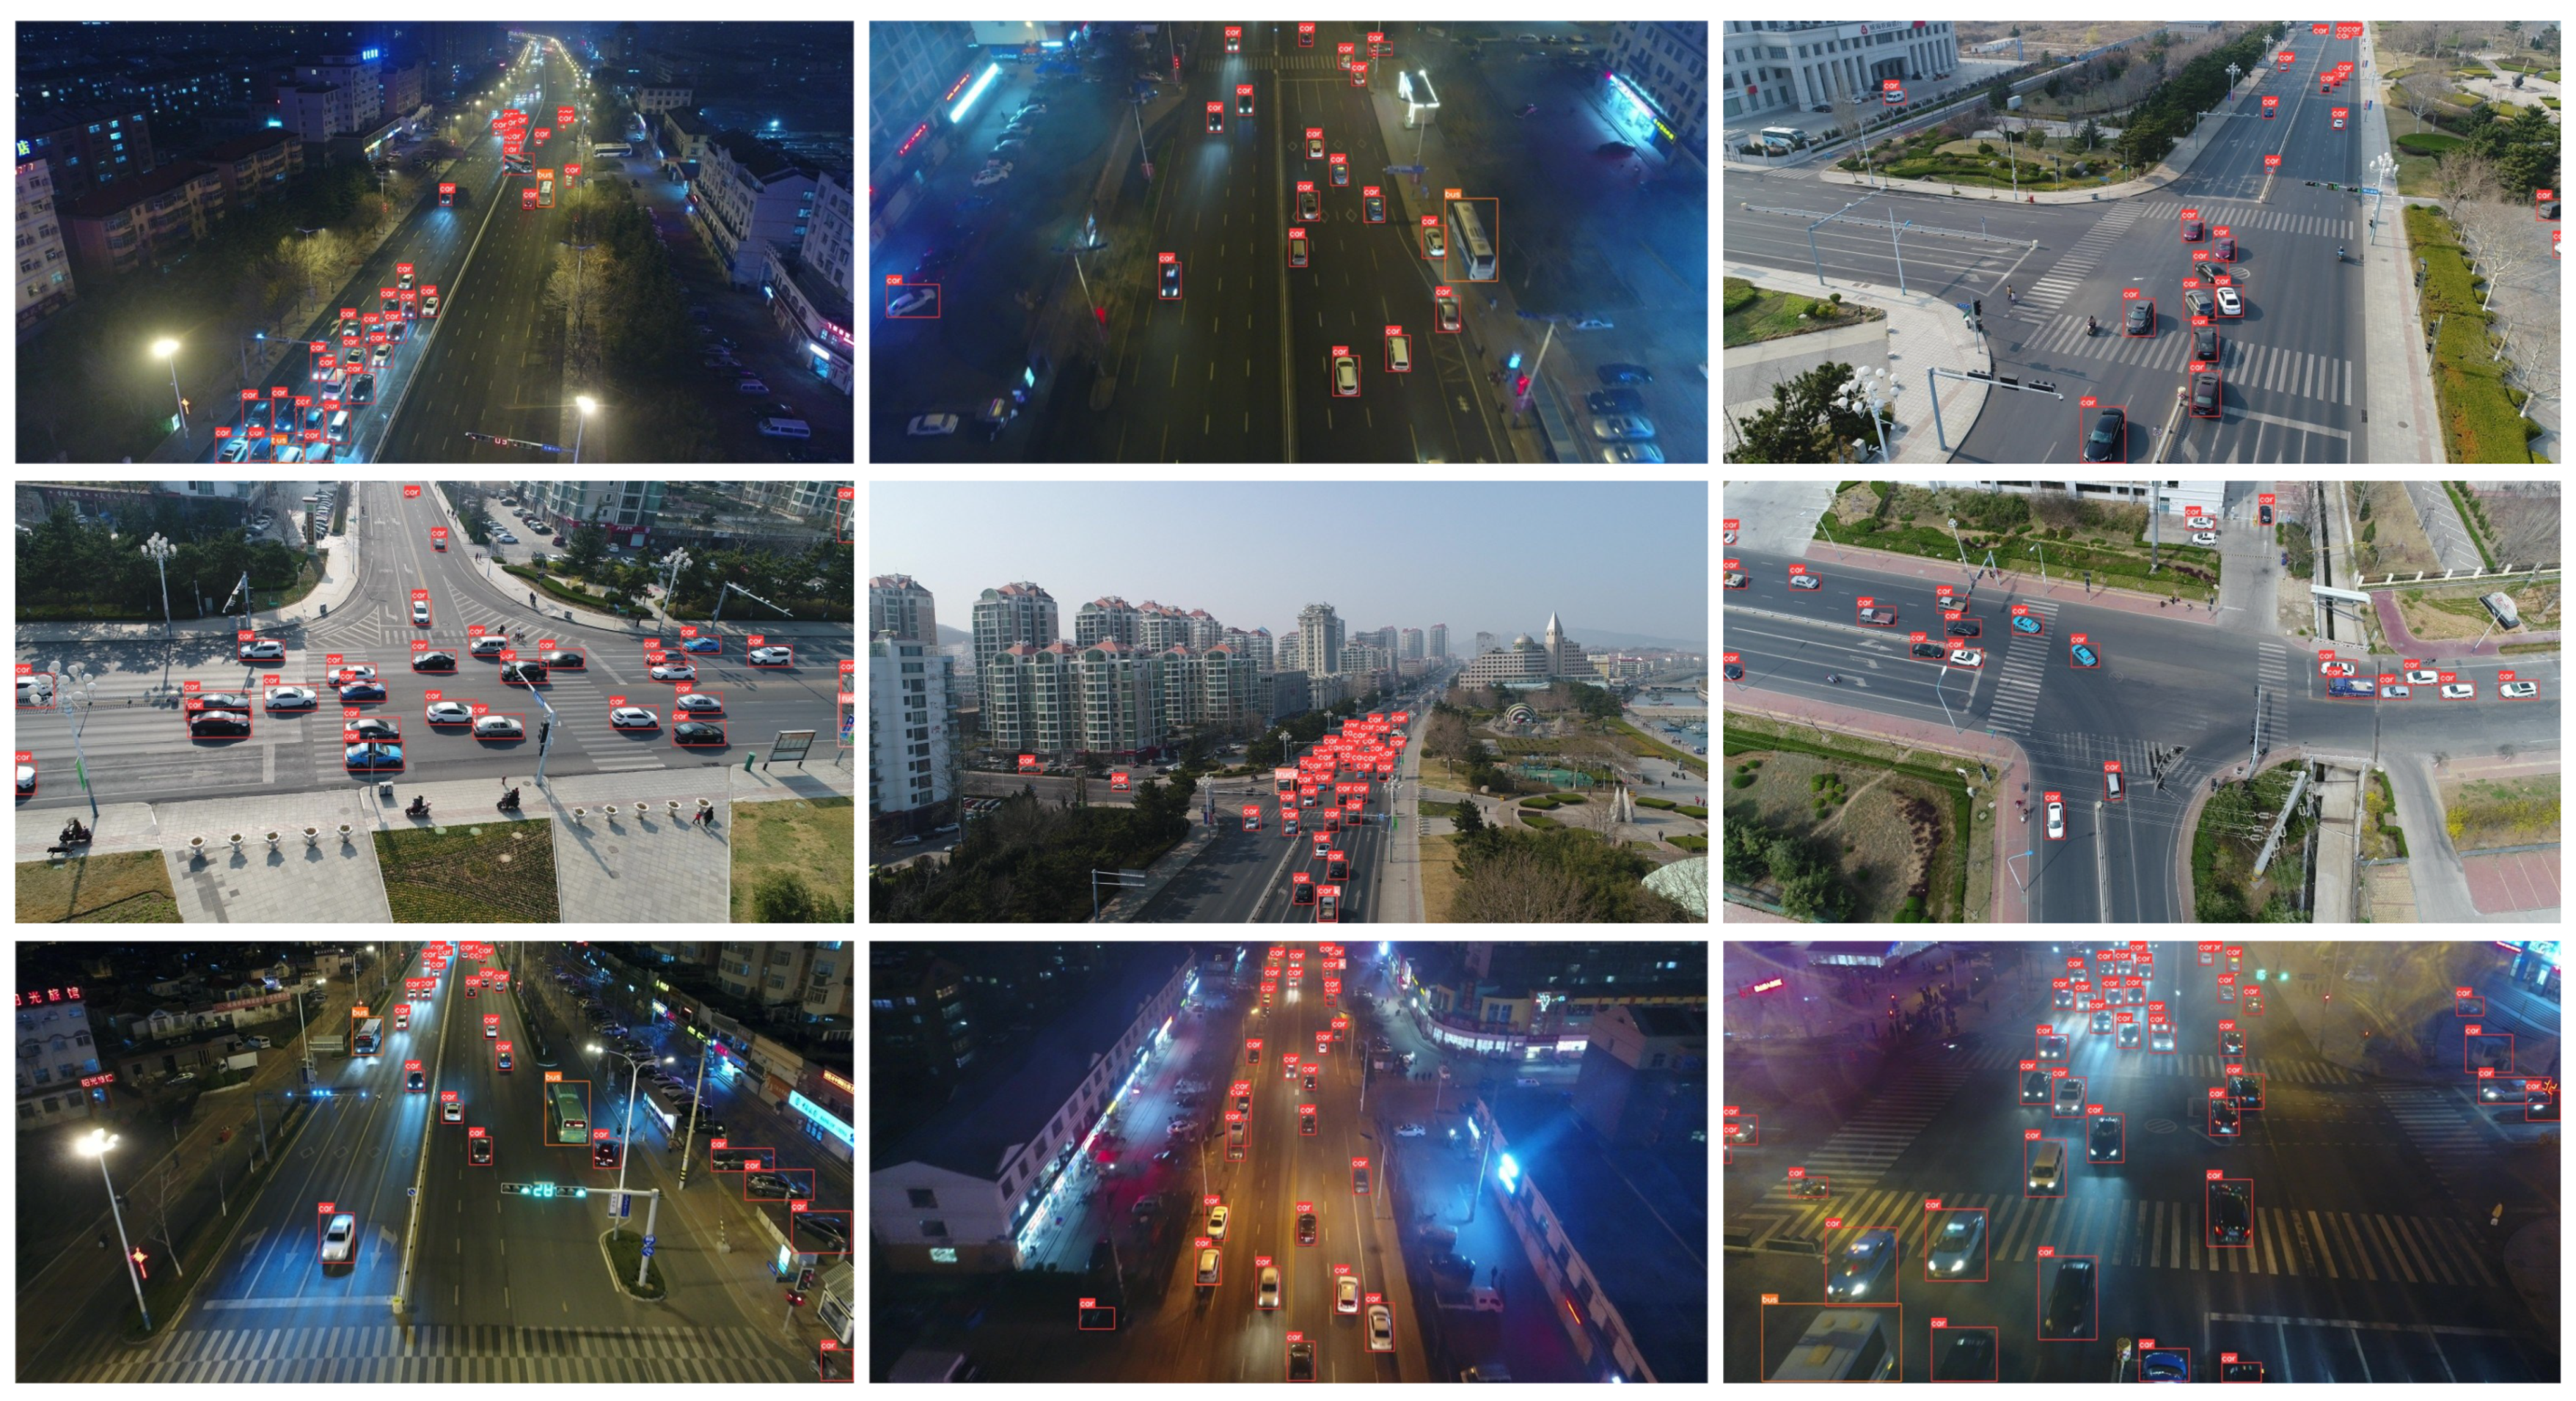
Figure 10.
Qualitative results of the proposed TPH-YOLOv5++ on the UAVDT dataset.
Figure 10.
Qualitative results of the proposed TPH-YOLOv5++ on the UAVDT dataset.
Figure 11.
Spatial distributions of correct bounding boxes generated by the small prediction heads of TPH-YOLOv5 and TPH-YOLOv5++.
Figure 11.
Spatial distributions of correct bounding boxes generated by the small prediction heads of TPH-YOLOv5 and TPH-YOLOv5++.
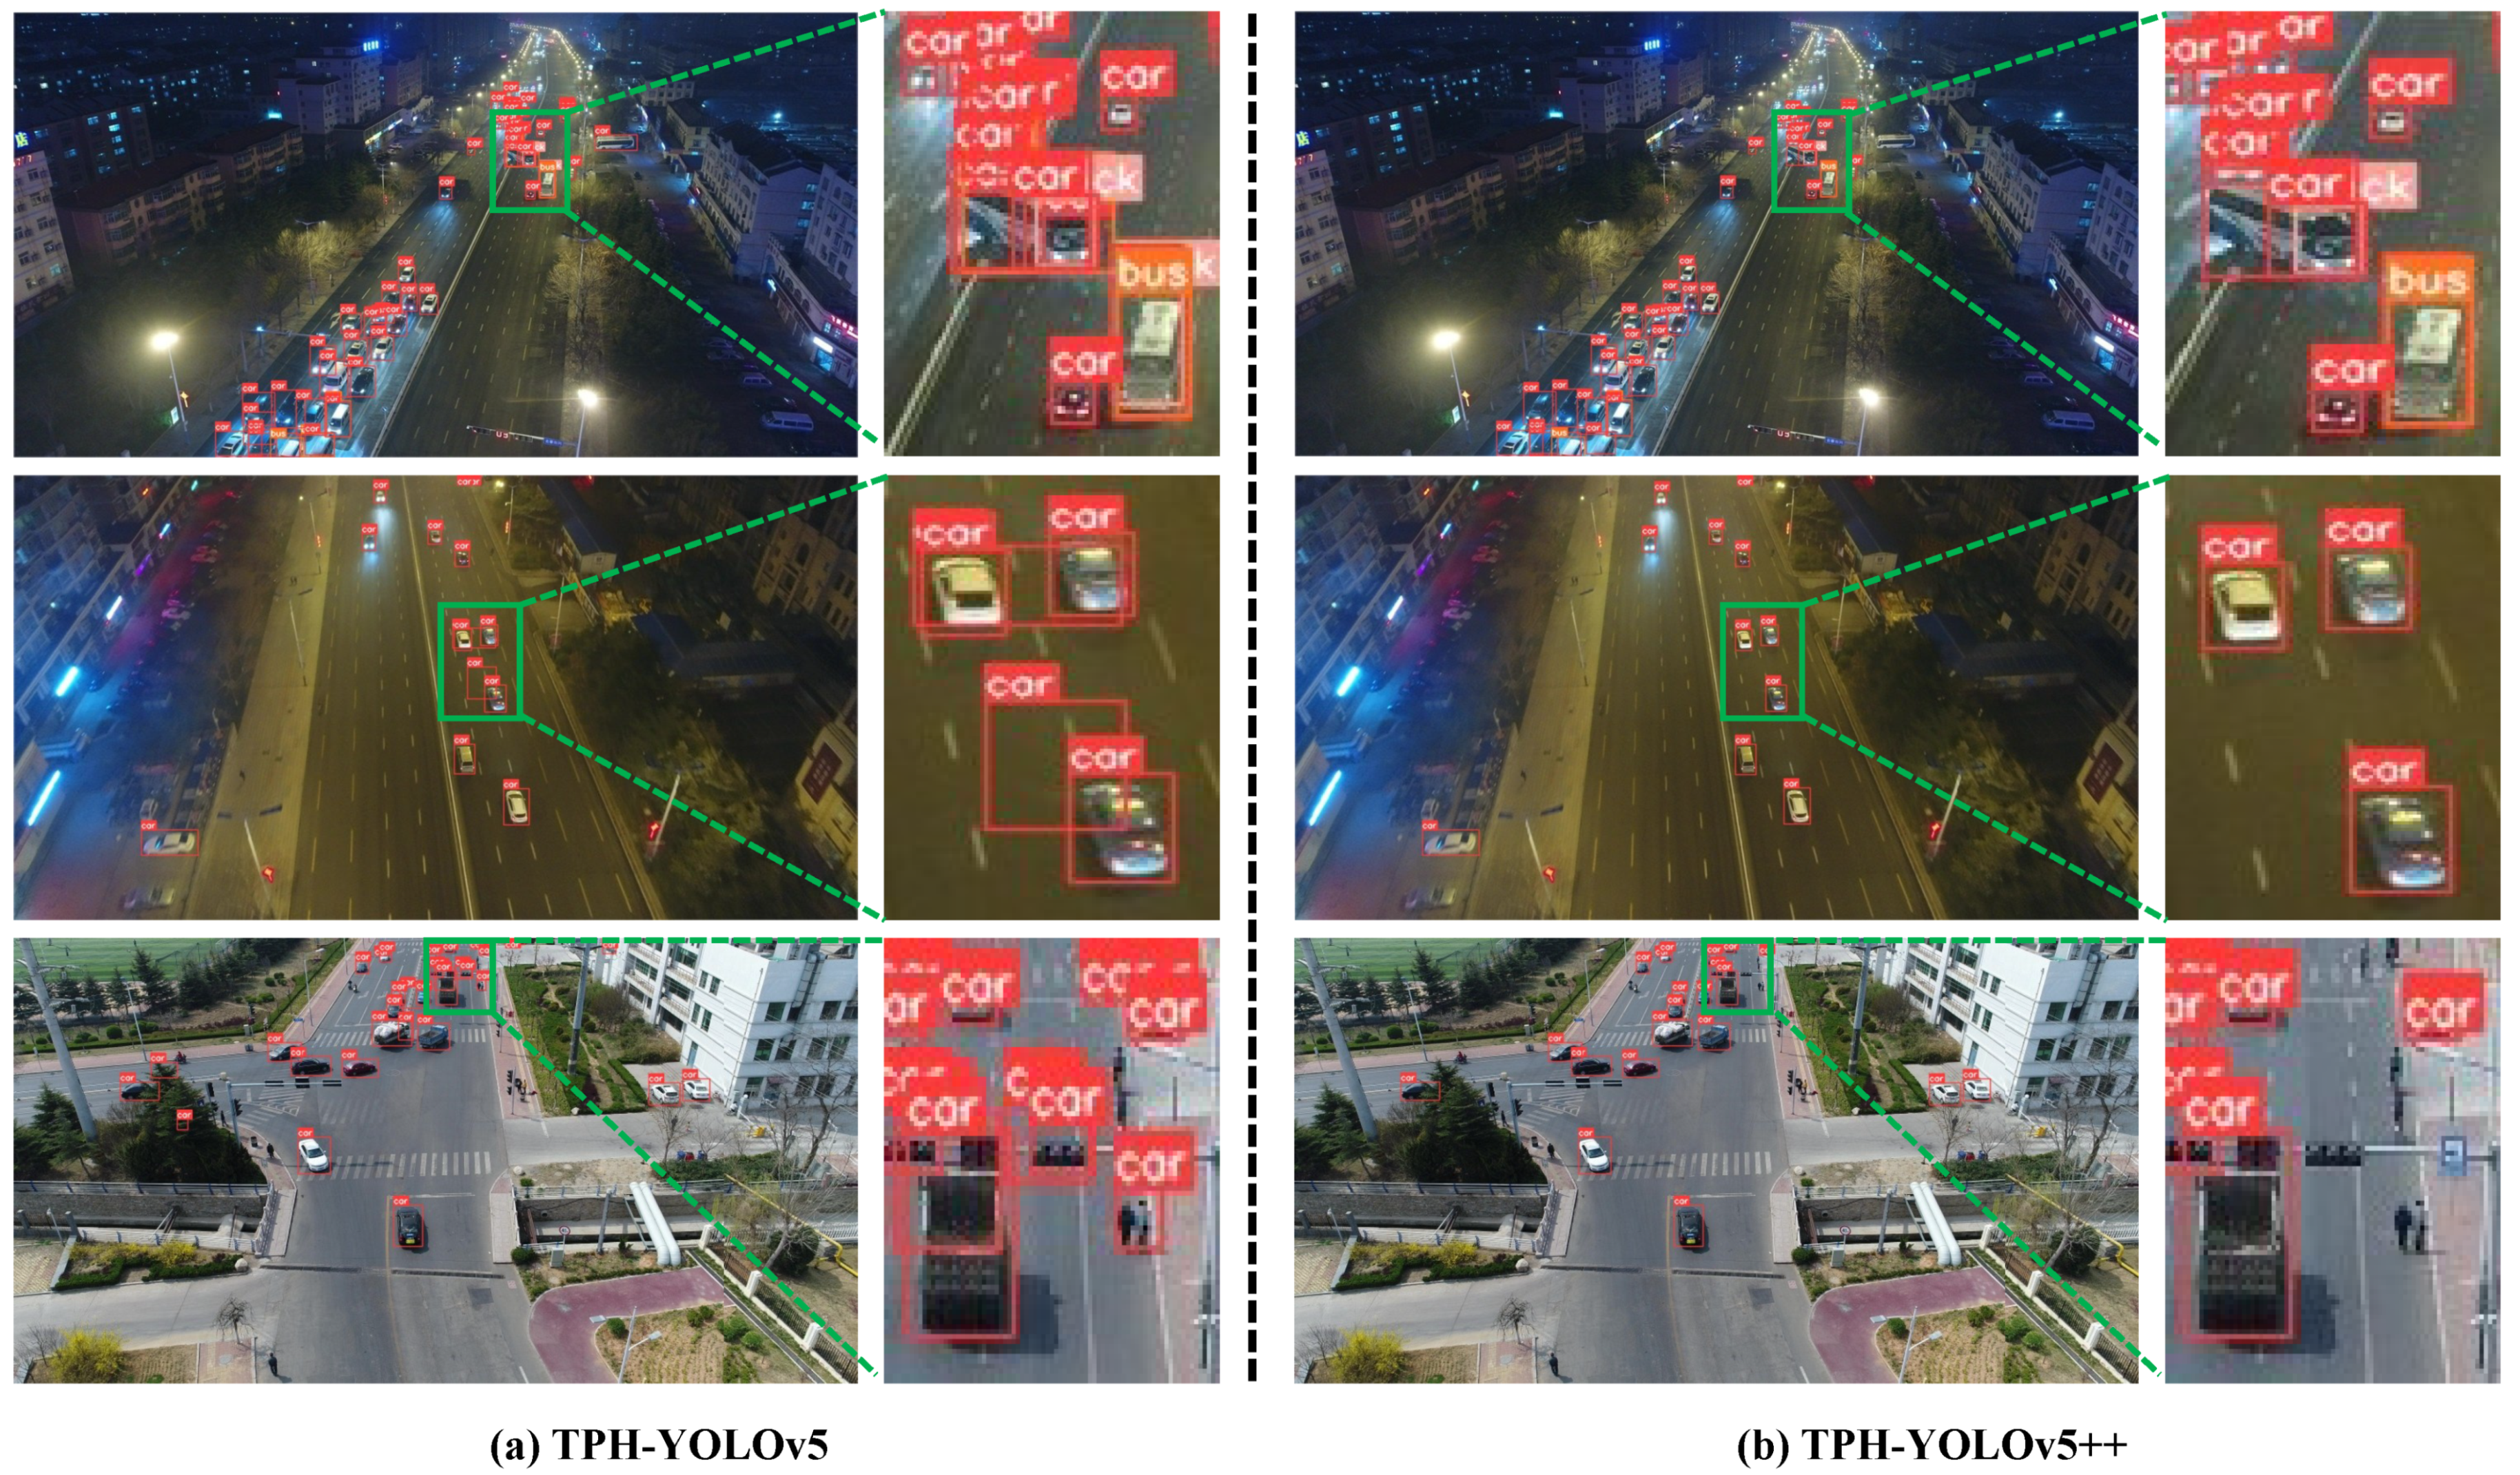
Figure 12.
Visualization of TPH-YOLOv5 and TPH-YOLOv5++ on the UAVDT dataset.
Figure 12.
Visualization of TPH-YOLOv5 and TPH-YOLOv5++ on the UAVDT dataset.
Table 1.
Results of our TPH-YOLOv5 and other SOTA methods in the VisDrone Challenge 2021 test-challenge dataset, provided by the organizer of this challenge [
59].
Table 1.
Results of our TPH-YOLOv5 and other SOTA methods in the VisDrone Challenge 2021 test-challenge dataset, provided by the organizer of this challenge [
59].
| Method | AP [%] | AP50 [%] | AP75 [%] | AR1 [%] | AR10 [%] | AR100 [%] | AR500 [%] |
|---|
| DBNet(A.1) | 39.43 | 65.34 | 41.07 | 0.29 | 2.03 | 12.13 | 55.36 |
| SOLOer(A.2) | 39.42 | 63.91 | 40.87 | 1.75 | 10.94 | 44.69 | 55.91 |
| Swin-T(A.3) | 39.40 | 63.91 | 40.87 | 1.76 | 10.96 | 44.65 | 56.83 |
| TPH-YOLOv5(A.4) | 39.18 | 62.83 | 41.34 | 2.61 | 13.63 | 45.62 | 56.88 |
| VistrongerDet(A.5) | 38.77 | 64.28 | 40.24 | 0.77 | 8.10 | 43.23 | 55.12 |
| cascade++(A.6) | 38.72 | 62.92 | 41.05 | 1.04 | 6.69 | 43.36 | 43.36 |
| DNEFS(A.7) | 38.53 | 62.86 | 40.19 | 1.42 | 9.38 | 43.10 | 54.87 |
| EfficientDet(A.8) | 38.51 | 63.25 | 39.54 | 1.82 | 11.12 | 43.89 | 55.12 |
| DPNet-ensemble | 37.37 | 62.05 | 39.10 | 0.85 | 7.96 | 42.03 | 53.78 |
| DroneEye2020 | 34.57 | 58.21 | 35.74 | 0.28 | 1.92 | 6.93 | 52.37 |
| Cascade R-CNN | 16.09 | 31.94 | 15.01 | 0.28 | 2.79 | 21.37 | 28.43 |
Table 2.
Results of our methods and current SOTA methods on the VisDrone2021 validation set.
Table 2.
Results of our methods and current SOTA methods on the VisDrone2021 validation set.
| Method | AP [%] | AP50 [%] | AP75 [%] |
|---|
| ClusDet [32] | 28.4 | 53.2 | 26.4 |
| Zhang et al. [33] | 30.3 | 58.0 | 27.5 |
| GLSAN [35] | 32.5 | 55.8 | 33.0 |
| DMNet [36] | 29.4 | 49.3 | 30.6 |
| DSHNet [37] | 30.3 | 51.8 | 30.9 |
| HawkNet [41] | 25.6 | 44.3 | 25.8 |
| CDMNet [42] | 31.9 | 52.9 | 33.2 |
| DCRFF [60] | 35.0 | 57.0 | 29.5 |
| UFPMP-Net [49] | 39.2 | 65.3 | 40.2 |
| TPH-YOLOv5 | 42.1 | 63.1 | 45.7 |
| TPH-YOLOv5++ | 41.4 | 61.9 | 45.0 |
Table 3.
Results of our methods and current SOTA methods on the VisDrone2021 test-dev set.
Table 3.
Results of our methods and current SOTA methods on the VisDrone2021 test-dev set.
| Method | AP [%] | AP50 [%] | AP75 [%] |
|---|
| GDFNet [45] | 18.7 | 31.7 | 19.4 |
| VistrongerDet [62] | 33.85 | 57.27 | 34.81 |
| ViT-YOLO [61] | 38.5 | 63.2 | 40.5 |
| TPH-YOLOv5 | 34.4 | 54.5 | 36.5 |
| TPH-YOLOv5++ | 33.5 | 52.5 | 35.7 |
Table 4.
Results of our methods and current SOTA methods on UAVDT.
Table 4.
Results of our methods and current SOTA methods on UAVDT.
| Method | AP [%] | AP50 [%] | AP75 [%] |
|---|
| ClusDet [32] | 13.7 | 26.5 | 12.5 |
| Zhang et al. [33] | 17.7 | - | - |
| GDFNet [45] | 15.4 | 26.1 | 17.0 |
| GLSAN [35] | 19.0 | 30.5 | 21.7 |
| DMNet [36] | 14.7 | 24.6 | 16.3 |
| DSHNet [37] | 17.8 | 30.4 | 19.7 |
| CDMNet [42] | 20.7 | 35.5 | 22.4 |
| SODNet [48] | 17.1 | 29.9 | 18.0 |
| UFPMP-Net [49] | 24.6 | 38.7 | 28.0 |
| TPH-YOLOv5 | 26.9 | 41.3 | 32.7 |
| TPH-YOLOv5++ | 30.1 | 43.5 | 34.3 |
Table 5.
Ablation study of the importance of each proposed component on the VisDrone2021 test-dev set. ‘p2’ denotes the additional prediction head. ‘ViT’ denotes the ViT module. ‘previous’ denotes the ‘YOLOv5x+p2+ViT’, and ‘TPH-YOLOv5 (SwinTrans+CBAM)’ denotes the model replacing all ViT modules with Swin-Transfomer.
| Methods | AP [%] | AP50 [%] | AP75 [%] | GPU Memory | GFLOPs | FPS |
|---|
| YOLOv5x | 28.9 | 45.4 | 30.8 | 4279 M | 200.2 | 13.68 |
| YOLOv5x+p2 | 31.0 | 48.7 | 32.9 | 4667 M | 241.2 | 10.89 |
| YOLOv5x+p2+ViT | 32.8 | 52.0 | 34.8 | 5103 M | 244.5 | 9.51 |
| TPH-YOLOv5 (previous+CBAM) | 33.6 | 53.2 | 35.8 | 5105 M | 245.1 | 8.22 |
| TPH-YOLOv5 (SwinTrans+CBAM) | 34.0 | 53.2 | 35.8 | 4977 M | 315.4 | 7.36 |
| TPH-YOLOv5++ | 33.1 | 52.1 | 35.1 | 4715 M | 207.0 | 11.86 |
Table 6.
Ablation study of TPH-YOLOv5 and TPH-YOLOv5++ on UAVDT.
Table 6.
Ablation study of TPH-YOLOv5 and TPH-YOLOv5++ on UAVDT.
| Methods | AP [%] | AP50 [%] | AP75 [%] | GPU Memory | GFLOPs | FPS |
|---|
| TPH-YOLOv5 | 26.9 | 41.3 | 32.7 | 3631 M | 556.6 | 25.12 |
| TPH-YOLOv5++ | 30.1 | 43.5 | 34.3 | 3361 M | 293.2 | 42.19 |
Table 7.
Ablation study for each category on the VisDrone2021 test-dev set. The AP of each category is used as the result.
Table 7.
Ablation study for each category on the VisDrone2021 test-dev set. The AP of each category is used as the result.
| Methods | All | Pedestrian | People | Bicycle | Car | Van | Truck | Tricycle | Awning-Tricycle | Bus | Motor |
|---|
| YOLOv5x | 28.9 | 23.5 | 14.3 | 13.5 | 51.8 | 35.4 | 38.0 | 20.2 | 19.9 | 48.6 | 23.8 |
| YOLOv5x+p2 | 31.0 | 25.6 | 14.9 | 14.3 | 56.2 | 37.4 | 40.1 | 22.0 | 21.5 | 52.5 | 25.3 |
| YOLOv5x+p2+ViT | 32.8 | 26.7 | 16.0 | 15.5 | 59.1 | 40.0 | 42.7 | 23.4 | 22.2 | 55.4 | 27.1 |
| TPH-YOLOv5 (previous+CBAM) | 33.6 | 27.4 | 16.3 | 15.9 | 61.4 | 41.9 | 43.3 | 23.9 | 21.5 | 56.9 | 27.8 |
| TPH-YOLOv5 (SwinTrans+CBAM) | 34.0 | 27.5 | 16.1 | 15.9 | 61.7 | 41.9 | 43.9 | 24.2 | 24.0 | 56.4 | 28.5 |
| TPH-YOLOv5+ms-testing | 34.9 | 28.8 | 16.3 | 15.0 | 65.9 | 44.3 | 43.8 | 25.7 | 22.8 | 59.0 | 27.1 |
Table 8.
Ablation study for neighborhood size of SLA on the VisDrone 2021 test-dev dataset.
Table 8.
Ablation study for neighborhood size of SLA on the VisDrone 2021 test-dev dataset.
| | Neighborhood Size |
|---|
| | | | | |
| AP [%] | 31.9 | 33.1 | 33.5 | 33.6 |
| AP50 [%] | 51.7 | 52.1 | 52.5 | 52.6 |
| AP75 [%] | 33.5 | 35.1 | 34.9 | 35.0 |
| GPU Memory | 4299 M | 4715 M | 7475 M | 12,185 M |
| GFLOPs | 204.5 | 207 | 214.9 | 228.1 |
| FPS | 12.01 | 11.86 | 10.14 | 7.67 |


