

Monitoring Ash Dieback in Europe—An Unrevealed Perspective for Remote Sensing?


1
Chair of Photogrammetry and Remote Sensing, Faculty of Geodesy, University of Zagreb, Kačićeva 26, 10000 Zagreb, Croatia
2
Division of Ecology, Croatian Forest Research Institute, Cvjetno Naselje 41, 10450 Jastrebarsko, Croatia
3
Production and Development Department, Croatian Forests Ltd., Ivana Meštrovića 28, 48000 Koprivnica, Croatia
4
Sector for Spatial Data Infrastructure, State Geodetic Administration, Gruška 20, 10000 Zagreb, Croatia
*
Author to whom correspondence should be addressed.
Remote Sens. 2023, 15(5), 1178; https://doi.org/10.3390/rs15051178
Submission received: 18 January 2023
/
Revised: 6 February 2023
/
Accepted: 16 February 2023
/
Published: 21 February 2023
(This article belongs to the Special Issue Applications of Remote Sensing in Forest Management and Biodiversity Conservation)
Abstract
:The ash dieback pandemic, caused by the invasive fungus Hymenoscyphus fraxineus, represents one of Europe’s biggest threats to preserving natural biodiversity. To ensure the suppression of forest damage caused by fungi, timely recognition of the symptoms of ash dieback and further continuous monitoring on an adequate spatial scale are essential. Visual crown damage assessment is currently the most common method used for identifying ash dieback, but it lacks the spatial and temporal coverage required for effective disease suppression. Remote sensing technologies, with the capabilities of fast and repetitive retrieval of information over a large spatial scale, could present efficient supplementary methods for ash damage detection and disease monitoring. In this study, we provided a synthesis of the existing remote sensing methods and applications that considers ash dieback disease, and we described the lifecycle of the disease using the major symptoms that remote sensing technologies can identify. Unfortunately, although effective methods of monitoring biotic damage through remote sensing have been developed, ash dieback has only been addressed in two research studies in the United Kingdom and Germany. These studies were based on single-date hyperspectral and very-high-resolution imagery in combination with machine learning, using previously specified ground-truth information regarding crown damage status. However, no study exists using high-resolution imagery such as Sentinel-2 or radar Sentinel-1, although some preliminary project results show that these coarser sources of information could be applicable for ash dieback detection and monitoring in cases of Fraxinus angustifolia, which forms pure, more homogenous stands in Southern Europe.
1. Introduction
Forest habitats are key hosts of global biodiversity. In recent decades, due to climate change, there have been significant cases of the large-scale progression of various biotic disturbances that have caused severe forest dieback and deterioration [1]. Remote sensing technologies present efficient means for the near-real-time detection of biotic damage, monitoring of forest dieback and the assessment of deforestation caused by harmful insects or fungi [2,3,4,5]. However, there are cases of large discrepancies between the extent and the severity of the forest disease on one side, and low practical utilisation of remote sensing capabilities to analyse and monitor the spread of the disease on the other [6]. Some recent cases have addressed ash (Fraxinus sp.) dieback in Europe, a pandemic that has decimated ash species, particularly Fraxinus excelsior and Fraxinus angustifolia, across the continent [7,8]. Ash dieback is a tree disease caused by the invasive East Asian fungus Hymenoscyphus fraxineus, which has spread through most Eastern, Central, and Northern European countries during the last decade. The first symptoms of ash dieback were observed in the early 1990s in Poland, where it rapidly spread in most parts of the ash distribution range in Europe. The disease has caused a dramatic decline in ash trees, where only 1% of trees show resistance. This dieback also severely impacts biodiversity in Europe, particularly in respect of the Natura 2000 network. Natura 2000 is a European-Union-wide policy aimed at the restoration and long-term maintenance of the most typical and most threatened habitat types and species in Europe, covering more than 18% of the European terrestrial territory. Ash species, Fraxinus excelsior and Fraxinus angustifolia, are tree species with significant importance inside the Natura 2000 network and also in terms of overall nature conservation in Europe. Although ash habitats account for a relatively small percentage (approximately 1–2%) of the total forest area (except in the United Kingdom, where it reaches 12.7%), they play a significant ecological role; they provide important services such as wildlife habitats and niches, stabilisation of the water balance and stream banks, and production of high-quality litter, as well as being a component in slowing zones for forest fires [9,10].
The most comprehensive overview of the various aspects of ash dieback in European countries was synthesised in the European cooperation and exchange programme FRAXBACK [11,12]. Strategies for disease management and conservation aim mainly for the retention and propagation of resistant or tolerant trees. Timely detection of the disease, primarily seen through changes in the canopy, therefore represents the first and most important step in preventing further spread. In addition, a monitoring system that efficiently keeps track of the progression of forest damage is a prerequisite for efficient disease management. However, recent advances in the development of conservation strategies in Europe [13] rely mostly on information from terrestrial field observations, i.e., the coarse-scale pan-European forest monitoring network (ICP-Forests Level I crown condition monitoring). In addition, the EU Copernicus program of land observations, in particular, satellite-based monitoring services based on Sentinel high-resolution multispectral or radar imagery, provides a useful source of information suitable for active biodiversity monitoring and supporting policy objectives such as the Habitats Directive, EU Biodiversity Strategy for 2020, UN Convention on Biological Diversity, and the Ramsar Convention on Wetlands.
Considering the abovementioned, in this paper we briefly presented the significance of ash dieback disease; it largely affects ash habitats, which are a constituent part of the European biodiversity conservation strategy. Remote sensing comprises cutting-edge technology for detecting, mapping, and monitoring biotic damage. Therefore, our goal was to assess the extent to which the subject of ash dieback is highlighted in the remote sensing research community, especially in the context of overall biotic damage applications. To encourage possible new actions aimed at full-scale evaluation of the present-day potential of remote sensing, a brief but comprehensive overview of the problem and current disease monitoring practices is provided. We evaluate disease lifecycle, the most important visual symptoms and the current state of knowledge obtained from (unfortunately very few) existing remote sensing studies. Some personal experiences and recommendations for the further evolution of satellite data applications, along with pros and cons, are incorporated into the conclusions.
2. Hymenoscyphus Fraxineus—Lifecycle and Visual Symptoms
When analysing biotic factors using remote sensing or terrestrial observations, knowledge of the phenology of the damaging agent and associated host response is a prerequisite. In the context of the application of satellite observations, knowledge regarding the pest biologic cycle and timing of the occurrence of visual symptoms in the canopy determine the optimal time of data acquisition, as well as the optimal reference data required for classifying or training the remotely sensed data [2]. The most dominant feature in invasive plant pests such as Hymenoscyphus fraxineus is their extremely fast spatial propagation [13,14,15]. One general assumption is that the effect of global warming has, to some extent, created new ecological opportunities that favour such an intense spread of plant diseases. The spread of ash dieback disease in Europe since the first observed symptoms in the 1990s is shown on the map in Figure 1. The map shows concentric expansion from the epicentre of the disease located in Northeast Poland [14]. Expansion of the disease is documented in roughly concentric circles, typically with continuous steps of about 30–70 km per year [15].
Ash dieback has a complex lifecycle (Figure 2b). Infection first begins when spores of the fungus, carried by the wind, land on the healthy leaves of ash trees over the summer months. The infection continues and causes severe symptoms on ash leaves, such as necroses. The fungus grows down through the leaf stocks into the woody parts of the tree, causing diamond-shaped lesions that can eventually encircle the branch or the tree’s main stem to cut off the nutrient supply from the leaves. This leads to the loss of part of the canopy or the whole of the crown, especially in younger ash trees. Infected leaves fall on the ground during the autumn months, where the fungus survives over the winter. By early summer, fruiting bodies (very small mushrooms) appear on the leaf stock, releasing microscopic spores into the air that land on healthy ash leaves. Ash dieback disease can thus spread rapidly through wind-carried spores, travelling several kilometres from the source. The strong saprobic competence of fungi in defending the sporulation niche against abiotic stress and microbial competition, which enables the production of a large number of sexual spores, may be the main reason for the successful and invasive spread of this pathogen in Europe [16]. The disease affects trees of all ages, while younger trees show higher susceptibility and faster mortality than older trees (Figure 2a) [14,17]. The symptoms of the disease include foliage wilt and discolouration, which can be seen during the summer months, and orange and brown discolouration of bark with diamond-shaped lesions where the infected stems meet the main trunk. Dieback can also be seen in shoots, twigs and the main stem, resulting in crown dieback. Infected trees also send out excessive side shoots of epicormic branching along the main stem to survive (Figure 2c).
3. Fraxinus Dieback and Operational Forest Monitoring Practices
Up to the present, the most comprehensive assessment of the condition of Fraxinus spp. has been obtained from the pan-European large-scale forest condition monitoring by ICP Forests [13,18]. ICP Forests Level 1 forest crown condition monitoring presents a transnational network of around 6000 plots, positioned on a 16 × 16 km grid in Europe. ICP Forests’ monitoring, launched in 1985, is based on a visual field assessment of the crown condition and damaging agents of each designated tree on the plot and because of this, harmonised methods have been developed and adopted. Initially established to monitor the effect of acid rain on forests, it grew into a system for monitoring the effects of climate change and other large-scale effects on European forests. Uncovering the signals of ash dieback in forest canopies over a large spatial extent proves that this monitoring system is effective for drawing general inferences at the EU level that can support strategic actions [13]. However, at lower scales, such as regional and national scales, the very coarse 16 × 16 km grid makes this monitoring system less applicable. In most cases, insufficient spatial density and the number of observation plots enable forest practitioners to obtain only a broad overview of the current status and trend of the health of the respective tree species (Figure 3a).
According to traditional forest inventory methods, significant defoliation (>25%) of the canopy of some species of forest trees in the Republic of Croatia for the period 2009–2019 was detected [19]. High degradation of narrow-leaved ash (Fraxinus angustifolia Vahl) has been observed in recent years (Figure 3b). The lack of spatially exploitable national-level information that is more suitable for operational forestry and disease management has prompted European countries to develop and apply more suitable approaches to monitoring. For example, in the United Kingdom, monitoring over a 10 × 10 km grid has been used, where a number of cases of Hymenoscyphus fraxineus infection are reported per year [20].
4. Biotic Damage, Dieback of European Ash and Remote Sensing Applications
In detecting and mapping biotic damage, remote sensing has become increasingly popular. Remote sensing techniques and methods enable fast and accurate data acquisition in respect of pest and disease outbreaks using various platforms, e.g., satellites [21], aeroplanes [22], and unmanned aerial vehicles (UAVs) [23]. Diverse symptoms of biotic damage in the tree canopy, such as decreased chlorophyll/water in foliage, leaf discolouration, defoliation, or falls, can be successfully identified at various scales of observations using individual remote sensing devices or a multisensory approach. At the very fine scale, i.e., tree level, UAV hyperspectral imagery, and LiDAR [24] provide the most detailed insights into the forest crown damage status. There are also efficient approaches for tree-level detection using multispectral UAV imagery [25] or very-high-resolution multispectral satellite data [26]. Outbreaks that spread over a larger spatial scale and at the stand level in homogenous forests can be successfully detected using coarser remote sensing imagery such as Landsat [27,28]. Large-scale pest infestations that cause strong canopy discolouration can also be mapped with medium-resolution satellite imagery such as MODIS [29]. Regarding remote sensing applications and biotic damage detection, there are major challenges, particularly the early warning of forest damage, lack of consistent long-term monitoring, and differentiation between forest disturbances [21].
In order to determine the extent to which ash dieback is represented within the remote sensing field considering forest dieback detection, mapping and monitoring, we examined references in the Web of Science (WOS) database, which presents an indicative approach. Therefore, a short survey of the existing literature considering the applications of remote sensing in monitoring the dieback of various forest species was performed. WOS Query Builder was used to extract all literature related to forest dieback, degradation, mortality or damage concerning remote sensing from 2000 to 2020. A total of 2439 references were identified in WOS for the relevant period. Most of the extracted references consider biotic damage on various pine species (59%), followed by spruce (21%), while other species are much less represented (Figure 4). The number of papers investigating ash is extremely small (under 3%) compared to other forest species (Figure 4). The most used satellite data (Figure 4) are from Landsat (51% of papers), followed by MODIS with 15%. In third and fourth place are Sentinel-2 and Sentinel-1 data, used in 15% of all investigated papers. This means that medium (50–250 m spatial resolution—MODIS)- and high-resolution satellite (10–50 m spatial resolution—Landsat and Sentinel missions) imagery are used in almost 81% of cases for monitoring forest dieback. However, very-high-resolution satellite imagery (e.g., Worldview, Quickbird, Ikonos, Planetscope) is used in less than 14% of all papers.
In Germany, Waser et al. [7] conducted fine-scale classification of the various degrees of the crown damage status using WorldView-2. In Great Britain, Chan et al. [8] developed procedures for identifying ash trees in mixed forests and classifying the crown damage status using hyperspectral airborne imagery. Both studies consider Fraxinus excelsior, which is common in Northern Europe. Regarding Fraxinus angustifolia, which is common in Southern Europe, no studies have been recorded in WOS. In addition, no existing studies use more coarse imagery, such as Landsat or Sentinel, although what is presented (Figure 4) and the data from these two high-resolution satellites are the most common in remote sensing biotic damage assessment studies. Unfortunately, these literature reviews show a strikingly low representation of studies, which are disproportionate to the overall significance and extent of the calamity of European ash dieback in the remote sensing community. Based on the abovementioned, our future research on the project “Automatic monitoring of narrow-leaved ash (Fraxinus angustifolia Vahl) forests by remote sensing methods and Copernicus data” (RS4EST, https://rs4est.geof.hr/, accessed on 10 January 2023), founded by the European Space Agency (ESA), will focus on the problem described.
5. Remote Sensing Methods for Monitoring Ash Dieback
According to Chan et al. [8] (2020), “no study has used hyperspectral imagery to monitor H. fraxineus in mixed species forests in Europe”. To date, only four papers have addressed ash dieback monitoring using remote sensing methods and techniques [7,8,30,31]. Remote sensing technologies are highly capable of precise detection and mapping of the anomalies in leaves due to disease infection [3]. Considering remote sensing applicability, there are three primary factors relevant to detecting pest damage: knowing how it is manifested, when it occurs and at what spatial scale [32]. However, to accurately identify the symptoms of infestation, which remote sensors can detect, it is commonly appropriate to preliminary analyse the differences in spectral properties of healthy and infested plants using leaf-level spectroscopy. In this way, the most distinguished spectral range can be identified using high-resolution devices (hyperspectral) that make easier inspection possible via lower-resolution devices such as multispectral satellite sensors. With respect to identifying the spectral signature of leaf infection by Hymenoscyphus fraxineus, an in-depth overview was provided by Thornley [30]. In relation to other research on satellite data, Thornley [30] used the close-range high-spectral-resolution spectrometer ASD FieldSpec Pro (Analytical Spectral Devices, Boulder, CO, USA) for collecting leaf-level reflectance data in the 325–1075 wavelength range at a 1 nm resolution. Leaves were sampled 20 cm from the sensor while still in situ on the tree and in full sunlight [30]. This research confirms that signs of disease can be best distinguished in the earlier seasonal stage (May), in the narrow bandpass of 735–737 nm (red-edge spectral region), most likely due to the lower leaf water content and leaf dehydration. In a later stage (July), the disease can be identified in the bands 640–645 nm, 654–655 nm and 680 nm, which correspond to the areas of maximum absorption of photosynthetic pigments, and because chlorophyll destruction reflectance is higher in diseased leaves than in healthy ones [30]. Therefore, the main symptoms of the disease that multispectral sensors can detect are related to water stress and, to a lesser extent, to the usual signs of biotic damage, such as leaf necroses and discolouration. These results also indicate that multitemporal imagery could be appropriate for disease damage mapping because the spectroscopy discloses the development of distinct signals between healthy and damaged trees over time [30].
The possibility of very-high-resolution satellite imagery for the identification and mapping of different degrees of canopy damage due to Hymenoscyphus fraxineus disease was examined by Waser et al. [7]. They assessed species diversity and the magnitude of ash mortality by classifying seven different tree species and multiple levels of damaged ash. They used multispectral WorldView-2 scene data and object-based supervised classification methods based on multinomial logistic regressions. For the best classification accuracy, they generated a large set of remote sensing indices and feature reduction using linear discriminant analysis (LDA). They successfully classified four different levels of damaged ash with an overall accuracy of 73%. However, this supervised learning approach was supported by the construction of a highly accurate ground truth database of trees with various crown damage statuses. In addition, this study was performed in very heterogeneous forest conditions where ash is mixed with other tree species such as beech, Douglas fir, larch, Norway spruce, poplar and oak. This type of diverse forest environment, where ash appears with other species, is probably very common, in particular in the case of Fraxinus excelsior over Northern Europe. Accurate classification of tree species and identification of ash at the tree level are prerequisites for further classification of its damage status. This fact indicates the suitability of very-high-resolution satellite imagery (<5 m, e.g., WorldView) in the evaluation of the damage status and, conversely, the lesser suitability of high-resolution information (Sentinel, Landsat) where tree canopy segmentation is infeasible.
The most recent study, by Chan et al. [8], is based on airborne hyperspectral sensor data and confirms similar results in classifying ash dieback severity (77% accuracy) using the random forest model. They conducted preliminary segmentation of individual tree crowns and successfully classified the tree species in a mixed forest environment consisting of ash, oak, hazel, maple and elm (>90% accuracy). They conducted a sensing survey in the later part of the vegetation season (August), and they set aside narrow wavebands near the blue (around 415 nm), red-edge (around 680) and near-infra-red (NIR) (around 760 nm) to enable variation across disease classes, which coincides to some extent with the results of [27]. Polk et al. [31] extended the hyperspectral survey results of Chan et al. [8] using an unsupervised learning framework to detect ash disease. Their results confirm a high overlap with the supervised classification of previous work (overall accuracy of 71%). The results are most notable from a practical perspective because they show that accurate ash disease mapping can be performed without the need for costly expert field labelling.
The above studies in Germany and the United Kingdom have confirmed the possibility of effective quantification of various degrees of ash damage (Table 1). They are orientated towards precise forest damage mapping in the later stage of the outbreak. They place emphasis on Fraxinus excelsior dieback, a species that is common in these areas, in very mixed, heterogeneous forest environments, where individual species should be segregated by crown segmentation procedures and classified beforehand according to the species type. According to the authors’ knowledge, there are no available publications (in the English language) regarding remote sensing applications concerning Fraxinus angustifolia, the other ash species that is severely affected by dieback. What is significant about this second type of ash is that it mainly appears in the southern part of Europe.
Fraxinus angustifolia most often inhibits floodplain areas that are important for biological conservation. These floodplain habitats are often constitutive parts of the Natura 2000 network, in particular in respect of Natura 2000 type 91F0, “Riparian mixed forests of Quercus robur, Ulmus laevis and Ulmus minor, Fraxinus excelsior or Fraxinus angustifolia, along the great rivers”. It is appropriate note that, under the influence of humans, the largest part of the floodplain forests in Europe has disappeared [33]. Today, preserved floodplains can only be found in Eastern and Southeastern Europe [34].
Unlike Fraxinus excelsior, Fraxinus angustifolia often forms larger pure forest stands in which symptoms of disease on the crowns can be more pronounced than in mixed forest stands. A homogenous canopy, without the interference of other forest species, potentially makes disease infection easier to identify, even with coarser, high-resolution sensors such as Sentinel-2 and Landsat. This makes it possible to utilise the cost-free Copernicus satellite constellations, which have a relatively short revisit cycle (6 days, Sentinel-1; 5 days, Sentinel-2 under cloud-free conditions) for early detection and monitoring of the spread of disease, which is more important in operational forest management. In one such example, the case of detection and mapping of a sudden and extremely strong outbreak of the disease in a larger Fraxinus angustifolia forest complex was assessed in Croatia, in 2019. The infected area presented one of the precedent cases in Europe, for which several Earth observation (EO) products for operative forest management have been constructed and tested in the scope of the Horizon 2020 “MySustainableForest” project [35]. One of the products was designed to assess biotic damage and pest or disease outbreaks using a change detection approach, i.e., spectral discrepancies between multi-date images based on Sentinel-2. This approach has been successfully applied for mapping bark beetle damage in the Czech Republic [36]. By pure coincidence, during the construction of the service in 2019 in the precedent case in Croatia, an extremely large outbreak of ash dieback disease occurred (due to the excessive rainy conditions in springtime in that year, which helped the extensive spread of the disease), which had not been recorded in previous years. In the total area of the forest management unit, slightly more than 4000 hectares, more than 35,000 cubic meters of dried ash had to be cut down and moved out of the forest. This outbreak was very clearly detected in biotic damage products, which showed the extent of the spread of the forest damage caused by disease (Figure 5). The map of the damage severity was constructed using two Sentinel-2 Level-2A images between summer 2018 (13 August 2018) and 2019 (27 July 2019), and the satellite indices Normalized Difference Vegetation Index (NDVI), Modified Soil Adjusted Vegetation Index (MSAVI), Normalized Difference Moisture Index (NDMI) and green Leaf area index (LAIgreen). These indices were selected as they are direct indicators of vegetation photosynthetic activity (NDMI and MSAVI), vegetation water content (NDMI), and the number of leaves (LAIgreen) [37,38].
Although the abovementioned product is not appropriate for precise identification of the damage status at the tree level, the main hotspots of the disease could be clearly identified via a satellite-based early-warning system. In such intensive cases of infection, the availability of Sentinel-2 data and a relatively short revisit cycle enable near-real-time monitoring of the spread of disease and related forest damage. Another potential option in similar cases of outbreak monitoring is Sentinel-1 radar sensors [39], which are even more practical solutions because radar systems are not affected by clouds. The backscattering energy of the C-band Sentinel-1 radar is very sensitive to the electric permittivity of the Earth’s surface, designated as the dielectric constant. The electromagnetic waves on the Earth’s surface excite water molecules, whose dipole character causes the water molecules to continuously reorient in the electromagnetic radiation’s oscillating field, leading to high dielectric constant values. Vegetation is often described as a cloud of water droplets held in place by dry matter. Therefore, dry vegetation has lower backscattering properties. This phenomenon can also be applied to estimating water deficiency and water stress in vegetation or, considering the identical symptoms of ash dieback disease, to a system for the early detection and monitoring of outbreaks in homogenous ash forests. For illustration, the potential of the application of Sentinel-1 change detection for the identification of outbreaks of ash disease can be observed in the same precedent case in Croatia. In Figure 5, identified zones of the outbreak are also clearly visible in the multidate Sentinel-1 backscattering imagery. Here, the water deficiency in the forest canopy surface, which changes dielectric properties and not defoliation, is potentially the major factor that causes this difference.
After an initial outbreak, further monitoring of disease progression becomes challenging. There is no uniform pattern of tree dieback; some trees are more resistant to disease and can survive for several more years. Therefore, further monitoring requires observations at the individual ash tree level, for which high-resolution (10 m) imagery is inadequate because of the narrow-crowned trees in the managed forests. In addition, there can be possible disturbances of the signal detected on optical or radar sensors caused by the resistance strategies of the infected trees. After propagation of the disease and decline of mostly the top layer of branches, trees react by growing new twigs, most often along the upper part of trunk, i.e., epicormic growth that initiates false intensity of the spectral signal during the dying process. Epicormic growth, therefore, can make it difficult to accurately identify the actual status of crown damage. The spatially heterogeneous process of the dieback and the random occurrence of the canopy openings also cause sudden understory growth that can mask the signal of coarser high-resolution imagery.
The limitations of remote sensing applications concerning ash dieback, and Fraxinus excelsior, in particular, are due to the fact that it most commonly occurs in a mixed-species environment and therefore the spatial resolution of the satellite imagery must be adapted to individual tree health status recognition. For this purpose, very-high-resolution satellite imagery (<5 m) from commercial providers must be utilised, which could be one of the main reasons for such a scarcity of remote sensing applications. Individual ash trees that are scattered across forest complexes also have to be located and separated via image segmentation and object-based image analysis. Higher resolution Sentinel-2 imagery could potentially be applied in cases of disease outbreak detection and monitoring of Fraxinus angustifolia, which often forms pure stands in which the segmentation of individual trees is not quite necessary when detecting the initial spread of the disease. However, in later stages of monitoring, there are further constraints because of the mixing of the direct signal from the surface of the canopy with the so-called false canopy due to epicormic growth and the often strong vegetation undergrowth that accompanies the decay and removal of trees.
The above examples of remote sensing applications confirm that through the use of high-resolution satellite images (Sentinel 1 and 2) with a short repeat cycle, early detection and monitoring of the initial infection and progression of ash disease are feasible. In addition, by applying very-high-resolution satellite images, it is possible to separate individual ash trees and classify them according to the degree of crown damage as a visible external indicator of the progression of the disease. In operational forest management, the aforementioned possibility of timely detection and geo-positioning of disease hotspots enables more efficient removal of damaged trees in the initial stage of infection. In addition to the detection of forest damage itself, the use of satellite information in the context of ash dieback has a potentially added and perhaps more significant effect, which refers to the possibility of precisely identifying trees that are resilient to ash dieback. The controlled breeding of such genetically resistant trees is a key aspect of preserving the ash population in Europe. Accurate positioning of genetically resistant ash trees using contemporary remote sensing technologies can represent an initial step in a more effective, data-driven ash disease management approach. The second step in this process is represented by recent discoveries in the domain of laboratory spectroscopy-based solutions for the detection of genetically controlled ash dieback resistance [40]. These findings show that using relatively fast and accurate laboratory methods, e.g., Fourier-transform infrared spectroscopy, to analyse plant material samples from the field can reliably detect resistant and susceptible ash individuals; that is, it is possible to isolate genetic material for further propagation and silvicultural purposes. In this way, from the perspective of the present state-of-the-art, the coupling of remote sensing and laboratory spectroscopic methods presents a potentially effective solution that could be applied in the operational forestry practice of ash disease management in Europe, in particular with the aim of providing early warnings of disease outbreaks and identifying resilient trees for further propagation.
6. Conclusions
The ash dieback pandemic caused by the fungus Hymenoscyphus fraxineus represents one of the biggest threats to preserving European natural biodiversity. Two main types of ash are affected by the disease: common ash (Fraxinus excelsior), which is found throughout Europe, and narrow-leaved ash (Fraxinus angustifolia), which mainly occurs in Southern Europe. Although in the last decade numerous research studies have been conducted to obtain more extensive knowledge of the disease and the possibility of ash preservation, until now, no effective method of suppression has been found, except through the support and propagation of a very small percentage of genetically resistant trees in the ash population. Likewise, to monitor the spread of disease and the damage status of ash trees, different monitoring methods have been established, mainly based on visual crown assessment on a very sparse spatial scale that is not quite applicable for operational forest management and timely recognition of damage.
Unfortunately, although effective methods for monitoring biotic damage through remote sensing have been developed, the problem of ash dieback has only been addressed in two research studies, in the United Kingdom and Germany. Due to heterogeneous stand conditions, the studies were mainly based on very-high-resolution imagery, and multispectral and hyperspectral data. The authors confirmed that identification of the ash trees and various damage categories could be conducted using remote sensing with satisfactory success. Most existing studies deal with determining the state of forest damage after the infection has already lasted for some time.
Some preliminary results that concern the case of a disease outbreak in narrow-leaved ash forests in Croatia also show the possibilities of application of high-resolution satellite imagery (Sentinel-1 and 2) for initial detection (early warning) and continuous monitoring of forest damage. The use of high-resolution satellite imagery is applicable in cases of monitoring the disease status of narrow-leaved ash, which, unlike common ash, most often forms homogenous forest stands where disease hotspots are more easily identified. From the abovementioned results, it can be concluded that supplementing the existing practices of visual ash disease monitoring with very-high- or high-resolution satellite observations would enable reduction of the spatiotemporal gaps in disease detection and monitoring, providing more synoptic information for operative forest management in respect of the early identification and suppression of forest damage.
Future research will continue the investigation of ash dieback monitoring as part of the project “Automatic monitoring of narrow-leaved ash (Fraxinus angustifolia Vahl) forests by remote sensing methods and Copernicus data” (RS4EST, https://rs4est.geof.hr/, accessed on 10 January 2023) founded by the European Space Agency (ESA).
Author Contributions
Conceptualisation, M.G., I.P. and D.K.; methodology, I.P. and D.K.; software, M.G. and I.P.; validation, I.G. and D.K.; formal analysis, M.G., I.P. and D.K.; investigation, M.G., I.P. and D.K.; resources, M.G.; data curation, M.G.; writing—original draft preparation, M.G., I.P., D.K. and I.G.; writing—review and editing, D.K. and I.G.; visualisation, M.G. and I.P.; supervision, M.G.; project administration, M.G.; funding acquisition, M.G. and I.P. All authors have read and agreed to the published version of the manuscript.
Funding
This work was supported by the European Space Agency (ESA) as part of the scientific project: “Automatic monitoring of narrow-leaved ash (Fraxinus angustifolia Vahl) forests by remote sensing methods and Copernicus data” (Grant No. RS4EST).
Data Availability Statement
No new data were created in this study.
Conflicts of Interest
The authors declare no conflict of interest.
References
- Kautz, M.; Meddens, A.J.H.; Hall, R.J.; Arneth, A. Biotic disturbances in Northern Hemisphere forests—A synthesis of recent data, uncertainties and implications for forest monitoring and modelling. Glob. Ecol. Biogeogr. 2017, 26, 533–552. [Google Scholar] [CrossRef] [Green Version]
- Stone, C.; Mohammed, C. Application of Remote Sensing Technologies for Assessing Planted Forests Damaged by Insect Pests and Fungal Pathogens: A Review. Curr. For. Rep. 2017, 3, 75–92. [Google Scholar] [CrossRef]
- Senf, C.; Seidl, R.; Hostert, P. Remote sensing of forest insect disturbances: Current state and future directions. Int. J. Appl. Earth Obs. Geoinf. 2017, 60, 49–60. [Google Scholar] [CrossRef] [Green Version]
- Torres, P.; Rodes-Blanco, M.; Viana-Soto, A.; Nieto, H.; García, M. The Role of Remote Sensing for the Assessment and Monitoring of Forest Health: A Systematic Evidence Synthesis. Forests 2021, 12, 1134. [Google Scholar] [CrossRef]
- Choi, W.I.; Park, Y.-S. Management of Forest Pests and Diseases. Forests 2022, 13, 1765. [Google Scholar] [CrossRef]
- European Commission; Directorate-General for Environment; Atzberger, C.; Zeug, G.; Defourny, P.; Aragão, L.; Hammarström, L.; Immitzer, M. Monitoring of Forests through Remote Sensing; Final report; Publications Office: Luxembourg, 2020. [Google Scholar] [CrossRef]
- Waser, L.; Küchler, M.; Jütte, K.; Stampfer, T. Evaluating the potential of worldview-2 data to classify tree species and different levels of ash mortality. Remote Sens. 2014, 6, 4515–4545. [Google Scholar] [CrossRef] [Green Version]
- Chan, A.H.Y.; Barnes, C.; Swinfield, T.; Coomes, D.A. Monitoring ash dieback (Hymenoscyphus fraxineus) in British forests using hyperspectral remote sensing. Remote Sens. Ecol. Conserv. 2020, 7, 306–320. [Google Scholar] [CrossRef]
- Caudullo, G.; Houston Durrant, T. Fraxinus angustifolia in Europe: Distribution, habitat, usage and threats. In European Atlas of Forest Tree Species; San-MiguelAyanz, J., de Rigo, D., Caudullo, G., Houston Durrant, T., Mauri, A., Eds.; Publ. Off. EU: Luxembourg, 2016; p. 97. [Google Scholar]
- Beck, P.; Caudullo, G.; Tinner, W.; de Rigo, D. Fraxinus excelsior in Europe: Distribution, habitat, usage and threats. In European Atlas of Forest Tree Species; San-Miguel-Ayanz, J., de Rigo, D., Caudullo, G., Houston Durrant, T., Mauri, A., Eds.; Publ. Off. EU: Luxembourg, 2016; pp. 98–99. [Google Scholar]
- Vasaitis, R.; Enderle, R. Dieback of European Ash (Fraxinus spp.)—Consequences and Guidelines for Sustainable Management; Swedish University of Agricultural Sciences: Uppsala, Sweden, 2017. [Google Scholar]
- Enderle, R.; Stenlid, J.; Vasaitis, R. An overview of ash (Fraxinus spp.) and the ash dieback disease in Europe. CAB. Rev. 2019, 14, 1–12. [Google Scholar] [CrossRef] [Green Version]
- George, J.P.; Sanders, T.G.M.; Timmermann, V.; Potočić, N.; Lang, M. European-wide forest monitoring substantiate the neccessity for a joint conservation strategy to rescue European ash species (Fraxinus spp.). Sci. Rep. 2022, 12, 4764. [Google Scholar] [CrossRef]
- McKinney, L.V.; Nielsen, L.R.; Collinge, D.B.; Thomsen, I.M.; Hansen, J.K.; Kjær, E.D. The ash dieback crisis: Genetic variation in resistance can prove a long-term solution. Plant. Pathol. 2014, 63, 485–499. [Google Scholar] [CrossRef]
- Børja, I.; Timmermann, V.; Hietala, A.M.; Tollefsrud, M.M.; Nagy, N.E.; Vivian-Smith, A.; Cross, H.; Sønstebø, J.H.; Myking, T.; Solheim, H. Ash dieback in Norway-current situation. In Dieback of European ash (Fraxinus spp.): Consequences and Guidelines for Sustainable Management; Vasaitis, R., Enderle, R., Eds.; Swedish University of Agricultural Sciences: Uppsala, Sweden, 2017; pp. 166–175. [Google Scholar]
- Hietala, A.M.; Børja, I.; Solheim, H.; Nagy, N.E.; Timmermann, V. Propagule pressure build-up by the invasive Hymenoscyphus fraxineus following its introduction to an ash forest inhabited by the native Hymenoscyphus albidus. Front. Plant Sci. 2018, 9, 1087. [Google Scholar] [CrossRef] [PubMed] [Green Version]
- Koltay, A.; Szabó, I.; Janik, G. Chalara fraxinea incidence in Hungarian ash (Fraxinus excelsior) forests. J. Agric. Ext. Rural Dev. 2012, 4, 236–238. [Google Scholar] [CrossRef]
- ICP Forests. Available online: http://icp-forests.net/ (accessed on 10 January 2023).
- CFRI. Damage to Forest Ecosystems of the Republic of Croatia Report for 2019; Croatian Forest Research Institute: Jastrebarsko, Croatia, 2019. [Google Scholar]
- Forest Research. Available online: https://www.forestresearch.gov.uk/ (accessed on 10 January 2023).
- Chen, G.; Meentemeyer, R.K. Remote Sensing of Forest Damage by Diseases and Insects. In Remote Sensing for Sustainability; Weng, Q., Ed.; CRC Press: Boca Raton, FL, USA, 2016; pp. 145–162. [Google Scholar]
- Wulder, M.A.; White, J.C.; Ortlepp, S.M.; Mora, B.; Coggins, S.; Coops, N.C.; Heath, J. Digital high spatial resolution aerial imagery to support forest health monitoring: The mountain pine beetle context. J. Appl. Remote Sens. 2012, 6, 062527. [Google Scholar] [CrossRef] [Green Version]
- Bergmüller, A.; Borralho, N.; Cabral, P.; Caetano, M. Recent Advances in Forest Insect Pests and Diseases Monitoring Using UAV-Based Data: A Systematic Review. Forests 2022, 13, 911. [Google Scholar] [CrossRef]
- Yu, R.; Luo, Y.; Zhou, Q.; Zhang, X.; Wu, D.; Ren, L. A machine learning algorithm to detect pine wilt disease using UAV-based hyperspectral imagery and LiDAR data at the tree level. Int. J. Appl. Earth. Obs. Geoinf. 2021, 101, 102363. [Google Scholar] [CrossRef]
- Duarte, A.; Acevedo-Muñoz, L.; Gonçalves, C.I.; Mota, L.; Sarmento, A.; Silva, M.; Fabres, S.; Borralho, N.; Valente, C. Detection of Longhorned Borer Attack and Assessment in Eucalyptus Plantations Using UAV Imagery. Remote Sens. 2020, 12, 3153. [Google Scholar] [CrossRef]
- Navarro-Cerrillo, R.; Varo-Martínez, Á.; Acosta, C.; Palacios Rodriguez, G. Integration of WorldView-2 and airborne laser scanning data to classify defoliation levels in Quercus ilex L. Dehesas affected by root rot mortality: Management implications. For. Ecol. Manag. 2019, 451, 117564. [Google Scholar] [CrossRef]
- Franklin, S.E.; Fan, H.; Guo, X. Relationship between Landsat TM and SPOT vegetation indices and cumulative spruce budworm defoliation. Remote Sens. Lett. 2007, 29, 1215–1220. [Google Scholar] [CrossRef]
- Bright, B.C.; Hudak, A.T.; Meddens, A.J.H.; Egan, J.M.; Jorgensen, C.L. Mapping Multiple Insect Outbreaks across Large Regions Annually Using Landsat Time Series Data. Remote Sens. 2020, 12, 1655. [Google Scholar] [CrossRef]
- Kern, A.; Marjanović, H.; Csóka, G.; Móricz, N.; Pernek, M.; Hirka, A.; Matošević, D.; Paulin, M.; Kovač, G. Detecting the oak lace bug infestation in oak forests using MODIS and meteorological data. Agric. For. Meteorol. 2021, 306, 108436. [Google Scholar] [CrossRef]
- Thornley, R. Leaf level detection of European Ash (Fraxinus excelsior) and Its Associated Fungal Pathogen Hymenoscyphus Fraxineus Using Spectral Analysis. Master’s Thesis, Imperial College London, London, UK, 2018. [Google Scholar] [CrossRef]
- Polk, S.L.; Chan, A.H.; Cui, K.; Plemmons, R.J.; Coomes, D.A.; Murphy, J.M. Unsupervised detection of ash dieback disease (Hymenoscyphus fraxineus) using diffusion-based hyperspectral image clustering. In Proceedings of the IGARSS 2022—2022 IEEE International Geoscience and Remote Sensing Symposium, Kuala Lumpur, Malaysia, 19 April 2022. [Google Scholar] [CrossRef]
- Hall, R.J.; Castilla, G.; White, J.C.; Cooke, B.J.; Skakun, R.S. Remote sensing of forest pest damage: A review and lessons learned from a Canadian perspective. Can. Entomol. 2016, 148 (Supp. S1), S296–S356. [Google Scholar] [CrossRef]
- Chianucci, F.; Minari, E.; Fardusi, M.J.; Merlini, P.; Cutini, A.; Corona, P.; Mason, F. Relationships between overstory and understory structure and diversity in semi-natural mixed floodplain forests at Bosco Fontana (Italy). iForest 2016, 9, 919–926. [Google Scholar] [CrossRef] [Green Version]
- Schneider-Jacoby, M. The Sava and Drava floodplains: Threatened ecosystems of international importance. Šumar. List 2006, 130, 193–217. [Google Scholar] [CrossRef]
- MySustainableForest. Available online: https://mysustainableforest.com/ (accessed on 10 January 2023).
- Fernandez-Carrillo, A.; Patočka, Z.; Dobrovolný, L.; Franco-Nieto, A.; Revilla-Romero, B. Monitoring Bark Beetle Forest Damage in Central Europe. A Remote Sensing Approach Validated with Field Data. Remote Sens. 2020, 12, 3634. [Google Scholar] [CrossRef]
- Delegido, J.; Verrelst, J.; Alonso, L.; Moreno, J. Evaluation of Sentinel-2 Red-Edge Bands for Empirical Estimation of Green LAI and Chlorophyll Content. Sensors 2011, 11, 7063–7081. [Google Scholar] [CrossRef] [Green Version]
- Pasqualotto, N.; Delegido, J.; Van Wittenberghe, S.; Rinaldi, M.; Moreno, J. Multi-Crop Green LAI Estimation with a New Simple Sentinel-2 LAI Index (SeLI). Sensors 2019, 19, 904. [Google Scholar] [CrossRef] [PubMed] [Green Version]
- Hollaus, M.; Vreugdenhil, M. Radar Satellite Imagery for Detecting Bark Beetle Outbreaks in Forests. Curr. For. Rep. 2019, 5, 240–250. [Google Scholar] [CrossRef] [Green Version]
- Villari, C.; Dowkiw, A.; Enderle, R.; Ghasemkhani, M.; Kirisits, T.; Kjær, E.D.; Marčiulynienė, D.; McKinney, L.V.; Metzler, B.; Muñoz, F.; et al. Advanced spectroscopy-based phenotyping offers a potential solution to the ash dieback epidemic. Sci. Rep. 2018, 8, 17448. [Google Scholar] [CrossRef] [Green Version]
Figure 1.
Distribution map of common ash (Fraxinus excelsior) (source: [14], reprinted with permission from Ref. [14]. Copyright 2023, John Wiley and Sons).
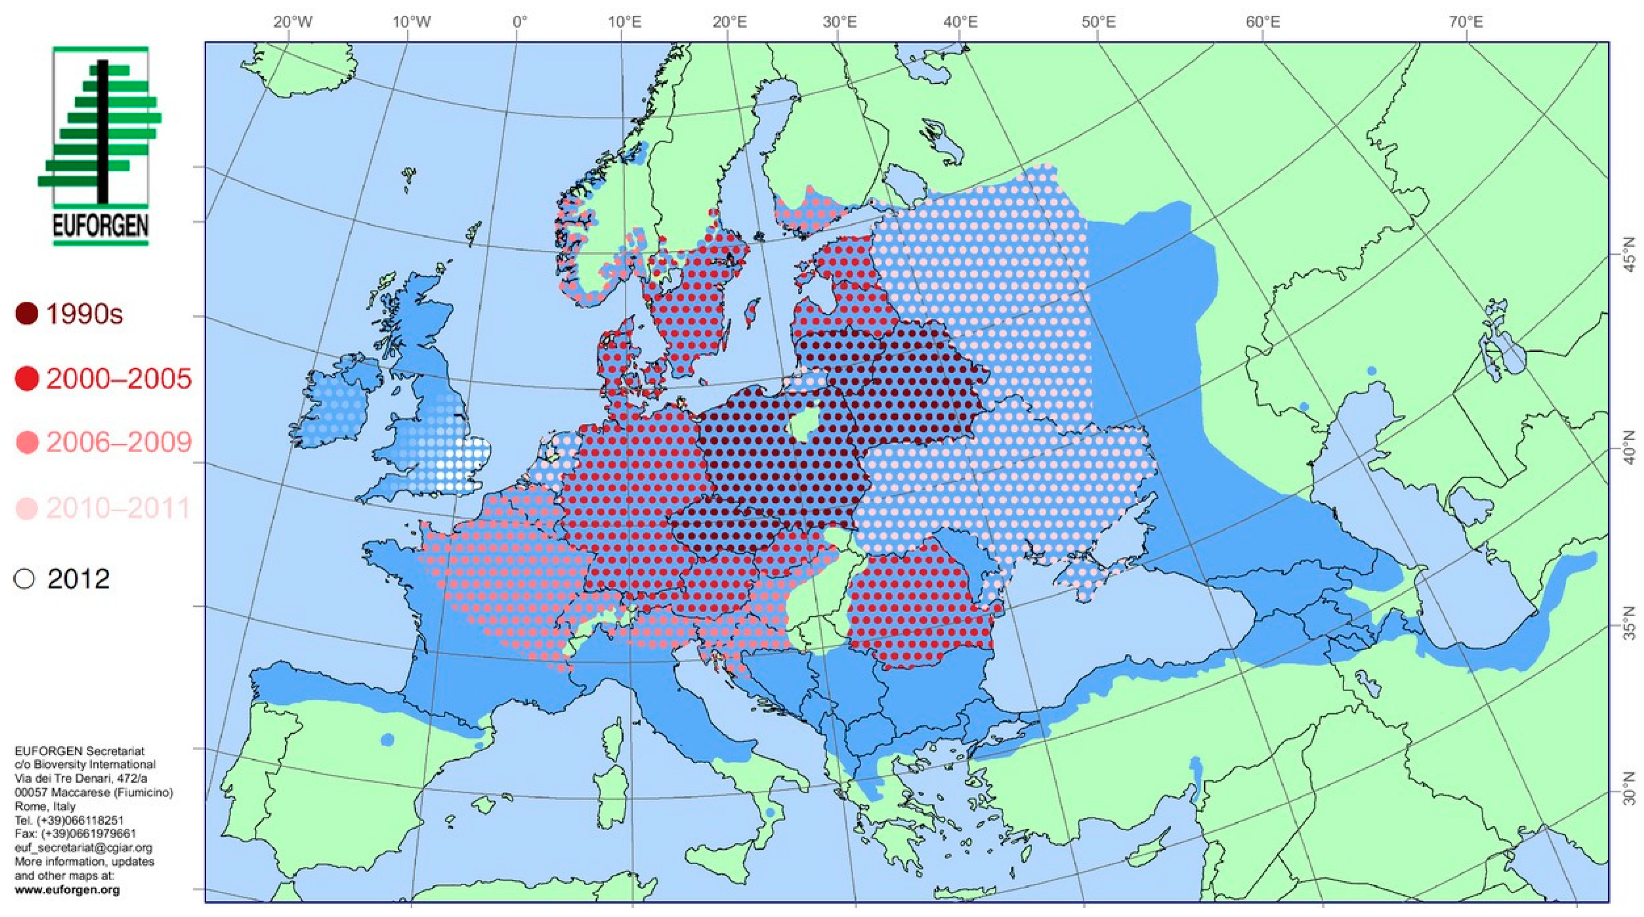
Figure 2.
(a) Hymenoscyphus fraxineus disease symptoms: mushroom-like fruiting bodies (top); diamond-shaped lesions (middle upper); shoot wilting and leaf necrosis (middle lower and bottom) (source: Forest Research, www.forestresearch.gov.uk, accessed on 10 January 2023). (b) Lifecycle and symptoms (source: Teagasc—Agriculture and Food Development Agency, www.teagasc.ie, accessed on 10 January 2023) and (c) narrow-leaved ash (Fraxinus angustifolia) dieback; location Radinje forest, Croatia.

Figure 3.
(a) Overview of analysed survey plots from the ICP Forests Level I dataset (source: [13]) and (b) overview of significant defoliation (>25%) of canopy of some species of forest trees in the Republic of Croatia for the period 2009–2019 (source: [19]).

Figure 4.
Published papers related to forest species dieback and remote sensing categorized by (a) dominant species and (b) relevant satellite mission.
Figure 4.
Published papers related to forest species dieback and remote sensing categorized by (a) dominant species and (b) relevant satellite mission.

Figure 5.
(a) Map of ash damage status due to Hymenoscyphus fraxineus dieback in 2019. Natura 2000 floodplain Fraxinus angustifolia forest, near Donji Miholjac, Croatia, and (b) segment of the area showing ash dieback detected by SAR, Sentinel-1 backscattering colour composite (period 1 June–31 July 2019) (source: MySustainableForest, https://mysustainableforest.com/, accessed on 10 January 2023).


Table 1.
Remote sensing methods for monitoring ash dieback published in previous research.
| Platform Sensor | Resolution | Location and Study Area | Method | Accuracy and Damage Degree Number | Mixed Forest Species | Reference and Year |
|---|---|---|---|---|---|---|
| Satellite WorldView-2 | 0.5 PAN 2 m MS | Germany one study area ~6000 ha | Object-based classification approaches Multinomial regression techniques | 73% four classes | Yes | Waser et al., 2014 [7] |
| Close-range Hyperspectral spectrometer ASD FieldSpec Pro | <0.01 m | United Kingdom 2 study areas | Partial least-squares, Random forest Support vector machine for spectrometer analysis | * | Thornley 2018 [30] | |
| Airborne Hyperspectral sensor Hyspex VNIR 1800 | 0.32 m | United Kingdom four study areas each <20 ha | Random forest classification | 77% three classes | Yes | Chan et al., 2020 [8] |
| Airborne Hyperspectral sensor Hyspex VNIR 1800 | 0.32 m | United Kingdom four study areas each <20 ha | Unsupervised learning framework for classification | 71% three classes | Yes | Polk et al., 2022 [31] |
* Methods were used for determining spectrum regions suitable for ash disease detection, not for classification and mapping of ash dieback.
Disclaimer/Publisher’s Note: The statements, opinions and data contained in all publications are solely those of the individual author(s) and contributor(s) and not of MDPI and/or the editor(s). MDPI and/or the editor(s) disclaim responsibility for any injury to people or property resulting from any ideas, methods, instructions or products referred to in the content. |
© 2023 by the authors. Licensee MDPI, Basel, Switzerland. This article is an open access article distributed under the terms and conditions of the Creative Commons Attribution (CC BY) license (https://creativecommons.org/licenses/by/4.0/).
Share and Cite
MDPI and ACS Style
Gašparović, M.; Pilaš, I.; Klobučar, D.; Gašparović, I. Monitoring Ash Dieback in Europe—An Unrevealed Perspective for Remote Sensing? Remote Sens. 2023, 15, 1178. https://doi.org/10.3390/rs15051178
AMA Style
Gašparović M, Pilaš I, Klobučar D, Gašparović I. Monitoring Ash Dieback in Europe—An Unrevealed Perspective for Remote Sensing? Remote Sensing. 2023; 15(5):1178. https://doi.org/10.3390/rs15051178
Chicago/Turabian StyleGašparović, Mateo, Ivan Pilaš, Damir Klobučar, and Iva Gašparović. 2023. "Monitoring Ash Dieback in Europe—An Unrevealed Perspective for Remote Sensing?" Remote Sensing 15, no. 5: 1178. https://doi.org/10.3390/rs15051178
Note that from the first issue of 2016, this journal uses article numbers instead of page numbers. See further details here.