Article

Enhancing Path Planning Efficiency for Underwater Gravity Matching Navigation with a Novel Three-Dimensional Along-Path Obstacle Profiling Algorithm

1
China Academy of Aerospace Science and Innovation, Beijing 100088, China
2
School of Automation, Nanjing University of Science and Technology, Nanjing 210094, China
3
School of Information Science and Engineering, Harbin Institute of Technology, Weihai 264209, China
4
Qian Xuesen Laboratory of Space Technology, China Academy of Space Technology, Beijing 100094, China
5
School of Electronics and Information Engineering, Harbin Institute of Technology, Harbin 150001, China
*
Author to whom correspondence should be addressed.
These authors contributed equally to this work.
Remote Sens. 2023, 15(23), 5579; https://doi.org/10.3390/rs15235579
Submission received: 16 October 2023 / Revised: 14 November 2023 / Accepted: 21 November 2023 / Published: 30 November 2023

Abstract

:
This paper presents a study on enhancing the efficiency of underwater gravity matching navigation path planning in a three-dimensional environment. Firstly, to address the challenges of the computational complexity and prolonged calculation times associated with the existing three-dimensional path planning algorithms, a novel Three-Dimensional Along-Path Obstacle Profiling (TAOP) algorithm is introduced. The principles of the TAOP algorithm are as follows: (1) unfolding obstacles along the path using the path obtained from two-dimensional planning as an axis, interpolating water depth values based on downloaded terrain data, and subjecting obstacles to dilation treatment to construct a dilated obstacle profile for path segments; (2) conducting height direction course planning and a secondary optimization of the path based on the profile contours of the dilated obstacles; and (3) integrating height planning with the path points from two-dimensional planar planning to obtain a complete path containing all turning points in the three-dimensional space. Secondly, gravity anomaly data are utilized to delineate gravity suitability areas, and a three-dimensional planning environment that is suitable for underwater gravity matching navigation is established by integrating seafloor terrain data. Under identical planning environments and parameter conditions, the performance of the TAOP algorithm is compared to that of the RRT* algorithm, Q-RRT* algorithm, and Depth Sorting Fast Search (DSFS) algorithm. The results show that, compared to the RRT* algorithm, Q-RRT* algorithm, and DSFS algorithm, the TAOP algorithm achieves efficiency improvements of 15.6 times, 5.98 times, and 4.04 times, respectively.

Graphical Abstract

1. Introduction

Currently, inertial navigation systems are the primary navigation tools used for underwater vehicles. They do not rely on external information and can provide real-time, continuous, autonomous, and all-weather data such as position, velocity, acceleration, and attitude, meeting the requirements of underwater navigation for concealment and reliability [1,2,3,4]. However, the drift error of inertial devices accumulates over time, leading to a gradual decrease in the navigation accuracy of the inertial navigation system, which cannot meet the accuracy requirements for long-duration missions. Therefore, regular calibration using other navigation methods is necessary [5,6].
Gravity matching navigation utilizes variations in the Earth’s gravity field for positioning and does not require signal transmission and reception. It possesses strong anti-interference capabilities and can meet the requirements of underwater navigation for concealment and positioning reliability, making it one of the most suitable navigation methods for aiding inertial navigation systems [7,8,9]. Gravity matching navigation acquires the gravity-related information of the current position using a gravity sensor. By comparing the real-time measurements with a prestored gravity field reference map and employing suitable matching and solving algorithms, the position of the vehicle is estimated, thus correcting the navigation errors of the inertial navigation system. The positioning accuracy and success rate of gravity matching navigation are closely related to the distribution of gravity field characteristics in the navigation area. The same matching algorithm exhibits different matching effects in regions with different gravity features, and areas with rich gravity features can significantly improve the matching accuracy [
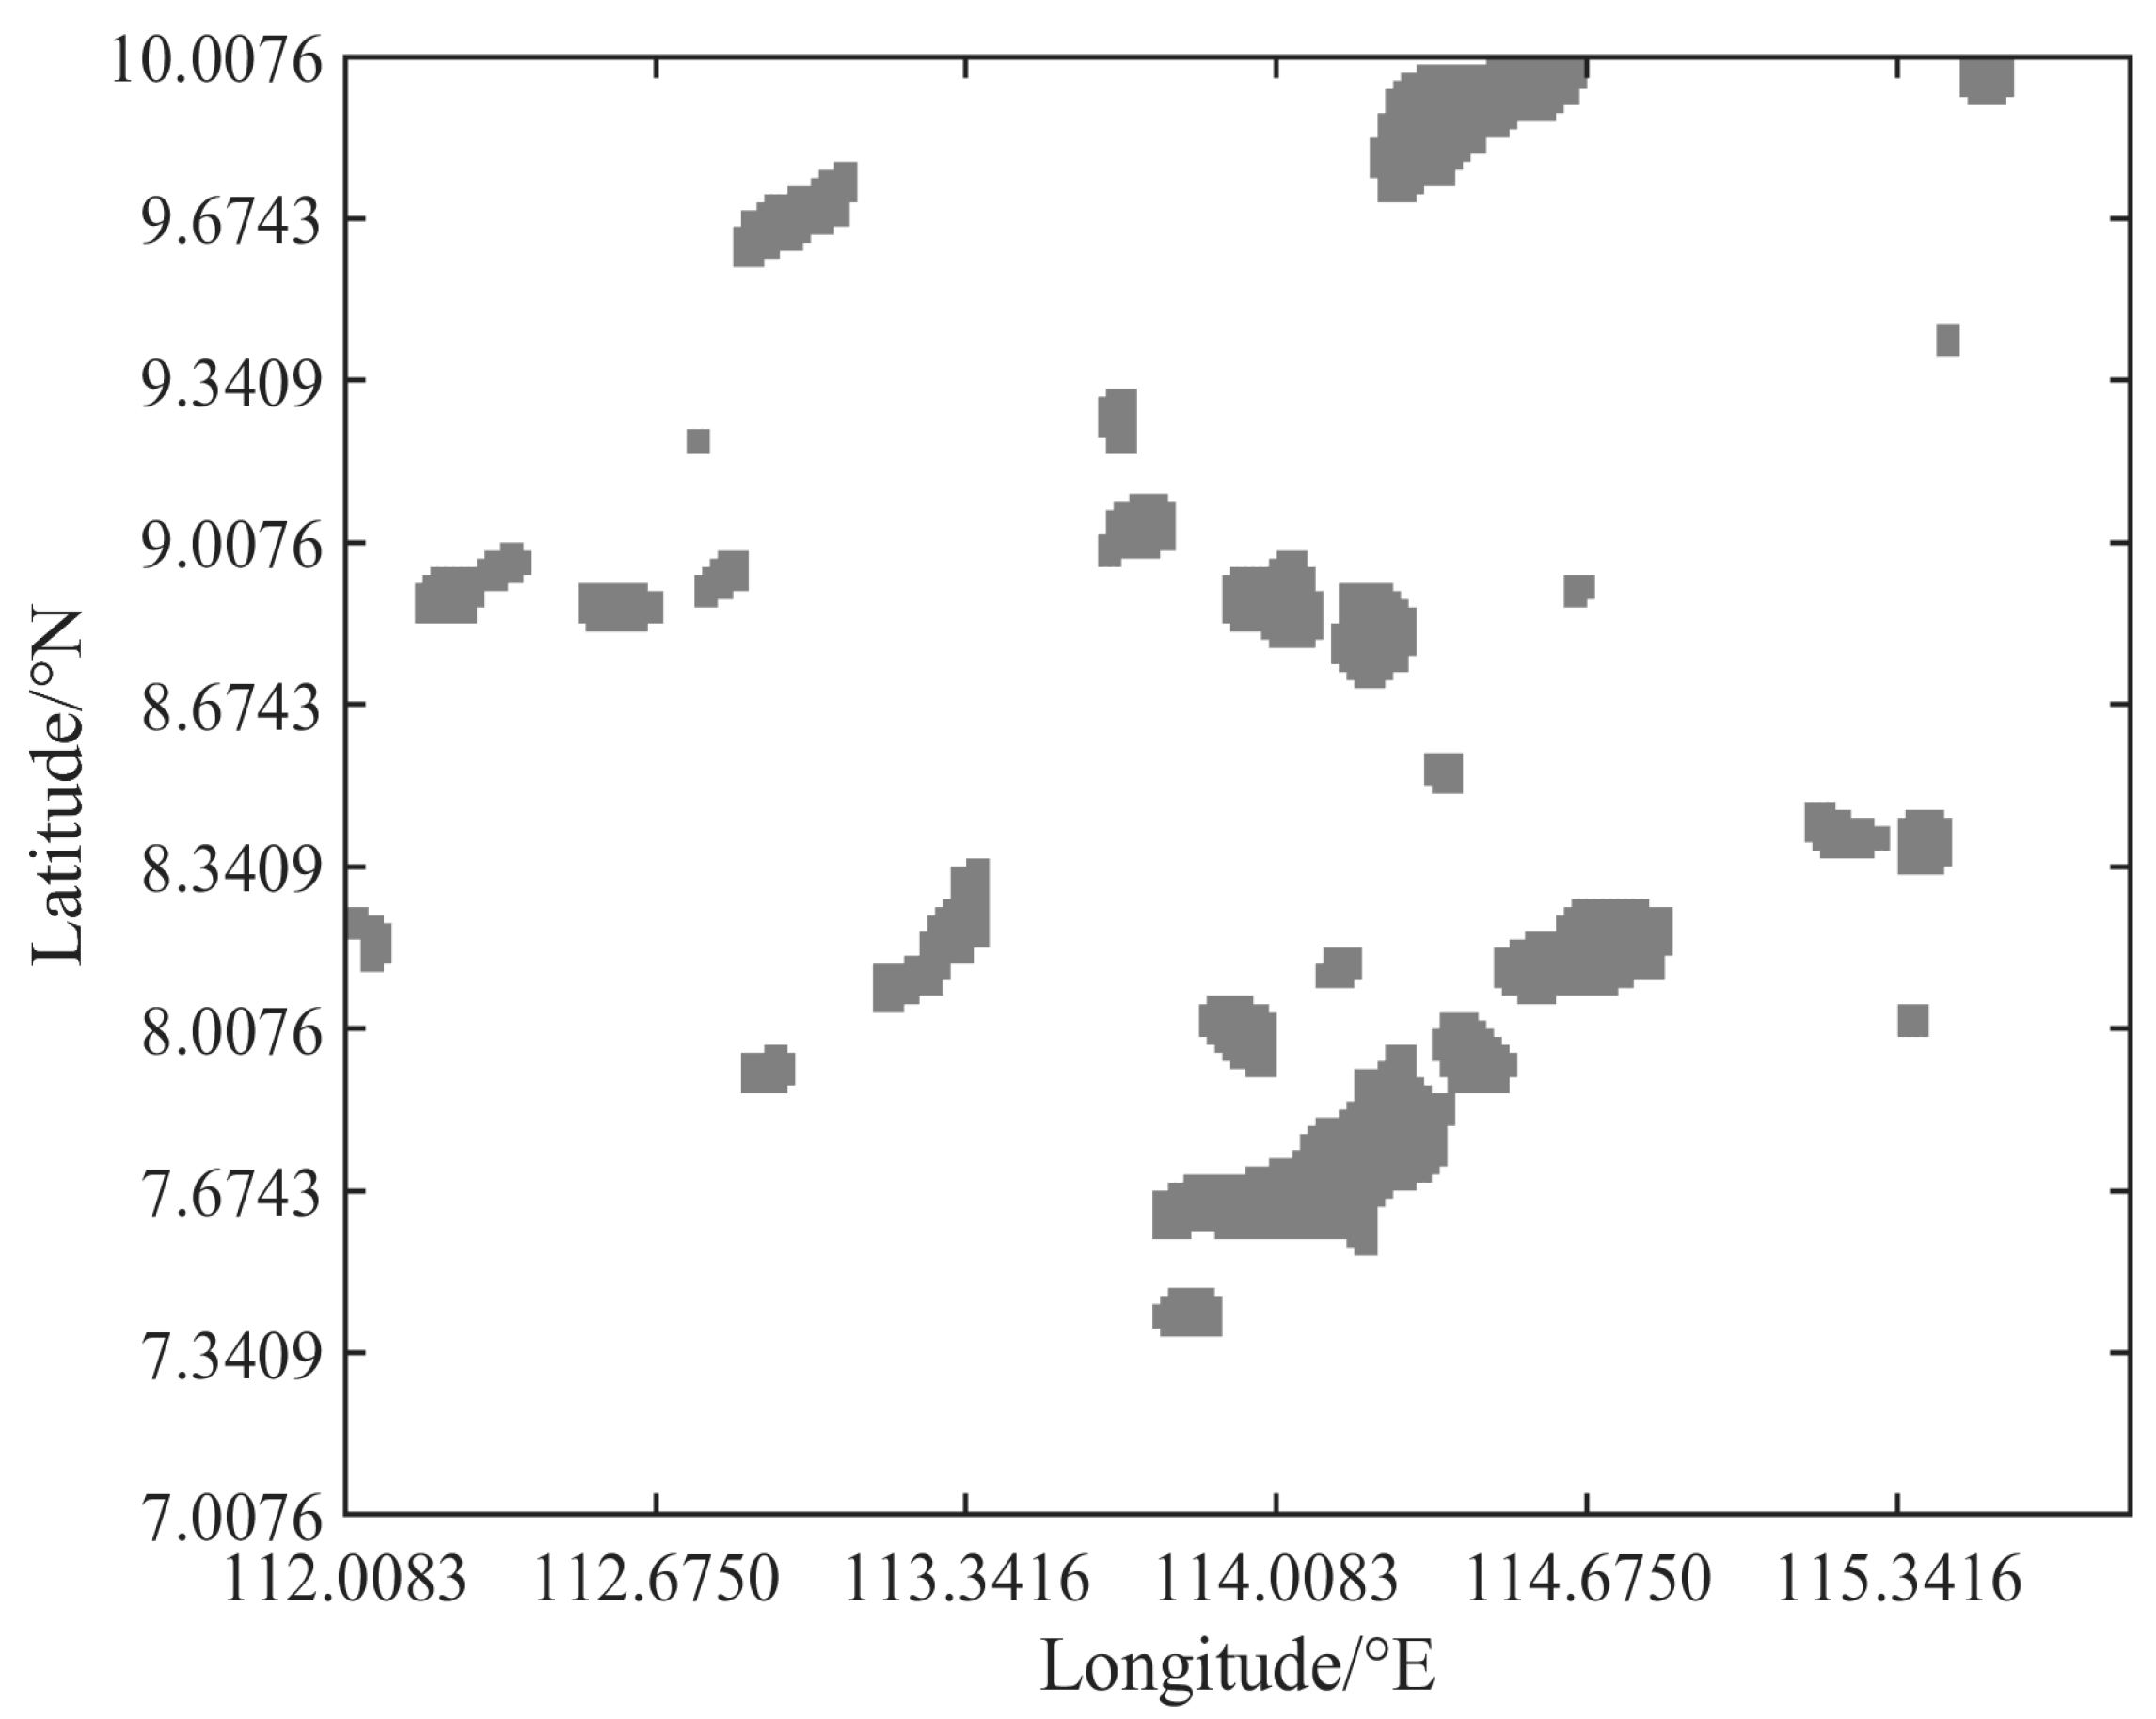
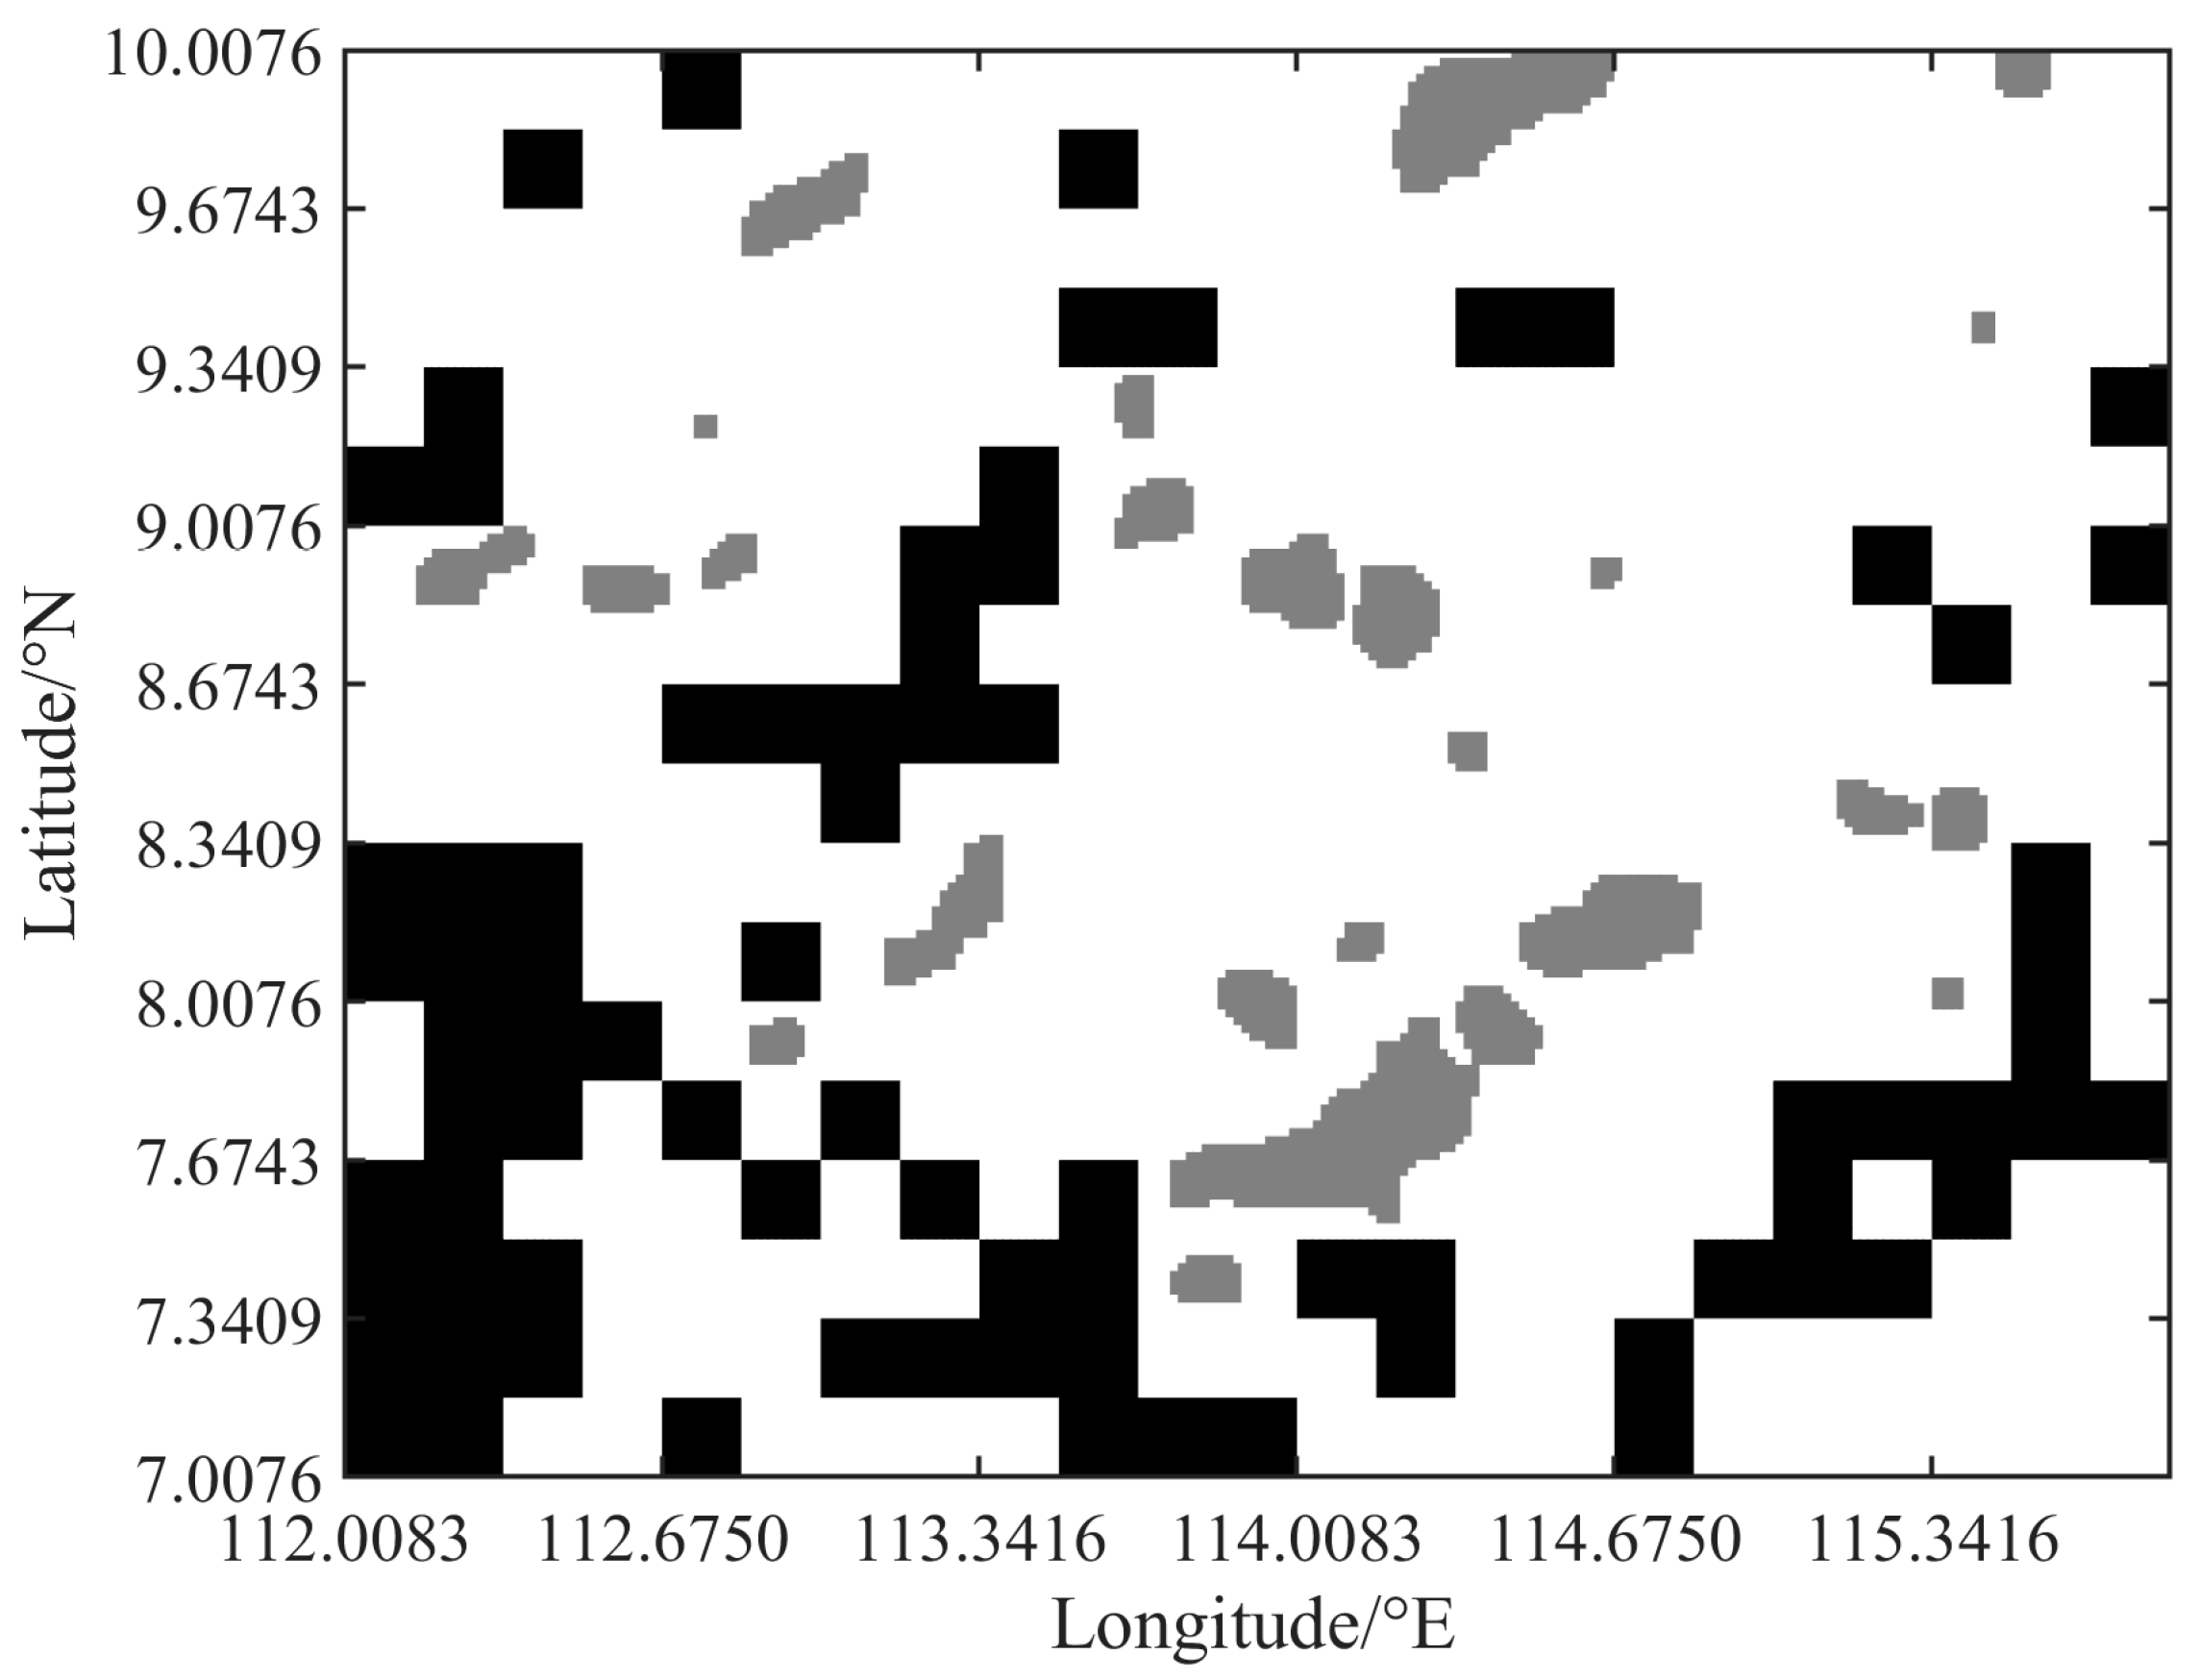
10]. Therefore, to ensure the effectiveness of gravity matching navigation, it is necessary to evaluate the suitability of the navigational area based on gravity features and plan the trajectory in accordance with the distribution of suitability, ensuring that the trajectory remains within the suitable region.
Traditional underwater gravity matching navigation path planning algorithms are typically based on two-dimensional maps and cannot effectively adapt to the complex underwater terrain and obstacles [11,12,13]. Researching and applying path planning algorithms for underwater three-dimensional space is of great significance in advancing underwater autonomous navigation technology and enhancing the safety and reliability of underwater devices. Despite significant achievements in two-dimensional path planning algorithms, extending them directly to three-dimensional space is not a straightforward task. Compared to the two-dimensional plane, a three-dimensional space involves more degrees of freedom and a more complex physical environment, which imposes higher requirements on path planning algorithms. For instance, in terms of computational complexity and storage space, three-dimensional path planning algorithms need to overcome greater challenges. Currently, the commonly used three-dimensional path planning algorithms include the artificial potential field method, A* algorithm, ant colony algorithm, and rapidly exploring random tree (RRT) algorithm. The artificial potential field method is a path planning approach that mimics natural potential fields. It constructs an artificial potential field where the target exerts attraction on objects and obstacles exert repulsion, causing objects to move in the direction of the potential field gradient to reach the destination. However, this method can sometimes result in objects becoming trapped in local minima and being unable to reach the target location, thus not guaranteeing a solution [14,15]. The A* algorithm is a heuristic-based path planning method that utilizes cost functions to obtain information about the distance to the goal, directing the search towards finding the path with the minimum cost and shortest distance. However, this method has limited real-time performance, with large computational requirements and long processing times for each node. As the number of nodes increases, the efficiency of the algorithm decreases [16,17]. The ant colony algorithm is a heuristic path planning method that simulates the foraging behavior of ants, treating the target as a food source and obstacles as impassable regions. It finds the optimal path by updating the pheromone concentration. The ant colony algorithm has strong robustness and can be combined with other algorithms. However, its convergence speed is relatively slow in the initial stage, and it is sensitive to the selection of initial solutions [18,19].
The RRT algorithm is a randomized search-based path planning method that constructs a random tree to explore the state space and quickly find a feasible path from the start point to the goal. The algorithm starts with an initial state as the root node and randomly samples a state at each iteration, attempting to connect it with the nearest state in the tree. If the connection is successful (without intersecting obstacles and satisfying other constraints), the new state is added to the tree [20,21]. Traditional RRT algorithms can find feasible paths, but they are not necessarily optimal and have slow convergence speeds and long search times. The RRT* algorithm improves upon this by introducing the process of reselecting the parent node for new nodes within a certain radius and rewiring nearby nodes. This modification enables the RRT* algorithm to exhibit asymptotic optimality, meaning that as the number of iterations increases indefinitely, the found path tends to be optimal. However, the convergence speed of the algorithm is influenced by the size of the bounding hyperball. Increasing the radius leads to a significant increase in the number of nodes within the hyperball, resulting in longer computation times [22,23,24,25]. To improve the search efficiency of the RRT* algorithm, the Q-RRT* algorithm extends the range of parent node selection for new nodes and nearby nodes based on the triangle inequality, which can generate better initial paths and achieve a faster convergence speed [26,27]. RRT-based algorithms exhibit significantly reduced search efficiency when dealing with high-dimensional spaces and complex obstacles, leading to a substantial increase in the required number of iterations and computation time [28,29,30,31,32]. The Depth Sorting Fast Search (DSFS) algorithm enhances the efficiency of the parent node reselection process and rewiring process by utilizing the inequality relationship between ancestor nodes and their descendants. It achieves this by selecting candidate nodes in depth-first order, thereby reducing the number of nodes that require collision detection and effectively saving computation time [33].
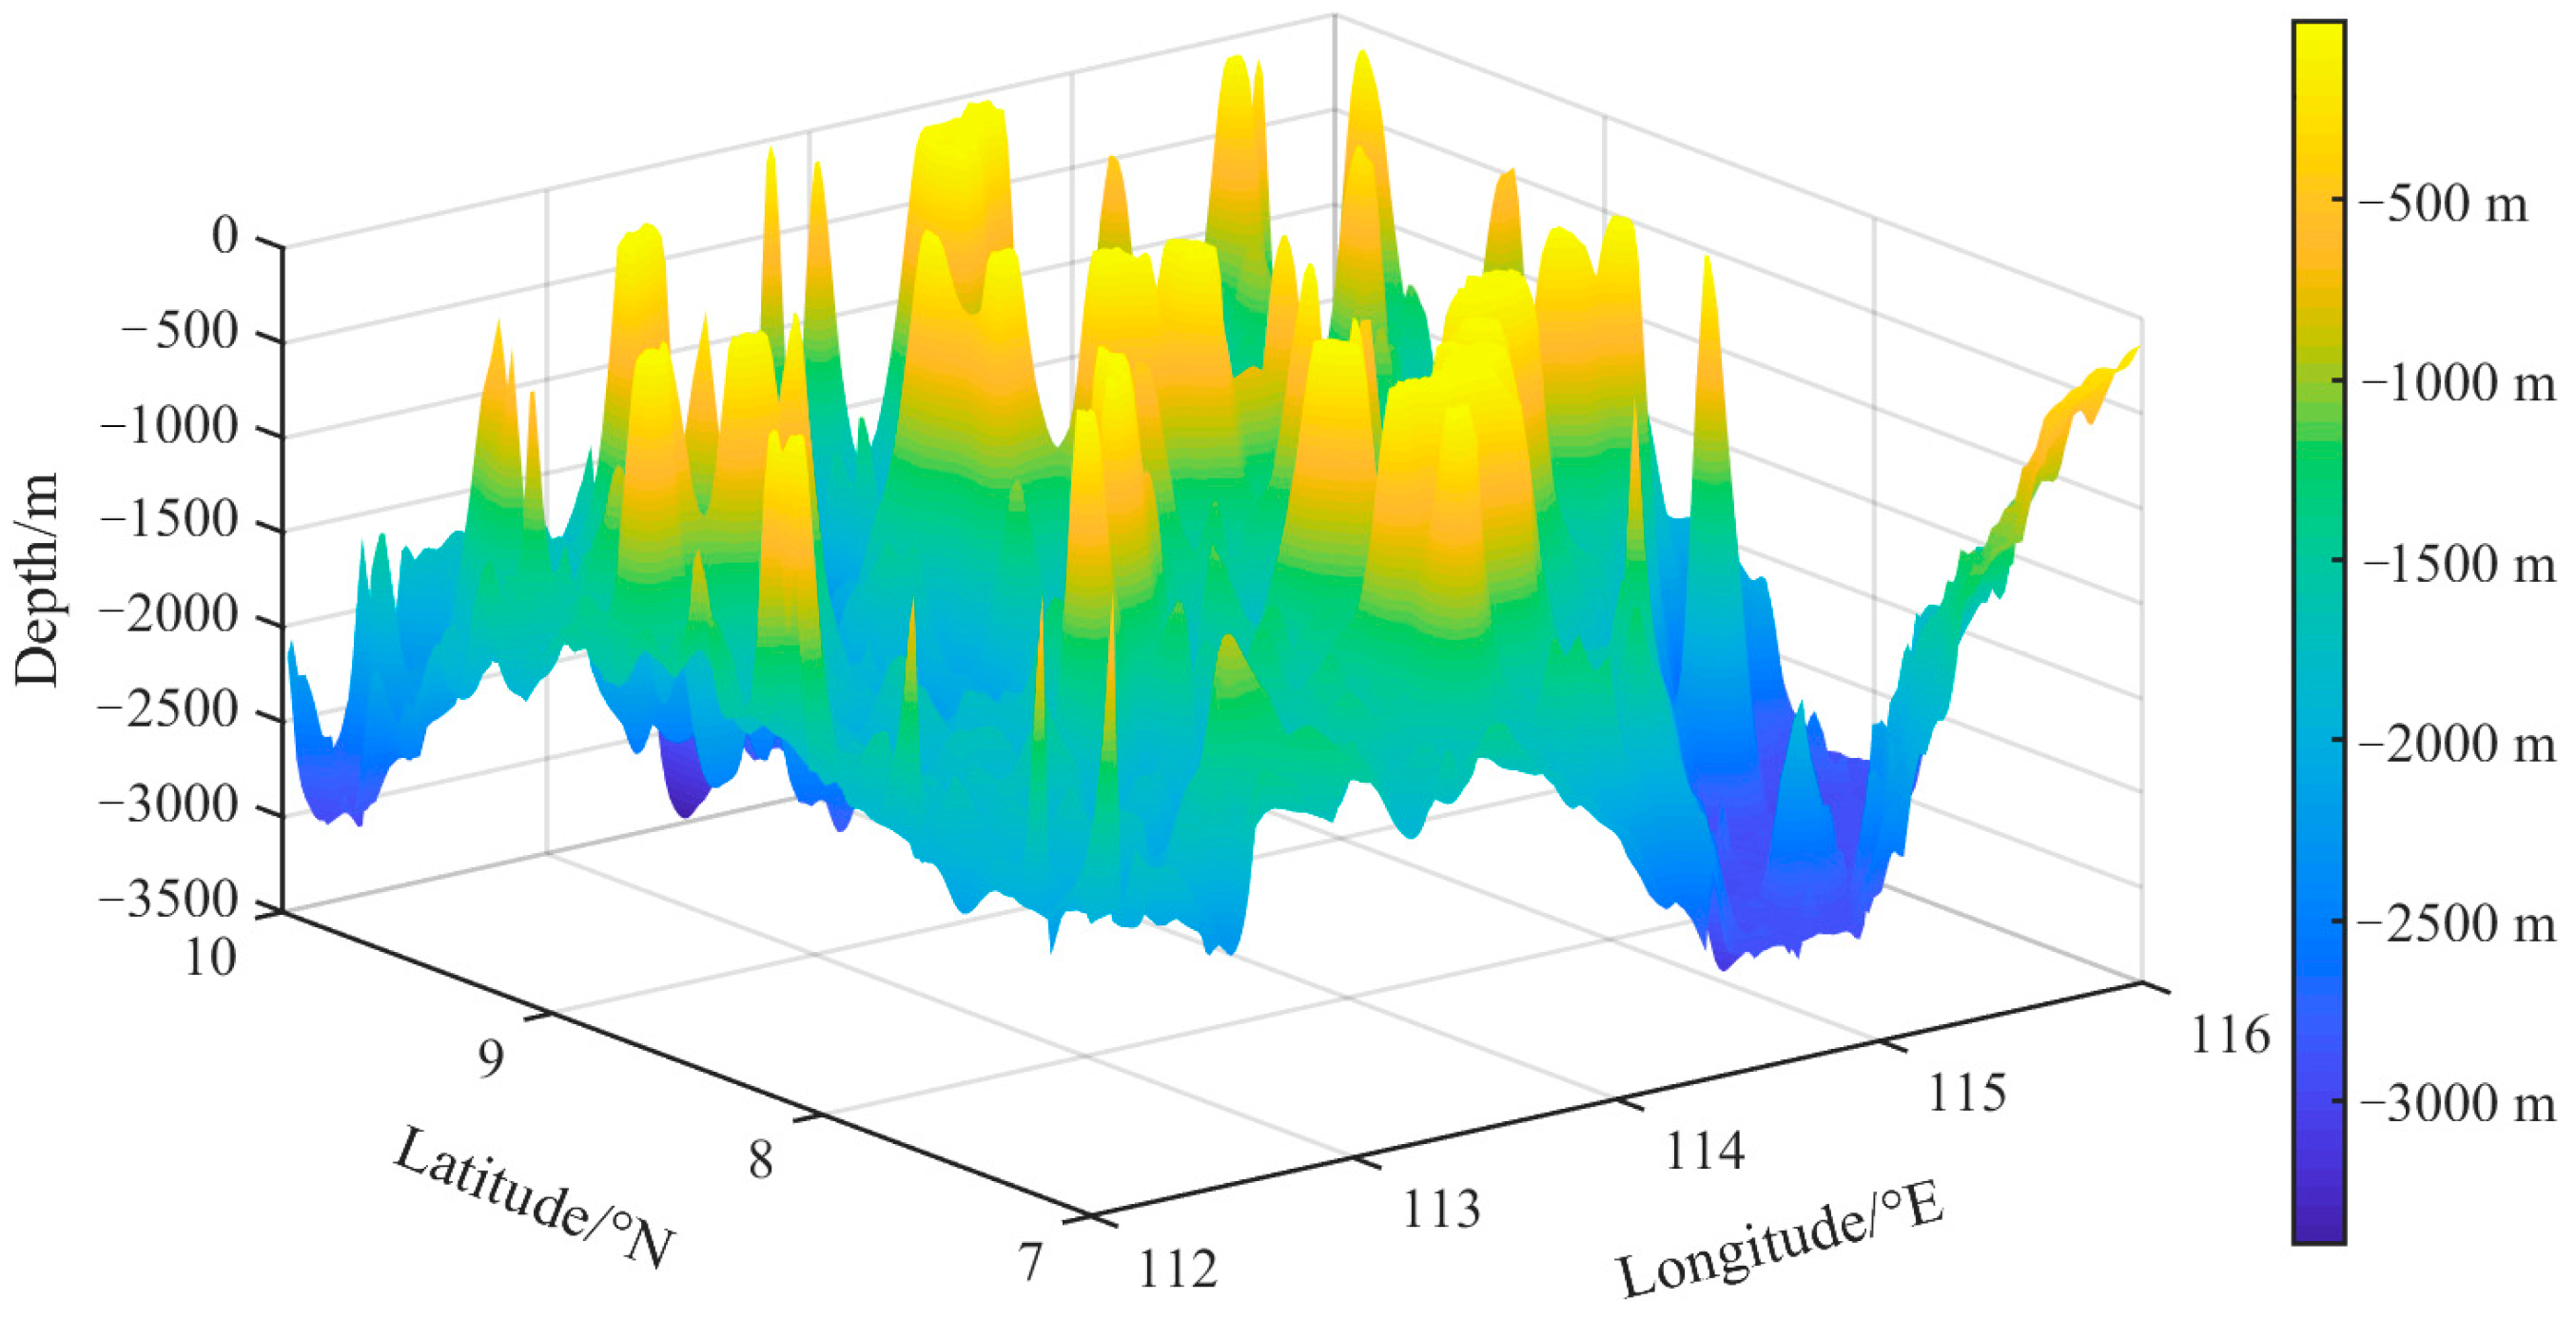
Differing from previous research, this paper proposes a novel Three-Dimensional Along-Path Obstacle Profiling (TAOP) algorithm aimed at further enhancing the efficiency of underwater gravity-matching navigation in three-dimensional environments. The TAOP algorithm decomposes three-dimensional path planning into two-dimensional planning and a height planning phases. It can be seamlessly integrated with existing planar path planning algorithms, thereby circumventing the low computational efficiency issue of current path planning methods in three-dimensional scenarios. Additionally, by combining gravity anomaly data and seafloor terrain data, a three-dimensional planning environment that is suitable for underwater gravity-matching navigation is established, and performance simulation tests for route planning are conducted within this environment. Through a comparison of the RRT*, Q-RRT*, and DSFS algorithms, various factors including the initial path quality and computation time are evaluated. This validation demonstrates that the TAOP algorithm is capable of achieving rational path planning for underwater gravity-matching navigation and effectively improving planning efficiency.

2. Three-Dimensional Along-Path Obstacle Profiling Algorithm

When performing three-dimensional path planning for underwater gravity-matching navigation, it is necessary to consider both gravity suitability, to ensure the normal operation of the navigation system, and seamount constraints, to ensure safe navigation. When RRT-based algorithms directly sample in three-dimensional space, the collision detection of the edges of the random tree requires both being in a gravity suitability grid and maintaining a safe distance from the seamount in the height direction, which places high demands on the nodes. The number of invalid nodes sampled in a three-dimensional space far exceeds that in the plane, which leads to a very high failure rate of collision detection, an excessive computational load, and a slow convergence of the planning algorithm. The calculation time is too long, and even feasible solutions cannot be found. Moreover, when the sampling range covers the entire three-dimensional planning space, the effective nodes are dispersed, resulting in large path volatility and a high path cost. In addition, each time collision detection is performed, it is necessary to interpolate the water depth at each detection point on the path to ensure a safe distance from obstacles. However, interpolation in large-scale terrain data is a time-consuming computational step, which greatly affects the computation time.
To address these issues, this paper proposes the Three-Dimensional Along-Path Obstacle Profiling (TAOP) algorithm, which transforms three-dimensional path planning into two separate processes: two-dimensional planar planning and height planning. First, based on the gravity suitability distribution map, a two-dimensional planning algorithm is employed to plan the planar path points. Next, obstacles along the path are unfolded along the planar path axis, and interpolation is used to generate a seamount obstacle profile graph with the distance from the starting point along the path as the horizontal axis and the elevation information as the vertical axis. Finally, by utilizing the obstacle profile information, the height of the path points is planned to ensure safety in the height direction. The TAOP algorithm separates height planning from planar planning, and gravity suitability actually only acts on the planar directions of the latitude and longitude, where planar planning is directly related to gravity suitability. Using planar planning to sample in a two-dimensional plane can reduce the number of invalid sampling nodes significantly, and it does not require the consideration of the impact of seamounts on the height, which greatly reduces the amount of collision detection calculations. The interpolation operation is only performed once in the preprocessing stage to generate the profile of the obstacle, effectively shortening the calculation time. The TAOP algorithm unfolds the profile of the obstacle along the path after planar planning, and it generates a three-dimensional path based on the profile contour according to height planning, which can be used in combination with most two-dimensional planning algorithms.
The TAOP algorithm mainly includes four steps, with the basic procedure shown in Algorithm 1 and the schematic diagram shown in Figure 1: planar path point data preprocessing ( Preprocess - TAOP ), path coarse planning ( CoarsePlan - TAOP ), path secondary optimization ( Optimize - TAOP ), and path point integration ( Integrate - TAOP ).
Algorithm 1  TAOP ( P pre , d obs , d delta )
P d Preprocess - TAOP ( P pre , d obs , d delta ) ;
P r CoarsePlan - TAOP ( P d ) ;
P opt Optimize - TAOP ( P r ) ;
P mer Integrate - TAOP ( P pre , P opt ) ;
return  P mer ;
Explanation of parameters in Algorithm 1:
  • P pre : The set of planar path points;
  • d obs : The safe distance from terrain obstacles;
  • d delta : The interval distance when generating the obstacle profile;
  • P d : The set of location points to be verified;
  • P r : The set of coarse planned path points;
  • P opt : The set of secondary optimization path points;
  • P mer : The set of integrated path points.
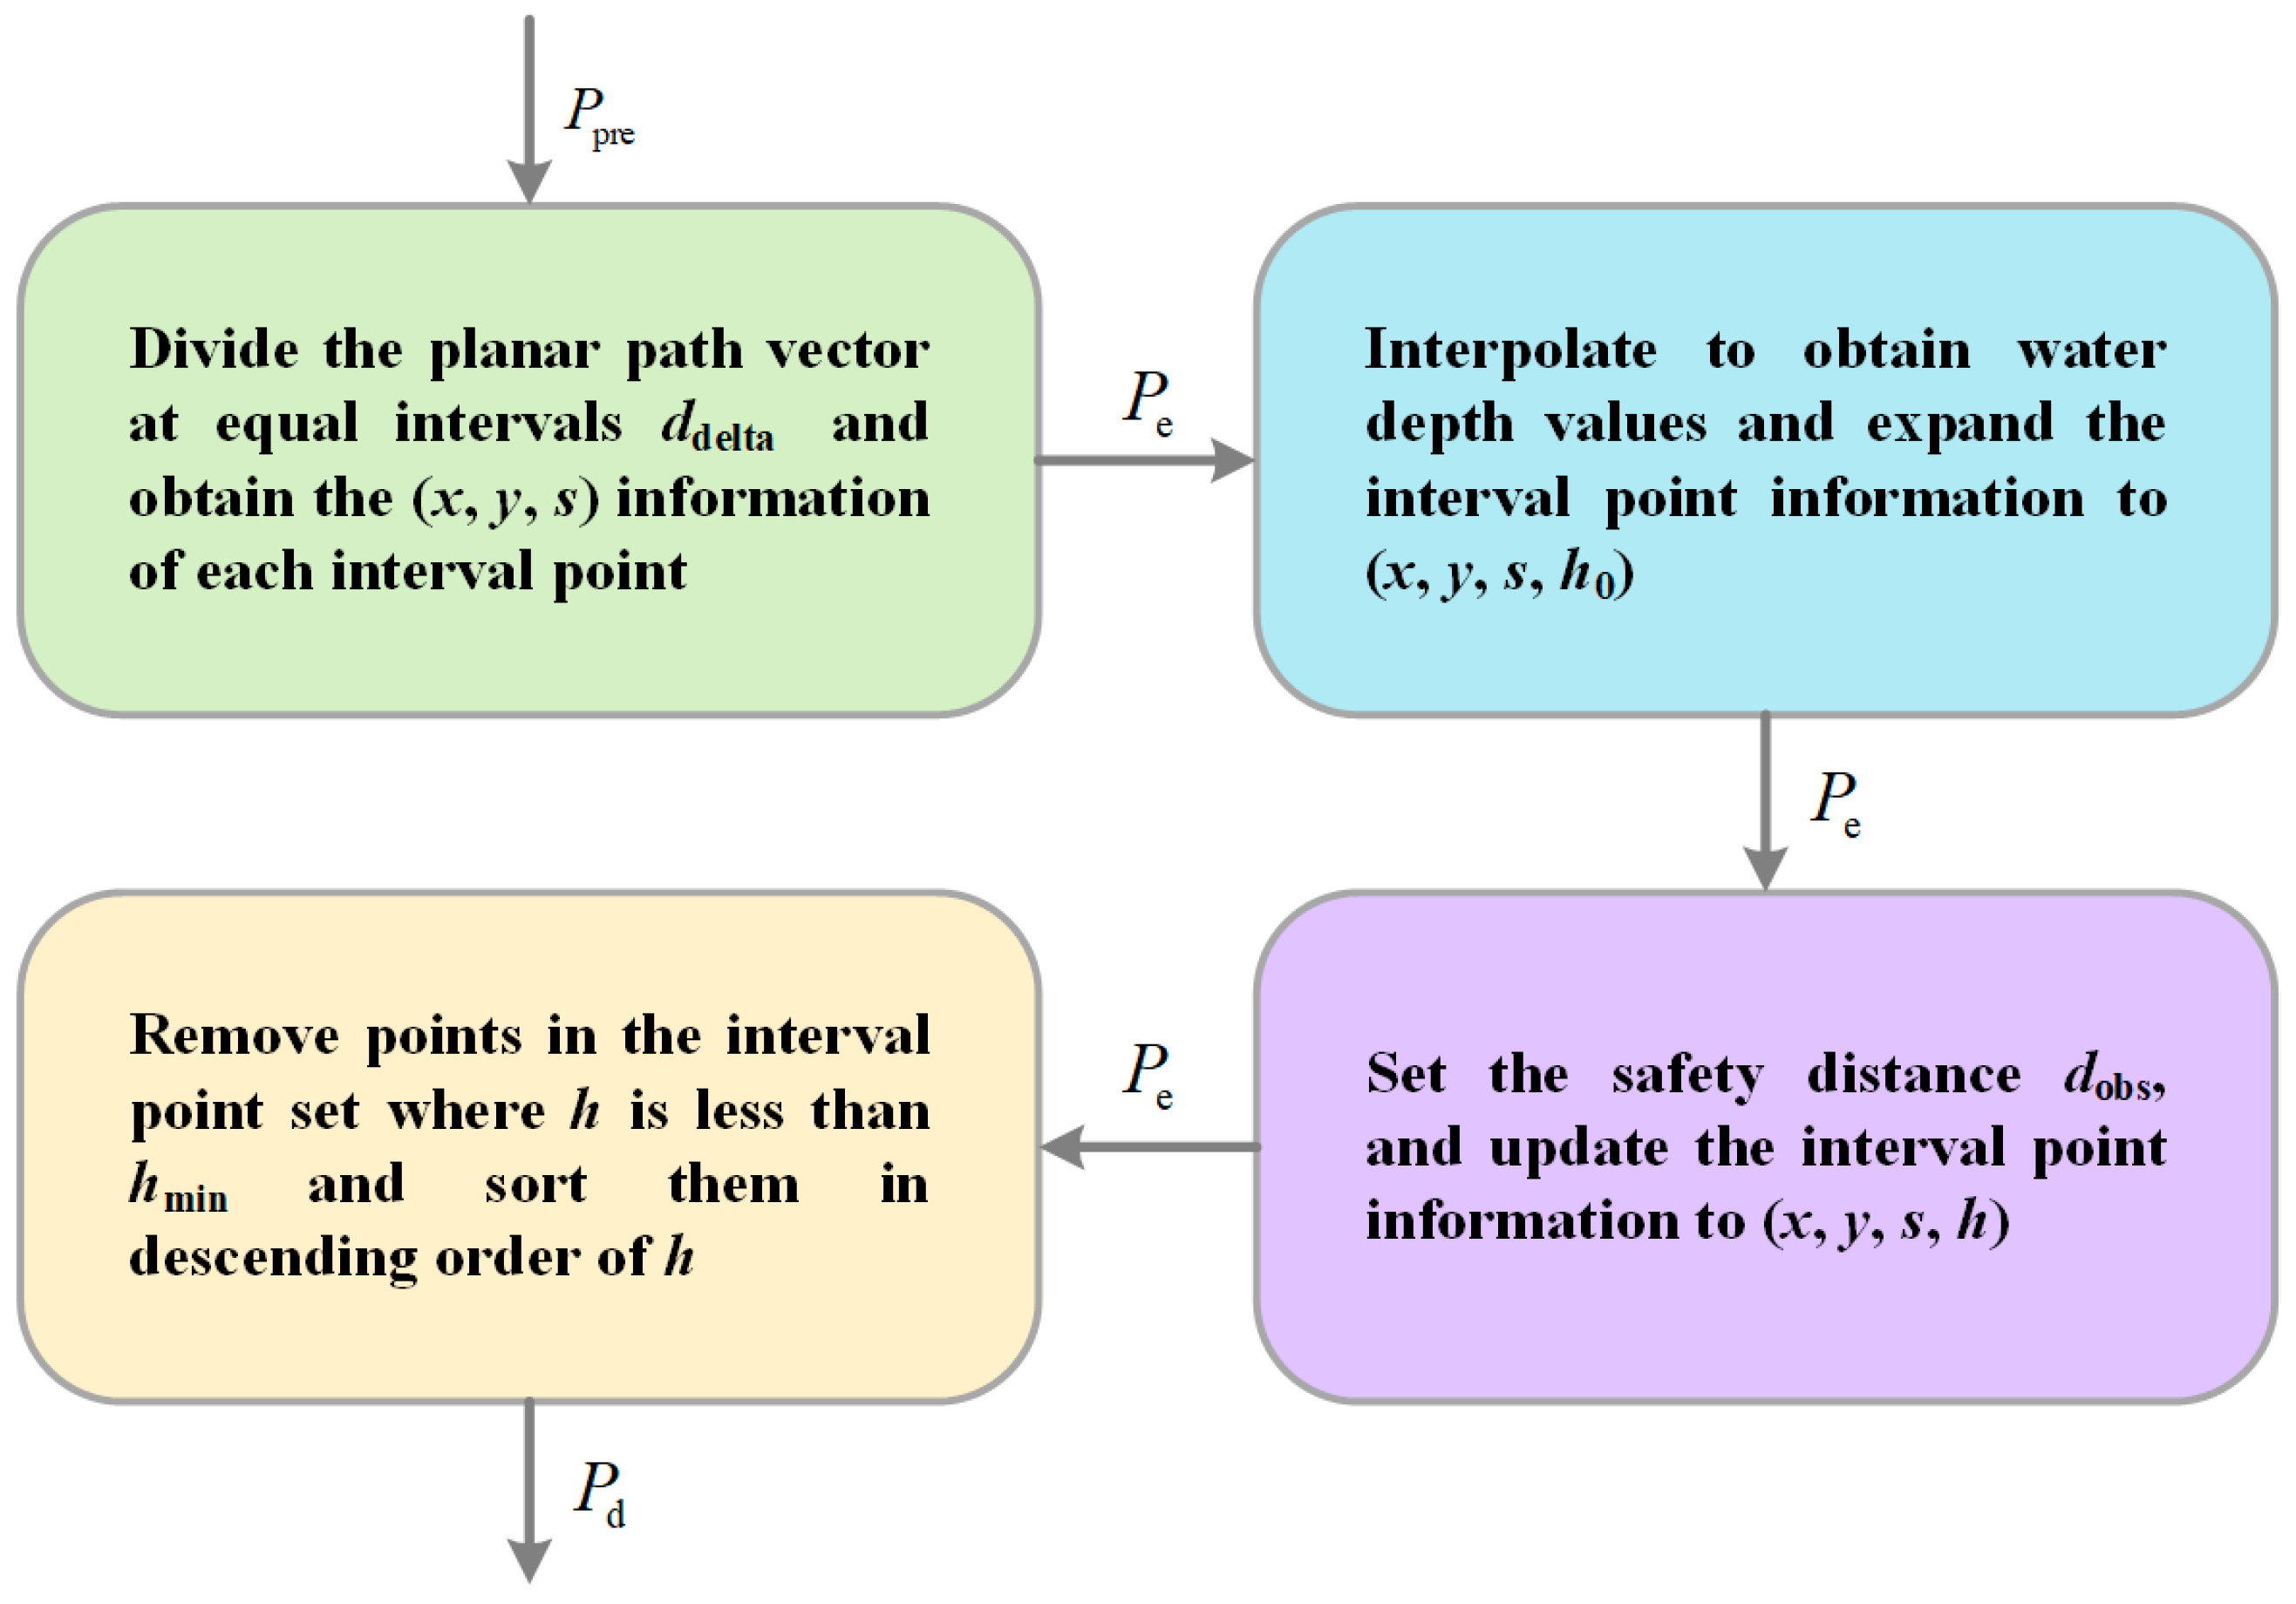
The first step is planar path point data preprocessing. After obtaining the planar polyline path from two-dimensional planning, the TAOP algorithm performs a ‘straightening’ operation on the path. ‘Straightening’ is equivalent to coordinate transformation. The points on the planar path are no longer represented by the latitude and longitude or the coordinates in the two-dimensional planning space, but by the two-dimensional path distance s (not Euclidean distance) between them and the starting point of the path. Specifically, let P pre ( p pre 1 , p pre 2 , , p pre m ) be the set of planar path points generated by the two-dimensional planning algorithm, let m be the total number of path points obtained via two-dimensional planning, and let each point p pre contain position information ( x , y ) in the two-dimensional space. In each vector segment formed by adjacent path points (i.e., p pre 1 p pre 2 , p pre 2 p pre 3 ,…, p pre m 1 p pre m ), divide the vector into equal intervals of given interval distance d delta and uniformly insert interval points. Calculate the positions of each interval point, as well as its distance s from the starting point p init , in the two-dimensional plane. Include the ( x , y , s ) information for each point p e and add it to the interval point set P e . Then, unfold the obstacles along the path onto a plane, which is equivalent to ‘slicing’ the obstacles in a three-dimensional space. To obtain the height information of the obstacles along the path, obtain the depth h 0 at the location corresponding to each interval point by interpolating the downloaded terrain data based on the latitude and longitude. Expand the information of point p e to ( x , y , s , h 0 ) . Then, set the distance of each point on the ‘straightened’ path from the starting point as the horizontal axis, and set the depth value of the path points as the vertical axis, as shown in Figure 2. Point A and point B represent the starting point and target point of the path planning, respectively. The solid line contour in the figure represents the profiles of obstacles along a path generated via two-dimensional planning.
To ensure the safety of navigation, the planned path needs to maintain a certain safe distance d obs from the obstacles. Therefore, the obstacle profile is dilated. The original depth h 0 of each interval point is extended by a distance d obs along the outer normal direction of the profile edge to obtain the dilated depth h , and the information for the point p e is updated to ( x , y , s , h ) . The dashed line contour in Figure 2 represents the dilated profiles of the obstacles.
In the subsequent coarse planning phase, the TAOP algorithm will continuously adjust the height of the path by comparing the obstacle’s dilation depth at interval points with the height of the current planned path at that location. Therefore, the smaller value between the starting point depth and the target point depth is set as h min , and the intervals with a puffed depth value of less than h min in the interval point set P e are deleted, as they do not affect the path direction. The remaining interval points are sorted in descending order based on their corresponding puffed water depth values, and these interval points are used as the set of points P d for verification. The pseudocode for the preprocessing process of the planar path point data is described in detail in Algorithm 2, and the schematic diagram is shown in Figure 3.
Algorithm 2  Preprocess - TAOP ( P pre , d obs , d delta )
P e ;
P d ;
d toi 0 ;
for  i = 1  to  m 1  do
              P e i Segment ( p pre i , p pre i + 1 , d delta ) ;
              P e i . s P e i . s + d toi ;
              P e P e P e i ;
              d toi d toi + d ( p pre i , p pre i + 1 ) ;
end for
P e . h Gridalt ( P e , A r r terrain ) ;
P e . h P e . h + d obs ;
for all  p e P e  do
      if  p e . h min ( p init . h , p goal . h )  then
                            P d P d { p e } ;
      end if
end for
return  P d ;
The second step is the coarse planning of the path. After establishing a profile map of the obstacles along the path segment, connect the path starting point p init with the target point p goal as the highly planned initial path, and initialize the planned path point set P r to { p init , p goal } . For each position point p d in the set P d to be verified, locate the minimum interval ( p r i 1 , p r i ) of the planned path based on its two-dimensional path distance s from the path starting point. Here, i 1 and i are, respectively, the serial numbers of the front and rear ends of the path segment. Based on the two-dimensional path distance and the height between the path points at both ends of the interval and the starting point, as shown in Figure 4, calculate the height h r (the height of intersection in Figure 4) of the path at the horizontal coordinate of the position to be verified according to the principle of similar triangles:
p r i 1 . h h r p r i 1 . h p r i . h = p d . s p r i 1 . s p r i . s p r i 1 . s
h r = p r i 1 . h + ( p r i . h p r i 1 . h ) × ( p d . s p r i 1 . s ) p r i . s p r i 1 . s
where p d represents the location point to be verified, p r i 1 and p r i represent the path points before and after the smallest interval of the planned path that has been located, s and h represent the path distance and water depth from the starting point, respectively, and h r represents the height of the planned path at the abscissa of the location point to be verified.
Compare the calculated path height h r with the p d . h value of the position to be verified. If h r < p d . h , this indicates that the current planned path passes through obstacles or cannot maintain a safe distance from the obstacles at this position, and the path needs to be corrected. Take p d as a new path point and insert it into the middle of the front and rear end points of the located minimum interval, p r i 1 and p r i . The p d . h value at this position is the new path height, as shown in Figure 5.
If h r p d . h , this indicates that the current planned path can maintain a safe distance from the obstacles at this position and no path correction is necessary. The pseudo code of the path coarse planning process is shown in Algorithm 3.
Algorithm 3  CoarsePlan - TAOP ( P d )
P r { p init , p goal } ;
for all  p d P d do
      for  i = length ( P r )  to  2 ( s t e p = 1 ) do
              if  p d . s < p r i . s  then
                                          h r p r i 1 . h + ( p r i . h p r i 1 . h ) × ( p d . s p r i 1 . s ) / ( p r i . s p r i 1 . s ) ;
                       if  h r < p d . h  then
                                                        P r Insert ( P r , p d , i ) ;
                            break
                  end if
            end if
       end for
end for
return  P r ;
The third step is the secondary optimization of the path. After traversing the point set P d to be verified, a set of path points that can safely pass through obstacles is obtained. However, this path may contain a certain number of redundant points, resulting in an increase in the total length of the path and the number of turns, which affects the efficiency of path planning. The optimization process can be used to identify and remove redundant points in a path. If there are no obstacles on the line between two path points, one of the points can be directly removed, thereby reducing unnecessary points on the path and making the path smoother, simpler, and more efficient.
For each path point p r in the path point set P r , check whether each point can directly connect with all non-adjacent points behind it. Suppose that the path points passed by the non-adjacent path points, p r i and p r j , are p r k P r (where k = i + 1 , , j 1 ), and that the corresponding planning height is p r k . h . After connecting p r i and p r j , the height h c k (where k = i + 1 , , j 1 ) at the intersection point of the intermediate path point’s horizontal coordinate on this line can be calculated according to the similarity triangle principle, as shown in Figure 6. Therefore, the intermediate path point’s horizontal coordinate corresponding to the height h c k (the height of intersection in Figure 6) on this line can be obtained according to the similarity triangle principle:
p r i . h h c k p r i . h p r j . h = p r k . s p r i . s p r j . s p r i . s
h c k = p r i . h + ( p r j . h p r i . h ) × ( p r k . s p r i . s ) p r j . s p r i . s
Compare the planning height p r k . h of all intermediate path points with the height h c k at their horizontal coordinates on the connecting line. If p r k . h h c k , this indicates that the path between the path points p r i and p r j can be optimized, so delete the intermediate path points and directly connect p r i and p r j ; if p r k . h > h c k , the path between p r i and p r j remains unchanged. The optimized path is P opt , and the pseudo code of the secondary optimization is shown in Algorithm 4.
Algorithm 4  Optimize - TAOP ( P r )
while  i < length ( P r ) 1  do
            r e c o n n e c t _ s t a t u s false ;
      for  j = 2  to  length ( P r )  do
                        n u m pass 0 ;
            for  k = i + 1  to  j 1  do
                                    h c k p r i . h + ( p r j . h p r i . h ) × ( p r k . s p r i . s ) / ( p r j . s p r i . s ) ;
                  if  h c k < p r k . h  then
                        break
                  else
                                                n u m pass n u m pass + 1 ;
                  end if
            end for
            if  n u m pass = j i 1  then
                                    P r P r \ { p r k } k = i + 1 , , j 1 ;
                                    r e c o n n e c t _ s t a t u s ture ;
                  break
            end if
      end for
      if  r e c o n n e c t _ s t a t u s = false  then
                                    i i + 1 ;
      end if
end while
P opt P r ;
return  P opt ;
The fourth step is path point integration. Due to the fact that the obstacle profile along the route is obtained based on the ‘straightened’ planar planning path points, which is equivalent to the artificial omission of the turning points in the x y plane, the path point set P opt after the second optimization only contains the turning points in the s h plane. It is necessary to integrate the path points from the height planning and the two-dimensional planar planning to obtain a complete path P mer that includes all of the turning points in the three-dimensional space. The specific implementation of the path point integration algorithm is given in Algorithm 5.
Algorithm 5  Integrate - TAOP ( P pre , P opt )
P pre . h Interp ( P opt . s , P opt . h , P pre . s ) ;
P mer Sortrows ( P pre , s ) ;
for all  p opt P opt  do
      if not  Ismember ( p opt . s , P mer . s )  then
            for  i = 2  to  length ( P mer )  do
                  if  p opt . s < p mer i . s  then
                                                P mer Insert ( P mer , p opt , i ) ;
                        break
                  end if
            end for
      end if
end for
return  P mer ;
The TAOP algorithm involves the following function explanations:
Segment : Given two points, p s and p d , and a distance, d , divide the vector p s p d with equal intervals d starting from p s , calculate the positions ( x , y ) of all the interval points and their distances s from p s , and return the set P ( x , y , s ) of all the interval points that contain the point p s .
Gridalt : Given a struct array P containing position information ( x , y ) and a terrain array A r r terrain containing latitude, longitude, and altitude information, convert the position coordinates ( x , y ) in P into latitude, longitude, and altitude ( x lon , y lat ) ( x lon , y lat ) , interpolate the latitude and longitude values into the terrain array A r r terrain A r r terrain to obtain the height values h for all of the coordinates in P and return it.
length : Given an array P , return the length of P .
Insert : Given a set P r , a point p d , and a positive integer i , insert the point p d into the i th position of the set P r .
Interp : Given an array A r r x containing the values of x , an array A r r y containing the values of y , and an array A r r x containing the values of x to be queried, use linear interpolation to calculate and return the corresponding y values for all elements in A r r x .
Sortrows : Given a struct array P and a field in it, sort the elements of the array P in ascending order by the given field.
Ismember : Given a number x and an array A r r , return a logical value as true if x is present in A r r , and return a logical value as false otherwise.

3. Simulation

3.1. Simulation Environment

In this article, a latitude range of 7°N to 10°N and a longitude range of 112°E to 116°E are selected as the navigation space for the underwater vehicle. The source of the gravity anomaly data (version V29.1) and submarine topographic data (version V19.1) is the website of the Scripps Institution of Oceanography at the University of California, San Diego (https://topex.ucsd.edu/, accessed on 7 February 2023), with a resolution of 1′ × 1′. The gravity anomaly data in the area are a maximum of 131.9 mGal, a minimum of −60.3 mGal, an average of 17.1 mGal, and a standard deviation of 26.1 mGal. The maximum depth of the seabed data is 0 m, the minimum is −3408 m, the average is −1769.9 m, and the standard deviation is 659 m. The three-dimensional gravity anomaly and three-dimensional submarine topographic datum maps of the experimental area are shown in Figure 7 and Figure 8.
One prerequisite for gravity matching navigation to work effectively is that the gravity features of the area to be matched need to have good suitability. The characteristic parameters of the gravity field matching area are important factors that affect the positioning accuracy and matching probability. During navigation, gravity matching should be performed in areas with obvious gravity field features. The suitability of the gravity field can be measured using various indicators, and different indicators can reflect different characteristics of the gravity field. By fusing information from multiple gravity feature parameters, a more comprehensive and effective evaluation of the working area of gravity matching navigation can be made. However, the division method of the suitability area is not the focus of this article, so in this article, a single characteristic parameter, the standard deviation of gravity anomaly, is used to divide the suitability area and non-suitability area of gravity matching navigation.
The standard deviation of the gravity field can reflect the degree of dispersion and overall undulation of the gravity anomaly sequence. The larger the standard deviation, the richer the gravity information. The calculation formula for the standard deviation is [34]
δ = 1 a b 1 i = 1 a j = 1 b [ g ( i , j ) g ¯ ] 2
g ¯ = 1 a b i = 1 a j = 1 b g ( i , j )
where δ represents the standard deviation of gravity anomalies, a and b represent the number of grids in the x and y directions within the moving window, g ( i , j ) represents the gravity anomaly at the calculation point ( i , j ) , and g ¯ represents the average value of the gravity anomalies. When g ( i , j ) is divergent, the value of δ is large; when g ( i , j ) is concentrated, the value of δ is small. The selection criterion for the suitability area is
δ > δ 0
where δ 0 is the threshold for dividing the suitability area and non-suitability area.
Using a moving computational window with a resolution of 10′ × 10′, the local gravity field standard deviation was calculated as described above. After extensive matching experiments and a statistical analysis of the positioning errors and matching success rates with different thresholds, regions with a gravity anomaly standard deviation greater than 5 were found to have better suitability. Therefore, a threshold value of δ 0 = 5 was selected, and a two-dimensional gravity suitability grid was established, as shown in Figure 9. The black portion represents the non-suitability grid, while the white portion represents the suitability grid.
To ensure the safety of navigation, it is usually necessary to avoid dangerous areas such as shoals and reefs when planning a route. Using the seabed topographic data within the planning area, a safe depth of 100 m is set to extract the distribution of dangerous areas, as shown in Figure 10. The dangerous areas in Figure 10 are removed from Figure 9 to obtain the gravity suitability distribution map, as shown in Figure 11. The seabed digital model within the planning area is divided into three regions: a non-suitability area, a dangerous area, and a suitability area. The black portion is the non-suitability area with poor positioning and matching effects; the gray portion is the dangerous area, which is not suitable for navigation; and the white portion is the suitability area, and the planned route can only pass through this area to reach the destination.

3.2. Evaluation Method

This section compares the performance of the TAOP algorithm with those of the RRT* algorithm, Q-RRT* algorithm, and DSFS algorithm for three-dimensional path planning in the environment set forth above, and it evaluates the improvement of the TAOP algorithm in planning efficiency. The η symbol represents the path planning efficiency of the algorithm, which is the amount of work completed per unit time by the algorithm. The workload of the path planning algorithm is set as the ratio of the shortest cost c min to the cost c obtained from the planning, which is called the cost optimization ratio. When the cost generated by the path planning algorithm approaches the shortest cost, the value of the cost optimization ratio approaches 1. Therefore, the calculation formula for path planning efficiency is
η = c min c t
In addition, due to the presence of terrain obstacles in the area studied in this paper, the actual shortest cost is difficult to calculate directly, so the shortest cost c min is set to the shortest distance between the starting point and the target point when no obstacles are present. The coordinates of the starting point of the path planning are set as (112.7°E, 9.4°N, −300 m), and the coordinates of the target point are set as (115.3°E, 7.9°N, −200 m). According to the Haversine formula, the shortest cost is approximately 3.31 × 10⁵ m.
Three sets of comparative simulation experiments for path planning were conducted: (1) the RRT* algorithm versus the TAOP algorithm; (2) the Q-RRT* algorithm versus the TAOP algorithm; and (3) the DSFS algorithm versus the TAOP algorithm. To ensure the fairness of the experiments, the TAOP algorithm’s planar planning path was generated using the two-dimensional form of the counterpart algorithm’s initial path. In the simulation results, ‘R’ and ‘TR’ denote the ‘Three-Dimensional RRT* algorithm’ and ‘TAOP algorithm (using two-dimensional RRT* algorithm for planar planning)’, ‘Q’ and ‘TQ’ denote the ‘Three-Dimensional Q-RRT* algorithm’ and ‘TAOP algorithm (using two-dimensional Q-RRT* algorithm for planar planning)’, and ‘D’ and ‘TD’ denote the ‘Three-Dimensional DSFS algorithm’ and ‘TAOP algorithm (using two-dimensional DSFS algorithm for planar planning)’. To validate the time-saving effect of the TAOP algorithm in collision detection without the need for depth interpolation, the total collision detection time during the planning process, denoted as ‘ t coll ’, was recorded. Additionally, the initial cost c init and the computation time t init were calculated to evaluate the efficiency of the algorithms in planning the initial path. During testing, each algorithm was independently run 50 times under identical simulation parameters. The specific experimental parameter settings are detailed in Table 1.

4. Results

Table 2 presents the experimental statistical results of the six algorithms in terms of the total collision detection time t coll . In this table, Q1, Q2, and Q3 represent the first quartile, median, and third quartile of the data, respectively. Figure 12 provides a visual representation of the distribution of the total collision detection time t coll in the form of a box plot. From the statistical information, it is evident that the TAOP algorithm requires significantly less computation time for collision detection when compared to directly using the RRT*, Q-RRT*, and DSFS algorithms, with average reduction percentages of approximately 94.85%, 83.78%, and 80.93%, respectively. In Figure 12, the data points for the TAOP algorithm consistently appear at lower positions, significantly below their corresponding counterparts in the control algorithms, indicating a faster collision detection process for the TAOP algorithm.
Table 3 and Table 4 present the statistical results for the initial cost c init and initial path computation time t init for six different algorithms. Figure 13 and Figure 14 display box plots for the initial cost and initial path computation time, respectively. When observing the statistical results, it is evident that the TAOP algorithm exhibits significant reductions in both the initial cost and initial path computation time. In Figure 13, the data points for the TAOP algorithm are noticeably lower, with the upper and lower bounds of the box plot being lower than their corresponding parts for the control algorithms. This indicates that the TAOP algorithm generates paths with smaller costs compared to its control algorithms, effectively optimizing the planning results. In Figure 14, fewer data points for the TAOP algorithm fall within higher time ranges, suggesting that the TAOP algorithm is more efficient in computing the initial path.
In the simulation results, there is a significant deviation between the mean and median of various statistical measures, indicating that the data do not follow a normal distribution. Therefore, we employed the Mann–Whitney U test to further validate the performance advantage of the TAOP algorithm statistically. In this test, the collision detection total time t coll , initial cost c init , and initial path computation time t init were used as evaluation metrics, and the corresponding p-values were calculated, as shown in Table 5. From Table 5, it can be observed that the p-values for all of test metrics are much smaller than the significance level of 0.05, indicating that the TAOP algorithm outperforms the RRT*, Q-RRT*, and DSFS algorithms in planning simulation experiments.
In addition, based on the mean initial cost and mean initial path computation time in Table 3 and Table 4, the average path planning efficiency for the six algorithms was calculated using Equation (8), as shown in Table 6. It can be observed that, compared to the RRT*, Q-RRT*, and DSFS algorithms, the TAOP algorithm has improved the path planning efficiency by 15.6 times, 5.98 times, and 4.04 times, respectively.
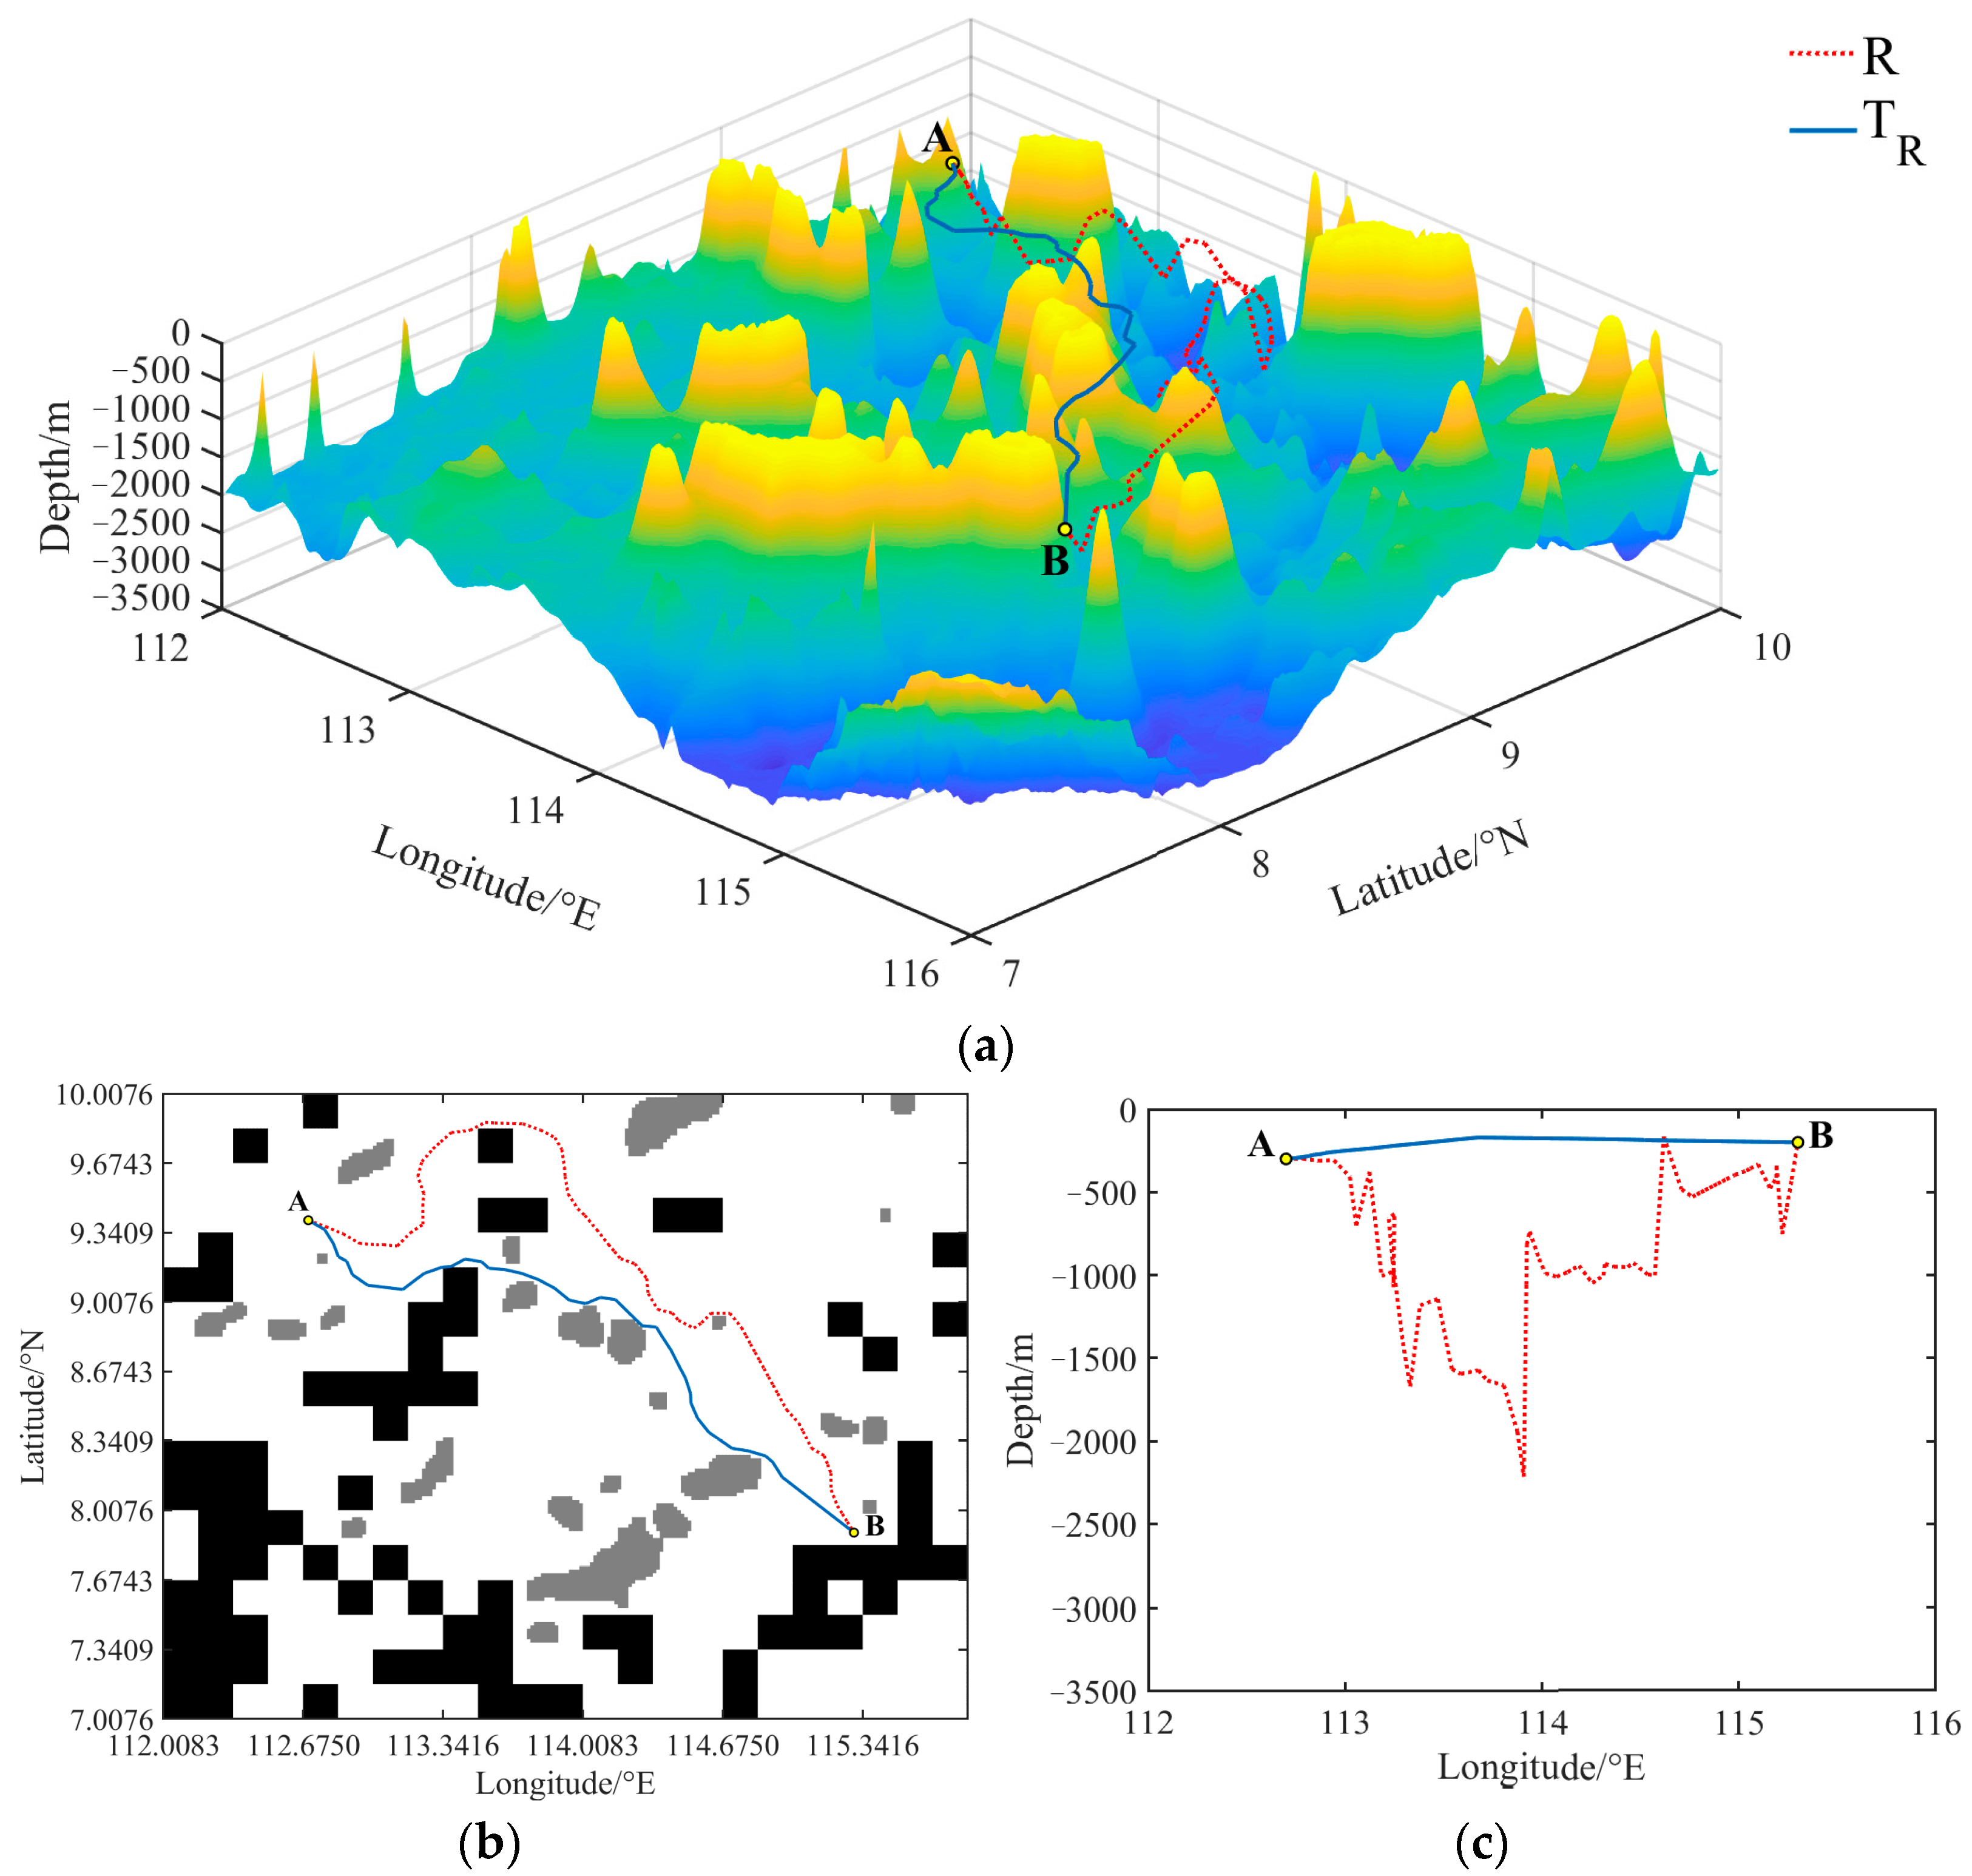
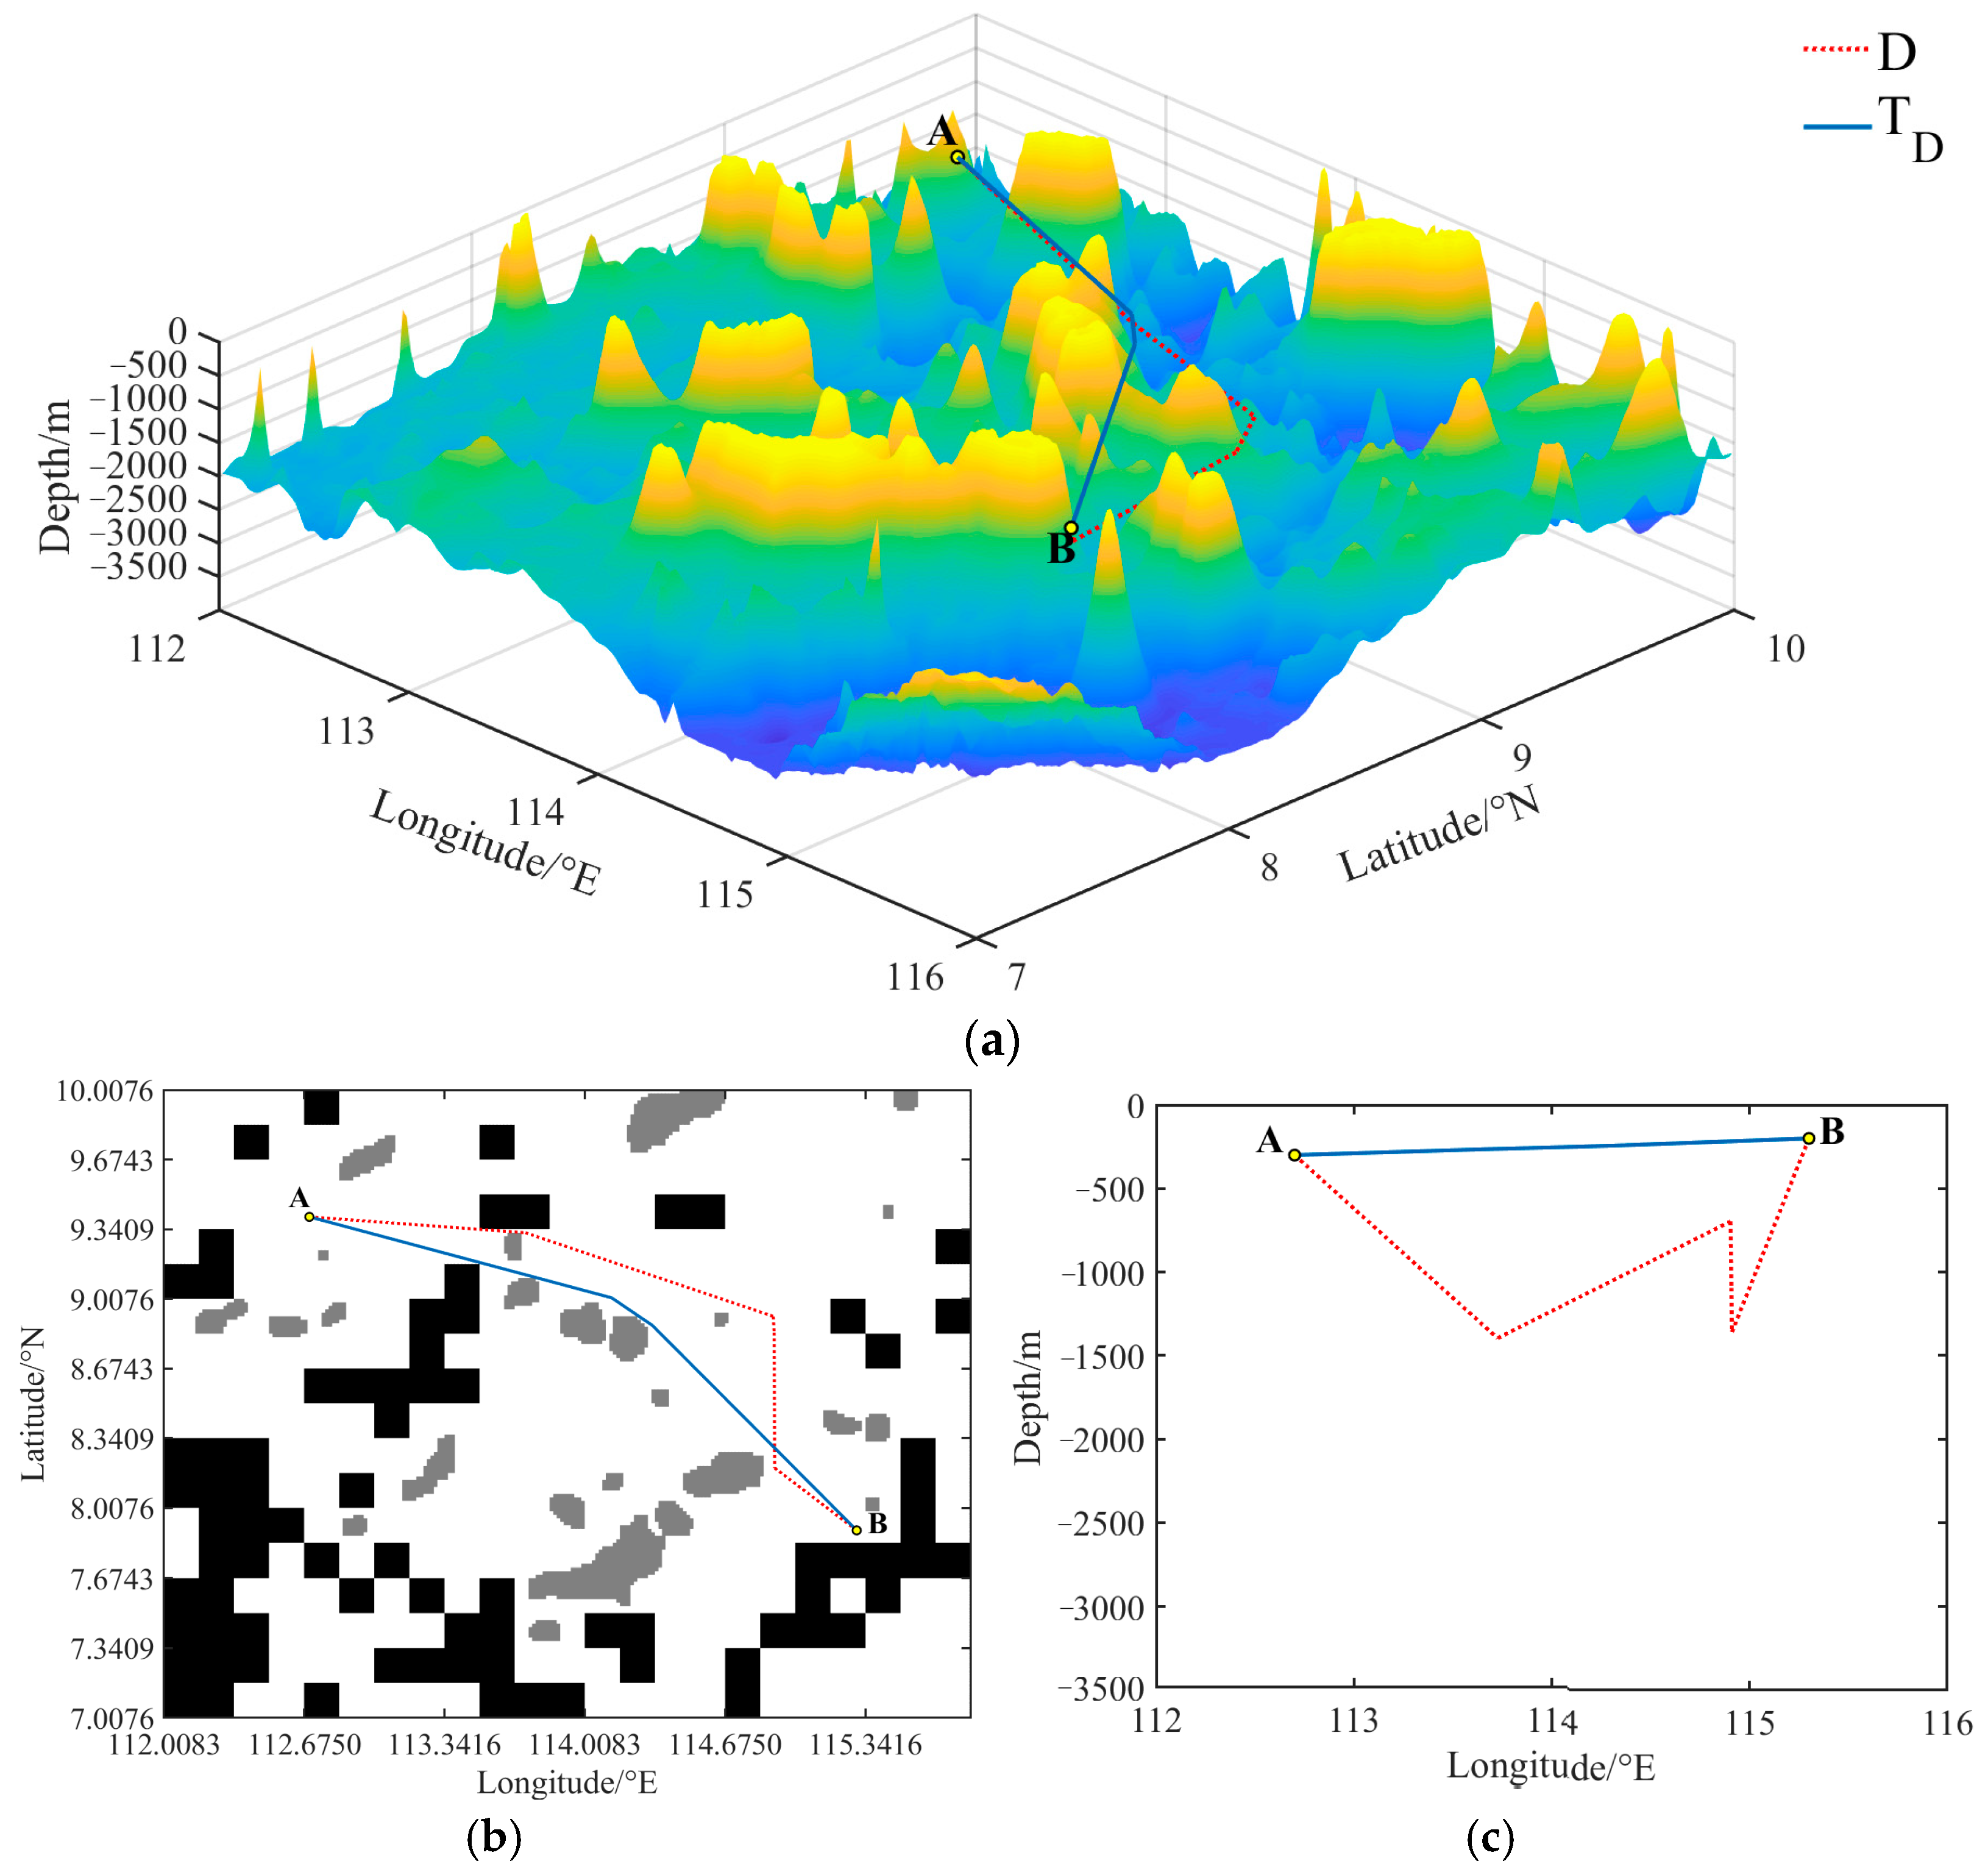
Figure 15, Figure 16 and Figure 17, respectively, present the initial path graphs generated using the R algorithm compared with the TR algorithm, the Q algorithm compared with the TQ algorithm, and the D algorithm compared with the TD algorithm in a specific test scenario. Here, points A and B denote the starting and target points, respectively. Upon examination, it is evident that the paths generated using all six algorithms lie within the predefined suitable area, meeting the requirements for safe navigation. Additionally, in contrast to the RRT*, Q-RRT*, and DSFS algorithms, the TAOP algorithm produces initial paths with a lower cost. To offer a more intuitive portrayal of the variations in the planned paths in the vertical direction, the paths are projected onto the ‘longitude–depth’ plane, as depicted in Figure 15c, Figure 16c and Figure 17c. From the perspective of the ‘longitude–depth’ plane, it is readily apparent that the initial paths generated using the TAOP algorithm exhibit greater smoothness, whereas the paths generated using the corresponding RRT*, Q-RRT*, and DSFS algorithms manifest pronounced undulations in the vertical direction, characterized by one or more conspicuous fluctuations. This divergence arises because the RRT*, Q-RRT*, and DSFS algorithms all engage in random sampling across the entire three-dimensional planning space, with sample points displaying significant randomness in the vertical dimension, thereby rendering them more likely to generate higher-cost paths. Conversely, the TAOP algorithm engages in judicious planning in the vertical dimension based on obstacle profiles, consequently optimizing the cost.

5. Discussion

The underwater gravity-matching navigation employing the TAOP algorithm for three-dimensional path planning offers several prominent advantages. It demonstrates significant improvements in the collision detection time, initial cost, and initial path computation time, effectively reducing the path oscillations and achieving smoother initial paths. Compared to directly using the RRT*, Q-RRT*, and DSFS algorithms, the TAOP algorithm has improved the path planning efficiency by factors of 15.6, 5.98, and 4.04, respectively. It can be seen that the TAOP algorithm has significant advantages, and it can use dimensional reduction methods to solve the problem of high computational costs and even the problem of the inability to find feasible solutions in complex three-dimensional environments due to node diffusion. At the same time, the TAOP algorithm avoids the time-consuming problem of interpolating the terrain data required for three-dimensional collision detection, and it significantly reduces the fluctuation of the path by directly referencing the obstacle contour to plan the height of the path. Similarly, other traditional path planning algorithms for three-dimensional planning (such as artificial potential field method, a* algorithm, ant colony algorithm, etc.) also directly obtain nodes in three-dimensional space, thus also suffering from node diffusion issues and multiple interpolation problems required for three-dimensional collision detection to obtain terrain data. Therefore, the results can be generalized, and the TAOP algorithm can be used to combine height planning with the two-dimensional planar planning forms of these algorithms to reduce the complexity of the problem, thereby effectively saving planning time and improving the path planning efficiency. In addition, the TAOP algorithm is also suitable for situations where the two-dimensional path cannot be changed, and only the height needs to be planned in some special cases.

6. Conclusions

This paper introduces a novel TAOP algorithm aimed at enhancing the path planning efficiency of underwater gravity-matching navigation in three-dimensional environments.
  • A novel TAOP algorithm is introduced. Given the existing challenges of high computational complexity and lengthy computation times associated with three-dimensional path planning algorithms, the innovative TAOP algorithm is proposed. It decomposes three-dimensional path planning into two components: two-dimensional planar planning and height planning. The TAOP algorithm straightens the paths obtained from planar planning through coordinate transformations, performs height planning based on obstacle profile contours along the path, and integrates the points from both planar and height planning to obtain the final path in a three-dimensional space.
  • A three-dimensional planning environment for underwater gravity-matching navigation is constructed. To accurately represent the terrain features and gravity field distribution in underwater environments, gravity suitability areas are defined based on the characteristics of gravity anomaly data. Combined with seabed topographical data, obstacle constraints in the underwater three-dimensional space are established, making the planned paths more adaptable to the complex terrain and gravity conditions encountered in practical underwater gravity-matching navigation.
  • The effectiveness of the TAOP algorithm is validated. In the defined three-dimensional path planning environment, performance comparison simulations are conducted between the TAOP algorithm and the RRT*, Q-RRT*, and DSFS algorithms. The results demonstrate that the TAOP algorithm reduces the collision detection time, lowers the cost of the initial path solutions, shortens the initial planning time, and reduces path oscillation, significantly improving the planning efficiency. Compared to directly employing the RRT*, Q-RRT*, and DSFS algorithms, the TAOP algorithm improves the path planning efficiency by factors of 15.6, 5.98, and 4.04, respectively.
  • Future research directions are identified. This paper has not addressed the issue of dynamic environments, which can significantly affect the efficiency and accuracy of path planning. Incorporating dynamic obstacles into the planning algorithm remains a challenge that requires further research. Additionally, while the TAOP algorithm has shown promise in improving the planning efficiency, it may still encounter performance issues when encountering complex, dynamic environments. Future work should focus on enhancing the robustness and suitability of the algorithm to such environments.

Author Contributions

Conceptualization, X.Z. and W.Z.; methodology, X.Z. and Z.L.; validation, X.Z., Z.L. and P.W.; writing—original draft preparation, X.Z.; writing—review and editing, X.Z., Z.L., W.Z., P.W. and Y.S. All authors have read and agreed to the published version of the manuscript.

Funding

This work was supported in part by the National Natural Science Foundation of China (Grant No. 42274119), in part by the Liaoning Revitalization Talents Program (Grant No. XLYC2002082), in part by the National Key Research and Development Plan Key Special Projects of Science and Technology Military Civil Integration (Grant No. 2022YFF1400500), in part by the Application Project of Innovative Achievements in the ‘Wisdom Eye Action’ of the Equipment Development Department of the Central Military Commission, in part by the Scientific Research Project of ‘Double First-Class’ Construction Project of Surveying and Mapping Science and Technology Discipline in Henan Province, and in part by the Key Project of Science and Technology Commission of the Central Military Commission.

Data Availability Statement

Data are contained within the article.

Acknowledgments

The authors are thankful to the University of California San Diego website for providing the gravity anomaly data and seafloor topography data. X.Z., W.Z., Z.L. and P.W. contributed equally to this paper.

Conflicts of Interest

The authors declare no conflict of interest.

References

  1. Zou, Z.; Wang, W.; Wu, B.; Ye, L.; Ochieng, W.Y. Tightly Coupled INS/APS Passive Single Beacon Navigation. Remote Sens. 2023, 15, 1854. [Google Scholar] [CrossRef]
  2. Jiang, C.; Chen, Y.; Chen, C.; Jia, J.; Sun, B.; Wang, T.; Hyyppa, J. Implementation and performance analysis of the PDR/GNSS integration on a smartphone. GPS Solut. 2022, 26, 81. [Google Scholar] [CrossRef]
  3. Jiang, C.; Chen, Y.; Xu, B.; Jia, J.; Sun, H.; Chen, C.; Duan, Z.; Bo, Y.; Hyyppa, J. Vector tracking based on factor graph optimization for GNSS NLOS bias estimation and correction. IEEE Internet Things J. 2022, 9, 16209–16221. [Google Scholar] [CrossRef]
  4. Chen, S.; Zhou, B.; Jiang, C.; Xue, W.; Li, Q. A LiDAR/Visual SLAM Backend with Loop Closure Detection and Graph Optimization. Remote Sens. 2021, 13, 2720. [Google Scholar] [CrossRef]
  5. Wang, K.; Zhu, T.; Gao, Y.; Wang, J. Efficient Terrain Matching With 3-D Zernike Moments. IEEE Trans. Aerosp. Electron. Syst. 2019, 55, 226–235. [Google Scholar] [CrossRef]
  6. Wang, K.; Zhu, T.; Wang, J. Impact of terrain factors on the matching performance of terrain-aided navigation. Navigation 2019, 66, 451–462. [Google Scholar] [CrossRef]
  7. Wang, Z.; Huang, Y.; Wang, M.; Wu, J.; Zhang, Y. A Computationally Efficient Outlier-Robust Cubature Kalman Filter for Underwater Gravity Matching Navigation. IEEE Trans. Instrum. Meas. 2022, 71, 8500418. [Google Scholar] [CrossRef]
  8. Gao, S.; Cai, T.; Fang, K. Gravity-matching algorithm based on K-nearest neighbor. Sensors 2022, 22, 4454. [Google Scholar] [CrossRef] [PubMed]
  9. Zhao, S.; Zheng, W.; Li, Z.; Zhu, H.; Xu, A. Improving matching efficiency and out-of-domain reliability of underwater gravity matching navigation based on a novel soft-margin local semicircular-domain re-searching model. Remote Sens. 2022, 14, 2129. [Google Scholar] [CrossRef]
  10. Wang, B.; Zhu, J.; Ma, Z.; Deng, Z.; Fu, M. Improved particle filter-based matching method with gravity sample vector for underwater gravity-aided navigation. IEEE Trans. Ind. Electron. 2022, 68, 5206–5216. [Google Scholar] [CrossRef]
  11. Shi, L.; Zhang, W.; Cheng, Y.; Deng, Z. Gravity Aided Inertial Navigation Path Planning Algorithm based on Underwater Vehicle Constraint and Bezier Curve. In Proceedings of the 2019 Chinese Control Conference (CCC), Guangzhou, China, 27–30 July 2019; pp. 3857–3862. [Google Scholar] [CrossRef]
  12. Feng, X.; Wang, B.; Deng, Z.; Fu, M. Internal path planning method for underwater vehicle with gravity aided navigation. In Proceedings of the 2016 35th Chinese Control Conference (CCC), Chengdu, China, 27–29 July 2016; pp. 5537–5541. [Google Scholar] [CrossRef]
  13. Lu, Z.; Cai, T.; Yang, Z. Path Plan in Gravity Aided Inertial Navigation Based on Ant Colony Algorithm. In Proceedings of the 2009 WRI Global Congress on Intelligent Systems, Xiamen, China, 19–21 May 2009. [Google Scholar] [CrossRef]
  14. Zhang, T.; Zhu, Y.; Song, J. Real-time motion planning for mobile robots by means of artificial potential field method in unknown environment. Ind. Robot 2013, 37, 384–400. [Google Scholar] [CrossRef]
  15. Xia, X.; Li, T.; Sang, S.; Cheng, Y.; Ma, H.; Zhang, Q.; Yang, K. Path Planning for Obstacle Avoidance of Robot Arm Based on Improved Potential Field Method. Sensors 2023, 23, 3754. [Google Scholar] [CrossRef] [PubMed]
  16. Wang, H.; Qi, X.; Lou, S.; Jing, J.; He, H.; Liu, W. An Efficient and Robust Improved A* Algorithm for Path Planning. Symmetry 2021, 13, 2213. [Google Scholar] [CrossRef]
  17. Dang, C.V.; Ahn, H.; Lee, D.S.; Lee, S.C. Improved Analytic Expansions in Hybrid A-Star Path Planning for Non-Holonomic Robots. Appl. Sci. 2022, 12, 5999. [Google Scholar] [CrossRef]
  18. Ye, W.; Ma, D.; Fan, H. Algorithm for Low Altitude Penetration Aircraft Path Planning with Improved Ant Colony Algorithm. Chin. J. Aeronaut. 2005, 18, 304–309. [Google Scholar] [CrossRef]
  19. Brand, M.; Masuda, M.; Wehner, N.; Yu, X. Ant Colony Optimization algorithm for robot path planning. In Proceedings of the 2010 International Conference on Computer Design and Application, Qinhuangdao, China, 25–27 June 2010; pp. V3-436–V3-440. [Google Scholar] [CrossRef]
  20. Zhang, L.; Lin, Z.; Wang, J.; He, B. Rapidly-exploring Random Trees multi-robot map exploration under optimization framework. Robot. Auton. Syst. 2020, 131, 103565. [Google Scholar] [CrossRef]
  21. Ma, Y.; Lim, K.G.; Tan, M.K.; Chuo, H.S.E.; Farzamnia, A.; Teo, K.T.K. Research on Risk Detection of Autonomous Vehicle Based on Rapidly-Exploring Random Tree. Computation 2023, 11, 61. [Google Scholar] [CrossRef]
  22. Zhou, L.; Wu, N.; Chen, H.; Wu, Q.; Lu, Y. RRT*-Fuzzy Dynamic Window Approach (RRT*-FDWA) for Collision-Free Path Planning. Appl. Sci. 2023, 13, 5234. [Google Scholar] [CrossRef]
  23. Connell, D.; La, H.M. Dynamic Path Planning and Replanning for Mobile Robots using RRT*. In Proceedings of the 2017 IEEE International Conference on Systems, Man, and Cybernetics (SMC), Banff, AB, Canada, 5–8 October 2017; pp. 1429–1434. [Google Scholar] [CrossRef]
  24. Sakcak, B.; Bascetta, L.; Ferretti, G.; Prandini, M. Sampling-based optimal kinodynamic planning with motion primitives. Auton. Robot. 2019, 43, 1715–1732. [Google Scholar] [CrossRef]
  25. Noreen, I.; Khan, A.; Ryu, H.; Nakju, L.D.; Habib, Z. Optimal path planning in cluttered environment using RRT*-AB. Intell. Serv. Robot. 2018, 11, 41–52. [Google Scholar] [CrossRef]
  26. Jeong, I.B.; Lee, S.J.; Kim, J.H. RRT*-Quick: A Motion Planning Algorithm with Faster Convergence Rate. In Robot Intelligence Technology and Applications 3; Kim, J., Yang, W., Jo, J., Sincak, P., Myung, H., Eds.; Springer: Cham, Switzerland, 2015; Volume 345, pp. 67–76. [Google Scholar] [CrossRef]
  27. Jeong, I.B.; Lee, S.J.; Kim, J.H. Quick-RRT*: Triangular inequality-based implementation of RRT∗ with improved initial solution and convergence rate. Expert Syst. Appl. 2019, 123, 82–90. [Google Scholar] [CrossRef]
  28. Lee, M.; Noh, G.; Park, J. Real-Time Directed Rapidly Exploring Random Tree Path Planning for Air Collision Avoidance. J. Aerosp. Inf. Syst. 2022, 19, 330–343. [Google Scholar] [CrossRef]
  29. Cai, F.; Liu, D.; Yuan, W.; Ding, S.; Ning, Y.; Yue, C. Motion planning of unmanned aerial vehicle based on rapid-exploration random tree algorithm. J. Phys. Conf. Ser. 2022, 2283, 012017. [Google Scholar] [CrossRef]
  30. Wang, H.; Li, G.; Hou, J.; Chen, L.; Hu, N. A Path Planning Method for Underground Intelligent Vehicles Based on an Improved RRT* Algorithm.  Electronics 2022, 11, 294. [Google Scholar] [CrossRef]
  31. Gong, T.; Yang, Y.; Song, J. Path Planning for Multiple Unmanned Vehicles (MUVs) Formation Shape Generation Based on Dual RRT Optimization. Actuators 2022, 11, 190. [Google Scholar] [CrossRef]
  32. Chi, W.; Wang, C.; Wang, J.; Meng, M. Risk-DTRRT-Based Optimal Motion Planning Algorithm for Mobile Robots. IEEE Trans. Autom. Sci. Eng. 2019, 16, 1271–1288. [Google Scholar] [CrossRef]
  33. Zhou, X.; Zheng, W.; Li, Z.; Wu, P.; Sun, Y. Improving path planning efficiency for underwater gravity-aided navigation based on a new depth sorting fast search algorithm. Def. Technol. 2023, in press. [Google Scholar] [CrossRef]
  34. Ouyang, M.; Ma, Y. Path planning for gravity aided navigation based on improved A* algorithm. Chin. J. Geophys. 2020, 63, 4361–4368. [Google Scholar] [CrossRef]
Figure 1. The schematic diagram of TAOP algorithm.
Remotesensing 15 05579 g001
Figure 2. Profile contour of obstacles along a path.
Remotesensing 15 05579 g002
Figure 3. The schematic diagram of the planar path point data preprocessing.
Remotesensing 15 05579 g003
Figure 4. Principle of coarse planning.
Remotesensing 15 05579 g004
Figure 5. Adding a new path point in coarse planning.
Remotesensing 15 05579 g005
Figure 6. Principle of secondary optimization.
Remotesensing 15 05579 g006
Figure 7. Three-dimensional digital terrain reference map of sea floor.
Remotesensing 15 05579 g007
Figure 8. Three-dimensional marine gravity anomaly reference map.
Remotesensing 15 05579 g008
Figure 9. Suitability division of gravity matching area (theory).
Remotesensing 15 05579 g009
Figure 10. Distribution of unsafe areas.
Remotesensing 15 05579 g010
Figure 11. Suitability division of gravity matching areas.
Remotesensing 15 05579 g011
Figure 12. Total collision detection time box plot.
Remotesensing 15 05579 g012
Figure 13. Initial cost box plot.
Remotesensing 15 05579 g013
Figure 14. Initial path computation time box plot.
Remotesensing 15 05579 g014
Figure 15. Initial paths generated using R algorithm and TR algorithm: (a) view from three-dimensional terrain map; (b) view from gravity suitability distribution map; (c) projection onto ‘longitude–depth’ plane view.
Remotesensing 15 05579 g015
Figure 16. Initial paths generated using Q algorithm and TQ algorithm: (a) view from three-dimensional terrain map; (b) view from gravity suitability distribution map; (c) projection onto ‘longitude–depth’ plane view.
Remotesensing 15 05579 g016aRemotesensing 15 05579 g016b
Figure 17. Initial paths generated using D algorithm and TD algorithm: (a) view from three-dimensional terrain map; (b) view from gravity suitability distribution map; (c) projection onto ‘longitude–depth’ plane view.
Remotesensing 15 05579 g017
Table 1. Parameter settings for path planning simulation.
Parameter NameSymbolValueUnit
Threshold radius of the target area r thre 100m
Maximum number of iterations N 10,000
Extended step size ρ 5000m
Selection radius for ChooseParent and Rewire procedures r 10,000m
Maximum depth of ancestors n 2
Table 2. Statistics of total collision detection time t coll .
AlgorithmQ1Q2Q3MeanAverage Percentage
Reduction
R0.50 s0.76 s1.24 s0.97 s94.85%
TR0.04 s0.04 s0.05 s0.05 s
Q1.94 s2.79 s4.66 s4.07 s83.78%
TQ0.44 s0.55 s0.72 s0.66 s
D1.56 s2.48 s3.34 s2.78 s80.93%
TD0.43 s0.49 s0.57 s0.53 s
Table 3. Statistics of initial cost c init .
AlgorithmQ1Q2Q3Mean
R4.38 × 105 m4.73 × 105 m4.99 × 105 m4.66 × 105 m
TR3.71 × 105 m3.86 × 105 m3.99 × 105 m3.94 × 105 m
Q3.80 × 105 m3.89 × 105 m4.05 × 105 m3.94 × 105 m
TQ3.46 × 105 m3.53 × 105 m3.71 × 105 m3.68 × 105 m
D3.76 × 105 m3.92 × 105 m4.11 × 105 m3.93 × 105 m
TD3.45 × 105 m3.48 × 105 m3.50 × 105 m3.48 × 105 m
Table 4. Statistics of initial path computation time t init .
AlgorithmQ1Q2Q3Mean
R1.28 s2.76 s4.11 s3.61 s
TR0.12 s0.14 s0.22 s0.19 s
Q2.72 s3.81 s7.53 s6.05 s
TQ0.48 s0.62 s0.83 s0.81 s
D1.86 s2.83 s4.15 s3.64 s
TD0.48 s0.59 s0.72 s0.64 s
Table 5. Hypothesis test results.
H0: M(ALG1) = M(ALG2)
H1: M(ALG1) > M(ALG2)
ALG1ALG2Mp-ValueReject
RTR t coll 9.91 × 10⁻³⁰Yes
c init 3.88 × 10⁻¹⁵Yes
t init 9.91 × 10⁻³⁰Yes
QTQ t coll 1.16 × 10⁻²⁵Yes
c init 1.06 × 10⁻⁹Yes
t init 1.80 × 10⁻²³Yes
DTD t coll 2.97 × 10⁻²⁸Yes
c init 6.58 × 10⁻²³Yes
t init 9.91 × 10⁻³⁰Yes
Table 6. Average path planning efficiency η ¯ .
Algorithm η ¯ Improvement Multiple
R0.3915.06
TR6.26
Q0.205.98
TQ1.37
D0.334.04
TD1.64
Disclaimer/Publisher’s Note: The statements, opinions and data contained in all publications are solely those of the individual author(s) and contributor(s) and not of MDPI and/or the editor(s). MDPI and/or the editor(s) disclaim responsibility for any injury to people or property resulting from any ideas, methods, instructions or products referred to in the content.

