
A Multi-Parameter Empirical Fusion Model for Ionospheric TEC in China’s Region


1
Institute of Earthquake Forecasting, China Earthquake Administration, Beijing 100036, China
2
School of Civil Engineering and Geomatics, Shandong University of Technology, Zibo 255000, China
3
Institute of Precision Measurement Science and Technology, Chinese Academy of Sciences, Wuhan 430071, China
*
Author to whom correspondence should be addressed.
Remote Sens. 2023, 15(23), 5445; https://doi.org/10.3390/rs15235445
Submission received: 19 October 2023
/
Revised: 19 November 2023
/
Accepted: 20 November 2023
/
Published: 21 November 2023
(This article belongs to the Special Issue State of the Art of Geomagnetic/Electromagnetic Satellites: Science and Applications)
Abstract
:This article takes the measured Total Electron Content (TEC) from the GPS points of the China Regional Crust Observation Network as the starting point to establish a regional ionospheric empirical model. The model’s performance is enhanced by considering solar flux and geomagnetic activity data. The refinement function model of the ionospheric TEC diurnal variation component, seasonal variation component, and geomagnetic component is studied. Using the nonlinear least squares method to fit undetermined coefficients, MEFM-ITCR (Multi-parameter Empirical Fusion Model–Ionospheric TEC China Regional Model) is proposed to forecast the regional ionosphere TEC in China. The results show that the standard deviation of MEFM-ITCR residuals is 3.74TECU, and MEFM-ITCR fits the modeling dataset well. Analyses of geographic location variation, seasonal variation, and geomagnetic disturbance were carried out for MEFM-ITCR performance. The results indicate that in the Chinese region, MEFM-ITCR outperforms IRI2020 and NeQuick2 models in terms of forecast accuracy, linear correlation, and model precision for TEC measured using GPS points under different latitudes and longitudes, different seasons, and different geomagnetic disturbances. The empirical TEC model built for the Chinese region in this paper provides a new ionospheric delay correction method for GNSS single frequency users and is of great significance for establishing other new and improving existing ionospheric empirical models.
1. Introduction
The Total Electron Content (TEC) is a key physical parameter for the study of the ionosphere, and it is tremendously valuable for the correction of wave propagation and the exploration of ionospheric theory. When the frequency of satellite signals is known, only the TEC in the signal transmission path needs to be obtained to determine the ionospheric delay. Therefore, TEC can serve as an effective descriptor of ionospheric delays in satellite signals. Dual-frequency or multi-frequency users can form a linear combination of ionosphere-free delay using satellite observations, thereby weakening or eliminating ionospheric delay as much as possible. However, single-frequency users generally cannot obtain ionospheric delay from their own measurement data and must rely on the ionospheric TEC model for corrections. This TEC model is widely used in Global Navigation Satellite Systems (GNSS) [1]. Different GNSS systems adopt different ionospheric models; for example, GPS and the BeiDou Satellite Navigation System use the Klobuchar model to correct ionospheric delay, while the European Satellite Navigation System Galileo chooses the NeQuick model for ionospheric delay correction [2,3,4]. However, the accuracy of these models is not satisfactory, with the Klobuchar model only being able to correct 50% to 60% of ionospheric delays [1]. In addition, the ionospheric TEC calculated using dual-frequency or multi-frequency observations can be modeled, providing a reference for GNSS single-frequency users for ionospheric delay.
Thus, it is crucial to obtain TEC quickly and accurately. Existing techniques for obtaining ionospheric TEC are mainly divided into two categories: actual TEC methods and ionospheric model methods. The first type includes calculating TEC using GNSS dual-frequency observations, TOPEX/Poseidon dual-frequency altimeter data, radio occultation data, and ionosonde data. The second method is to obtain TEC using ionospheric models, separated into physical models and empirical models. The physical models of the ionosphere are continuous energy and momentum equations based on the physicochemical properties of the ionosphere. However, due to the complexity of the intrinsic structure of the ionosphere and spatial disparities, physical models cannot comprehensively describe the spatiotemporal characteristics of the ionosphere, so related research often focuses on smaller regions. Ionospheric empirical models, on the other hand, are based on the spatiotemporal characteristics of the ionosphere, using reasonable functions to depict these characteristics and form empirical formulas from data observed in the long-term records of the ionosphere. Ionospheric TEC empirical models can fairly reflect the spatiotemporal characteristics of the ionosphere. In practical applications, ionospheric empirical models are typically chosen.
The GPS network has been operational on a global scale for over two decades, accumulating a significant volume of satellite observational data during this period [5]. Such data has yielded copious modeling material for the creation of empirical Total Electron Content (TEC) models at individual stations. Mao and his team, for instance, leveraged TEC data from 1980 to 1990 and applied empirical orthogonal function analysis to develop an empirical TEC model over the Wuhan station [6]. Huang et al. also stood out for using a Gaussian mixture model with an improved radial basis function neural network algorithm that successfully forecasted short-term TEC overhead at a single station [7]. Huang’s team also made use of a hybrid genetic algorithm and a Back Propagation (BP) artificial neural network algorithm to construct a one-hour forecast model for the single-station ionospheric TEC [8]. Feng et al., focusing their research on the MSNA area Antarctic Peninsula station, proposed a single station ionospheric TEC empirical model, namely the “SSM-month” (single station model-month) model [9]. This model encompasses twelve sub-models, which separately describe TEC changes in different months without interference. Yet, these single-station models have some limitations [10]. The SSM-month model, for example, is complex and has many coefficients, which may cause inconvenience in practical application. Moreover, these single-station models have significant regional limitations, which restrict their use to relatively small areas [7,9]. Future studies might make attempts to address these issues or seek new solutions.
Region-wide models have been developing rapidly. Orus et al. improved the accuracy of the global ionosphere map of the Polytechnic University of Catalonia by using the Kriging interpolation algorithm [11]. Jakowski’s team built a global empirical model of the ionosphere using the nonlinear least squares method and GIM data issued by the European Orbit Centre from 1998 to 2007. The model is driven mainly by F10.7 and includes twelve model coefficients [12]. Mukhtarov et al. also used the same method to build a global empirical model of the ionospheric TEC, drawing on CODE GIM data collected from 1999 to 2011 [13,14]. Ercha’s team constructed a global ionosphere model using the EOF method based on GIM data provided by the Jet Propulsion Laboratory between 1999 and 2009 [15]. Also utilizing the EOF method, Wan et al. simulated the total global ionospheric electron content using JPL GIM data from 1998 to 2011 [16]. Feng et al. utilized the CODE GIM data from 1999 to 2015, employed the Non-linear Least Squares estimation in conjunction with grid point concepts to fit model parameters, and developed a new Global Ionospheric TEC model [10]. Performing an analysis of the previous day’s ionospheric simulation, Wang’s team succeeded in obtaining satellite and receiver spherical harmonics coefficients and code biases. Subsequently, they used Bayesian estimation as a tool and successfully enhanced the accuracy of the global ionospheric map at Wuhan University [17]. Wang’s team went on to develop a unique adaptive autoregressive model for predicting the global ionospheric vertical total electron content diagram. This model is mainly based on the autoregressive model for predicting spherical harmonic coefficients and utilizes the F-test method to adaptively determine the order of the autoregressive model [18]. In 2020, Wang et al. further proposed an improved version of the adaptive autoregressive grid point vertical total electron content prediction algorithm.
Meanwhile, Cherrier utilized deep neural networks and a series of CODE TEC data from 2014 to 2016 to design a global ionospheric model. This model can predict global TEC diagrams based on known past TEC graphs without introducing any prior information [19]. Xiong proposed a new type of extended encoder–decoder long short-term memory extension (ED-LSTME). This model demonstrated good performance in the consistency of long-term time sequences and the determination of the optimal delay and predictions [20]. However, there are inherent problems with these large models. Some models only cover specific areas or time periods, and some models use inconsistent accuracy datasets, which pose challenges for prediction accuracy and stability.
Taking into account the pros and cons of single-site models and regional models, our study has developed a new method for constructing regional ionospheric models based on single-site measurement data. For our model data set, we have used high-precision and unified GPS single-site data from mainland China. The Non-linear Least Squares method is used, considering anomalies during empirical model subcomponent modeling, and constructing a regional ionospheric model. The results indicate that the model has higher precision than empirical models such as IRI2020 and NeQuick2. This provides a new method for improving the current ionospheric models and offers more accurate data support for applications in ionospheric space weather and communication navigation fields.
2. GPS-TEC Data
GPS stations provide pseudo ranges and carrier phase readings for two L band frequencies. By calculating the difference between the codes or carrier phase values of the two frequencies, the pseudo-range TEC (also known as STECa) and phase TEC (i.e., STECr) from the satellite to the receiver can be obtained [21]. The computation formula for pseudo-range TEC is as follows:
In this formula, represents 40.3 m3/s2; and are GPS signal frequencies; and are recorded pseudo ranges; represents the speed of light; and designate the satellite’s and receiver’s differential code biases, respectively. The estimation of the differential code bias requires a reduction in the differences in ionospheric delays between corresponding measurements [22,23]. The equation for phase TEC is as follows:
where and signify carrier phases; , represent wavelengths. Assuming that cycle slips do not disrupt the continuity of observation, differential code biases, and integer cycle ambiguities are constant within a cycle. Based on STECa, by smoothing STECr for a specific time over continuous epochs, a more accurate slant TEC (STECi) can be obtained [24,25].
To make slant TEC fit for a wider range of regional analyses, it must be converted into vertical TEC (VTEC). This conversion process uses the mapping function at various ionospheric penetration points, where the penetration point is the intersection of the line of sight and the shell of the ionosphere. The charged particles in the ionosphere are theoretically considered to be primarily distributed in a single thin layer, concentric with the Earth, and nested within the ionosphere. The height of this layer is subject to variations in day and night, geographical location, solar zenith, among other factors, generally between 350 and 480 km. The computation of its height can be quickly implemented. With measurement angles exceeding 30 degrees, the accuracy of the associated calculations significantly improves, making the conversion process feasible in most global regions. The calculation of VTEC can be achieved via the following formula [24,26].
Here, represents the Earth’s average radius, and hm indicates the F2 layer’s peak height. E0 denotes the satellite station’s elevation angle [27,28]. It is worth noting that in the crust observation network in the China region, the data at some stations may be unstable. In our TEC solution, we found occasional TEC values reaching thousands. For data quality assurance, it is necessary to conduct quality control, in the subsequent experiments, all TEC records exceeding 200 TECU will be excluded.
3. Proposed Methodology of Regional Model Development
In this study, not only the ground-based GPS-TEC data has been incorporated, but also auxiliary data including solar activity parameters and geomagnetic indices have been employed. These two types of data were selected and introduced based on the understanding and simulation of ionospheric variations. The following section provides a detailed overview of these data.
3.1. Solar Activity Parameters
Ionospheric variations are predominantly influenced by solar activities [29]. Consequently, when constructing ionospheric models, the impact of solar activities serves as a significant factor. In this research, we have opted to use the F10.7 as the parameter representing solar activity for establishing the ionospheric model. F10.7, which denotes the radio flux of the sun (10.7 cm wavelength), is a widely used index of solar activity that correlates with the condition of the ionosphere. The data of F10.7 can be found within NASA’s Omniweb database, accessible at this specific download link: https://omniweb.gsfc.nasa.gov/form/dx4.html (accessed on 19 August 2023).
3.2. Geomagnetic Indices
Intense solar activities can trigger a series of disturbances in the near-Earth space environment. These activities initiate the migration of a vast amount of high-energy particles through the solar wind into near-Earth space, forming geomagnetic storms. This process involves the coupling of the magnetosphere, the ionosphere, and the thermosphere. Severe geomagnetic storms often lead to ionospheric storms, which result in intense ionospheric oscillations [30,31]. Therefore, when constructing ionospheric models, it is essential to take into consideration the influence of the geomagnetic environment and to select a suitable geomagnetic index to portray the strength of geomagnetic activities. The Kp index represents a global geomagnetic activity index, which is derived from the average K indices given by 13 geomagnetic stations located within geomagnetic latitudes from 47° to 63°. The Ap index is derived from the Kp index, transforming the semi-logarithmic relationship of the Kp index to a mainly linear one, and the summation of 8 indices in a day leads to the daily Ap index, reflecting daily geomagnetic disturbances. These geomagnetic indices can be obtained from NASA’s Omniweb database, specific download link located at https://omniweb.gsfc.nasa.gov/form/dx4.html (accessed on 19 August 2023).
Equation (5) shows a comprehensive model that incorporates five input parameters: the accumulated solar day, local time, longitude, latitude, and solar activity parameters. On the other hand, the right-hand side of the model comprises six core components, encompassing: diurnal variability, MSNA (Mean Summer Nighttime Anomaly) correction, seasonal variations, geomagnetic component, EIA correction, and solar activity. The diurnal variation is expressed as a function of local time , longitude, and latitude, as shown in Equations (6)–(8).
Here, represents the solar elevation angle, the latitude, the solar declination, the hour angle, and and are coefficients to be estimated in the model. The solar radiation function, which describes the geographical differences in solar radiation, is a function of latitude, solar declination, solar elevation angle, and the hour angle, as shown in Equation (6). The TEC diurnal curve is formed using a combination of four harmonics and four coefficients to be estimated, as shown in Eq. (7). The four harmonics can describe the variations in the TEC at different timescales within a day, while the four estimated coefficients can correct the ionospheric diurnal details beyond the four harmonics. As initial studies were restricted to the MSNA region, Equation (9) does not involve any positional information. This study introduces a function expression, , to describe the MSNA positional information and introduce the region-specific MSNA correction expression into the global ionospheric Total Electron Content (TEC) empirical model. The piecewise function, , only operates in the MSNA phenomenon occurrence sector: (40°–60°N, 120°–140°E) and is invalid in other areas. The day–night ratio correction is included following previous studies. Our proposed model is regional, with the new equation for MSNA correction being Equation (10).
The seasonal change component, , is set to be a function of the accumulated solar day and modeled using a combination of four harmonics and four coefficients to be estimated. The exact formula is as follows:
In this paper, the modified magnetic inclination latitude (modip latitude) is used as the geomagnetic parameter. represents the corrected magnetic inclination latitude; represents the magnetic inclination, obtained from the 13th International Geomagnetic Reference Field model IGRF13; represents the geographic latitude. The geomagnetic term, , is represented in Equations (17) and (18):
In this paper, we follow the approach of Mukhtarov and use linear variations in the solar activity parameter to describe the solar activity trend and thereby understand the current state of solar activity [14].
In total, there are 47 coefficients in Equations (5)–(19), which were obtained by applying the method of non-linear least squares fitting. The modeling process is illustrated in Figure 1.
Figure 2 presents the distribution histogram of model residuals. It can be distinctly seen from the figure that the residuals of the MEFM-ITCR model exhibit characteristics of a normal distribution, with the majority of the residuals falling within ±15 TECU range. The mean value of the residuals of this model is 0 TECU, with a standard deviation of 3.74 TECU. It suggests that the model fits the data well, indicating good predictive capabilities.
4. Model Comparison
To fully evaluate the performance of the model, we have selected the 2017 solar activity parameters, geographic coordinates (longitude and latitude) of various locations, day of the year, and local time as the input variables for the MEFM-ITCR model. The aim is to predict the TEC at various locations in China for the year 2017. For a comprehensive validation of the accuracy of our model, we additionally introduced the IRI2020 and NeQuick2 models for comparative reference. The ground truth was based on TEC calculated from 30 GPS locations. Here is the detailed information of GPS survey stations as shown in Table 1.We compared the three models in different geographic locations, in different seasons, and under different geomagnetic disturbance conditions. Through this methodology, we hope to gain a comprehensive understanding of the accuracy and forecasting ability of the MEFM-ITCR model, as well as its strengths and weaknesses compared with other models.
4.1. Overview of IRI2020 and NeQuick2 Models
The International Reference Ionosphere 2020 (IRI2020) is an internationally recognized ionosphere model intended to depict the physical and chemical characteristics of the global ionosphere. This model can provide forecasts of ionospheric parameters (such as electron density, ionospheric height, TEC, etc.) and indices related to solar and geomagnetic activities. Based on the actual data from multiple monitoring stations worldwide and combined with physical models and statistical methods, IRI2020 can accurately model and predict ionospheric characteristics at different latitudes, longitudes, seasons, and times. This model plays a key role in scientific research, astronomy, communication, and navigation systems among others. As an international standardization model based on global cooperation, IRI2020 continues to iterate and optimize to provide more accurate ionosphere information and forecast data.
NeQuick2 is another ionosphere model used to predict the physical characteristics of the global ionosphere in various different environments. As one of the recommended ionospheric prediction models by the International Telecommunication Union (ITU), NeQuick2 is specifically used to optimize the performance of the Global Navigation Satellite System (GNSS). This model utilizes a substantial amount of global ionospheric observational data, combined with relevant physical models, to model and forecast the vertical electron density distribution of the ionosphere. It can also calculate various ionospheric parameters such as electron density, TEC, etc. In the application of GNSS, the NeQuick2 model plays a crucial role, especially in improving signal propagation accuracy and stability. By providing accurate ionospheric delay correction, NeQuick2 helps to enhance the accuracy of navigation and positioning. The model is co-developed by the European Space Agency (ESA) and other partners and is widely used in global navigation, communication, weather forecasting, and so on. In this study, we obtained data from the NeQuick2 model using the Fortran source code provided by The Abdus Salam International Centre for Theoretical Physics (ICTP). The download link is https://t-ict4d.ictp.it/nequick2/ (accessed on 19 August 2023).
4.2. Evaluation Parameters
The evaluation metrics encompass primarily R2 (also known as the coefficient of determination), RMSE (root mean square error), MAE (mean absolute error), and ρ2 (the square of Pearson’s correlation coefficient). Each of these parameters is defined and calculated as follows:
R2, the coefficient of determination, quantifies the extent to which there exists a correlation between the observed variables and the predictions made by a model. Its values range from 0 to 1. The computational formula for R2 is given below:
Here, SSR symbolizes the residual sum of squares, which is generated by squaring and summing the differences between each observed value and its corresponding predicted value, and SST stands for a total sum of squares (the sum of squares of deviations between each observed value and the average of observed values).
Onto RMSE (root mean square error). This is a metric applied to gauge the divergence between a model’s predictive values and the true values. Below is how it is calculated:
In the above computation, n signifies the count of samples, denotes the observed value, and represents the corresponding forecasted value.
Switching to MAE (mean absolute error), this functions as a measure for the average absolute discrepancy between the predictive values and the legitimate values. Its calculation proceeds as follows:
Herein, n represents the total of samples, indicates the observed value, and is the corresponding estimated value.
Transitioning to ρ2, (the square of Pearson’s correlation coefficient), Pearson’s correlation coefficient gauges the strength of a linear association between two variables. The square of this coefficient, ρ2, embodies the percentage of variance in one variable elucidated by the variance in another variable. The computation for this occurs as follows:
where, , are the data, and , are the means of x and y, respectively.
5. Results
5.1. Comparative Analysis of Overall Performance
Based on the given data and calculated results of R2, MAE, RMSE, and ρ2, the MEFM-ITCR model exhibits robust explanatory capacity and relatively lower predictive errors. As indicated in Table 2. Per the R2 determination coefficient: the R2 of the MEFM-ITCR model is considerably higher at 0.7036 compared to IRI2020 (0.5545) and NeQuick2 (0.4762), suggesting a superior capacity of the MEFM-ITCR model in explaining ionospheric characteristics. This denotes a stronger correlation between the predictions of the MEFM-ITCR model and actual values. Examining the MAE (Mean Absolute Error), the MEFM-ITCR model’s MAE score of 2.2530 TECU is significantly less than IRI2020’s 3.2951 TECU and NeQuick2’s 3.2887 TECU. This confirms that the average prediction error of the MEFM-ITCR model is lesser in predicting ionospheric attributes compared to the other two models.
Regarding the RMSE (Root Mean Square Error), it measures the square root of the average squared difference between the predicted and actual measurements, and it penalizes larger errors than MAE. The MEFM-ITCR model’s RMSE value of 3.4353 TECU is considerably lower than that of IRI2020 (4.2121 TECU) and NeQuick2 (4.5670 TECU), further indicating superior predictive accuracy of the MEFM-ITCR model. With respect to ρ2 Pearson’s coefficient of determination, the MEFM-ITCR model’s ρ2 value of 0.7525 is marginally higher than IRI2020 (0.7383) and much higher than NeQuick2 (0.6694). This signifies a higher degree of linear correlation between the MEFM-ITCR model’s predictions and actual values. In summary, the MEFM-ITCR model surpasses the IRI2020 and NeQuick2 models in terms of explanatory power, prediction error (including mean deviation and fluctuation), and linear correlation, exhibiting distinct advantages.
5.2. Variation Characteristics of Model Performance Based on Geographic Location
For a comprehensive evaluation of the predictive performance of the models under different latitudinal conditions, we calculated the R2, RMSE, MAE, and ρ2 scores of MEFM-ITCR, IRI2020, and NeQuick2 models relative to the actual GPS-TEC data. The results are presented in Figure 3, where measurement stations are arranged from higher to lower latitudes. Focusing on high-latitude regions, for example, the XJJJ station, the MEFM-ITCR model shows significantly higher agreement in predicting GPS-TEC and demonstrates a strong correlation with actual GPS-TEC data, compared to NeQuick2. Conversely, a negative R2 value for the IRI2020 model indicates its worst predictive correlation at this station. The MEFM-ITCR model also outperforms the NeQuick2 model in terms of standard deviation and mean absolute error, showcasing the highest accuracy. In contrast, the IRI2020 model exhibits the highest standard deviation and mean absolute error indicating the lowest accuracy. The comparative fitting results of different models are illustrated in Figure 4.
Consequently, in high-latitude regions, the overall predictive performance of the MEFM-ITCR model is notably superior to IRI2020 and NeQuick2. In mid- and low-latitude regions, the MEFM-ITCR model encounters some fluctuations in accuracy along with an increase in the standard deviation and mean absolute error with declining latitude. This trend could be attributed to the decrease in the number of GPS stations in China with decreasing latitude, affecting the prediction accuracy of empirical models such as MEFM-ITCR based on actual data. Moreover, lower latitude areas are considerably influenced by the equatorial ionospheric abnormality, which could also be a contributing factor. Nevertheless, holistically, in mid- and low-latitude areas, the MEFM-ITCR model performs better in terms of fitting accuracy, root mean square error, mean absolute error, and linear correlation compared to IRI2020 and NeQuick2. The specific performance evaluation of each model for each testing station is provided in Table A1, Table A2 and Table A3 in Appendix A.
Existing studies have indicated that the performance of the TEC prediction models varies with the change in seasons, as referenced in the works of Mukesh et al., 2020; Ruwali et al., 2020; Song et al., 2018; and Tebabal et al., 2018–2019 [32,33,34,35]. Therefore, we ran all considered models for each season to investigate their performance throughout the solar year. The seasons were defined as spring (March–May), summer (June–August), autumn (September–November), and winter (December–February). Furthermore, to validate our proposed MEFM-ITCR model more comprehensively, we compared the TEC calculated using the MEFM-ITCR model, IRI2020, NeQuick2, and 30 GPS stations. Figure 5 displays the trend of seasonal variation in model performance. Table 3 lists the corresponding R2, MAE, RMSE, and correlation coefficient ρ2 values of the TEC forecast and their seasonal variations for each model. The MEFM-ITCR model exhibited the best performance in each season, with the following specific figures: spring R2 = 0.7085, summer R2 = 0.6937, autumn R2 = 0.6904, winter R2 = 0.6338. Evidently, the performance of the IRI2020 model surpasses that of NeQuick2 in spring, autumn, and winter. Both are influenced by seasonal changes, but IRI2020 is slightly stronger, with the MEFM-ITCR model consistently leading the way. Notably, the MEFM-ITCR model demonstrated a significant edge in resisting solar activity interference, with a smaller prediction curve fluctuation compared to the IRI2020 and NeQuick2 models, especially in winter. The MEFM-ITCR winter R2 value of 0.6338 far surpasses the 0.2323 of the IRI2020 model and the 0.1991 of the NeQuick2 model.
In an effort to delve deeper into the effectiveness of the models, we chose specific dates in four different seasons (i.e., 19 March, 19 June, 19 September, and 19 December) for further validation. We compared the TEC calculated using the MEFM-ITCR model, IRI2020, NeQuick2, and three GPS stations (TASH at mid-latitudes, LHAS at low latitudes, and the HECD station at high latitudes). As Figure 6 indicates, the MEFM-ITCR model’s predictions showed a high correlation with the measured TEC, particularly in spring and summer, where the prediction curve of the MEFM-ITCR model almost overlapped with the curve of the actual TEC values. This suggests that advanced empirical models, compared to simple models considering only basic space environment parameters, can achieve higher precision in TEC estimation.
5.3. The Impact of Solar and Geomagnetic Activity on Model Performance
To probe our model’s prediction accuracy under different solar and geomagnetic activity conditions further, we contrasted the Total Electron Content (TEC) values derived during quiet (Kp < 3.0 or Ap < 56) and disturbed (Kp > 3.0 or Ap > 56) days. It is well known that during geomagnetic activity, ionospheric changes often become notably significant. Figure 7 reveals the precision error comparison of each model. The results show that in conditions where Kp > 3.0, the root mean square error (RMSE) of the MEFM-ITCR model increased by 0.2992 TECU, compared to an increase of 0.5466 TECU and 0.3172 TECU in the RMSE of IRI2020 and NeQuick2, respectively. Under Ap > 56, the RMSE of MEFM-ITCR compared to full-year data increased by 1.2769 TECU, reaching 4.71219, while increases for IRI2020 and NeQuick2 were 2.1567 TECU and 0.2731 TECU, reaching 6.3687 TECU and 4.8401 TECU, respectively. Despite the changing condition, the MEFM-ITCR model still maintained the smallest RMSE and MAN. This clearly demonstrates that the MEFM-ITCR model presents a high level of performance under disrupted conditions, and this model can accurately grasp the trends presented during storms and other geomagnetic disturbances, fully highlighting its efficient and stable performance. The performance of the model is illustrated in Table 4.
5.4. Regional Model Accuracy Comparison
Since June 1998, Global Ionospheric Maps (GIM) have been computed and made public within the IGS Ionosphere Working Group, encapsulating the global distribution of VTEC. We selected CODE TEC (global ionospheric map provided by the European Center for Orbit Determination) as comparative data due to its relatively high accuracy; it is calculated using a sum function model and based on a large number of dual-frequency observation data from hundreds of permanent GNSS receivers worldwide. We compared the relative accuracy of MEFM-ITCR, IRI2020, and NeQuick2 models in China. Figure 8 displays that at 8:00 in the morning, the ionospheric TEC content of the research area clearly shows a step shape, with the overall content increasing as the latitude decreases. Within the range of 20°–40°N, CODE TEC is predominantly distributed at 15–25 TECU. Both IRI2020 and NeQuick2 obviously overestimate the TEC content, especially the IRI2020 model, with some areas reaching up to 40 TECU, deviating from CODE TEC by nearly 15 TECU. By noon (12:00), areas with high TEC content are mainly concentrated near the Indian Peninsula and the Indian Ocean. The precision of the model may be compromised in the Indian Peninsula and the Indian Ocean due to the distribution limitations of China’s crust observation network. Nevertheless, it successfully predicts the main distribution area of TEC, indirectly reflecting the potential of such modeling methods in constructing global ionospheric empirical models. At 4:00 in the afternoon and 8:00 in the evening, for the mainland China region, MEFM-ITCR is closer to CODE TEC compared to IRI2020 and NeQuick2. At 4:00 pm, the deviation of MEFM-ITCR from CODE TEC is between 0 and 4 TECU, while the deviation for IRI2020 and NeQuick2 models from CODE TEC is between 2 and 8 TECU. In conclusion, the deviation of MEFM-ITCR from CODE TEC is considerably less.
6. Conclusions
In this research, we delve deeply into precise function models of the ionospheric Total Electron Content (TEC) diurnal component, seasonal variation component, geomagnetic activity component, MSNA correction component, and solar activity-related component based on the actual TEC data measured at GPS stations, in conjunction with solar flux and geomagnetic activity data. Utilizing the non-linear least squares method to fit the coefficients to be determined, we constructed an empirical model, MEFM-ITCR, aiming to forecast China’s regional ionospheric TEC.
We conducted multidimensional evaluations of the performance of the MEFM-ITCR model, which included geographical position variation analysis, seasonal variation analysis, geomagnetic disturbance analysis, and regional model comparison. In the area of China, irrespective of different latitudes and longitudes, different seasons, or various states of geomagnetic disturbance, the MEFM-ITCR model’s predictive power, its linear correlation, as well as the model’s accuracy, have all surpassed the IRI2020 and NeQuick2 models. When conducting a regional model comparison, we found that this model possesses considerable scalability. Even in the Indian Peninsula and Indian Ocean regions, areas not covered by the modeling dataset, it can accurately predict the increment of TEC, which implies that this model carries the potential for application in other areas. However, constrained by the fact that the modeling dataset only includes crust observation network GPS stations within China, the predictive capacity of the model for ionospheric abnormal phenomena, such as Equatorial Ionization Anomaly (EIA), remains to be enhanced. In response to this, we should further reinforce research in both MSNA and EIA areas to drive the continuous improvement and development of this model.
Author Contributions
Conceptualization, J.C.; methodology, J.C.; methodology, J.C.; validation, H.W.; formal analysis, X.Z.; investigation, J.F.; resources, T.Z.; data curation, T.Z.; writing—original draft preparation, J.C.; writing—review and editing, X.Z.; visualization, J.C.; supervision, P.X. All authors have read and agreed to the published version of the manuscript.
Funding
This work was supported in part by the Central Public-interest Scientific Institution Basal Research Fund (No. CEAIEF20230506), and the Natural Science Foundation of China (NSFC), grant number 42274108.
Data Availability Statement
The GNSS data of CMONOC can be accessed from the platform of the GNSS data analysis center SHAO (SHA: http://www.shao.ac.cn/shao_gnss_ac (accessed on 19 August 2023)). The geomagnetic activity index Kp was provided by the GFZ German Research Centre for Geosciences (https://www.gfz-potsdam.de/en/kp-index/ (accessed on 19 August 2023)). The solar activity index F10.7 was downloaded from the SPDF OMNIWeb database (https://omniweb.gsfc.nasa.gov/form/dx1.html (accessed on 19 August 2023)). The IRI-2016 and NeQuick-2 models are publicly available on http://irimodel.org (accessed on 19 August 2023) and https://t-ict4d.ictp.it/nequick2/nequick-2-web-model (accessed on 19 August 2023), respectively.
Conflicts of Interest
The authors declare no conflict of interest.
Appendix A

Table A1.
Accuracy evaluation of the MEFM-ITCR model at test stations.
| Station Code | R2 | RMSE | MAN | ρ2 | |
|---|---|---|---|---|---|
| High latitude | XJKL | 0.3786 | 2.5562 | 2.0714 | 0.4205 |
| XJJJ | 0.6153 | 2.0582 | 1.6261 | 0.6421 | |
| LNSY | 0.5475 | 2.0477 | 1.5919 | 0.6343 | |
| NMWT | 0.5801 | 2.0016 | 1.5402 | 0.6565 | |
| HECD | 0.5368 | 2.0406 | 1.5775 | 0.6473 | |
| DXIN | 0.6462 | 1.9849 | 1.5393 | 0.6909 | |
| Middle latitude | GSJY | 0.6836 | 1.9774 | 1.5182 | 0.7330 |
| QHMY | 0.7327 | 1.9988 | 1.5462 | 0.7687 | |
| TASH | 0.7528 | 2.0211 | 1.5603 | 0.7671 | |
| SXTY | 0.5471 | 2.2635 | 1.7072 | 0.7146 | |
| HELY | 0.5106 | 2.3502 | 1.7946 | 0.7060 | |
| XJHT | 0.7579 | 2.0395 | 1.5826 | 0.7787 | |
| SDZB | 0.5198 | 2.4067 | 1.8233 | 0.7213 | |
| XJYT | 0.7500 | 2.1317 | 1.6440 | 0.7864 | |
| SNXY | 0.5721 | 2.4737 | 1.8583 | 0.7564 | |
| QHMD | 0.7011 | 2.3420 | 1.7724 | 0.7847 | |
| SNTB | 0.6027 | 2.5787 | 1.9305 | 0.7605 | |
| XZBG | 0.7567 | 2.7741 | 2.0699 | 0.8082 | |
| CQWZ | 0.6416 | 3.0277 | 2.2581 | 0.7887 | |
| WUHN | 0.5917 | 3.1105 | 2.3488 | 0.7609 | |
| Low latitude | LHAS | 0.7500 | 3.2131 | 2.3184 | 0.7994 |
| XZZF | 0.7517 | 3.6092 | 2.5051 | 0.8034 | |
| HNLY | 0.6818 | 3.6064 | 2.6198 | 0.7799 | |
| SCML | 0.7343 | 3.8950 | 2.6329 | 0.8025 | |
| FJWY | 0.6715 | 3.6853 | 2.6713 | 0.7754 | |
| GZGY | 0.7231 | 4.5513 | 2.9215 | 0.8073 | |
| FJPT | 0.7262 | 4.3654 | 2.9962 | 0.7930 | |
| XIAM | 0.6337 | 6.1443 | 3.9636 | 0.7001 | |
| GUAN | 0.6568 | 6.9318 | 4.4115 | 0.7928 | |
| HISY | 0.6908 | 7.3725 | 5.2306 | 0.8192 |
Table A2.
Accuracy evaluation of the IRI 2020 model at test stations.
| Station Code | R2 | RMSE | MAN | ρ2 | |
|---|---|---|---|---|---|
| High latitude | XJKL | −0.3399 | 3.7535 | 3.2836 | 0.6983 |
| XJJJ | −0.3829 | 3.9024 | 3.3955 | 0.6779 | |
| LNSY | −0.3065 | 3.4794 | 2.9474 | 0.6357 | |
| NMWT | −0.3932 | 3.6460 | 3.0965 | 0.6421 | |
| HECD | −0.3583 | 3.4946 | 2.9772 | 0.6418 | |
| DXIN | −0.2662 | 3.7552 | 3.1851 | 0.6613 | |
| Middle latitude | GSJY | −0.1713 | 3.8050 | 3.2428 | 0.6857 |
| QHMY | 0.1321 | 3.6020 | 3.0324 | 0.7207 | |
| TASH | 0.1783 | 3.6845 | 3.1056 | 0.7318 | |
| SXTY | −0.1454 | 3.5994 | 3.0380 | 0.6789 | |
| HELY | −0.0505 | 3.4435 | 2.9106 | 0.6788 | |
| XJHT | 0.2183 | 3.6649 | 3.0843 | 0.7367 | |
| SDZB | 0.0725 | 3.3446 | 2.8038 | 0.7045 | |
| XJYT | 0.3282 | 3.4946 | 2.8992 | 0.7473 | |
| SNXY | 0.0854 | 3.6165 | 3.0384 | 0.7173 | |
| QHMD | 0.2981 | 3.5887 | 2.9935 | 0.7543 | |
| SNTB | 0.2578 | 3.5245 | 2.9437 | 0.7430 | |
| XZBG | 0.5976 | 3.5678 | 2.8653 | 0.7740 | |
| CQWZ | 0.4716 | 3.6763 | 2.9521 | 0.7546 | |
| WUHN | 0.4539 | 3.5974 | 2.9236 | 0.7568 | |
| Low latitude | LHAS | 0.6125 | 4.0002 | 3.1980 | 0.7792 |
| XZZF | 0.6363 | 4.3681 | 3.3018 | 0.7760 | |
| HNLY | 0.6036 | 4.0251 | 3.0357 | 0.7682 | |
| SCML | 0.6255 | 4.6243 | 3.4528 | 0.7797 | |
| FJWY | 0.6376 | 3.8712 | 2.9285 | 0.7695 | |
| GZGY | 0.6390 | 5.1970 | 3.8928 | 0.7719 | |
| FJPT | 0.6251 | 5.1086 | 3.7407 | 0.7708 | |
| XIAM | 0.5840 | 6.5479 | 4.8229 | 0.6830 | |
| GUAN | 0.6599 | 6.9010 | 5.0258 | 0.7406 | |
| HISY | 0.7741 | 6.3025 | 4.7520 | 0.7821 |
Table A3.
Accuracy evaluation of the NeQuick2 model at test stations.
| Station Code | R2 | RMSE | MAN | ρ2 | |
|---|---|---|---|---|---|
| High latitude | XJKL | 0.0262 | 3.2000 | 2.5707 | 0.6392 |
| XJJJ | 0.0123 | 3.2980 | 2.6538 | 0.6120 | |
| LNSY | −0.0665 | 3.1436 | 2.4351 | 0.6141 | |
| NMWT | −0.1988 | 3.3821 | 2.6480 | 0.5750 | |
| HECD | −0.1547 | 3.2221 | 2.5195 | 0.5942 | |
| DXIN | −0.0843 | 3.4750 | 2.7537 | 0.5789 | |
| Middle latitude | GSJY | 0.0602 | 3.4083 | 2.6816 | 0.6278 |
| QHMY | 0.2013 | 3.4555 | 2.7310 | 0.6295 | |
| TASH | 0.2872 | 3.4316 | 2.7474 | 0.6398 | |
| SXTY | −0.0227 | 3.4013 | 2.6430 | 0.6166 | |
| HELY | 0.0266 | 3.3147 | 2.5514 | 0.6485 | |
| XJHT | 0.3924 | 3.2310 | 2.5353 | 0.6955 | |
| SDZB | 0.0632 | 3.3613 | 2.5740 | 0.6685 | |
| XJYT | 0.3849 | 3.3439 | 2.6241 | 0.6806 | |
| SNXY | 0.1478 | 3.4909 | 2.7106 | 0.6484 | |
| QHMD | 0.2650 | 3.6722 | 2.8303 | 0.6952 | |
| SNTB | 0.1154 | 3.8479 | 2.9551 | 0.6900 | |
| XZBG | 0.4680 | 4.1021 | 3.1809 | 0.6987 | |
| CQWZ | 0.3212 | 4.1668 | 3.1416 | 0.7048 | |
| WUHN | 0.3411 | 3.9515 | 2.9573 | 0.6996 | |
| Low latitude | LHAS | 0.3124 | 5.3288 | 3.9513 | 0.7106 |
| XZZF | 0.5100 | 5.0704 | 3.8490 | 0.6944 | |
| HNLY | 0.3830 | 5.0215 | 3.6278 | 0.7060 | |
| SCML | 0.4548 | 5.5797 | 4.1250 | 0.7014 | |
| FJWY | 0.3787 | 5.0684 | 3.6438 | 0.6921 | |
| GZGY | 0.4240 | 6.5641 | 4.7613 | 0.7130 | |
| FJPT | 0.5222 | 5.7667 | 4.0987 | 0.7083 | |
| XIAM | 0.4214 | 7.7229 | 5.4613 | 0.6304 | |
| GUAN | 0.5927 | 7.5516 | 5.4635 | 0.6694 | |
| HISY | 0.7123 | 7.1124 | 5.2663 | 0.7515 |
References
- Klobuchar, J.A. Ionospheric time-delay algorithm for single-frequency GPS users. IEEE Trans. Aerosp. Electron. Syst. 1987, 3, 325–331. [Google Scholar] [CrossRef]
- Hochegger, G.; Nava, B.; Radicella, S.; Leitinger, R. A family of ionospheric models for different uses. Phys. Chem. Earth Part C Sol. Terr. Planet. Sci. 2000, 25, 307–310. [Google Scholar] [CrossRef]
- Radicella, S.M.; Leitinger, R. The evolution of the DGR approach to model electron density profiles. Adv. Space Res. 2001, 27, 35–40. [Google Scholar] [CrossRef]
- Nava, B.; Coisson, P.; Radicella, S. A new version of the NeQuick ionosphere electron density model. J. Atmos. Sol.-Terr. Phys. 2008, 70, 1856–1862. [Google Scholar] [CrossRef]
- Montenbruck, O.; Steigenberger, P.; Prange, L.; Deng, Z.; Zhao, Q.; Perosanz, F.; Romero, I.; Noll, C.; Stürze, A.; Weber, G. The Multi-GNSS Experiment (MGEX) of the International GNSS Service (IGS)–achievements, prospects and challenges. Adv. Space Res. 2017, 59, 1671–1697. [Google Scholar] [CrossRef]
- MAO, T.; WAN, W.X.; LIU, L.B. An EOF based empirical model of TEC over Wuhan. Chin. J. Geophys. 2005, 48, 827–834. [Google Scholar] [CrossRef]
- Huang, Z.; Yuan, H. Ionospheric single-station TEC short-term forecast using RBF neural network. Radio Sci. 2014, 49, 283–292. [Google Scholar] [CrossRef]
- Huang, Z.; Li, Q.; Yuan, H. Forecasting of ionospheric vertical TEC 1-h ahead using a genetic algorithm and neural network. Adv. Space Res. 2015, 55, 1775–1783. [Google Scholar] [CrossRef]
- Feng, J.; Wang, Z.; Jiang, W.; Zhao, Z.; Zhang, B. A single-station empirical model for TEC over the Antarctic Peninsula using GPS-TEC data. Radio Sci. 2017, 52, 196–214. [Google Scholar] [CrossRef]
- Feng, J.; Han, B.; Zhao, Z.; Wang, Z. A new global total electron content empirical model. Remote Sens. 2019, 11, 706. [Google Scholar] [CrossRef]
- Orús, R.; Hernández-Pajares, M.; Juan, J.; Sanz, J. Improvement of global ionospheric VTEC maps by using kriging interpolation technique. J. Atmos. Sol.-Terr. Phys. 2005, 67, 1598–1609. [Google Scholar] [CrossRef]
- Jakowski, N.; Hoque, M.; Mayer, C. A new global TEC model for estimating transionospheric radio wave propagation errors. J. Geod. 2011, 85, 965–974. [Google Scholar] [CrossRef]
- Mukhtarov, P.; Pancheva, D.; Andonov, B.; Pashova, L. Global TEC maps based on GNNS data: 2. Model evaluation. J. Geophys. Res. Space Phys. 2013, 118, 4609–4617. [Google Scholar] [CrossRef]
- Mukhtarov, P.; Pancheva, D.; Andonov, B.; Pashova, L. Global TEC maps based on GNSS data: 1. Empirical background TEC model. J. Geophys. Res. Space Phys. 2013, 118, 4594–4608. [Google Scholar] [CrossRef]
- Zhang, D.; Ridley, A.J.; Xiao, Z.; Hao, Y. A global model: Empirical orthogonal function analysis of total electron content 1999–2009 data. J. Geophys. Res. 2012, 117, A03328. [Google Scholar]
- Wan, W.; Ding, F.; Ren, Z.; Zhang, M.; Liu, L.; Ning, B. Modeling the global ionospheric total electron content with empirical orthogonal function analysis. Sci. China Technol. Sci. 2012, 55, 1161–1168. [Google Scholar] [CrossRef]
- Wang, C.; Shi, C.; Fan, L.; Zhang, H. Improved modeling of global ionospheric total electron content using prior information. Remote Sens. 2018, 10, 63. [Google Scholar] [CrossRef]
- Wang, C.; Xin, S.; Liu, X.; Shi, C.; Fan, L. Prediction of global ionospheric VTEC maps using an adaptive autoregressive model. Earth Planets Space 2018, 70, 18. [Google Scholar] [CrossRef]
- Cherrier, N.; Castaings, T.; Boulch, A. Deep sequence-to-sequence neural networks for ionospheric activity map prediction. In Proceedings of the Neural Information Processing: 24th International Conference, ICONIP 2017, Guangzhou, China, 14–18 November 2017; Proceedings, Part V 24. Springer International Publishing: Cham, Switzerland, 2017; pp. 545–555. [Google Scholar]
- Xiong, P.; Zhai, D.; Long, C.; Zhou, H.; Zhang, X.; Shen, X. Long Short-Term Memory Neural Network for Ionospheric Total Electron Content Forecasting Over China. Space Weather 2021, 19, e2020SW002706. [Google Scholar] [CrossRef]
- Mannucci, A.; Wilson, B.; Yuan, D.; Ho, C.; Lindqwister, U.; Runge, T. A global mapping technique for GPS-derived ionospheric total electron content measurements. Radio Sci. 1998, 33, 565–582. [Google Scholar] [CrossRef]
- Li, Z.; Yuan, Y.; Li, H.; Ou, J.; Huo, X. Two-step method for the determination of the differential code biases of COMPASS satellites. J. Geod. 2012, 86, 1059–1076. [Google Scholar] [CrossRef]
- Yuan, Y.; Li, Z.; Wang, N.; Zhang, B.; Li, H.; Li, M.; Huo, X.; Ou, J. Monitoring the ionosphere based on the Crustal Movement Observation Network of China. Geod. Geodyn. 2015, 6, 73–80. [Google Scholar] [CrossRef]
- Hernández-Pajares, M.; Juan, J.M.; Sanz, J.; Aragón-Àngel, À.; García-Rigo, A.; Salazar, D.; Escudero, M. The ionosphere: Effects, GPS modeling and the benefits for space geodetic techniques. J. Geod. 2011, 85, 887–907. [Google Scholar] [CrossRef]
- Hernández-Pajares, M.; García-Rigo, A.; Juan, J.M.; Sanz, J.; Monte, E.; Aragón-Àngel, A. GNSS measurement of EUV photons flux rate during strong and mid solar flares. Space Weather 2012, 10, S12001. [Google Scholar] [CrossRef]
- Afraimovich, E.; Altyntsev, A.; Kosogorov, E.; Larina, N.; Leonovich, L. Ionospheric effects of the solar flares of September 23, 1998 and July 29, 1999 as deduced from global GPS network data. J. Atmos. Sol.-Terr. Phys. 2001, 63, 1841–1849. [Google Scholar] [CrossRef]
- Xiong, B.; Wan, W.; Ning, B.; Ding, F.; Hu, L.; Yu, Y. A statistic study of ionospheric solar flare activity indicator. Space Weather 2014, 12, 29–40. [Google Scholar] [CrossRef]
- Xiong, B.; Wan, W.; Yu, Y.; Hu, L. Investigation of ionospheric TEC over China based on GNSS data. Adv. Space Res. 2016, 58, 867–877. [Google Scholar] [CrossRef]
- Feng, J.; Yuan, Y.; Zhang, T.; Zhang, Z.; Meng, D. Analysis of Ionospheric Anomalies before the Tonga Volcanic Eruption on 15 January 2022. Remote Sens. 2023, 15, 4879. [Google Scholar] [CrossRef]
- Milan, S.E.; Clausen, L.B.N.; Coxon, J.C.; Carter, J.A.; Walach, M.-T.; Laundal, K.; Østgaard, N.; Tenfjord, P.; Reistad, J.; Snekvik, K. Overview of solar wind–magnetosphere–ionosphere–atmosphere coupling and the generation of magnetospheric currents. Space Sci. Rev. 2017, 206, 547–573. [Google Scholar] [CrossRef]
- Gonzalez, W.; Joselyn, J.-A.; Kamide, Y.; Kroehl, H.W.; Rostoker, G.; Tsurutani, B.T.; Vasyliunas, V. What is a geomagnetic storm? J. Geophys. Res. Space Phys. 1994, 99, 5771–5792. [Google Scholar] [CrossRef]
- Ruwali, A.; Kumar, A.S.; Prakash, K.B.; Sivavaraprasad, G.; Ratnam, D.V. Implementation of hybrid deep learning model (LSTM-CNN) for ionospheric TEC forecasting using GPS data. IEEE Geosci. Remote Sens. Lett. 2020, 18, 1004–1008. [Google Scholar] [CrossRef]
- Song, R.; Zhang, X.; Zhou, C.; Liu, J.; He, J. Predicting TEC in China based on the neural networks optimized by genetic algorithm. Adv. Space Res. 2018, 62, 745–759. [Google Scholar] [CrossRef]
- Tebabal, A.; Radicella, S.M.; Nigussie, M.; Damtie, B.; Nava, B.; Yizengaw, E. Local TEC modelling and forecasting using neural networks. J. Atmos. Sol.-Terr. Phys. 2018, 172, 143–151. [Google Scholar] [CrossRef]
- Tebabal, A.; Radicella, S.; Damtie, B.; Migoya-Orue, Y.; Nigussie, M.; Nava, B. Feed forward neural network based ionospheric model for the East African region. J. Atmos. Sol.-Terr. Phys. 2019, 191, 105052. [Google Scholar] [CrossRef]
Figure 1.
Modeling workflow.
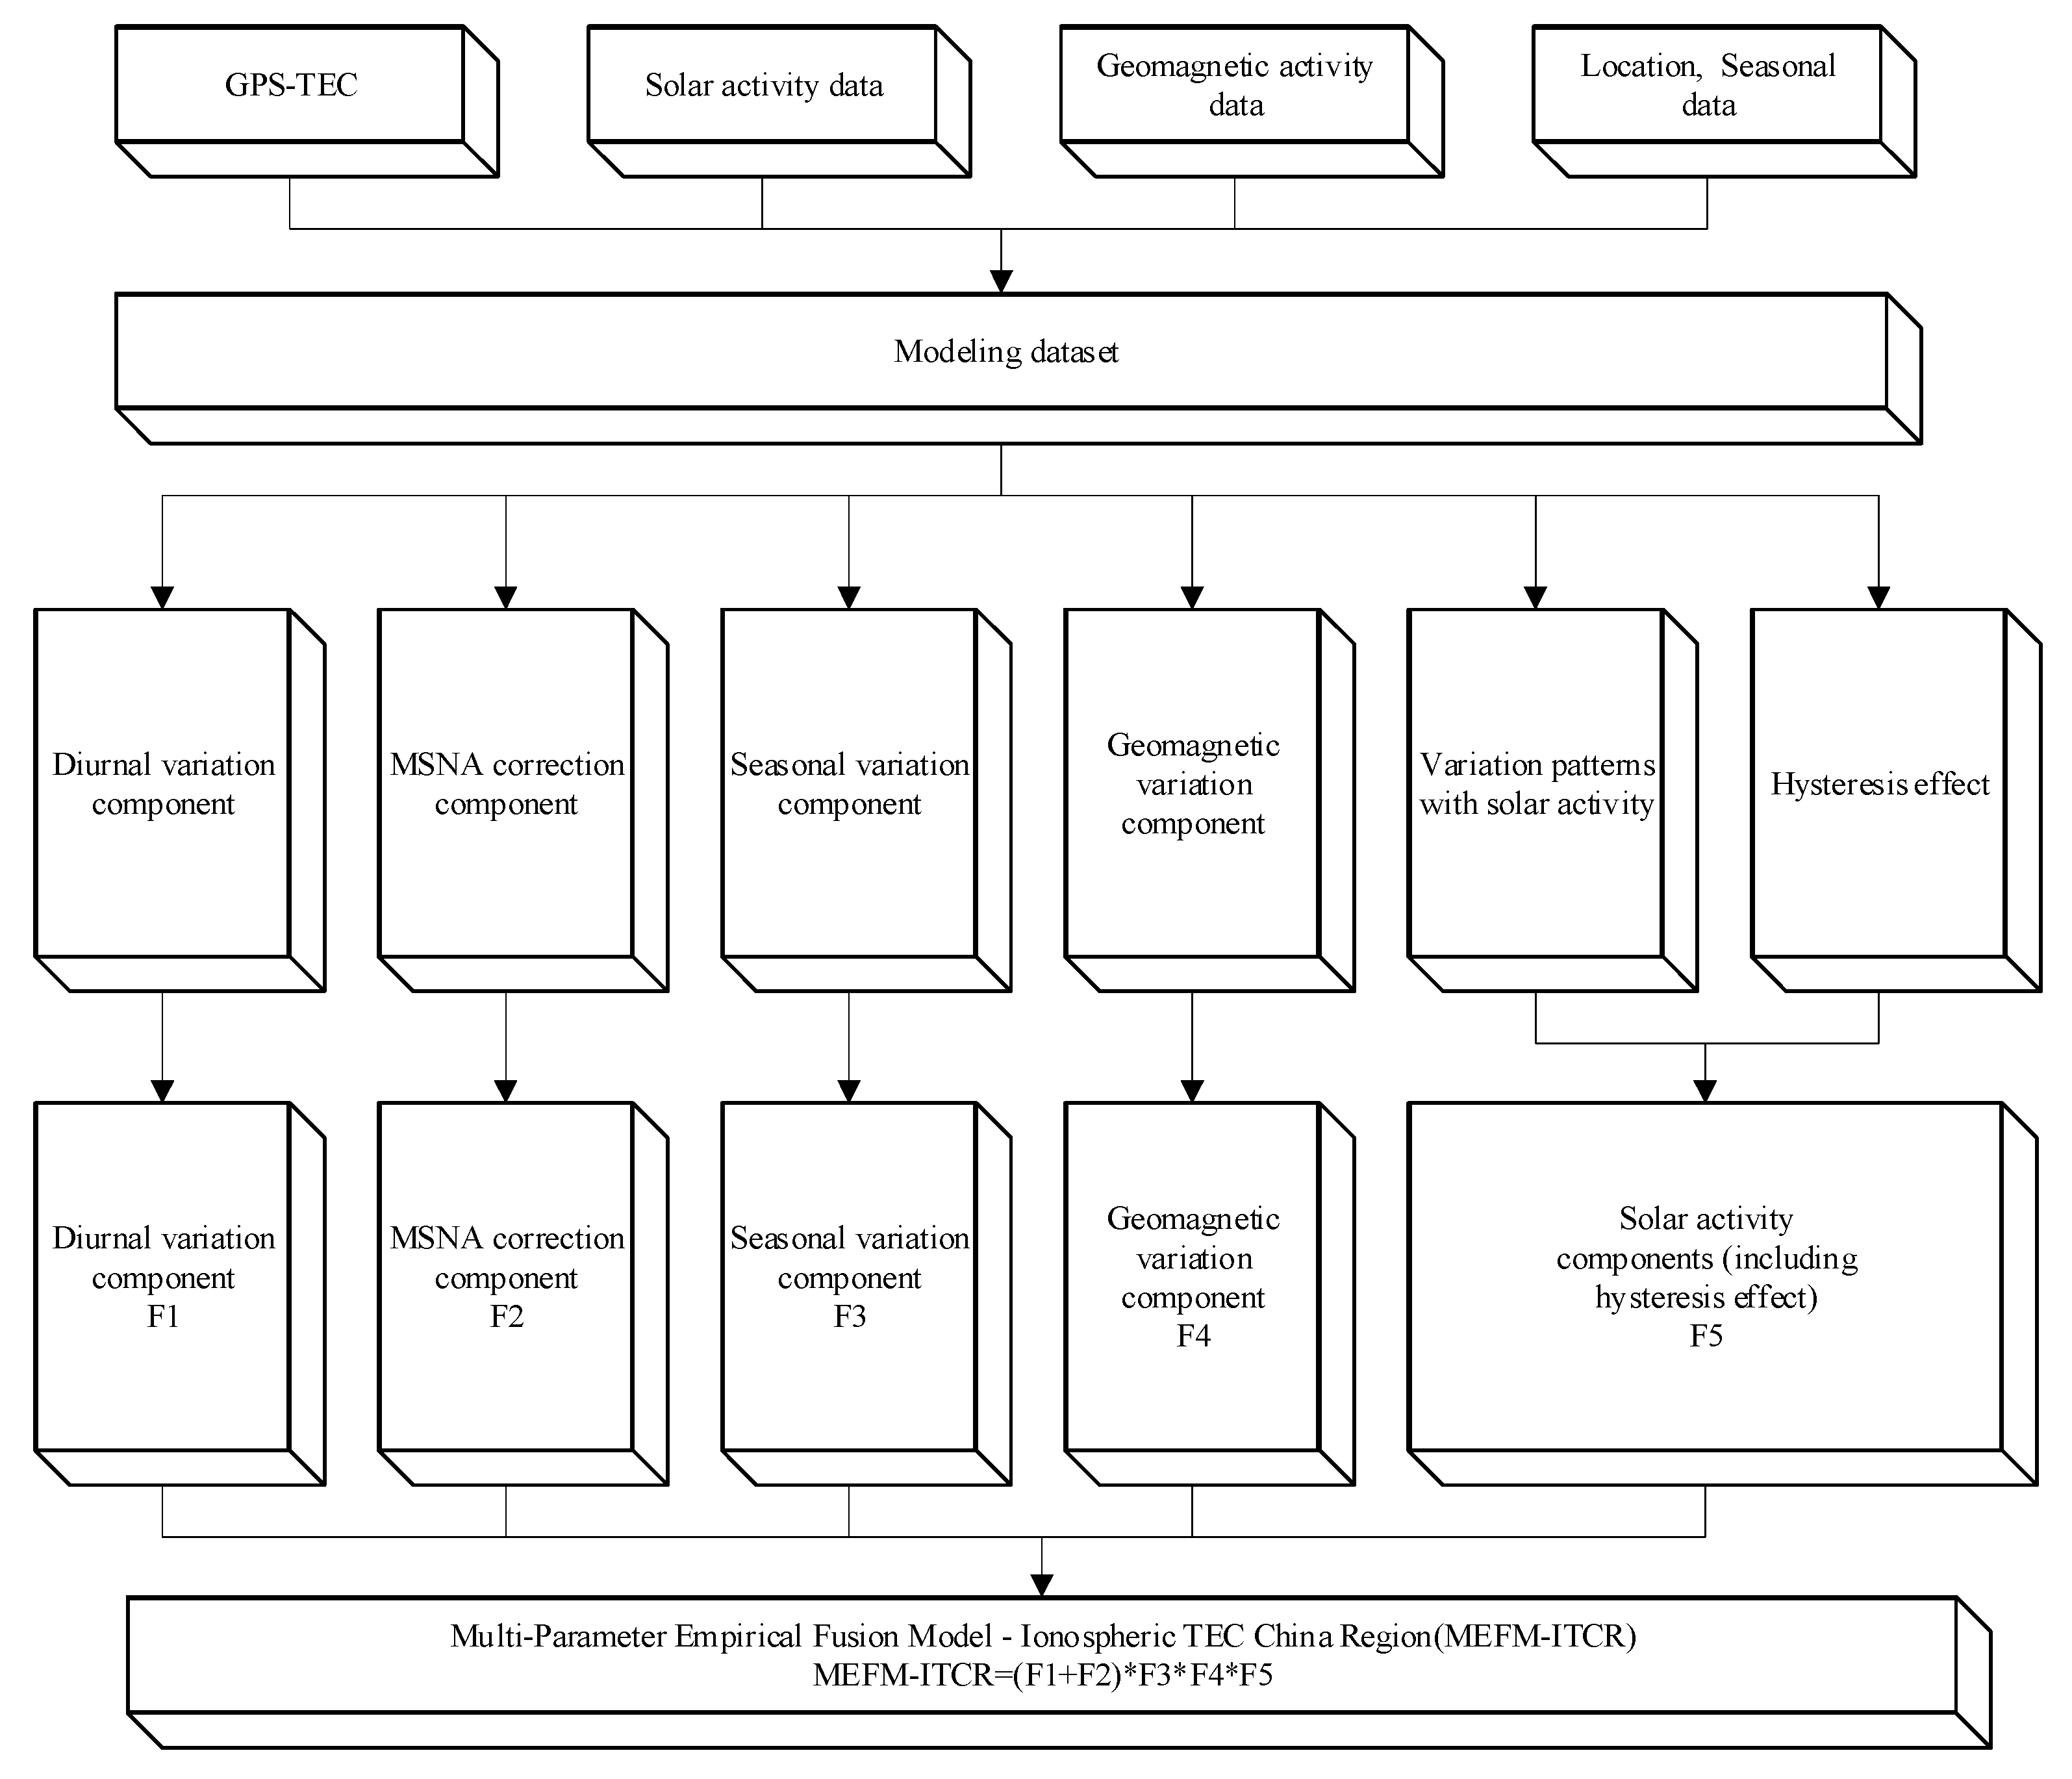
Figure 2.
Residual distribution histogram of the MEFM-ITCR model.

Figure 3.
(a) Distribution map of the observation stations used for modeling; Spatial variation of RMSE values between observed and estimated TEC values at Chinese GPS stations. (b) MEFM-ITCR model; (c) IRI2020 model; (d) NeQuick2 model.
Figure 3.
(a) Distribution map of the observation stations used for modeling; Spatial variation of RMSE values between observed and estimated TEC values at Chinese GPS stations. (b) MEFM-ITCR model; (c) IRI2020 model; (d) NeQuick2 model.
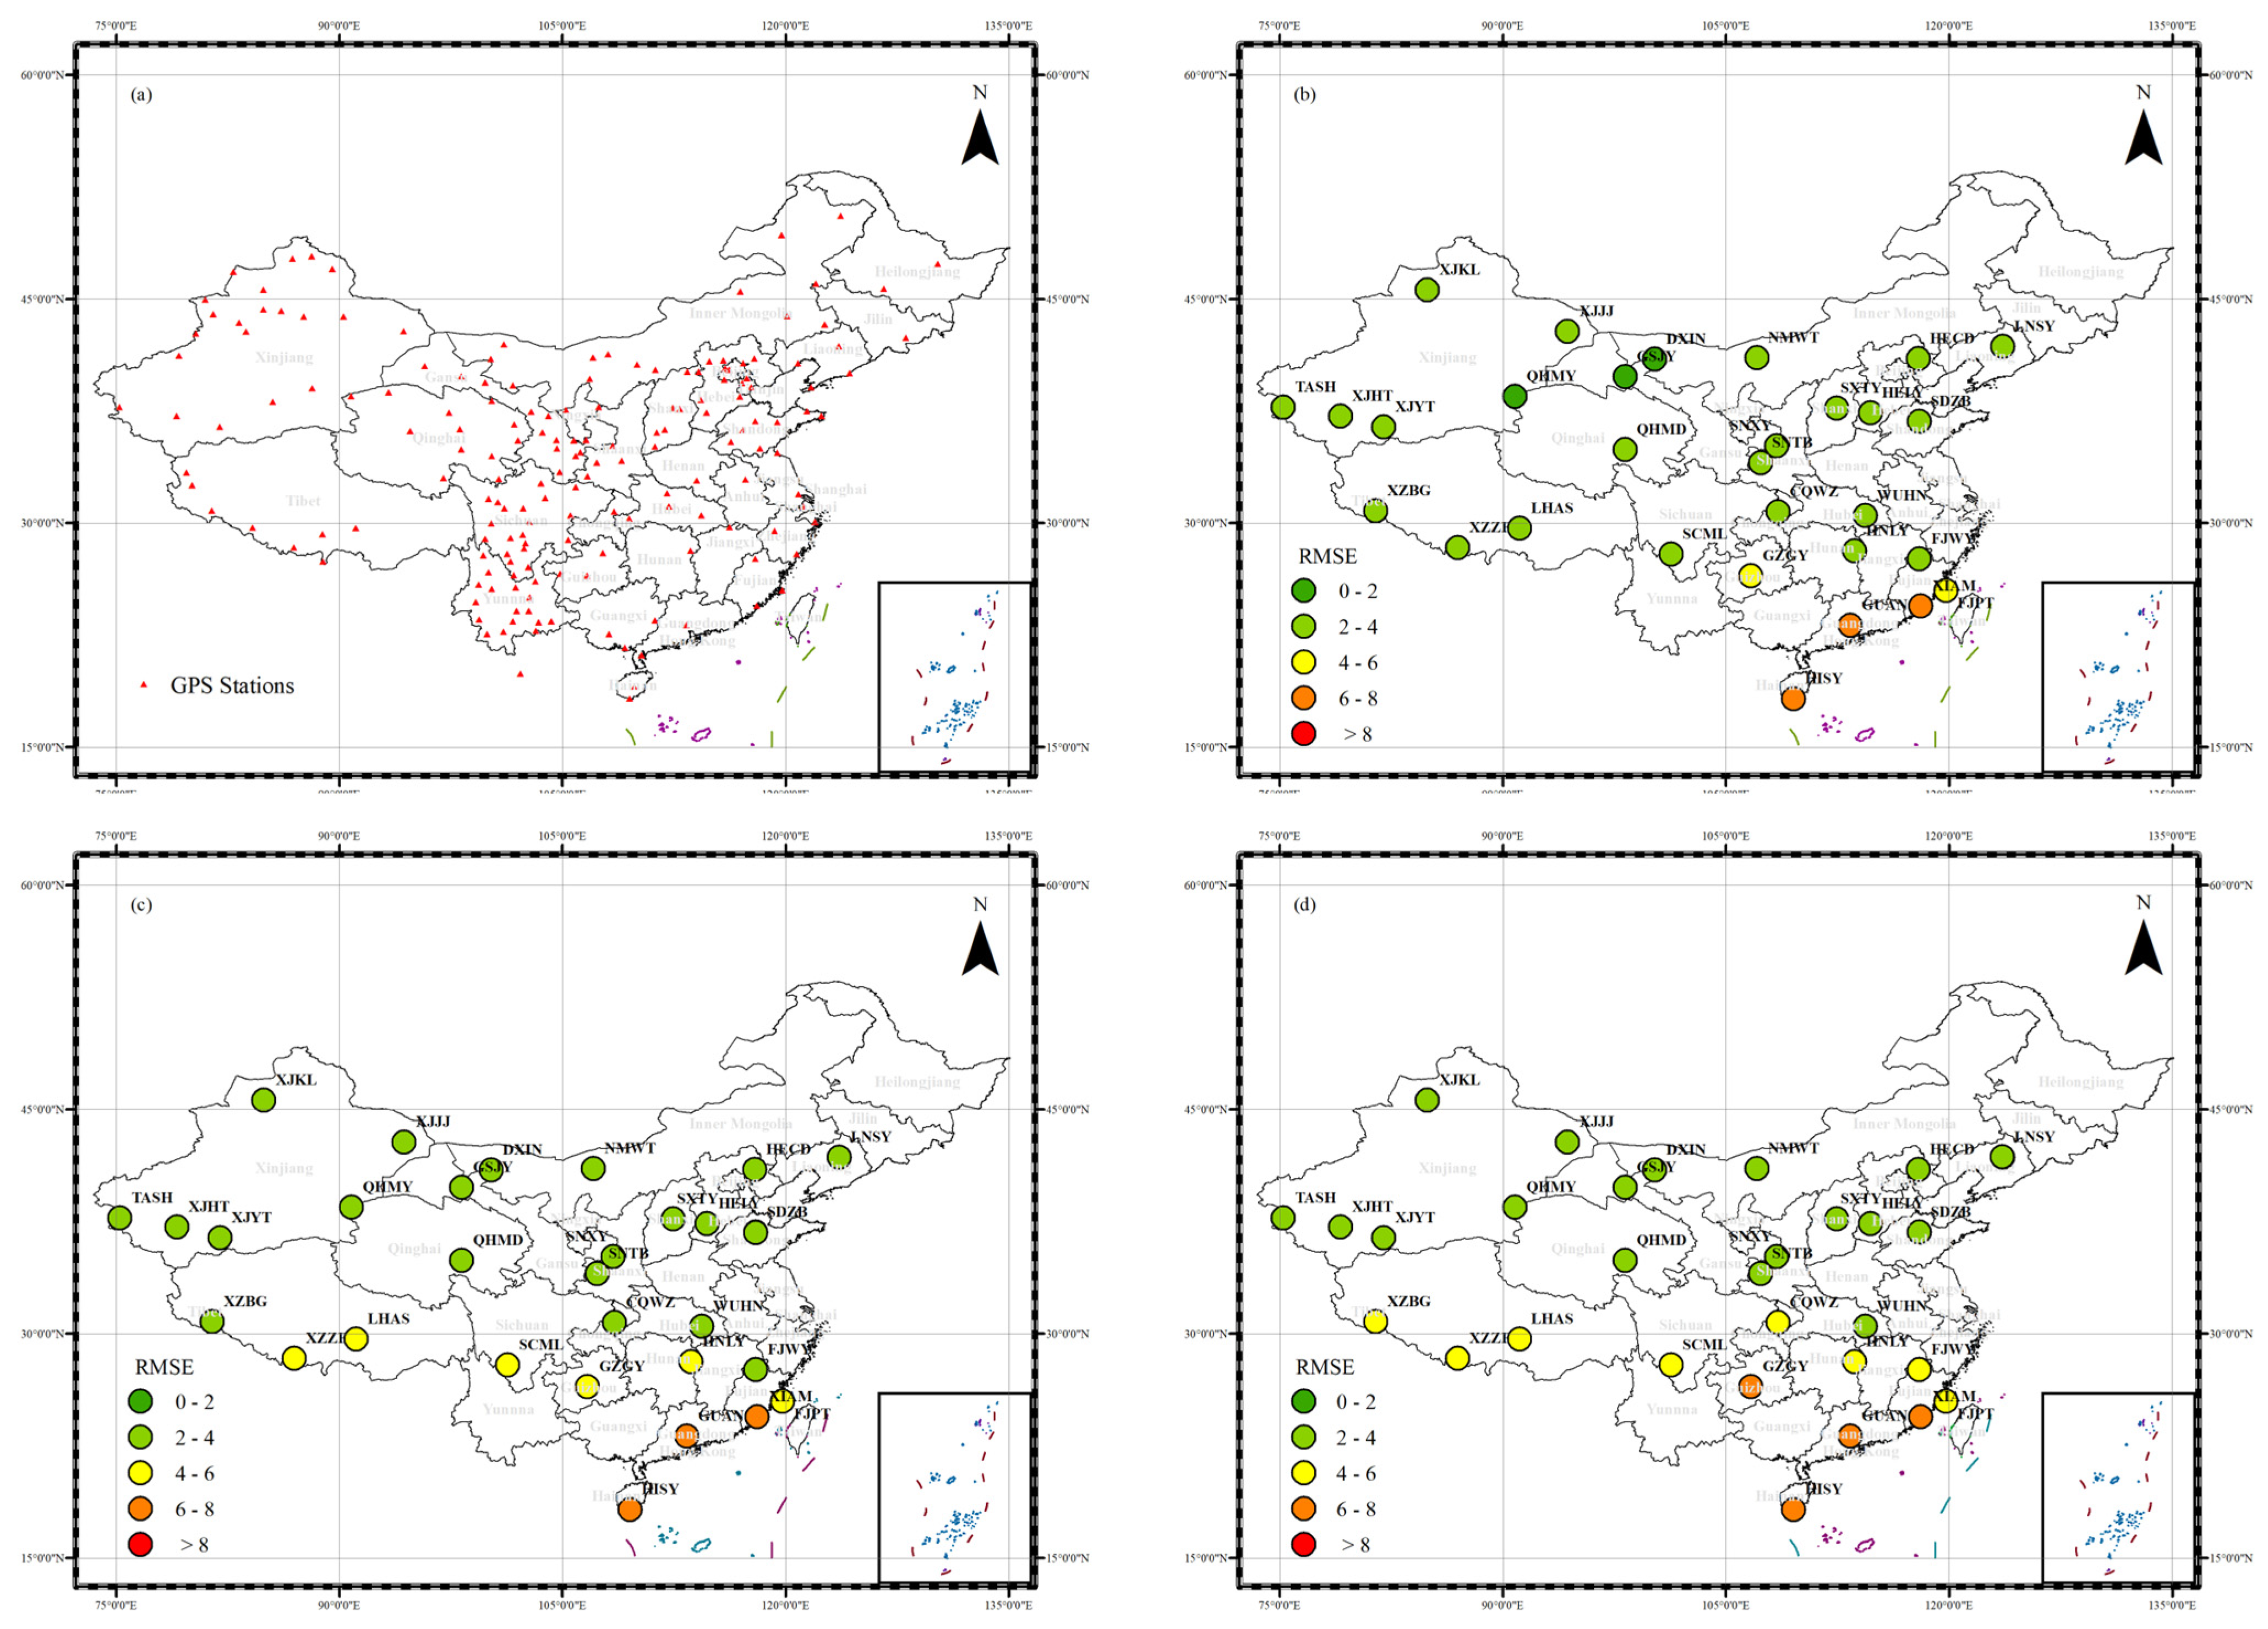
Figure 4.
Comparison of observed TEC at test stations with the fit results from MEFM-ITCR, IRI2020, and NeQuick2 models. Stations are arranged from left to right in descending order of latitude.
Figure 4.
Comparison of observed TEC at test stations with the fit results from MEFM-ITCR, IRI2020, and NeQuick2 models. Stations are arranged from left to right in descending order of latitude.
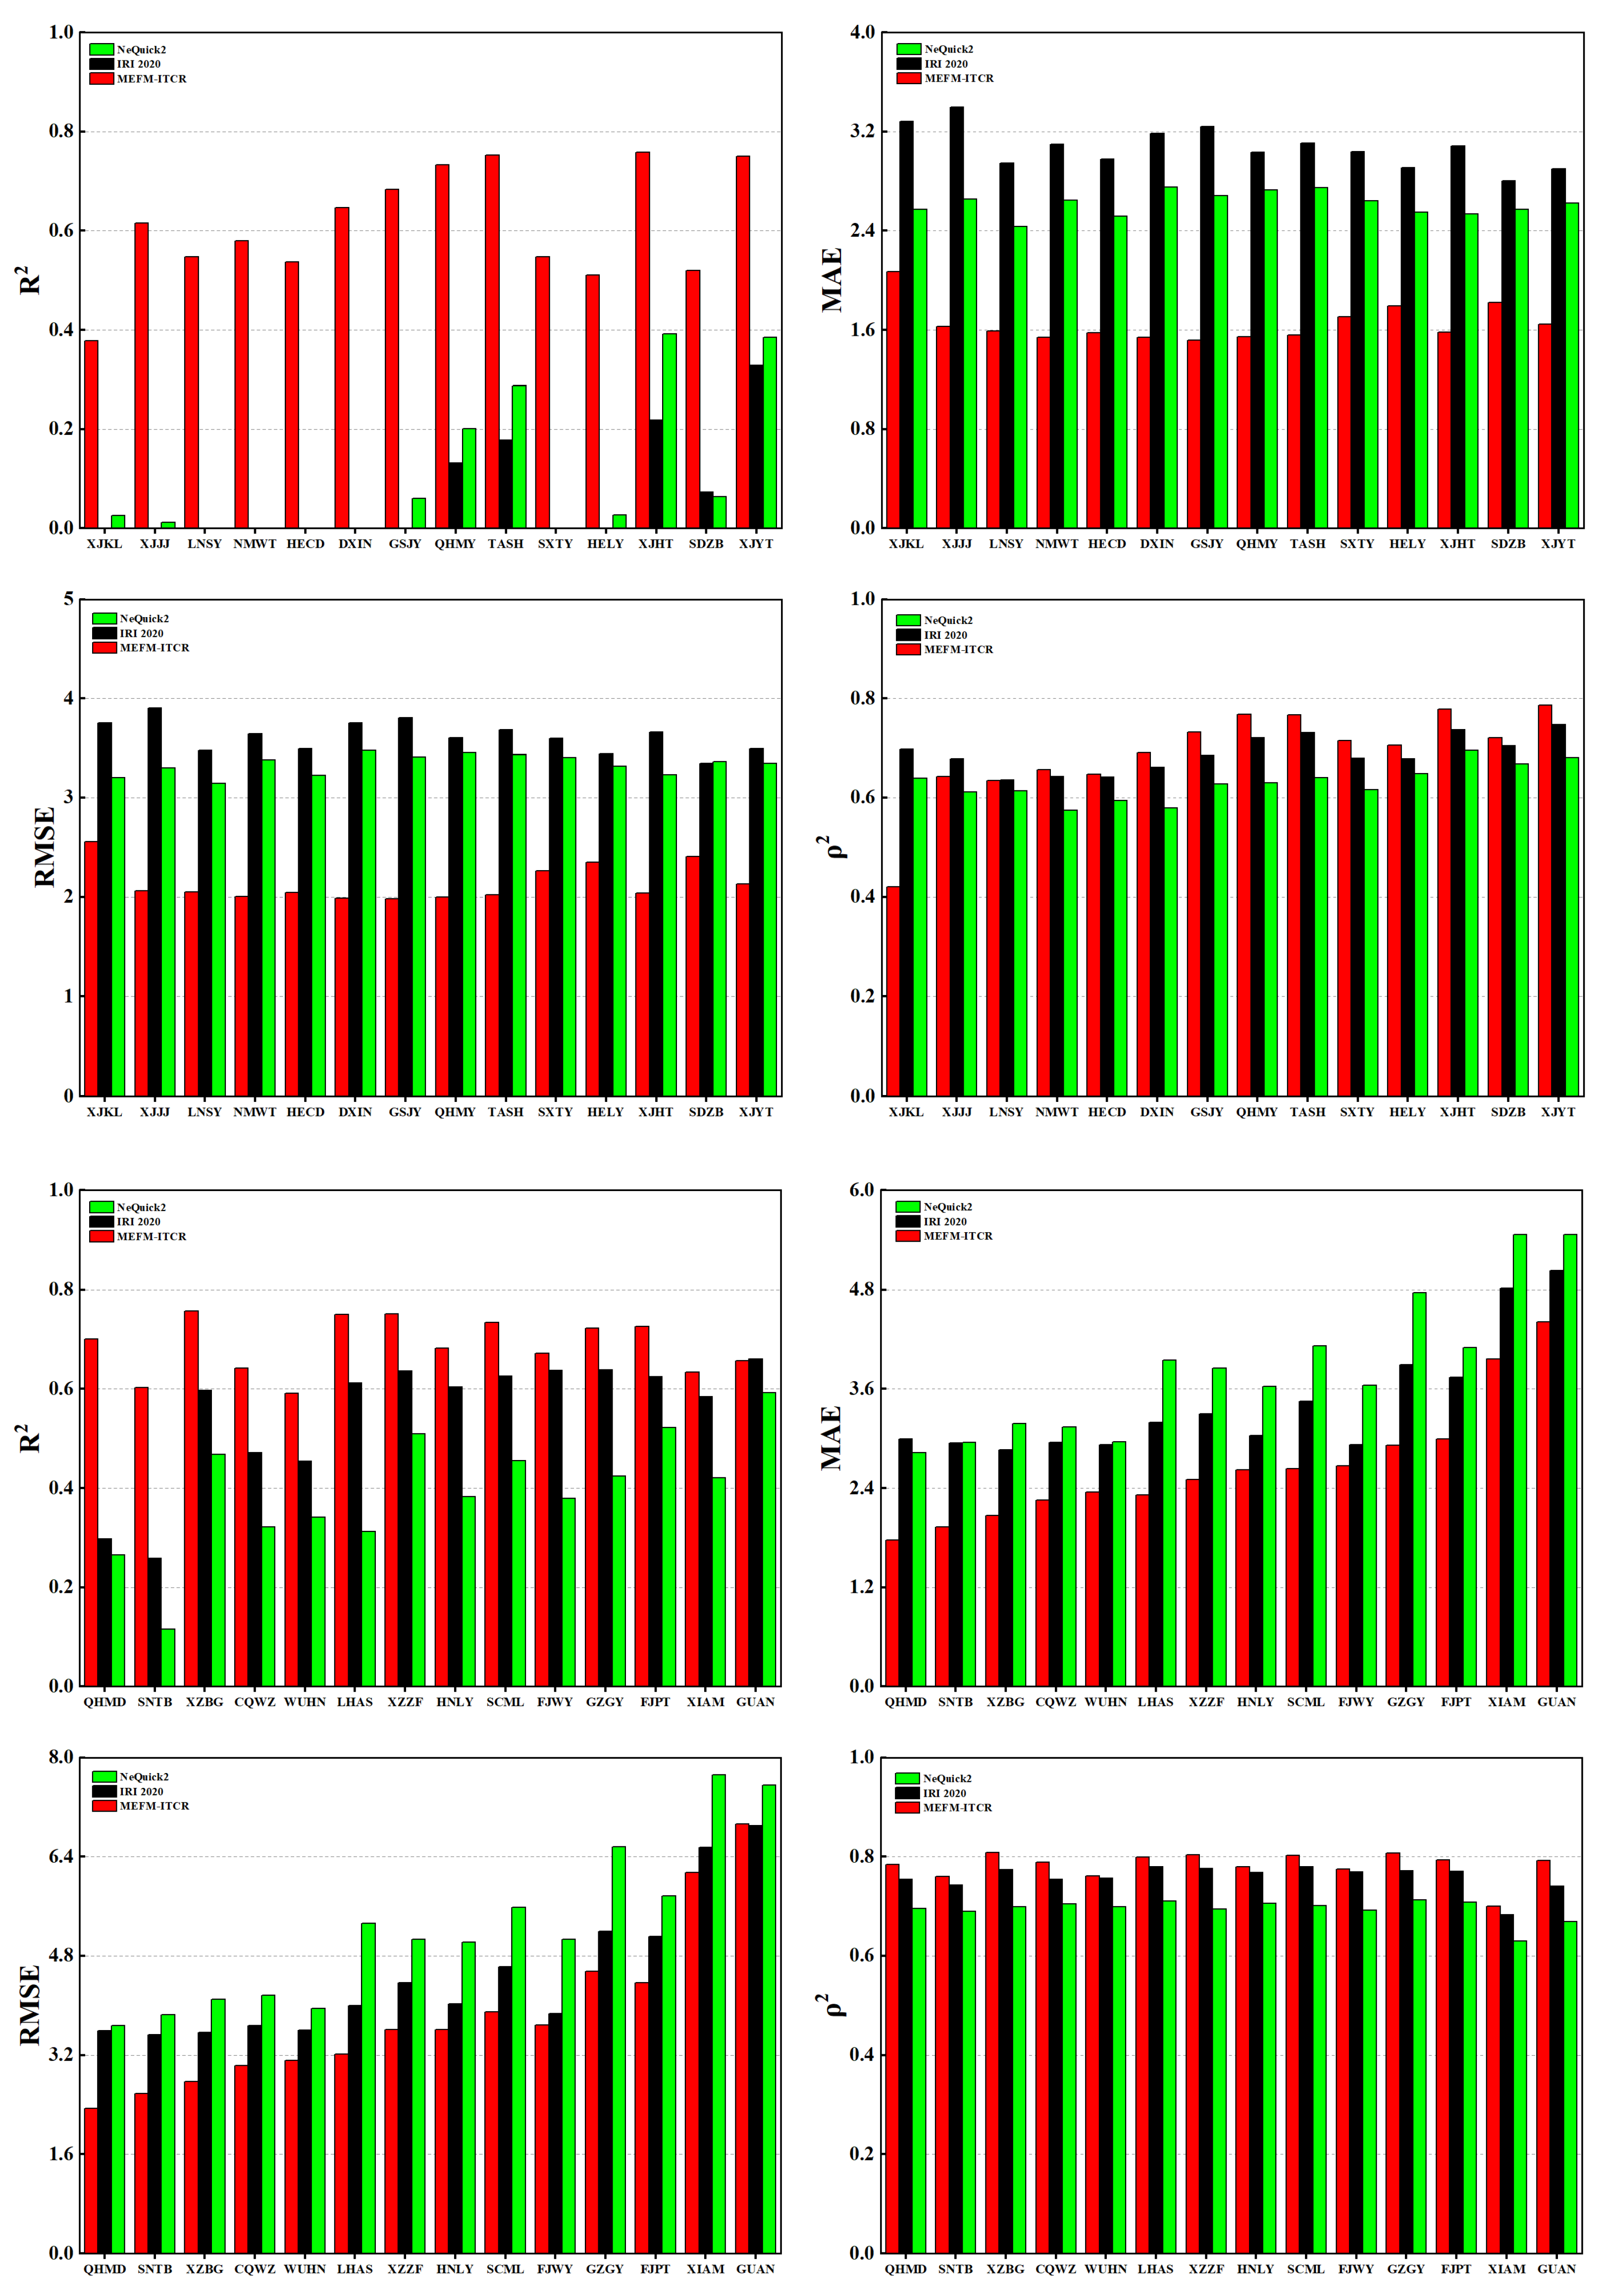
Figure 5.
The seasonal variations in R2 (top left), MAE (top right), RMSE (bottom left), and ρ2 (bottom right) values for the TEC measurements and predictions made using the MEFM-ITCR, IRI2020, and NeQuick2 models. MAE denotes the Mean Absolute Error; RMSE stands for Root Mean Square Error; TEC represents Total Electron Content.
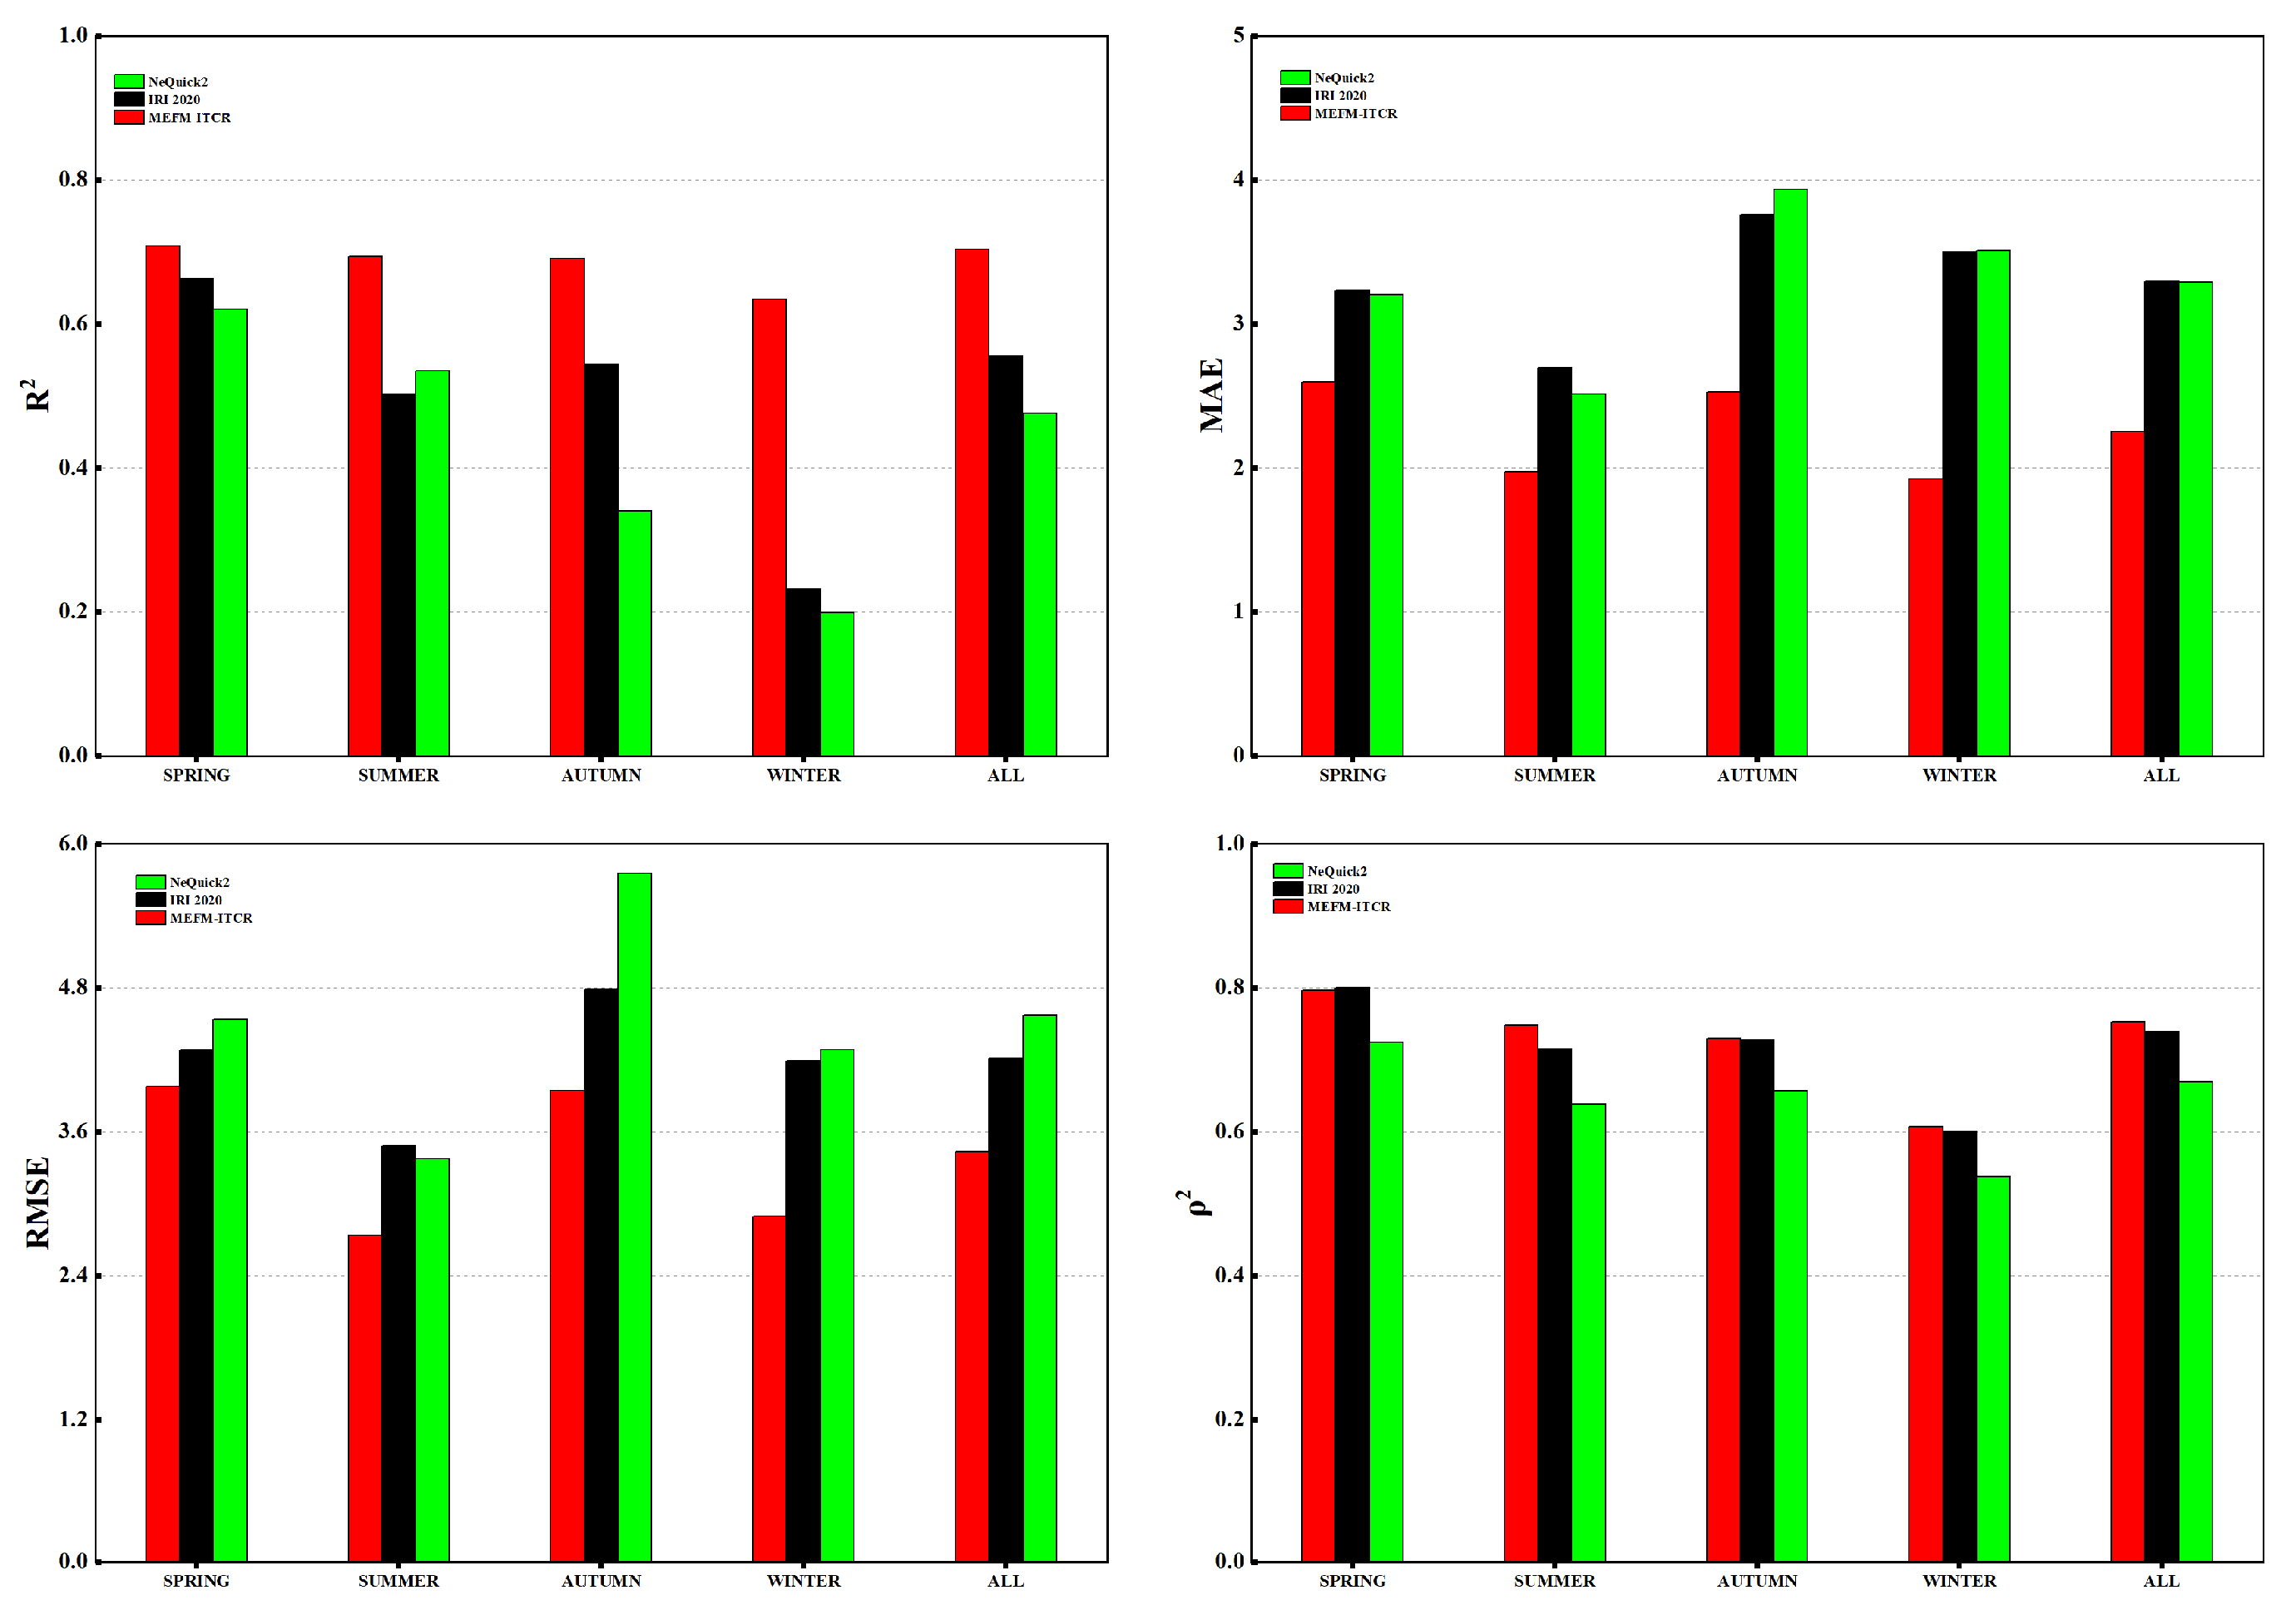
Figure 6.
Comparative analysis of the TEC prediction capabilities of the MEFM-ITCR, IRI2020, and NeQuick2 models is presented, focusing on emblematic dates from each season: 19 March for spring, 19 June for summer, 19 September for autumn, and 19 December for winter.
Figure 6.
Comparative analysis of the TEC prediction capabilities of the MEFM-ITCR, IRI2020, and NeQuick2 models is presented, focusing on emblematic dates from each season: 19 March for spring, 19 June for summer, 19 September for autumn, and 19 December for winter.
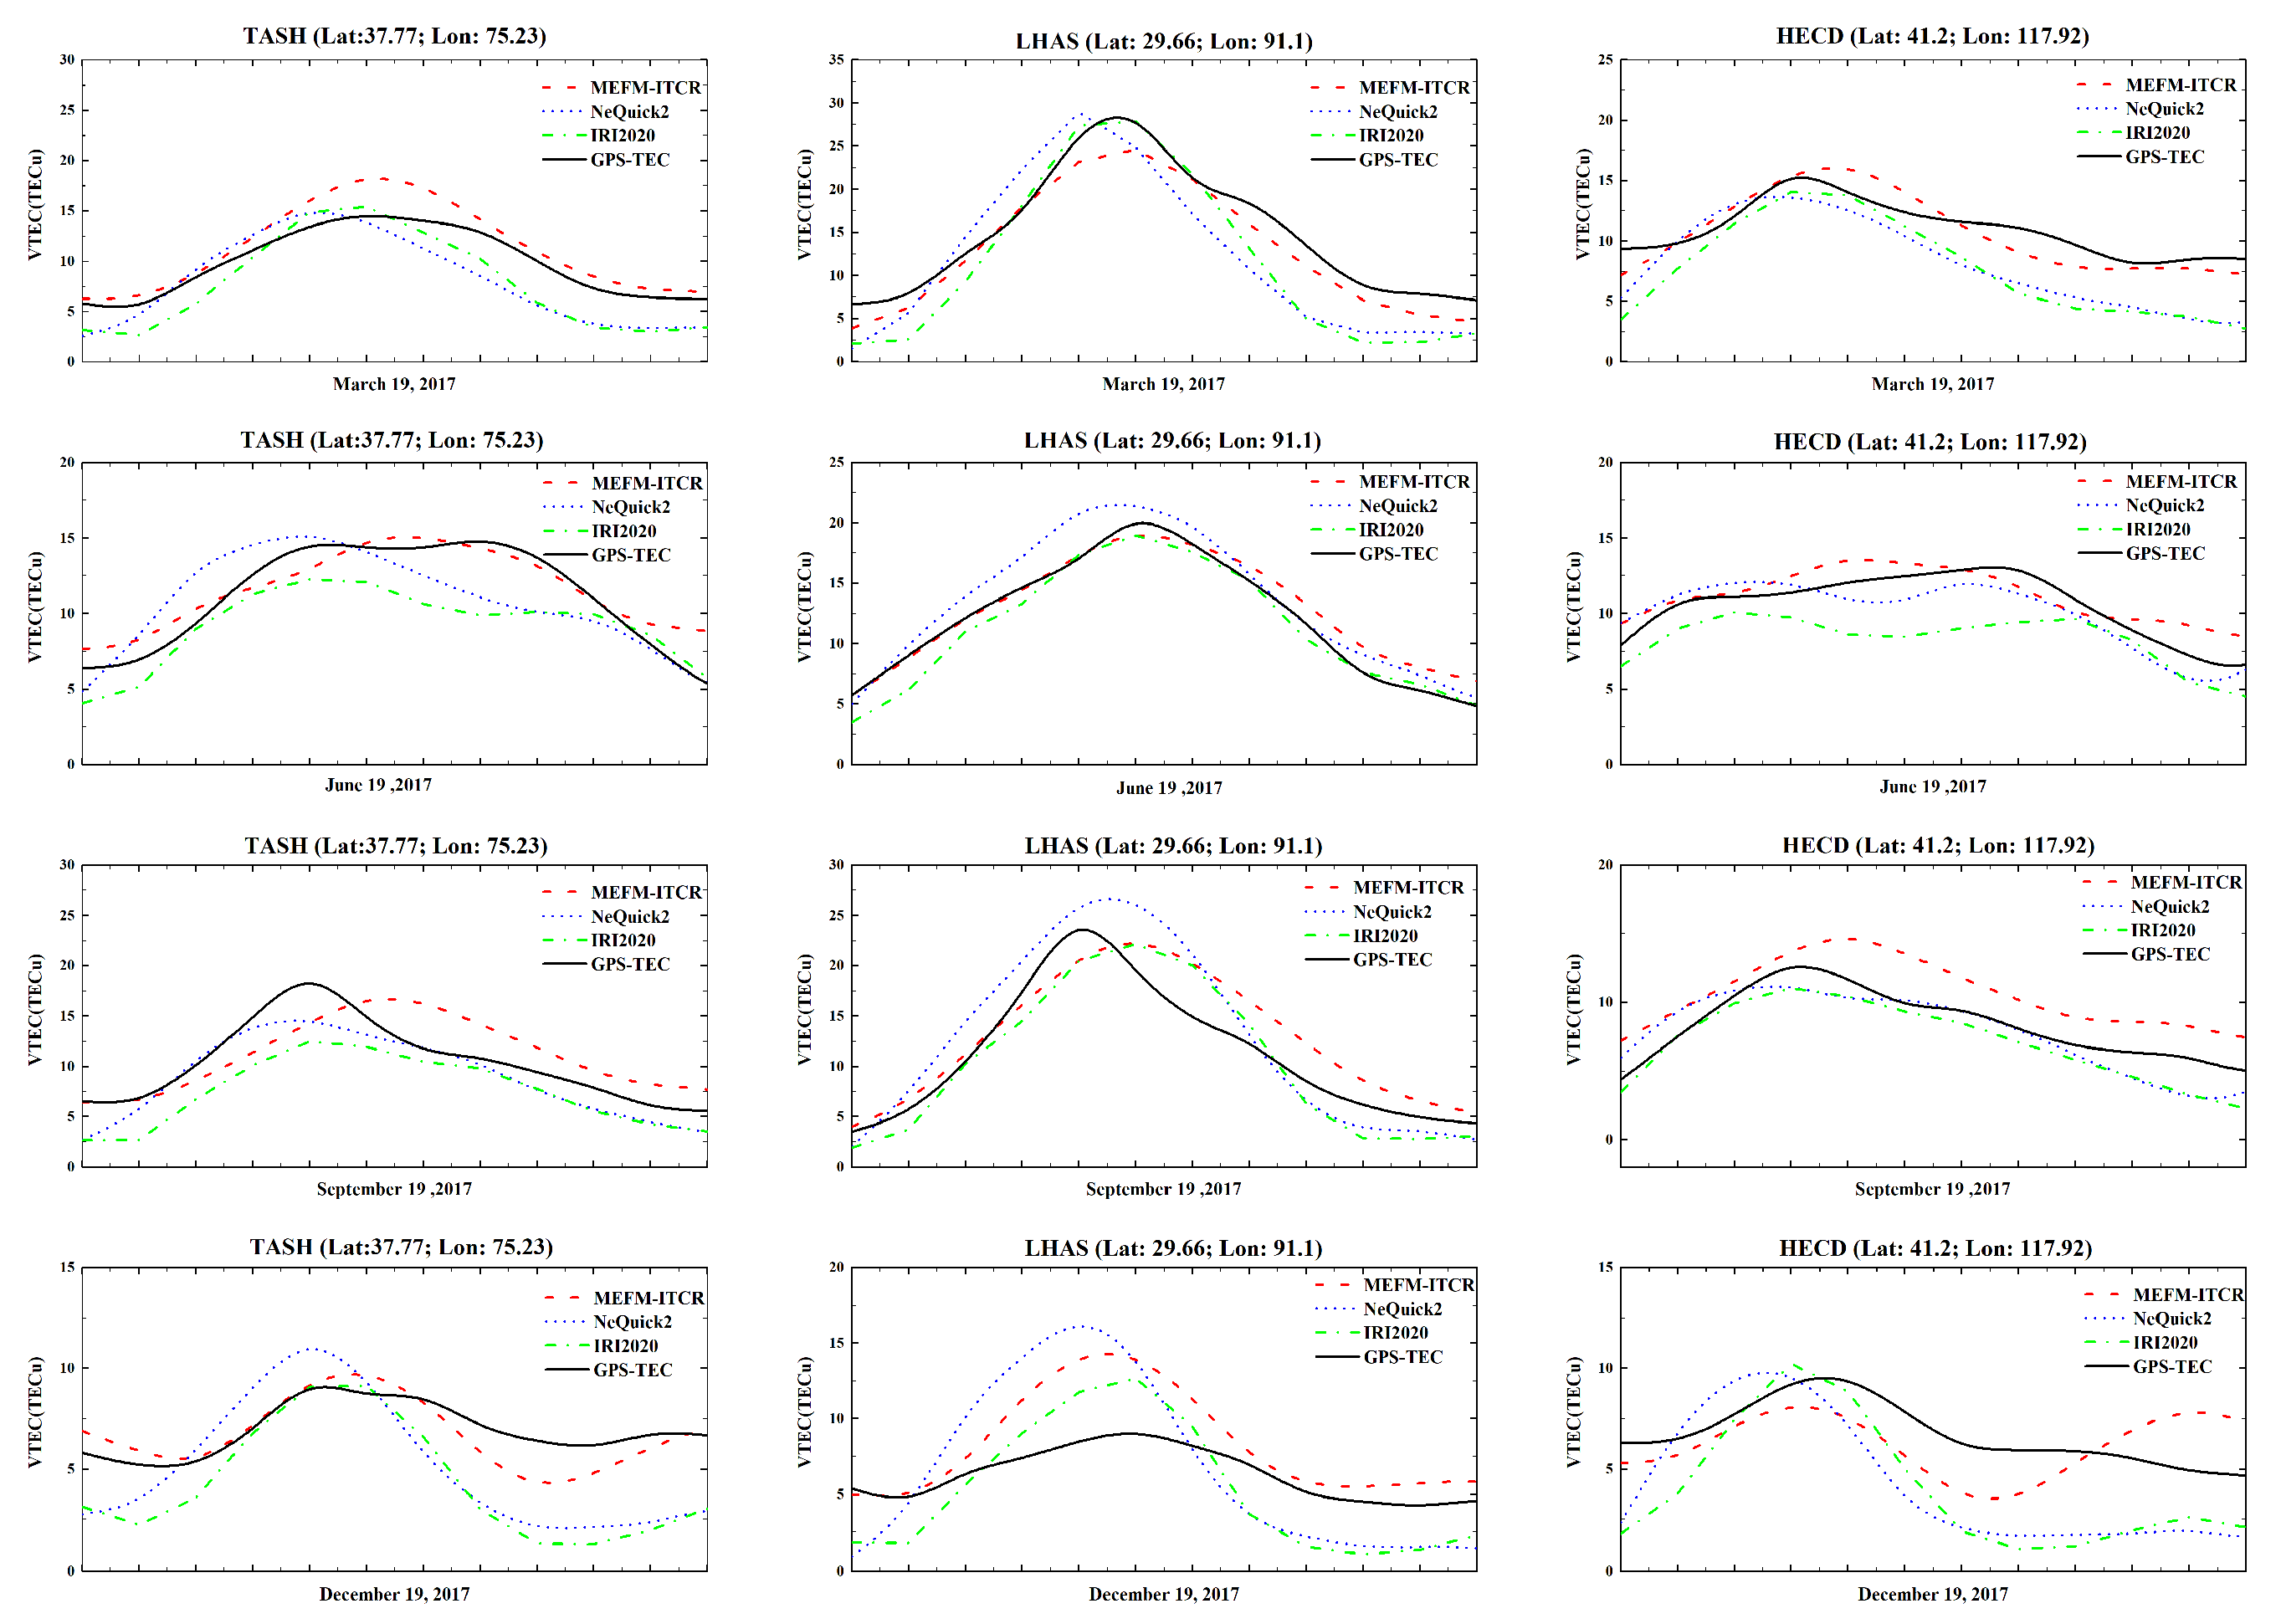
Figure 7.
Bar graphs of R2 (bottom left), MAE (top right), RMSE (bottom right), and ρ2 (top left) illustrate the disparity between the TEC values measured by GPS and the predicted values under various solar and geomagnetic activity levels in 2017. MAE stands for Mean Absolute Error; RMSE represents Root Mean Square Error; and TEC denotes Total Electron Content.
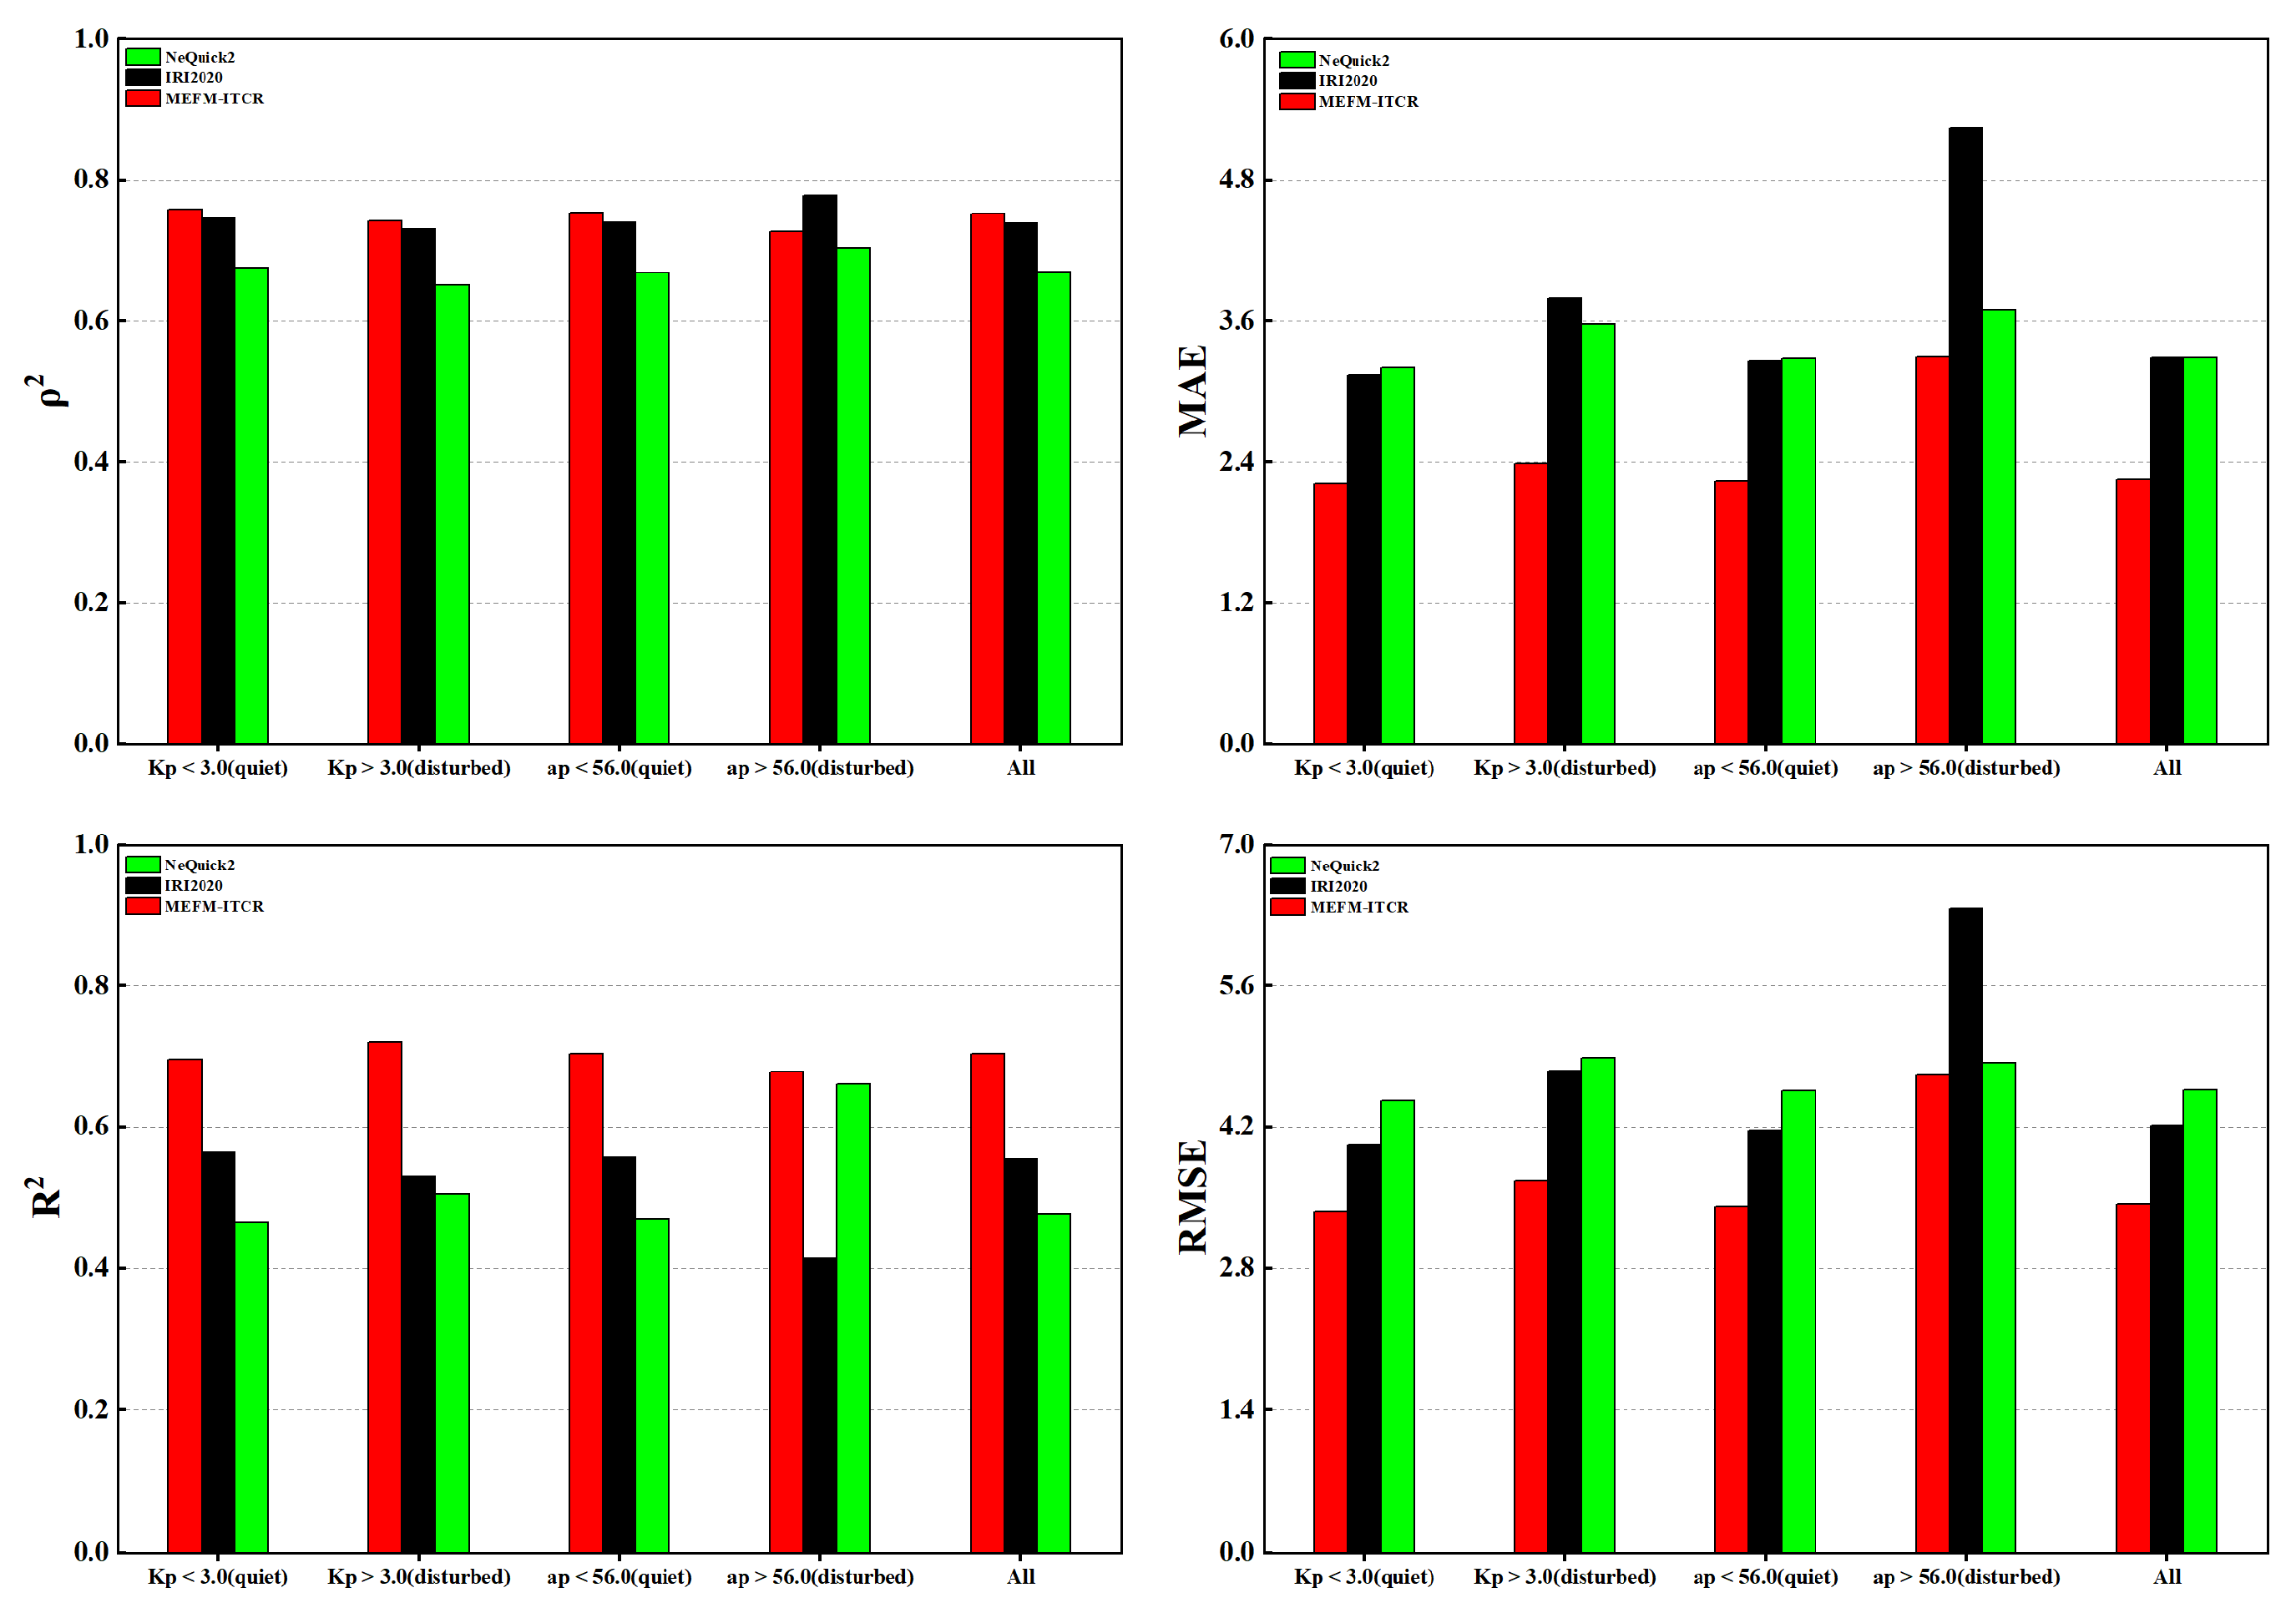
Figure 8.
Comparison of regional model accuracy.
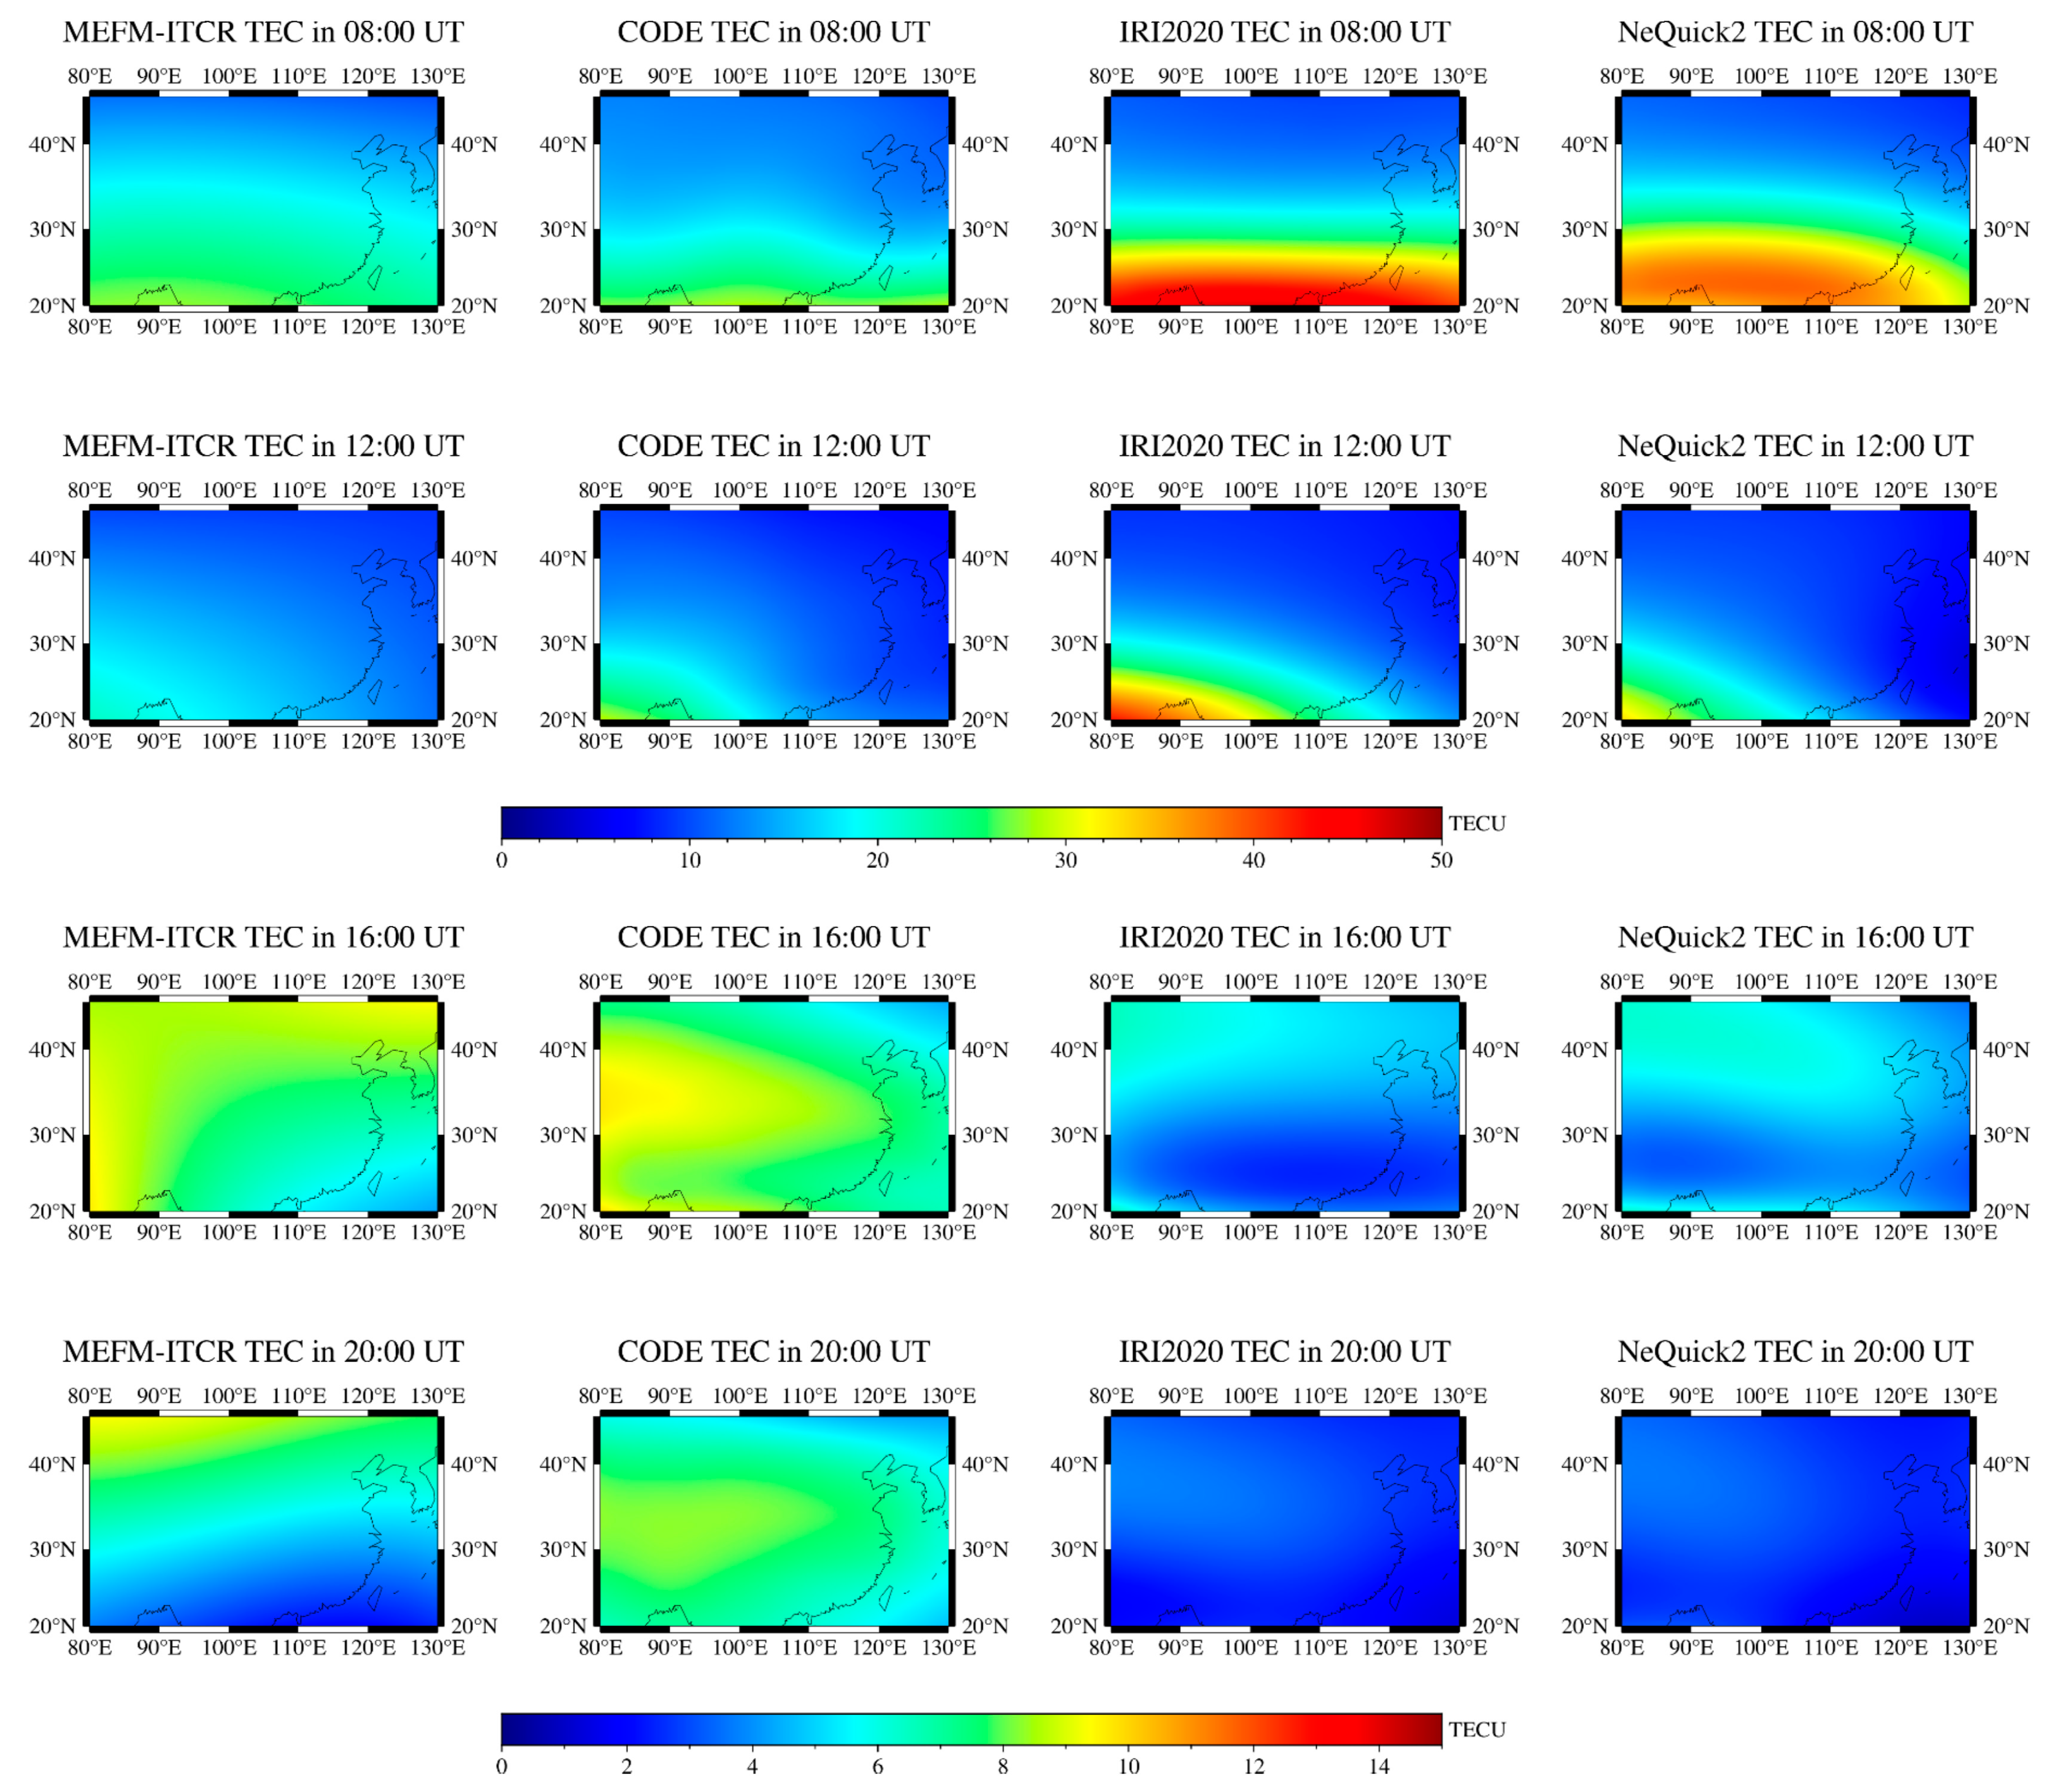
Table 1.
Station information table.
| Station Code | Province (City) | Geographic Latitude | Geographic Longitude | |
|---|---|---|---|---|
| High latitude | XJKL | Xinjiang | 45.61°N | 84.91°E |
| XJJJ | Xinjiang | 42.85°N | 94.34°E | |
| LNSY | Liaoning | 41.83°N | 123.58°E | |
| NMWT | Mongolia | 41.08°N | 107.06°E | |
| HECD | Hebei | 41.02°N | 117.92°E | |
| DXIN | Mongolia | 40.98°N | 100.20°E | |
| Middle latitude | GSJY | Gansu | 39.81°N | 98.22°E |
| QHMY | Qinghai | 38.48°N | 90.80°E | |
| TASH | Xinjiang | 37.77°N | 75.23°E | |
| SXTY | Shanxi | 37.71°N | 112.43°E | |
| HELY | Hebei | 37.40°N | 114.71°E | |
| XJHT | Xinjiang | 37.16°N | 79.05°E | |
| SDZB | Shandong | 36.81°N | 117.99°E | |
| XJYT | Xinjiang | 36.43°N | 81.97°E | |
| SNXY | Shaanxi | 35.17°N | 108.39°E | |
| QHMD | Qinghai | 34.92°N | 98.21°E | |
| SNTB | Shaanxi | 34.06°N | 107.32°E | |
| XZBG | Tibet | 30.84°N | 81.43°E | |
| CQWZ | Chongqing | 30.77°N | 108.49°E | |
| WUHN | Hubei | 30.53°N | 114.36°E | |
| Low latitude | LHAS | Tibet | 29.66°N | 91.10°E |
| XZZF | Tibet | 28.36°N | 86.94°E | |
| HNLY | Hunan | 28.16°N | 113.63°E | |
| SCML | Sichuan | 27.93°N | 101.28°E | |
| FJWY | Fujian | 27.62°N | 117.99°E | |
| GZGY | Guizhou | 26.47°N | 106.67°E | |
| FJPT | Fujian | 25.50°N | 119.77°E | |
| XIAM | Fujian | 24.45°N | 118.08°E | |
| GUAN | Guangdong | 23.18°N | 113.34°E | |
| HISY | Hainan | 18.24°N | 109.53°E |
Table 2.
Overall model performance evaluation.
| Models | R2 | MAE | RMSE | ρ2 |
|---|---|---|---|---|
| MEFM-ITCR | 0.7036 | 2.2530 | 3.4353 | 0.7525 |
| IRI2020 | 0.5545 | 3.2951 | 4.2121 | 0.7383 |
| NeQuick2 | 0.4762 | 3.2887 | 4.5670 | 0.6694 |
Table 3.
The performance metrics of each model throughout the different seasons.
| Season | Models | R2 | MAE | RMSE | ρ2 |
|---|---|---|---|---|---|
| Spring | MEFM-ITCR | 0.7085 | 3.9751 | 2.5946 | 0.7961 |
| IRI2020 | 0.6620 | 4.2803 | 3.2306 | 0.8002 | |
| NeQuick2 | 0.6203 | 4.5367 | 3.2034 | 0.7243 | |
| Summer | MEFM-ITCR | 0.6937 | 2.7356 | 1.9719 | 0.7474 |
| IRI2020 | 0.5028 | 3.4853 | 2.6955 | 0.7150 | |
| NeQuick2 | 0.5342 | 3.3735 | 2.5148 | 0.6380 | |
| Autumn | MEFM-ITCR | 0.6904 | 3.9412 | 2.5241 | 0.7297 |
| IRI2020 | 0.5432 | 4.7871 | 3.7571 | 0.7280 | |
| NeQuick2 | 0.3398 | 5.7553 | 3.9322 | 0.6568 | |
| Winter | MEFM-ITCR | 0.6338 | 2.8959 | 1.9221 | 0.6067 |
| IRI2020 | 0.2323 | 4.1931 | 3.4990 | 0.6004 | |
| NeQuick2 | 0.1991 | 4.2829 | 3.5071 | 0.5371 |
Table 4.
Comparison of the performance of each model under different solar and geomagnetic activity levels.
Table 4.
Comparison of the performance of each model under different solar and geomagnetic activity levels.
| Season | Models | R2 | MAE | RMSE | ρ2 |
|---|---|---|---|---|---|
| KP < 3 | MEFM-ITCR | 0.6960 | 3.3601 | 2.2116 | 0.7588 |
| IRI2020 | 0.5637 | 4.0253 | 3.1379 | 0.7453 | |
| NeQuick2 | 0.4637 | 4.4628 | 3.1997 | 0.6759 | |
| KP > 3 | MEFM-ITCR | 0.7209 | 3.6645 | 2.3849 | 0.7418 |
| IRI2020 | 0.5293 | 4.7586 | 3.7958 | 0.7302 | |
| NeQuick2 | 0.5042 | 4.8842 | 3.5722 | 0.6514 | |
| AP < 56 | MEFM-ITCR | 0.7036 | 3.4095 | 2.2353 | 0.7541 |
| IRI2020 | 0.5575 | 4.1659 | 3.2621 | 0.7394 | |
| NeQuick2 | 0.4693 | 4.5622 | 3.2819 | 0.6687 | |
| AP > 56 | MEFM-ITCR | 0.6788 | 4.7122 | 3.3004 | 0.7278 |
| IRI2020 | 0.4133 | 6.3687 | 5.2429 | 0.7784 | |
| NeQuick2 | 0.6612 | 4.8401 | 3.6925 | 0.7033 | |
| ALL | MEFM-ITCR | 0.7036 | 3.4353 | 2.2530 | 0.7525 |
| IRI2020 | 0.5545 | 4.2121 | 3.2951 | 0.7383 | |
| NeQuick2 | 0.4762 | 4.5670 | 3.2887 | 0.6694 |
Disclaimer/Publisher’s Note: The statements, opinions and data contained in all publications are solely those of the individual author(s) and contributor(s) and not of MDPI and/or the editor(s). MDPI and/or the editor(s) disclaim responsibility for any injury to people or property resulting from any ideas, methods, instructions or products referred to in the content. |
© 2023 by the authors. Licensee MDPI, Basel, Switzerland. This article is an open access article distributed under the terms and conditions of the Creative Commons Attribution (CC BY) license (https://creativecommons.org/licenses/by/4.0/).
Share and Cite
MDPI and ACS Style
Chen, J.; Xiong, P.; Wu, H.; Zhang, X.; Feng, J.; Zhang, T. A Multi-Parameter Empirical Fusion Model for Ionospheric TEC in China’s Region. Remote Sens. 2023, 15, 5445. https://doi.org/10.3390/rs15235445
AMA Style
Chen J, Xiong P, Wu H, Zhang X, Feng J, Zhang T. A Multi-Parameter Empirical Fusion Model for Ionospheric TEC in China’s Region. Remote Sensing. 2023; 15(23):5445. https://doi.org/10.3390/rs15235445
Chicago/Turabian StyleChen, Jianghe, Pan Xiong, Haochen Wu, Xuemin Zhang, Jiandi Feng, and Ting Zhang. 2023. "A Multi-Parameter Empirical Fusion Model for Ionospheric TEC in China’s Region" Remote Sensing 15, no. 23: 5445. https://doi.org/10.3390/rs15235445
Note that from the first issue of 2016, this journal uses article numbers instead of page numbers. See further details here.