Article

NO2 Concentration Estimation at Urban Ground Level by Integrating Sentinel 5P Data and ERA5 Using Machine Learning: The Milan (Italy) Case Study

by
Jesus Rodrigo Cedeno Jimenez
* and
Maria Antonia Brovelli
Department of Civil and Environmental Engineering, Politecnico di Milano, Piazza Leonardo da Vinci 32, 20133 Milano, Italy
*
Author to whom correspondence should be addressed.
Remote Sens. 2023, 15(22), 5400; https://doi.org/10.3390/rs15225400
Submission received: 13 October 2023 / Revised: 9 November 2023 / Accepted: 15 November 2023 / Published: 17 November 2023
(This article belongs to the Special Issue Remote Sensing in Geomatics)

Abstract

:
The measurement of atmospheric NO 2 pollution concentrations has become a critical topic due to its impact on human health. Ground sensors are the most popular method for measuring atmospheric pollution, but they can be expensive to purchase, install, and maintain. In contrast, satellite technology offers global coverage but typically provides concentration estimates at the tropospheric level, not at the ground level where most human activities take place. This work presents a model that can be used to estimate NO 2 ground-level concentrations in metropolitan areas using Sentinel-5P satellite images and ERA5 meteorological data. The primary goal is to offer a cost-effective solution for Low- and Medium-Income Countries (LMICs) to assess air quality, thereby addressing the air quality measurement constraints. To validate the model’s accuracy, study points were selected in alignment with the Regional Agency for the Environment Protection (ARPA) NO 2 sensor network in the Metropolitan City of Milan. The results showed that the RMSE of the model estimations was significantly lower than the standard deviation of the real measurements. This work fills the gaps in the literature by providing an accurate estimation model of NO 2 in the Metropolitan City of Milan using both satellite data and ERA5 meteorological data. This work presents as an alternative to ground sensors by enabling more regions to assess their air quality effectively.

1. Introduction

Air quality deterioration represents a public health issue, particularly in relation to nitrogen dioxide (NO 2 ) [1]. As a matter of fact, 549,715 deaths attributed to urban NO 2 could have been prevented if the World Health Organization (WHO) NO 2 air quality guidelines had been followed [2]. As a response to tackle this and other global pressing challenges, the United Nations (UN) created the Sustainable Development Goals (SDGs). These provide a global unified agenda to address topics such as poverty, health, inequality, climate change, or environmental degradation. SDGs serve as a guide for governments, organizations, and individuals for collective action. Air quality is a factor that is directly mentioned in 2 out of the 17 SDGs. On the one hand, SDG 3.9—Good Health and Well-Being—targets the reduction of the number of deaths and illnesses from hazardous chemicals and air pollution. On the other hand, SDG 7—Affordable and Clean Energy—targets access to clean energy technology, which would have an impact on emissions produced by vehicles and as a consequence reduce NO 2 [3,4].
To reduce the impact that NO 2 has on human health, the WHO established a set of Air Quality Guidelines (AQGs). According to their latest update (2021), NO 2 atmospheric concentration must not surpass 200 μ g/m 3 per hour, 25 μ g/m 3 per 24 h period, and 10 μ g/m 3 per calendar year [5]. It is relevant for governments, organizations, and individuals to follow these guidelines because surpassing the recommended threshold can have a negative impact on the population’s health. According to a study developed by the Bradford Institute for Health Research, UK, NO 2 exposure has an immediate negative impact on the urban population. It has been demonstrated that an increase of 10 μ g/m 3 in the NO 2 24 h period WHO threshold caused an immediate relative risk of patients that visited either general practice or emergency services (Figure 1) [1]. This indicates that constant NO 2 monitoring in urban areas is necessary to take measures that have instant negative effects on the population’s health.
In most cases, governments standardize the way in which measurements have to be retrieved, providing guidelines that ensure their homogeneity, accuracy, and veracity of them. Such is the case of the United States Environmental Protection Agency (US EPA) or the European Environment Agency (EEA). The NO 2 measurement method established by these institutions is the use of direct analysers (e.g., BS EN 14211: Ambient air—Standard method for the measurement of the concentration of nitrogen dioxide and nitrogen monoxide by chemiluminescence). These analysers are used to sample directly air from points of interest, and then the volume of NO 2 is measured [6]. This methodology hinders the possibility of atmospheric NO 2 measurements in Low- and Medium-Income Countries (LMICs). As mentioned by Pinder et al., millions of dollars in investments are needed to establish, operate, and maintain ground monitoring stations [7].
As an alternative to installing and managing ground stations, space agencies like the National Aeronautics and Space Administration (NASA) and the European Space Agency (ESA), have independently developed satellite technology to measure atmospheric pollution. On the one hand, the Ozone Measurement Instrument (OMI) from the Aura NASA satellite is capable of measuring NO 2 atmospheric concentration at a resolution of 13 km × 24 km [8]. On the other hand, the TROPOspheric Measurement Instrument, developed for the Sentinel-5P satellite from the ESA’s Copernicus program, is designed to measure the NO 2 tropospheric column with a resolution of 3.5 km × 5 km [9].
There are some drawbacks when measuring atmospheric pollution by using satellite technology. The first is the level of measurement. For instance, OMI NO 2 concentrations are measured at an atmospheric level (air column of approximately 100 km from the ground), and for TROPOMI at a tropospheric level (between 8 km and 14 km air column height) [10,11]. These two do not necessarily represent the reality of NO 2 concentration at ground level, where human activities take place [12]. The second is regarding the method by which NO 2 concentrations are retrieved. Given that satellite measurements are a hyperspectral image, nitrogen dioxide estimations are delivered as the Tropospheric Vertical Column Density (TVCD) [13]. Usually, passing from a TVCD to a volumetric measurement requires the user to consider many factors, like NO 2 variability, meteorological conditions, chemical reactions, and emissions [14]. However, it has been determined that there is a strong correlation between TVCD Sentinel-5P measurements and ground stations [12].
This study evaluates the daily atmospheric nitrogen dioxide (NO 2 ) at ground level from 12:00 h to 15:00 h UTC+1. This estimation uses a Machine Learning (ML) algorithm relying solely on satellite and global meteorological data (i.e., without the use of ground stations). Previously, this algorithm was evaluated using satellite data (Sentinel-5P) and ground-based meteorological sensors. It was demonstrated that by using ground meteorological data, a Root Mean Square Error of 2.89 µg/m 3 was achieved [15]. Although meteorological ground stations are virtually available worldwide, some regions have lower station densities, predominantly in low-income countries. Figure 2 shows that countries in the Sub-Saharan region of Africa, Central Asia, and South America have lower station densities (green markers). To address this issue, we focused on replacing the use of meteorological ground sensors with a global estimation model. For this, we chose the global reanalysis model (ERA5) from the European Centre for Medium-Range Weather Forecasts (ECMWF), which is described in detail in Section 2.1.2.
We chose the Metropolitan City of Milan (MCM) in Italy as the study area. The reason for this is that it is a densely populated urban area (more than 2000 inhabitants per km 2 ) [17] with a wide range of industrial activities, located in an atmospheric pollution hotspot. The Alps to the north and the Apennines to the south trap air trace gases (Figure 3). This hotspot affects more than 17 million inhabitants daily [18]. Therefore, air quality in the MCM is constantly monitored by a network of more than 15 ground stations operated by the Regional Environment Protection Agency (ARPA: Agenzia Regionale della Protezione del Ambiente). The observations of these sensors have been useful for the training and validation process of this work.
The selected time span for this work was from 1 January 2019, until 27 September 2022 daily average (from 12:00 h to 15:00 h UTC+1). The reason for such a long period was to consider a variety of factors like anthropogenic, seasonal, and historical physicochemical behaviour of NO 2 (Section 2.1). NO 2 concentration estimation was performed for a set of single points, at specific locations of the ARPA ground stations. Estimating single points opens the possibility for decision makers to more efficiently detect atmospheric NO 2 hotspots, compared to estimating the average of the complete area of the MCM (1500 km 2 ).
Results demonstrate that by using solely satellite and meteorological models, it is possible to estimate NO 2 ground concentrations. We found that the best model used a combination of Multi-Layer Perceptron Regressor (MLPR) and Support Vector Regression (SVR). With an average NRMSE of 55% we demonstrate that the RMSE is significantly lower than the standard deviation, which means that the model performs well for estimating daily atmospheric NO 2 at ground level for the time from 12:00 h to 15:00 h UTC+1.
The goal of this research is to train and test a Machine Learning model to estimate ground-level nitrogen dioxide (NO 2 ) concentrations at single point locations using Sentinel-5P satellite data and ERA5 reanalysis meteorological variables. This work is of particular relevance for policy-makers in LMICs where cost-effective air quality assessment is essential. Therefore, the development of alternatives to ground sensors for measuring atmospheric pollution is a key priority. Although the case study in this research was the MCM in Italy, a high-income country [19], this work provides the foundation for developing and deploying cost-effective air quality assessment solutions in other parts of the world where NO 2 ground stations are not available.

2. Materials and Methods

2.1. Data Description

The primary source of NO 2 emissions is combustion engines (i.e., transportation) [20]. In Italy, during the period from 9 March 2020 to 3 April 2020, the government declared a full lockdown due to the COVID-19 pandemic. This restricted the population’s mobility, thus reducing the use of vehicles. Therefore, the data considered for this study comprised the dates from 1 January 2019 to 27 September 2022. This time period included the years 2019 and 2021 as a pre-and post-lockdown baseline. We also considered the dates from 1 January 2022 to 27 September 2022 to assess the performance of the ML model against previous works [15].
The three data sources we used for this work as training for the ML model were Sentinel-5P tropospheric NO 2 concentrations, ERA5 reanalysis global data, and ARPA Lombardia NO 2 ground measurements. These will be described in the following sections.

2.1.1. Sentinel-5P Data

Copernicus satellites provide a wide range of environmental data, including data on land cover, sea surface temperature, and ice cover. Sentinel-5P is a Low Earth Orbit (LEO) satellite mission dedicated to monitoring the atmosphere. The Sentinel-5P mission was developed by the European Space Agency (ESA) in cooperation with the Netherlands Space Office (NSO). The TROPOMI instrument was developed by the Netherlands Aerospace Centre (NLR) and Airbus Defence and Space. It is the first Copernicus satellite mission dedicated to atmospheric monitoring. Sentinel-5P data are used by Copernicus services to provide information on air quality, ozone and UV radiation, and climate [21,22].
Sentinel-5P carries a single instrument, the Tropospheric Monitoring Instrument (TROPOMI). TROPOMI is a spectrometer that measures sunlight reflected and scattered by the Earth’s atmosphere and surface. It has a wide spectral range, covering ultraviolet, visible, near-infrared, and shortwave infrared wavelengths. This allows TROPOMI to observe a wide range of atmospheric constituents, including ozone, nitrogen dioxide, sulfur dioxide, carbon monoxide, methane, and aerosols. Sentinel-5P has a sun-synchronous orbit, which allows TROPOMI to provide global coverage of the atmosphere with a high temporal resolution. Sentinel-5P has a spatial resolution of 3.5 km × 5 km, making it the best in its class that is publicly available [22].
Sentinel-5P data are available to users through a variety of channels, including:
  • The Copernicus Open Access Hub (https://scihub.copernicus.eu, accessed on 30 October 2023), which provides free access to Sentinel-5P data and other Copernicus data products.
  • The S5P Data Portal (https://data-portal.s5p-pal.com, accessed on 30 October 2023), provides access to Sentinel-5P data and related information, such as product specifications and documentation.
  • The ESA Earth Observation Data Services (https://www.copernicus.eu/en/access-data/dias, accessed on 30 October 2023), where the Data and Information Access Services (DIAS) provide access to a wide range of Earth observation data, as well as processing and analysis services.
Sentinel-5P was designed to meet certain requirements. Specifically, for NO 2 , it was required that Sentinel-5P must measure nitrogen dioxide column density with an accuracy of 5% and a precision of 2%. Since its measurements were made available to the public, Sentinel-5P has been meeting or exceeding all of its design accuracy requirements. Sentinel-5P also complies with its design specifications in terms of other performance metrics, such as spatial resolution, temporal resolution, and radiometric resolution. The accuracy and precision of Sentinel-5P’s measurements of nitrogen dioxide column density were measured using a variety of methods, including [23]:
  • Ground-based validation: Sentinel-5P data was compared to data from ground-based stations that measure nitrogen dioxide column density. The ground-based stations use a variety of different measurement techniques, such as Dobson spectrophotometers and MAX-DOAS instruments.
  • Aircraft validation: Sentinel-5P data was also compared to data from aircraft campaigns that measure nitrogen dioxide column density. The aircraft campaigns use a variety of different measurement techniques, such as in situ instruments and remote sensing instruments.
  • Intercomparison with other satellites: Sentinel-5P data were also compared to data from other satellites that measure nitrogen dioxide column density, such as OMI and GOME-2.
In addition to the validation studies, the Sentinel-5P mission team also uses a number of other methods to assess the accuracy and precision of Sentinel-5P’s measurements. These methods include [23,24]:
  • Internal consistency checks: The Sentinel-5P mission team checks the internal consistency of the Sentinel-5P data to identify any anomalies. For instance, the team verifies whether the data align with established physical correlations among various atmospheric components.
  • Trend analysis: The Sentinel-5P mission team analyzes trends in the Sentinel-5P data to identify any systematic errors. For example, the team checks to see if the data are showing trends that are consistent with other known trends, such as the trend of decreasing nitrogen dioxide emissions in Europe.
  • Intercomparison with models: The Sentinel-5P mission team compares their data to data from atmospheric models. The atmospheric models are based on our understanding of the physics of the atmosphere, and they can be used to predict the distribution of nitrogen dioxide and other atmospheric constituents.
When comparing baseline 2019 measurements in the COVID-19 lockdown period (2020), Sentinel-5P and ARPA Lombardia ground measurements showed a strong Pearson correlation. Table 1 shows that the non-linear prediction model ρ s outperformed the linear prediction model ρ p in terms of the mean and median values of NO 2 ground concentrations estimated using Sentinel-5P satellite data. This suggests that non-linear prediction models are more suitable for inferring NO 2 ground concentrations from satellite data. This insight is important for developing satellite-based local air quality prediction models.
For this work, Sentinel-5P images were downloaded through the WEkEO DIAS (https://www.wekeo.eu/, accessed on 30 October 2023) Application Programming Interface (API). This download method is considerably faster than using the Open Access Hub because it provides automated batch download. Instead, the Open Access Hub only provides a non-batch manual download functionality. Downloading data through the DIAS is currently the only way to download data automatically in batch mode through Python scripting. For large datasets or long time periods, like the one used in this work, this is a fundamental tool to accelerate the data provision.
Figure 4 shows how the pixels delivered by the Sentinel-5P look over the area of Milan. After we downloaded the data from the WEkEO DIAS API, we preprocessed the images to exclude data that did not meet the suggested quality standards. This was carried out by selecting a quality value (qa_value) of 0.75, as suggested in Copernicus literature [22].

2.1.2. ERA5 Data

As mentioned before, we chose ERA5 (https://cds.climate.copernicus.eu/cdsapp#!/dataset/reanalysis-era5-single-levels, accessed on 30 October 2023) as the data source to replace the use of ground meteorological sensors in this work. ERA5 is the fifth generation of global reanalysis produced by the European Centre for Medium-Range Weather Forecasts (ECMWF). It is a dataset of atmospheric, land, and oceanic climate variables covering the period from 1950 to the present. The ERA5 reanalysis was developed by the ECMWF in collaboration with a number of other organizations, including the Copernicus Climate Change Service (C3S). The ERA5 project was funded by the European Union and the ESA [25,26]. The main objective of replacing ARPA meteorological data that were used in previous works [15] is to provide a model that relies on datasets that can be used worldwide, especially in LMICs.
The ERA5 reanalysis is based on the IFS (Integrated Forecasting System) numerical weather prediction model. It is used by ECMWF to produce daily weather forecasts, as well as by many other meteorological centres around the world. The ERA5 reanalysis also uses a vast range of historical observations. These observations come from a variety of sources, including ground stations, ships, aircraft, and satellites. The observations are used to constrain the IFS model and to produce the ERA5 reanalysis. ERA5 is produced using a state-of-the-art numerical weather-prediction model and a vast range of historical observations. ERA5 is a major advance over previous reanalyses in terms of resolution, spatial coverage, and temporal coverage. It has a horizontal resolution of 31 km and a vertical resolution of 137 levels. It also includes a number of new variables, such as land surface temperature, soil moisture, and sea ice concentration [26,27].
The ERA5 reanalysis is verified using a variety of methods. The first is a comparison to observations, where ERA5 data are compared to a wide range of historical observations, including independent ground stations, ships, aircraft, and satellite data. This comparison helps to identify any biases or errors in the ERA5 data. ERA5 data are also compared to data from other reanalyses, such as the NCEP-DOE Reanalysis 2 (R2) and the Japanese 55-year Reanalysis (JRA-55). This intercomparison helps to identify any differences in the way that different reanalyses represent the climate system. Finally, ERA5 data are also subject to a variety of diagnostic checks to identify any inconsistencies or unrealistic features. For example, the ERA5 team checks to make sure that the energy and water budgets of the climate system are balanced. The ERA5 scientific team then uses the results of the verification process to adjust the ERA5 reanalysis to make it as realistic as possible. For example, if the ERA5 data show a bias in temperature relative to observations, the team may adjust the ERA5 model to compensate for this bias [25,26,27].

2.1.3. ARPA Data

ARPA Lombardia’s NO 2 ground measurements are collected using a network of 85 monitoring stations located throughout the Lombardy region of Italy. A total of 17 of these ground stations are located inside the Metropolitan City of Milan (Figure 4). The stations are equipped with continuous chemiluminescence analyzers, which measure the concentration of NO 2 in the air with a time resolution of 1 h. As shown in Figure 4, the NO 2 sensors have a sparse distribution, having a higher number of sensors close to the centre of the city of Milan [28].
The validation process for the ARPA Lombardia NO 2 sensors is rigorous and it is designed to ensure the accuracy and reliability of the measurements. The validation process includes the following steps [28,29]:
  • Pre-deployment calibration: Before each sensor is deployed, it is calibrated in a laboratory using a known concentration of NO 2 . This ensures that the sensor is measuring NO 2 accurately.
  • Field calibration: After each sensor is deployed, it is calibrated in the field using a portable NO 2 calibrator. This ensures that the sensor is still measuring NO 2 accurately in the field environment.
  • Data quality checks: ARPA Lombardia performs regular data quality checks on the NO2 measurements. These checks include looking for outliers and inconsistencies in the data.
  • Collocation studies: ARPA Lombardia conducts collocation studies by placing two or more sensors at the same location. The measurements from the different sensors are compared to ensure that they are consistent.
  • Interlaboratory comparisons: ARPA Lombardia participates in interlaboratory comparisons to compare the measurements from its NO 2 sensors to the measurements from other laboratories. These comparisons help to ensure that ARPA Lombardia’s NO 2 sensors are measuring NO 2 accurately compared to other sensors.
If a sensor fails any of the validation steps, it is recalibrated or repaired. If a sensor is unable to be recalibrated or repaired, it is replaced.
ARPA Lombardia’s NO 2 validation process is designed to ensure the accuracy and reliability of the NO 2 measurements. This is important because the NO 2 measurements are used to monitor air quality and to assess compliance with EU air quality standards. All of the data can be accessed and downloaded through the dedicated open portal (https://www.dati.lombardia.it/browse, accessed on 30 October 2023).

2.1.4. Additional Data

Atmospheric mixing/stability and boundary layer height are two components that in some cases play an important role in NO 2 atmospheric analysis. Atmospheric mixing/stability is the process by which pollutants are dispersed in the atmosphere and is a measure of how resistant the atmosphere is to trace gas mixing. Atmospheric mixing and stability have a significant impact on the concentration of pollutants at the surface [30]. In stable atmospheres, pollutants are more likely to be trapped near the surface, resulting in higher concentrations. In unstable atmospheres, pollutants are more likely to be dispersed throughout the atmosphere, resulting in lower concentrations at the surface [31]. The boundary layer height is the height of the lowest layer of the atmosphere, where most of the human activity and pollution takes place. It is usually a feature used in air quality modelling and forecasting [32].
Although atmospheric mixing/stability and boundary layer height are known to be factors used in estimating ground-level NO 2 atmospheric concentrations, they were not considered in this work. The main reason for this is two-fold. On the one hand, the Metropolitan City of Milan is considered to be flat: according to NASA’s Shuttle Radar Topography Mission (SRTM) global elevation data, the MCM has a total elevation range of 85 m. On the other hand, it has a total surface area of 1575 km 2 [33]. This means that the atmospheric mixing/stability and boundary layer height are likely to be relatively uniform across the city. In this case, local emissions and meteorology are likely to have a greater impact on the concentration of NO 2 at smaller scales.
Additionally, given the topographic characteristics of the study area and the geospatial focus of this work, we decided to exclude from the selected features the SRTM altitude model. In future work, we will consider using both of these features, since they may be important contributors when utilizing this model on a global scale.

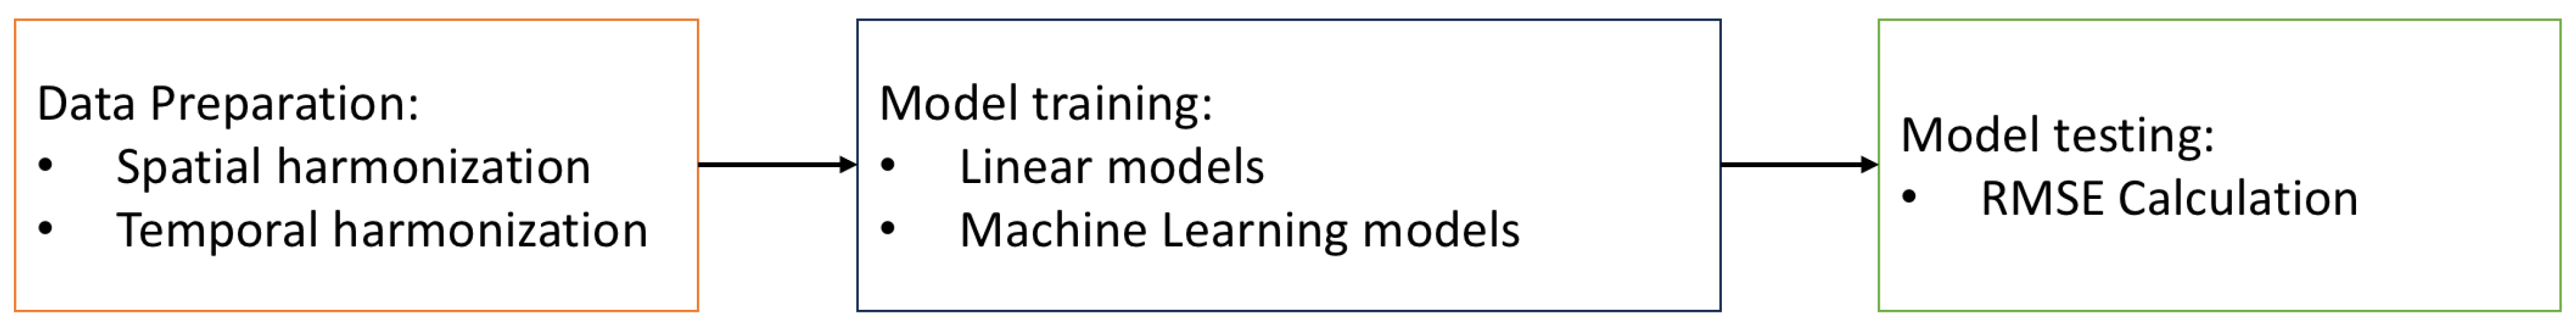
2.1.5. Processing and Training Pipeline

We used a pipeline that was developed in a previous work [15] for training the models. The reason for this is two-fold. On the one hand, it was developed to process ARPA Lombardia NO 2 ground measurements, meteorological measurements, and Sentinel-5P images. On the other hand, it has been proven to have good accuracy when estimating atmospheric NO 2 ground-level observations from 12:00 h to 15:00 h UTC+1. It is important to note that the algorithm was modified to take into consideration ERA5 meteorological measurements instead of those acquired by the ARPA Lombardia ground network. Given that the development of this pipeline development is not the scope of this work, it will be shortly described, as well as the modifications that took place in this work.
The processing and training pipeline comprises three steps (Figure 5).
The first step is the data cleaning and formatting. This consists of giving the same structure to all of the data sources, so they can be integrated into a single Dataframe. This is useful to train the ML algorithms, which generally use a single data source divided into X and y. X is considered to be the input variable and y is the desired output. The data integration was subdivided into two main steps: time resolution and spatial resolution harmonization. Time resolution is mainly constrained by the NO 2 satellite data. Sentinel-5P passes over the MCM generally once per day, this means that only one measurement per day is delivered. For this reason, both ARPA Lombardia and ERA5 Dataframes were down-sampled. To do this, we know that the satellite passage time is from 12:00 h to 15:00 h UTC+1 [15]. Therefore we calculated the average measurement for this 3 h period for the ARPA NO 2 (as the output) and ERA5 measurements as the input. Then, only for the ERA5 data, we calculated the average measurement of the previous 21 h period prior to the passage of the satellite, which was added as a new feature for the inputs. Given that NO 2 is a gas present in the length of the atmospheric column, the 21 h period helps to describe better the physicochemical dynamics at ground level.
Although most ARPA stations are designed to work constantly in time, there are periods in which no data are available for some of them. This happens because technical problems can emerge in each of them, or maintenance has to be completed. There are also some cases in which a ground station is completely removed and it only registers data at the beginning of the study time period. For this reason, it is important to note that we performed the training using all of the stations, and the testing could only be completed for those that were available from 7 March 2022 until 27 September 2022. Both training and testing included a total of 13 stations.
Due to the difference in spatial resolution among the data sources, we performed a spatial resolution harmonization. For this, ARPA sensor locations were the only ones considered for this study. Therefore, ARPA NO 2 measurements were paired with the closest Sentinel-5P pixel and the closest ERA5 pixel. Figure 4 shows the ID and locations of these stations.
We divided the Dataframe into training and testing, with a splitting ratio of 80% as training data and the remaining 20% as testing data. This pipeline originally performs the splitting chronologically. This means that the training period comprises all the dates from 1 January 2019, until 6 March 2022, and the testing period from 7 March 2022 until 28 September 2022. For us to find the best-performing mechanism for ground-level estimations, we compared the results using chronological data splitting with that of random data splitting.
The second step in this pipeline was to train the ML algorithm to estimate ground-level NO 2 . The processing pipeline tests and compares automatically the result’s RMSE for a set of ML algorithms. In addition to ML algorithms, the pipeline uses linear regression models. In several cases it has been stated that ML has been overused, when in reality a simple linear regression would be a solution [34,35,36]. This can be time and cost-effective, as well as more accurate and interpretable [37]. For this reason, we compared the ML results with those of linear regression algorithms, which included the following:
  • Linear Regression:
  • Spline linear regression;
  • Krigging linear regression.
  • Machine Learning:
  • Random Forest (RF);
  • Support Vector Regression (SVR);
  • Decision Trees Regression (DTR);
  • Gradient Tree Boosting (GTB);
  • Multi-layer Perceptron Regressor (MLPR).
To understand how each of the models work, the reader can find further details on SciKit-Learn’s developer website (https://scikit-learn.org/stable/supervised_learning.html, accessed on 30 October 2023).
To minimize the RMSE, the algorithm tests these models individually and all the combination pairs of these. This is conducted through the use of the sklearn stacking and voting tool (https://scikit-learn.org/stable/modules/ensemble.html, accessed on 20 October 2023). These regressors from sklearn in Python are an ensemble learning algorithm that combines the predictions of multiple regression models to produce a more accurate prediction. It works by first training a set of base regression models on the training data. The predictions of the base models are then used to train a meta-regression model. The meta-regression model is then used to make the final prediction on the test data [38,39].
The stacking or voting regressor can be used to improve the performance of any regression algorithm. However, it is particularly useful for combining the predictions of linear and non-linear regression models. This is because they can learn to leverage the strengths of each individual model to produce a more accurate prediction [38].
Inside the training pipeline, we used an RF feature selection algorithm that helped us reduce the number of variables used for the training. This was carried out with the use of the sklearn Python libraries, which work by first training a Random Forest classifier on the training data. The Random Forest classifier is then used to calculate the importance of each feature. The importance of a feature is calculated by measuring how much the accuracy of the Random Forest classifier decreases when the feature is removed. The Random Forest feature selection algorithm then selects a subset of features based on their importance. The number of features to select is specified by the user. The algorithm can also be used to select a specific percentile of the most important features [40].
To evaluate the performance of our model, we used the Normalised Root Mean Square Error (NRMSE). We considered it more suitable than the RMSE, because data from each of the sensors have different standard deviations and, as a consequence, the RMSE magnitudes by themselves can be misleading. NRMSE instead compares the RMSE to the standard deviation, to obtain a better understanding of how well the model is performing relative to the natural variability of the data. This information is essential for evaluating the relevance of the results and determining whether the model is useful for real-world applications. In order to find the best possible model for our use case, we used a Python processing pipeline that iterated over different combinations of ML algorithms. The two best models were then combined through a voting mechanism which allowed us to use the characteristics of each model that most reduced the RMSE. Additionally, by using a Random Forest feature selection algorithm, we selected the features that contributed the most to the reduction of RMSE. For this validation process, we used the real ground measurements of NO 2 delivered daily by the ARPA Lombardia network from 12:00 h to 15:00 h UTC+1.

3. Results and Discussion

When training a machine learning regression algorithm with a large number of variables, it is important to carefully select the ones that will be used in the model. To decrease the processing resources needed to train the model, we selected the variables using two methods: correlation coefficient and RF feature selection. According to Murphy [41], Pearson correlation coefficients can be interpreted as weak, medium, or strong in machine learning depending on the context and the specific application. A weak correlation coefficient ( ρ p < 0.3) indicates a small or negligible relationship between two variables. A medium correlation coefficient (0.3 ≤ ρ p < 0.7) indicates a moderate relationship between two variables. A strong correlation coefficient ( ρ p ≥ 0.7) indicates a strong relationship between the two variables. For this work, we considered variables with a moderate or strong correlation (0.3 ≤ ρ p ) with respect to ARPA ground-level NO 2 measurements. Even though variables with a medium correlation are disregarded in some fields, we did not, because as a complement to Pearson’s correlation, we used a Random Forest feature selector (described in detail in Section 2.1.5). This helped us to reduce the dimensionality of the data sources. Table 2 shows the ρ p correlation coefficients for each of the variables. The variables we used were current temperature, current surface solar radiation, current surface pressure, previous temperature, previous surface solar radiation, and previous surface pressure.
As it has been found in other works [14,42], Sentinel-5P has the strongest correlation ( ρ p > 0.8) with NO 2 ground-level measurements among the independent variables (Table 2). For this reason, as an alternative to using meteorological variables, we trained the models only using Sentinel-5P and ARPA NO 2 data and compared them with the results obtained by integrating the ERA5 meteorological model. The results of this comparison will be explained in detail later in this section. Regarding the correlation results, these show that for most of the meteorological indicators, the 21 h period has an equal or stronger correlation than that of the satellite passage time (from 12:00 h to 15:00 h UTC+1). This has two possible explanations. The first is that the 21 h period is the mean of a larger set of data, reducing possible bias that could be present in the satellite passage time 3 h period. Also, this correlation trend could indicate that the physico-chemical behaviour of ground-level NO 2 receives a larger influence from the meteorological conditions that took place before the satellite measured the NO 2 tropospheric column. Opposite to what we expected, wind direction seems to have a weak correlation with respect to ground NO 2 , meaning that the dynamics of atmospheric pollutants cannot be simply explained by wind transportation.
As stated in Section 2.1, we split the data by using two techniques. On the one hand, we divided the dataset into training and testing chronologically. This means that instead of randomly extracting data samples to build the testing dataset, we used the last 20% of the data period (from 7 March 2022 until 27 September 2022) as the testing time frame. On the other hand, we split the data randomly, by assigning 20% of the data as part of the testing and the remaining 80% as the training. We used both methods to have a comparison point from previous works [15], where data was split chronologically, but we also extracted randomly to compare if there is an improvement in the results. Table 3 shows the general statistics of the training, testing, and complete dataset. When comparing the statistics of training against testing, we see that for the chronological data splitting, the strongest differences are the mean and the standard deviation. The reason for this is that the testing period covers only the spring and summer seasons. Historically, these periods are known to have lower NO 2 concentrations and less variability, which is caused primarily because, during the winter season, heating systems are running [43]. To ensure that the chronological data extraction could be used, we compared the density distribution of the training and testing data. First, we used as testing period from 7 March 2022 until 28 September 2022 NO 2 and obtained their density distributions. Figure 6a, shows that the relationship between both training and testing periods in this case is linear, meaning that training and testing distributions are equal. Given that the data which is present in the quantiles is different, we decided to also compare the period from 7 March 2021 until 28 September 2021 against the same dates of 2022 (Figure 6b). The relationship is still linear and the data present in the quantiles is closer to each other. This allowed us to use the chronological training–testing splitting technique as part of our study.
In addition to the original time period (1 January 2019 until 28 September 2022), which considers only the Summer season, we performed testing for the period from 27 September 2022, to 25 April 2023 (Winter period). We did this to evaluate the model in the period of most variability (Figure 7). When comparing the results of the Winter with those of the Summer testing period, we obtained an RMSE significantly higher and closer to the standard deviation. To understand this deterioration in performance we compared the density distribution using the 2023 winter as testing period. Figure 8a shows that the quantiles of testing and training do not have a linear relationship. This indicates that their density distributions are not similar. To improve this, we compared it with a random extraction of the testing data. as it can be seen from Figure 8b the training and testing have similar distributions, resulting in a lower RMSE and confirming the performance of the model.
To choose the model that better reduces the RMSE for each of the 13 ARPA locations, we performed the training for the atmospheric NO 2 ground-level estimation by using a dataframe containing all the ARPA stations separately for each day. The RMSE for each model was then compared to those obtained by using the daily average (at the satellite passage period) of all the ARPA stations. As shown in the results (Table 4 column 2 and 3) the first method appears to perform better, but this preliminary testing was carried out without selecting the station locations. We found that in this initial testing phase, the algorithm that minimized the RMSE the most (Table 4) was the combination of MLPR and SVR, by using the Sklearn voting mechanism and a Random Forest feature selection. This model outperformed the rest and was chosen as the regression method to estimate the ground-level NO 2 for individual stations. Even though Krigging is close to this estimation, it is computationally more expensive, taking three times more processing time than the best model. Therefore, we decided to use for this work the RF feature selection + Voting (SVM + MLPR). Given that each of the ML algorithms uses different hyperparameters, we decided to use the Keras tuner to automate this operation. Once we found the best model for our case study, we performed additional tuning, resulting in the hyperparameters reported in Table A1.
Table 5 shows the results when estimating the ground-level NO 2 atmospheric concentration at the Sentinel-5P passage time. The first column indicates the ARPA ground sensor number of the estimated accuracy (RMSE and NRMSE). Ideally, we are looking for RMSE values that are lower than the standard deviation for them to be considered relevant. The highest NRSME is in the location of sensors 5520, 5548, and 9999. A possible explanation for the 5520 and 5548 poor performance is that they both have the lowest standard deviation combined with the least amount of data. Figure 9 shows that both of these have the lowest inter-quantile range, confirming the behaviour of the model when predicting in this specific area. Regarding station 9999, it is characterised to be a traffic station that is far away from the MCM city center. This means that there are some uncommon events that are more difficult to predict.
Atmospheric ground-level NO 2 has been similarly estimated in other works. An example is Grzybowski et al.’s research [14], which considered data yearly averages for the country of Poland. The second example is the work developed by Chi et al. [44]. Here, NO 2 was estimated at a daily time resolution and a spatial resolution of 0.125° over the whole country of China. An interesting approach developed by this was the subdivision of China into six different regions, which were then used as an input for the algorithm. This work differentiates from those of [14,44] because we estimate atmospheric NO 2 ground concentrations at single-point locations. This poses a different challenge regarding spatial resolution, variables, and selection of the ML algorithm. In the results from these and other studies, we observe an average R 2 of 0.5 [45,46], but are not fully comparable with our work, due to spatiotemporal resolution, location, and dataset differences from our study. In this work, for 13 locations inside the MCM, the daily ground-level NO 2 estimations (from 12:00 h to 15:00 h UTC+1) had an average R 2 of 0.76. Results vary depending on the sensor due to the standard deviations and number of data available (Table 6). This can be interpreted as a result that indicates a strong relationship of our model with respect to the ground truth. This can also be observed in Table 7, where the correlation coefficients indicate a strong relationship between our results and the direct NO 2 measurements.
Figure 10 shows the plots for the atmospheric NO 2 ground-level estimation for the selected sensors from 12:00 h to 15:00 h UTC+1. In orange, we can observe the estimations obtained from the algorithm, and in blue the ground truth. With these plots, we can visually inspect the output from the estimation model to determine that they are close to the ground truth. As a result of the results presented in this section, it can be determined that the data processing pipeline and its estimations are close enough to the ground-level measurements from the ARPA Lombardia network. This model can be confidently used in this region as an alternative to direct atmospheric NO 2 ground-level measurements. The results and methodology presented in this work can be taken as a baseline for other regions of the world, especially those located in LMICs. Future work will include data from other urban areas that can contribute to better monitoring of atmospheric pollution.

4. Conclusions

The goal of this research was to train and test Machine Learning models to estimate ground-level nitrogen dioxide (NO 2 ) concentrations at single-point locations using Sentinel-5P satellite data and meteorological variables. The models were trained and evaluated on a dataset with Sentinel-5P and ERA5 reanalysis data as input and as output, NO 2 measurements from 13 ARPA ground stations in the Metropolitan City of Milan, Italy. Although previous studies performed training/testing chronological splitting, this study achieved better results by using random data splitting. This was also found to be more appropriate because the density distribution and statistics of the testing group are closer to the training compared to chronological data splitting. Among the combinations of ML and linear regression reported in Table 4, the model that better reduced the RMSE was a voting combination of SVR and MLPR with RF feature selection. The model achieved a good performance, with an average NRMSE of 55.92% and R 2 of 0.76 for daily ground-level NO 2 estimations (from 12:00 h to 15:00 h UTC+1) in the MCM. Although this is higher than the average R 2 of 0.5 reported in other studies, it must be highlighted that we estimated ground-level NO 2 at different spatial and temporal resolutions.
The model was also able to capture the variability of NO 2 concentrations over time, as shown in Figure 10. The model’s predictions are close to the ground truth measurements, indicating that it can be reliably used to estimate ground-level NO 2 concentrations at single point locations.
The results of this study demonstrate that the proposed Machine Learning model is a promising tool for estimating ground-level NO 2 concentrations using Sentinel-5P satellite data and ERA5 reanalysis meteorological variables. The model can be used to monitor air quality and to support public health and environmental management, especially in regions where direct ground-level NO 2 measurements are not available. By using globally available data sources, future work will propose and test a model that can be used in most parts of the world, emphasizing LMICs’ atmospheric NO 2 ground-level concentration estimation.

Author Contributions

Conceptualization, M.A.B. and J.R.C.J.; methodology, M.A.B. and J.R.C.J.; software, J.R.C.J.; validation, M.A.B. and J.R.C.J.; formal analysis, M.A.B. and J.R.C.J.; investigation, J.R.C.J.; resources, M.A.B.; data curation, J.R.C.J.; writing—original draft preparation, J.R.C.J.; writing—review and editing, M.A.B. and J.R.C.J.; visualization, J.R.C.J.; supervision, M.A.B.; project administration, M.A.B.; funding acquisition, M.A.B. All authors have read and agreed to the published version of the manuscript.

Funding

This research was partially funded by the Italian Ministry of Education through the project of national interest (PRIN) “Geo-Intelligence for improved air quality monitoring and analysis (GeoAIr)” (project code: 202258ACSL-PE10).

Data Availability Statement

Publicly available datasets were analyzed in this study. This data can be found here: https://github.com/rodrigocedeno/NO2-GroundPollution-AI.git, (accessed on 20 October 2023), Python notebooks containing processing pipelines can be found here: https://github.com/rodrigocedeno/NO2-GroundPollution-AI.git, (accessed on 20 October 2023).

Acknowledgments

Thanks to the WEkEO team for their support and availability for the Sentinel-5P data acquisition. They provided continuous help to provide a high-quality API service.

Conflicts of Interest

The authors declare no conflict of interest.

Abbreviations

The following abbreviations are used in this manuscript:
AQGAir Quality Guidelines
ARPAAgenzia Regionale per la Protezione dell’Ambiente:
Regional Agency for Environmental Protection
APIApplication Programming Interface
C3SCopernicus Climate Change Service
COVID-19Coronavirus Infectious Disease 2019
DEMDigital elevation model
DIASData and Information Access Services
DTRDecision Trees Regression
ECMWFEuropean Centre for Medium-Range Weather Forecasts
EEAEuropean Environmnet Agency
ERA5European ReAnalysis 5
ESAEuropean Space Agency
EUEuropean Union
GTBGradient Tree Boosting)
IFSIntegrated Forecasting System
JRA-55Japanese 55-year Reanalysis
LEOLow Earth Orbit
LMICsLow- Medium-Income Countries
MCMMetropolitan City of Milan
MLMachine Learning
MLPRMulti-layer Perceptron Regressor
NASANational Aeronautics and Space Administration
NGANational Geospatial-Intelligence Agency
NLRNetherlands Aerospace Centre
NO 2 Nitrogen dioxide
NRMSENormalised Root Mean Squared Error
NSONetherlands Space Office
OMIOzone Measurement Instrument
PRINProject of National Interest
RFRandom Forest
RMSERoot Mean Squared Error
SDGsSustainable Development Goals
SRTMShuttle Radar Topography Mission
SVRSupport Vector Regression
TROPOMITROPOspherical Measurement Instrument
TVCDTropospheric Vertical Column Density
USGSUnited States Geological Survey
UNUnited Nations
UKUnited Kingdom
UTCCoordinated Universal Time
UVUltra Violet
WHOWorld Health Organization

Appendix A

Table A1. Hyperparameters for the ML models that most reduced the RMSE for MCM case study. For the hyperparameters that are not listed, we used the default values.
ModelHyperparameters
SVRC = 0.7
Epsilon = 0.015
MLPRHidden layer sizes = 8000
Learning rate = Constant
Learning rate init = 0.001
Max iter = 1000

References

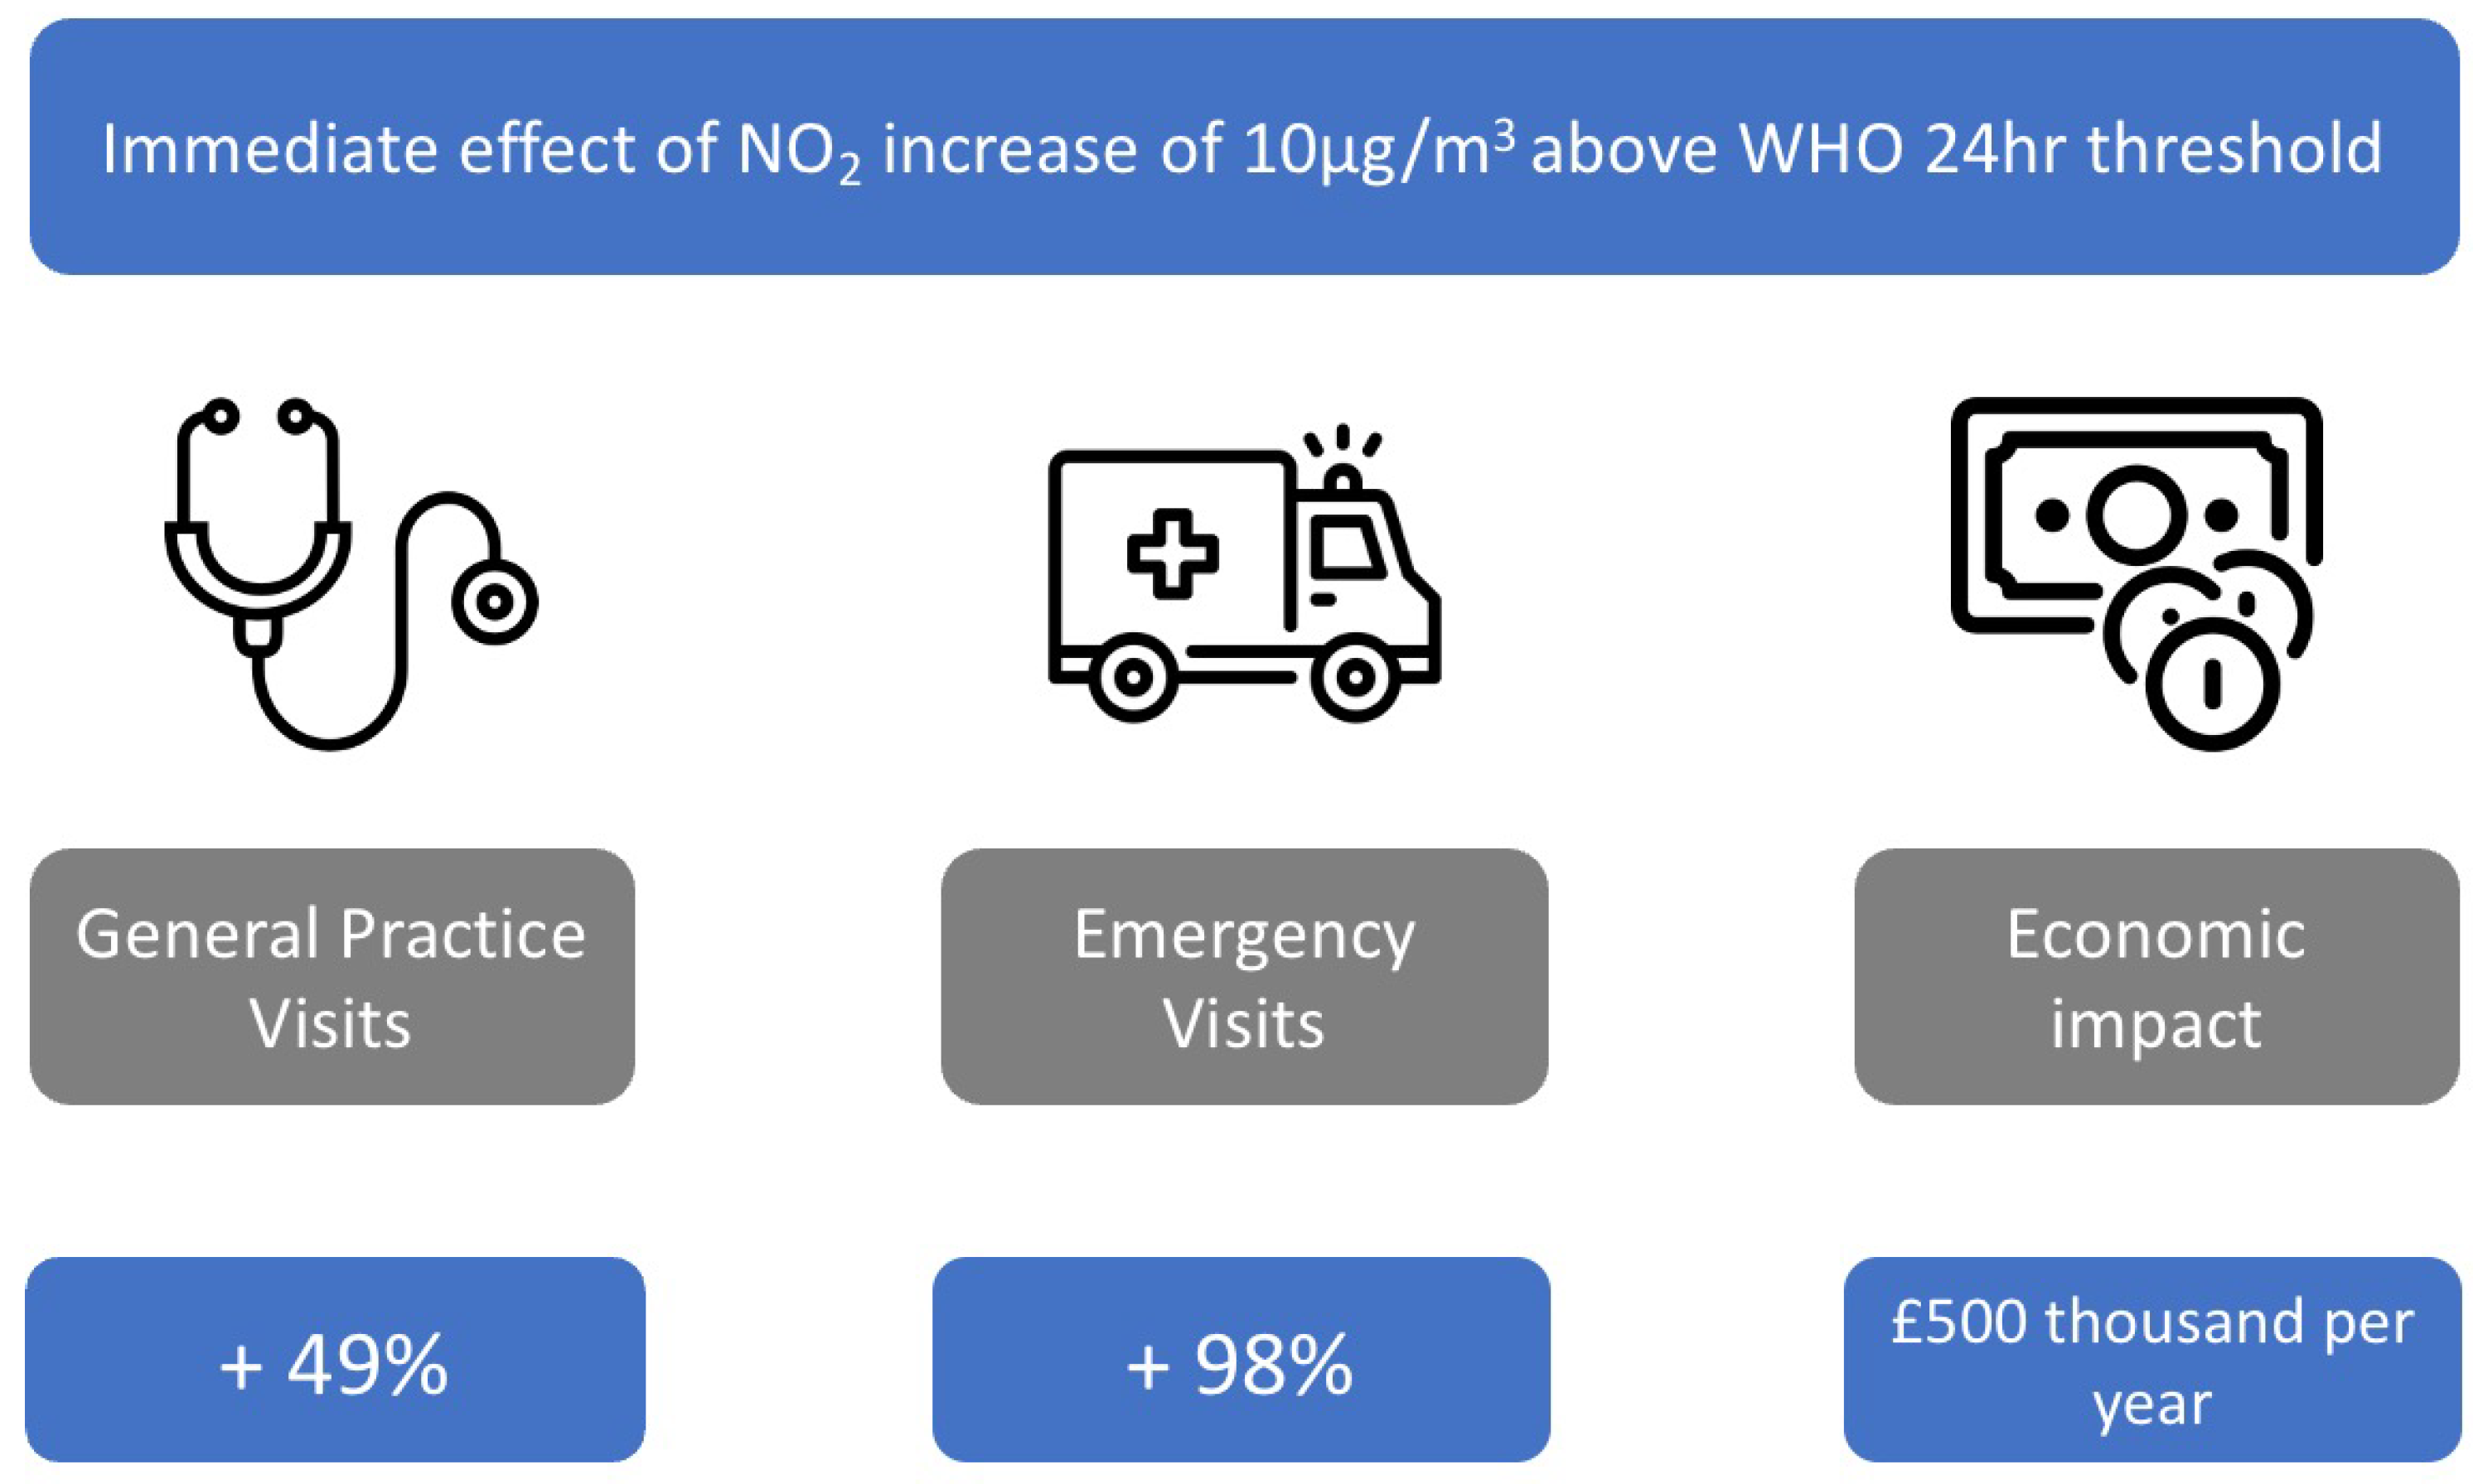
  1. Mebrahtu, T.F.; Santorelli, G.; Yang, T.C.; Wright, J.; Tate, J.; McEachan, R.R. The effects of exposure to NO2, PM2.5 and PM10 on health service attendances with respiratory illnesses: A time-series analysis. Environ. Pollut. 2023, 333, 122123. [Google Scholar] [CrossRef]
  2. Song, J.; Wang, Y.; Zhang, Q.; Qin, W.; Pan, R.; Yi, W.; Xu, Z.; Cheng, J.; Su, H. Premature mortality attributable to NO2 exposure in cities and the role of built environment: A global analysis. Sci. Total Environ. 2023, 866, 161395. [Google Scholar] [CrossRef]
  3. United Nations. The 17 Goals; SDGS; UN: New York, NY, USA, 2021. [Google Scholar]
  4. CAF. Sustainable Development Goals and Air Pollution. 2023. Available online: https://www.cleanairfund.org/news-item/sustainable-development-goals/ (accessed on 4 September 2023).
  5. European Commission. EU Air Quality Standards; European Union: Brussels, Belgium, 2023. [Google Scholar]
  6. CENELEC. CEN—CEN/TC 264. 2023. Available online: https://standards.cencenelec.eu/ (accessed on 15 September 2023).
  7. Pinder, R.W.; Klopp, J.M.; Kleiman, G.; Hagler, G.S.W.; Awe, Y.; Terry, S. Opportunities and challenges for filling the air quality data gap in low- and middle-income countries. Atmos. Environ. 2019, 215, 116794. [Google Scholar] [CrossRef]
  8. NASA. NASA Earth Science | Science Mission Directorate. 2023. Available online: https://science.nasa.gov/earth-science (accessed on 6 September 2023).
  9. De Vries, J.; Voors, R.; Ording, B.; Dingjan, J.; Veefkind, P.; Ludewig, A.; Kleipool, Q.; Hoogeveen, R.; Aben, I. TROPOMI on ESA’s Sentinel 5p Ready for Launch and Use. In Proceedings of the Fourth International Conference on Remote Sensing and Geoinformation of the Environment (RSCy2016), Paphos, Cyprus, 4–8 April 2016; Volume 9688, p. 96880B. [Google Scholar]
  10. NASA. Earth Atmosphere. 2023. Available online: https://www.grc.nasa.gov/www/k-12/airplane/atmosphere.html# (accessed on 20 September 2023).
  11. NASA. Troposphere | NASA Space Place—NASA Science for Kids. 2023. Available online: https://spaceplace.nasa.gov/troposphere/en/ (accessed on 20 September 2023).
  12. Oxoli, D.; Cedeno Jimenez, J.R.; Brovelli, M.A. Assessment of Sentinel-5P Performance for Ground-Level Air Quality Monitoring: Preparatory Experiments over the COVID-19 Lockdown Period. Int. Arch. Photogramm. Remote. Sens. Spat. Inf. Sci. 2020, XLIV-3/W1-2020, 111–116. [Google Scholar] [CrossRef]
  13. KNMI; SRON; DLR; European Union. TROPOMI—L2. 2021. Available online: http://www.tropomi.eu/data-products/level-2-products (accessed on 19 September 2023).
  14. Grzybowski, P.T.; Markowicz, K.M.; Musiał, J.P. Estimations of the Ground-Level NO2 Concentrations Based on the Sentinel-5P NO2 Tropospheric Column Number Density Product. Remote Sens. 2023, 15, 378. [Google Scholar] [CrossRef]
  15. Cedeno Jimenez, J.R.; Pugliese Viloria, A.D.J.; Brovelli, M.A. Estimating Daily NO2 Ground Level Concentrations Using Sentinel-5P and Ground Sensor Meteorological Measurements. ISPRS Int. J.-Geo-Inf. 2023, 12, 107. [Google Scholar] [CrossRef]
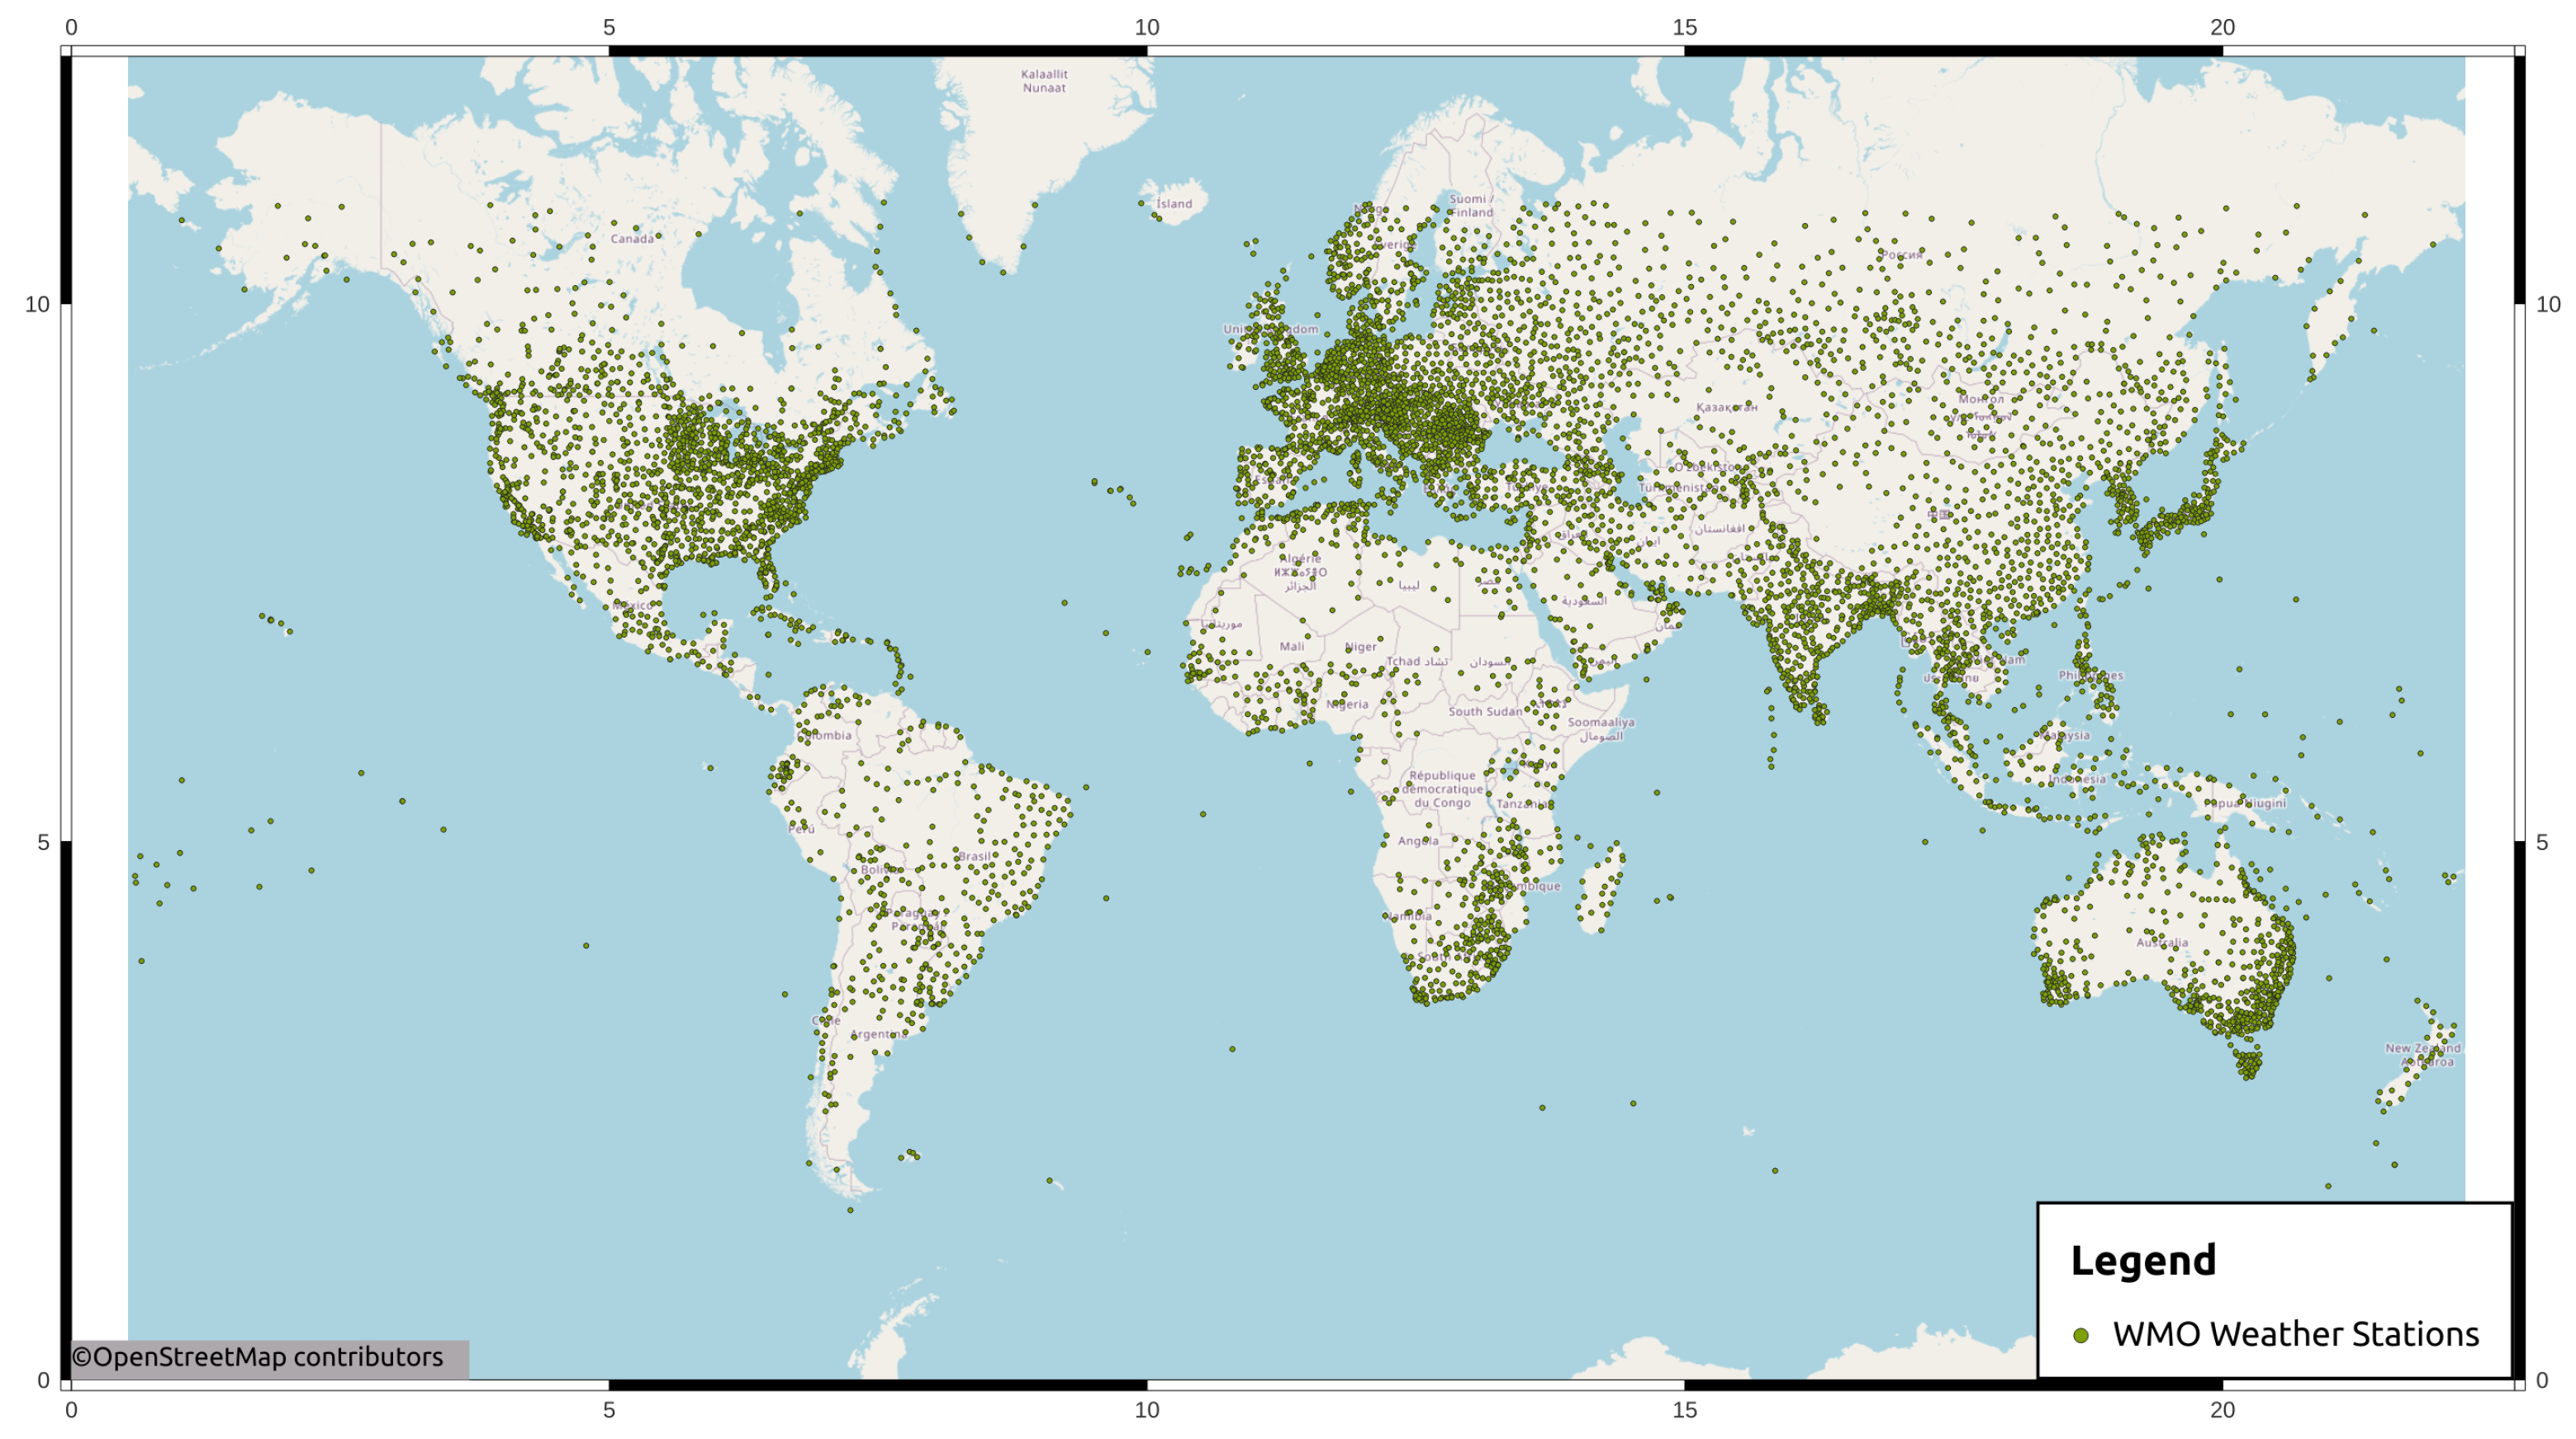
  16. WMO; Dixon, L. WMO Weather Stations—Overview. 2020. Available online: https://www.arcgis.com/home/item.html?id=c3cbaceff97544a1a4df93674818b012 (accessed on 24 October 2022).
  17. CMM. La Popolazione e il Territorio. 2023. Available online: https://www.cittametropolitana.mi.it/sviluppo_economico/saperne_di_piu/MIinCIFRE/Popolazioneeterritorio.html (accessed on 20 September 2023).
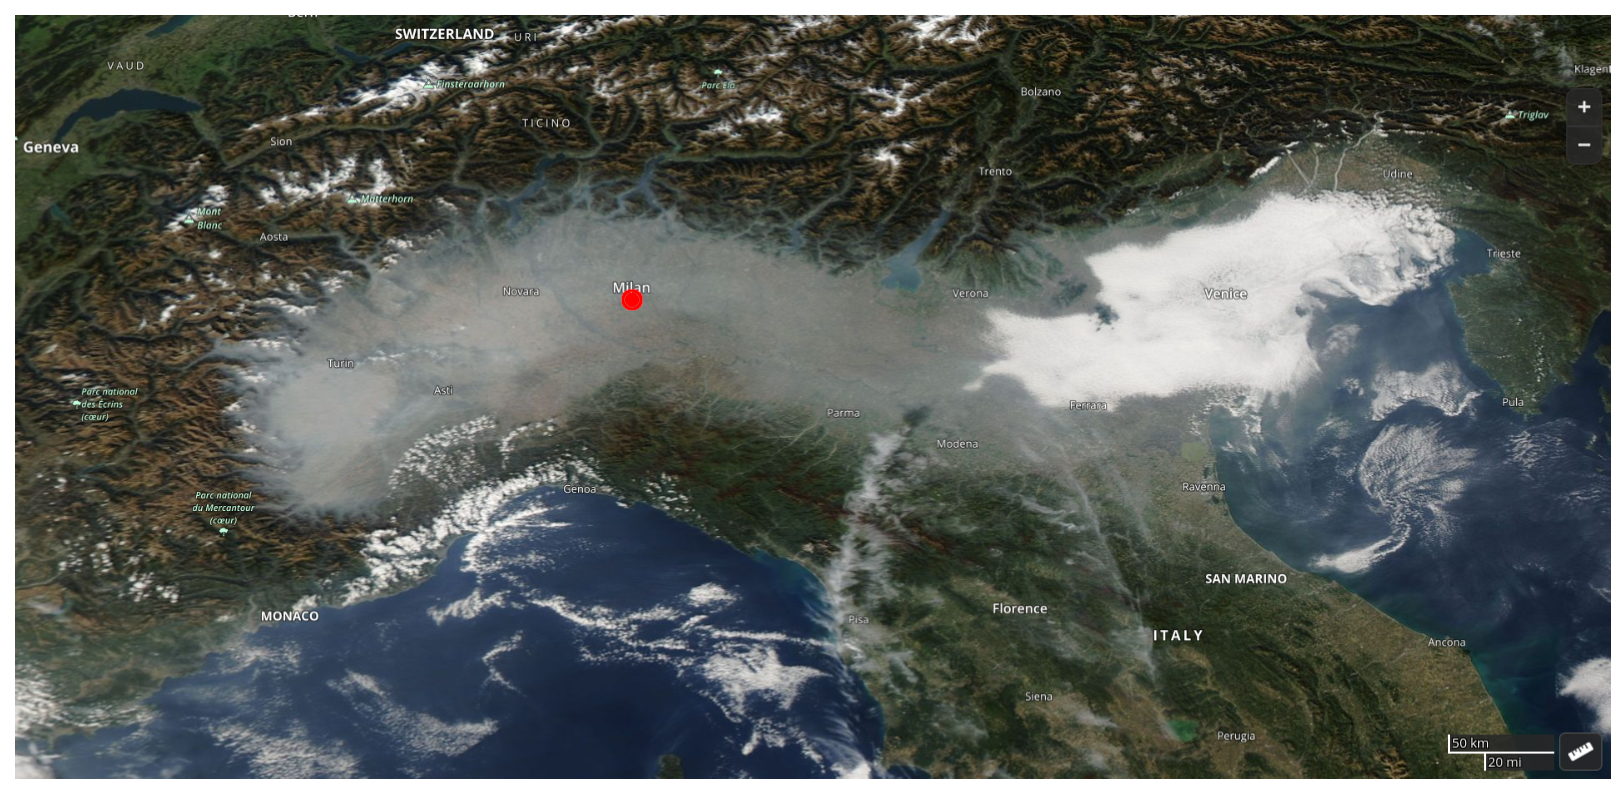
  18. JRC. FACT SHEET: Po River Basin. 2023. Available online: https://water.jrc.ec.europa.eu/pdf/po-fs.pdf (accessed on 20 September 2023).
  19. World Bank. World Bank Country and Lending Groups—World Bank Data Help Desk. 2023. Available online: https://datahelpdesk.worldbank.org/knowledgebase/articles/906519-world-bank-country-and-lending-groups (accessed on 19 September 2023).
  20. Farsiabi, M. Essays on Health Care Expenditures and Quality of the Environment; Wayne State University: Detroit, MI, USA, 2021. [Google Scholar]
  21. European Commission. Level-0 Processing and Products. 2021. Available online: https://sentinel.esa.int/web/sentinel/technical-guides/sentinel-5p/products-algorithms/level-0 (accessed on 12 August 2023).
  22. Kramer, H.J. Copernicus: Sentinel-5P (Precursor—Atmospheric Monitoring Mission); Copernicus: Sentinel-5P—Satellite Missions— eoPortal Directory: Paris, France, 2022; Available online: https://directory.eoportal.org/web/eoportal/satellite-missions/c-missions/copernicus-sentinel-5p (accessed on 20 September 2023).
  23. Langen, J.; Meijer, Y.; Veihelmann, B.; Ingman, P. Copernicus Sentinels 4 and 5 Mission Requirements Traceability Document. 2017. Available online: https://sentinels.copernicus.eu/documents/247904/2506504/Copernicus-Sentinels-4-and-5-Mission-Requirements-Traceability-Document.pdf/b15b6786-88cd-4f1d-a67e-a1da70ed595b?t=1531155774000 (accessed on 13 October 2023).
  24. ESA. Validation—Sentinel-5P Technical Guide—Sentinel Online. 2023. Available online: https://copernicus.eu/technical-guides/sentinel-5p/validation (accessed on 13 October 2023).
  25. Copernicus EU. Climate Reanalysis | Copernicus. 2023. Available online: https://climate.copernicus.eu/climate-reanalysis (accessed on 23 September 2023).
  26. Hersbach, H.; Bell, B.; Berrisford, P.; Hirahara, S.; Horányi, A.; Muñoz-Sabater, J.; Nicolas, J.; Peubey, C.; Radu, R.; Schepers, D.; et al. The ERA5 global reanalysis. Q. J. R. Meteorol. Soc. 2020, 146, 1999–2049. [Google Scholar] [CrossRef]
  27. Setchell, H. ECMWF Reanalysis v5. 2020. Available online: https://www.ecmwf.int/en/forecasts/dataset/ecmwf-reanalysis-v5 (accessed on 23 September 2023).
  28. ARPA Lombardia. Rete di Monitoraggio della Qualità dell’Aria. 2023. Available online: https://www.arpalombardia.it/temi-ambientali/aria/rete-di-rilevamento/ (accessed on 24 September 2023).
  29. ARPA Lombardia. Rapporto Qualità dell’Aria in Lombardia. 2022. Available online: https://www.arpalombardia.it/agenda/notizie/2023/qualita-dell-aria-2022-in-lombardia-trend-costante-per-pm10-e-migliorano-i-livelli-no2/ (accessed on 24 September 2023).
  30. Pierce, A.M.; Loría-Salazar, S.M.; Holmes, H.A.; Gustin, M.S. Investigating horizontal and vertical pollution gradients in the atmosphere associated with an urban location in complex terrain, Reno, Nevada, USA. Atmos. Environ. 2019, 196, 103–117. [Google Scholar] [CrossRef]
  31. Wu, M.; Zhang, G.; Wang, L.; Liu, X.; Wu, Z. Influencing Factors on Airflow and Pollutant Dispersion around Buildings under the Combined Effect of Wind and Buoyancy—A Review. Int. J. Environ. Res. Public Health 2022, 19, 12895. [Google Scholar] [CrossRef]
  32. Sun, H.; Wang, J.; Sheng, L.; Jiang, Q. A Comparative Study on Four Methods of Boundary Layer Height Calculation in Autumn and Winter under Different PM2.5 Pollution Levels in Xi’an, China. Atmosphere 2023, 14, 728. [Google Scholar] [CrossRef]
  33. CMM. Territorio e Comuni. 2023. Available online: https://www.cittametropolitana.mi.it/portale/territorio/index.html (accessed on 3 November 2023).
  34. Volovici, V.; Syn, N.L.; Ercole, A.; Zhao, J.J.; Liu, N. Steps to avoid overuse and misuse of machine learning in clinical research | Nature Medicine. Nat. Med. 2022, 28, 1996–1999. [Google Scholar] [CrossRef]
  35. Shi, C.; Lu, W.; Song, R. Breaking the curse of nonregularity with subagging—Inference of the mean outcome under optimal treatment. J. Mach. Learn. Res. 2020, 21, 176:7122–176:7188. [Google Scholar]
  36. Van Der Heijden, M.; Miedema, D.M.; Waclaw, B.; Veenstra, V.L.; Lecca, M.C.; Nijman, L.E.; Van Dijk, E.; Van Neerven, S.M.; Lodestijn, S.C.; Lenos, K.J.; et al. Spatiotemporal regulation of clonogenicity in colorectal cancer xenografts. Proc. Natl. Acad. Sci. USA 2019, 116, 6140–6145. [Google Scholar] [CrossRef] [PubMed]
  37. Gholap, T.B.; Salokhe, R.V.; Ghadage, G.V.; Mane, S.V.; Bajaj, D.K.; Sahoo, D. Computational Aerodynamics of an AK-47 Rifle’s 7.82 mm Bullet in Proximity to a Near Wall. In Proceedings of the 2021 IEEE Pune Section International Conference (PuneCon), Pune, India, 16–19 December 2021; pp. 1–6. [Google Scholar] [CrossRef]
  38. Zeng, X.; Yi, P.; Hong, Y.; Xie, L. Continuous-Time Distributed Algorithms for Extended Monotropic Optimization Problems. arXiv 2016, arXiv:1608.01167. [Google Scholar] [CrossRef]
  39. Scikit-Learn Developers. Sklearn-Ensemble-StackingRegressor. 2023. Available online: https://scikit-learn/stable/modules/generated/sklearn.ensemble.StackingRegressor.html (accessed on 25 September 2023).
  40. Auzzi, R.; Giveon, A. Superpartner spectrum of minimal gaugino-gauge mediation. J. High Energy Phys. 2011, 2011, 3. [Google Scholar] [CrossRef]
  41. Murphy, K.P. Machine Learning: A Probabilistic Perspective; Massachusetts Institute of Technology: London, UK, 2012. [Google Scholar]
  42. Li, M.; Wu, Y.; Bao, Y.; Liu, B.; Petropoulos, G.P. Near-Surface NO2 Concentration Estimation by Random Forest Modeling and Sentinel-5P and Ancillary Data. Remote Sens. 2022, 14, 3612. [Google Scholar] [CrossRef]
  43. Wang, S.; Li, Y.; Haque, M. Evidence on the Impact of Winter Heating Policy on Air Pollution and Its Dynamic Changes in North China. Sustainability 2019, 11, 2728. [Google Scholar] [CrossRef]
  44. Chi, Y.; Fan, M.; Zhao, C.; Yang, Y.; Fan, H.; Yang, X.; Yang, J.; Tao, J. Machine learning-based estimation of ground-level NO2 concentrations over China. Sci. Total Environ. 2022, 807, 150721. [Google Scholar] [CrossRef] [PubMed]
  45. Jeong, U.; Hong, H. Assessment of Tropospheric Concentrations of NO2 from the TROPOMI/Sentinel-5 Precursor for the Estimation of Long-Term Exposure to Surface NO2 over South Korea. Remote Sens. 2021, 13, 1877. [Google Scholar] [CrossRef]
  46. Griffin, D.; Zhao, X.; McLinden, C.A.; Boersma, F.; Bourassa, A.; Dammers, E.; Degenstein, D.; Eskes, H.; Fehr, L.; Fioletov, V.; et al. High-Resolution Mapping of Nitrogen Dioxide With TROPOMI: First Results and Validation Over the Canadian Oil Sands. Geophys. Res. Lett. 2019, 46, 1049–1060. [Google Scholar] [CrossRef] [PubMed]
Figure 1. Direct consequences when the ground-level atmospheric NO 2 surpasses the limits established by the WHO.
Remotesensing 15 05400 g001
Figure 2. Location of meteorological ground stations according to the World Meteorological Organization [16].
Remotesensing 15 05400 g002
Figure 3. Satellite image (MODIS Aqua radiometer) of the Northern Italy Po Valley showing the aerosol layer entrapped in the area. The location of Milan is indicated with a red circle [15].
Remotesensing 15 05400 g003
Figure 4. NO 2 ground sensors (green and orange markers) belonging to the ARPA Lombardia network. The Sentinel-5P pixels are displayed in blue. The administrative borders of the MCM are outlined in red.
Remotesensing 15 05400 g004
Figure 5. Data preparation, training and verification process.
Remotesensing 15 05400 g005
Figure 6. Quantile–Quantile Plots comparing data distribution of training period against testing period. The blue dots correspond to one quantile of the first distribution against the same quantile of the second distribution. The red line is used as a reference to represent an ideal linear relationship between the distributions. The image on the (a) compares the totality of the training against the testing period using chronological data splitting. The image on the (b) compares the period from 7 March 2021 until 28 September 2021 against the same dates of 2022.
Remotesensing 15 05400 g006
Figure 7. Metropolitan City of Milan average NO 2 air concentration measurements time-series.
Remotesensing 15 05400 g007
Figure 8. Quantile –Quantile Plots comparing data distribution of training period against testing period. The blue dots correspond to one quantile of the first distribution against the same quantile of the second distribution. The red line is used as a reference to represent an ideal linear relationship between the distributions. (a) Quantile-Quantile Plot comparing data distribution of 1 January 2019 until 13 November 2022 as the training period against 14 November 2022 until 25 April 2023 as the testing period. (b) Quantile-Quantile Plot comparing data distribution of training vs. testing data using random extraction.
Remotesensing 15 05400 g008
Figure 9. Box-plots of the testing datasets. (a) Boxplots for the ARPA NO 2 testing data obtained by chronological data splitting. (b) Boxplots for the ARPA NO 2 testing data obtained by random data splitting.
Remotesensing 15 05400 g009
Figure 10. Atmospheric NO 2 ground-level estimation for the selected sensors from 12:00 h to 15:00 h UTC+1.
Remotesensing 15 05400 g010
Table 1. Pearson correlation coefficients ( ρ p ) and Spearman correlation coefficients ( ρ s ) of Sentinel-5P measurements with respect to ARPA Lombardia atmospheric NO 2 ground measurements at the time of passage of the satellite.
ρ p ρ s
2019202020192020
mean0.720.760.740.79
median0.750.790.780.83
standard deviation0.110.150.120.14
Table 2. Pearson correlation coefficient ρ p of meteorological indicators with respect to the ARPA Lombardia atmospheric NO 2 measurements.
Meteorological VariablePearson Correlation ( ρ p )
Sentinel-5P NO 2 0.83
Current Values 1
Temperature−0.68
Surface solar radiation−0.63
Surface thermal radiation0.14
Surface pressure0.31
Total precipitation−0.05
Wind direction−0.020
Wind speed0.20
Prior Values 2
Temperature0.70
Surface solar radiation−0.65
Surface thermal radiation0.19
Surface pressure0.31
Total precipitation−0.12
Wind direction0.18
Wind speed−0.19
1 Current values refer to those measured during the satellite passage time 3 h period. 2 Prior valures refer to those measured during the 21 h period prior to the passage of the satellite.
Table 3. Statistics for atmospheric NO 2 of the MCM measured by ARPA Lombardia network.
Whole PeriodValue (µg/m 3 )
Mean26.95
Median20.33
Minimum2.75
Maximum107.57
Standard Deviation18.45
Training PeriodChronological Splitting
(µg/m 3 )
Random Splitting
(µg/m 3 )
Mean28.3825.09
Median21.4119.35
Minimum2.750.10
Maximum107.57134.17
Standard Deviation19.4518.29
Testing PeriodChronological Splitting
(µg/m 3 )
Random Splitting
(µg/m 3 )
Mean19.9026.83
Median17.1219.87
Minimum7.571.09
Maximum58.54114.24
Standard Deviation9.0620.30
Table 4. RMSE and NRMSE (%) obtained for the atmospheric average MCM NO 2 ground level estimation.
Regression MethodRMSE
(Training Average MCM)
RMSE
(Training Separate Sensors)
B-spline Linear Regression6.547.31
Krigging Linear Regression5.738.00
Random Forest6.288.22
Decision Trees Regression8.4513.42
Support Vector Regression5.567.53
Gradient Tree Boosting6.058.61
Multi-layer Perceptron Regression6.047.38
Voting (SVR + MLPR)6.028.12
Stacking (SVR + MLPR)5.978.06
RF feature selection + Voting (SVR + MLPR)5.537.24
Table 5. RMSE and NRMSE (%) obtained for the atmospheric NO 2 ground level estimation for each of the sensor locations.
Chronological ExtractionRandom Extraction
Sensor IDMeasureCurrent ModelOnly SatelliteCurrent ModelOnly Satellite
5504NRMSE (%)81.4682.5259.9069.41
RMSE (µg/m 3 )9.689.8013.8316.02
5507NRMSE (%)64.3861.5546.0061.00
RMSE (µg/m 3 )6.896.5911.1014.72
5517NRMSE (%)92.56114.1550.5264.44
RMSE (µg/m 3 )6.778.3510.5613.48
5520NRMSE (%)288.44285.1475.0273.49
RMSE (µg/m 3 )8.868.769.289.09
5531NRMSE (%)77.8493.0452.4261.11
RMSE (µg/m 3 )6.047.2210.0611.73
5534NRMSE (%)92.6386.5252.5153.43
RMSE (µg/m 3 )6.175.769.629.79
5547NRMSE (%)68.4673.3745.9261.01
RMSE (µg/m 3 )6.877.3711.1414.80
5548NRMSE (%)235.02204.4463.6862.82
RMSE (µg/m 3 )4.573.987.117.02
5549NRMSE (%)86.4095.9350.9762.41
RMSE (µg/m 3 )4.174.637.318.95
5554NRMSE (%)196.28194.2746.3663.46
RMSE (µg/m 3 )7.036.968.1711.19
5609NRMSE (%)95.0394.2157.3567.02
RMSE (µg/m 3 )6.736.688.6210.07
9999NRMSE (%)125.59127.3279.3184.08
RMSE (µg/m 3 )8.778.8911.9812.70
10279NRMSE (%)76.1572.9147.0155.65
RMSE (µg/m 3 )7.467.1410.3512.26
Table 6. Standard deviations and test data size (in days) for each sensor location using random splitting.
Sensor IDSD Chronological ExtractionSD Random ExtractionTest Data Size (Days)
550411.8823.09160
550710.7124.13161
55177.3220.91156
55203.0712.3767
55317.7619.20164
55346.6618.32161
554710.0424.26157
55481.9411.1769
55494.8314.3569
55543.5817.6370
56097.0915.03164
99996.9815.11147
102799.8022.03150
Table 7. Pearson Correlation Coefficient ( ρ p ) and R 2 obtained for the atmospheric NO 2 ground level estimation for each of the sensor locations.
Sensor IDPearson Correlation ( ρ p )R 2
55040.830.70
55070.900.81
55170.860.74
55200.890.80
55310.860.74
55340.910.83
55470.890.80
55480.850.73
55490.860.75
55540.890.80
56090.860.75
99990.740.55
102790.900.81
Mean0.870.76
Disclaimer/Publisher’s Note: The statements, opinions and data contained in all publications are solely those of the individual author(s) and contributor(s) and not of MDPI and/or the editor(s). MDPI and/or the editor(s) disclaim responsibility for any injury to people or property resulting from any ideas, methods, instructions or products referred to in the content.

