Article

Multiscale Evaluation of Gridded Precipitation Datasets across Varied Elevation Zones in Central Asia’s Hilly Region

by
Manuchekhr Gulakhmadov
1,2,3,4,5,
Xi Chen
1,2,3,*,
Aminjon Gulakhmadov
1,2,4,6,
Muhammad Umar Nadeem
7,8,
Nekruz Gulahmadov
1,3,4 and
Tie Liu
1,2,3
1
State Key Laboratory of Desert and Oasis Ecology, Xinjiang Institute of Ecology and Geography, Chinese Academy of Sciences, Urumqi 830011, China
2
Research Center for Ecology and Environment of Central Asia, Xinjiang Institute of Ecology and Geography, Chinese Academy of Sciences, Urumqi 830011, China
3
University of Chinese Academy of Sciences, Beijing 100049, China
4
Institute of Water Problems, Hydropower, and Ecology of the Academy of Sciences of the Republic of Tajikistan, Dushanbe 734042, Tajikistan
5
Committee for Environmental Protection under the Government of the Republic of Tajikistan, Dushanbe 734034, Tajikistan
6
Department of Hydraulics and Hydro Informatics, “Tashkent Institute of Irrigation and Agricultural Mechanization Engineers”, National Research University, Tashkent 60111496, Uzbekistan
7
Department of Engineering Mechanics and Energy, System and Information Engineering, University of Tsukuba, Ibaraki 305-8577, Japan
8
Climate, Energy and Water Research Institute, National Agriculture Research Center, Islamabad 44000, Pakistan
*
Author to whom correspondence should be addressed.
Remote Sens. 2023, 15(20), 4990; https://doi.org/10.3390/rs15204990
Submission received: 5 September 2023 / Revised: 7 October 2023 / Accepted: 11 October 2023 / Published: 17 October 2023
(This article belongs to the Special Issue Applications of Remotely Sensed Data in Hydrology and Climatology II)

Abstract

:
The lack of observed data makes research on the cryosphere and ecology extremely difficult, especially in Central Asia’s hilly regions. Before their direct hydroclimatic uses, the performance study of gridded precipitation datasets (GPDS) is of utmost importance. This study assessed the multiscale ground evaluation of three reanalysis datasets (ERA5, MEERA2, and APHRO) and five satellite datasets (PERSIANN-PDIR, CHIRPS, GPM-SM2Rain, SM2Rain-ASCAT, and SM2Rain-CCI). Several temporal scales (daily, monthly, seasonal (winter, spring, summer, autumn), and annual) of all the GPDS were analyzed across the complete spatial domain and point-to-pixel scale from January 2000 to December 2013. The validation of GPDS was evaluated using evaluation indices (Root Mean Square Error, correlation coefficient, bias, and relative bias) and categorical indices (False Alarm Ratio, Probability of Detection, success ratio, and Critical Success Index). The performance of all GPDS was also analyzed based on different elevation zones (≤1500, ≤2500, >2500 m). According to the results, the daily estimations of the spatiotemporal tracking abilities of CHIRPS, APHRO, and GPM-SM2Rain are superior to those of the other datasets. All GPDS performed better on a monthly scale than they performed on a daily scale when the ranges were adequate (CC > 0.7 and r-BIAS (10)). Apart from the winter season, the CHIRPS beat all the other GPDS in standings of POD on a daily and seasonal scale. In the summer, all GPDS showed underestimations, but GPM showed the biggest underestimation (−70). Additionally, the CHIRPS indicated the best overall performance across all seasons. As shown by the probability density function (PDF %), all GPDS demonstrated more adequate performance in catching the light precipitation (>2 mm/day) events. APHRO and SM2Rain-CCI typically function moderately at low elevations, whereas all GPDS showed underestimation across the highest elevation >2500 m. As an outcome, we strongly suggest employing the CHIRPS precipitation product’s daily, and monthly estimates for hydroclimatic applications over the hilly region of Tajikistan.

1. Introduction

Precipitation is a very important aspect of the water cycle on a global scale [1]. Precipitation refills underground aquifers, a primary source of rivers and lakes, and supplies water to living inhabitants [2]. The most crucial climatic factor is precipitation due to its potential to increase agricultural productivity, provide drinking water, and maintain ecological equilibrium [3]. The chance of flooding, which can result in injury, drowning, and other disastrous flood-related effects, could also be raised by overcast precipitation, which could also cause crop impairment, soil destruction, stern drought occurrences, and so on [4]. Therefore, it is essential to measure and monitor the amount of precipitation, its regional distribution, and its temporal variability [5,6]. According to historians, scholars, and experts in the fields of hydrology and climatology, the most trustworthy source of precipitation measurements is precipitation data that are based on observations at ground-based recording locations [7]. In the realm of hydrology and climatology, it is widely acknowledged that the most reliable source of precipitation data is grounded in observations from terrestrial recording stations [8]. However, in practice, maintaining a consistent gauge network across diverse terrains and challenging topographies remains an arduous task [9]. It is against this backdrop that gridded precipitation datasets (GPDS) have emerged as a promising solution to bridge gaps in precipitation information. The performance of GPDS is influenced by a plethora of factors, including terrain characteristics, altitude, geographic features, precipitation patterns, and, notably, spatial resolution [10].
However, the pursuit of trustworthy precipitation data becomes a formidable challenge in the face of complex landscapes and a sparse gauge network [11]. In regions like the Pamir-Alay Mountains of Tajikistan, precipitation data collection is hampered by irregular or inadequate meteorological station installations [12]. This prompts the exploration of GPDS to compensate for the shortage of precipitation records [13,14,15,16]. Yet, the GPDS, despite their potential, require a rigorous evaluation of their effectiveness before their direct application can be deemed reliable [13]. In the modern era, numerous GPDS are readily accessible on official websites [14,15,16,17,18,19], incorporating sophisticated techniques for precipitation estimation. The GPDS now employ a more accurate technique for estimating precipitation [20,21,22,23]. These days, GPDS feed signals from IR and MW sensors into a sophisticated algorithm for estimating precipitation [24,25], which results in accurate data on a fine spatiotemporal scale. CHIRPS and MEERA2 are two examples of the many GPDS that are accessible from organizations (NASA and JAXA) for a variety of hydro-climatic applications [14]. Additionally, to produce continuous precipitation estimations. Together, IR and MW sensor data can be used for precipitation estimation from remotely sensed information using artificial neural networks [26,27]. Numerous hydrologists have assessed the effectiveness of numerous GPDS in numerous locations around the globe, including Asia [28], Europe [14], Austria [29], Australia [30], China [31], and Pakistan [32].
A cloud categorization system with adjustable initializations is one of the GPDS that are taken into consideration. As opposed to the traditional method, the irregular limit strategy utilized in PDIR allows the exposure and isolation of cloud processing corners [33]. The CHIRPS dataset offers continuous values of precipitation using data from the pattern of Global Precipitation Measurement (GPM) satellites [34]. It has a resolution of 0.25 and provides almost worldwide coverage. In the past, numerous studies have examined the effectiveness of GPDS in various regions of the world [1,26,35]. The results supported the widely held belief that local topographical and climatic circumstances play a major role in determining how accurate precipitation datasets are. Therefore, it is crucial to assess GPDS’ effectiveness.
To surmount the challenge of gathering precipitation data in rugged terrains and diverse climatic conditions, a comprehensive assessment of the performance of the most recent satellite datasets (PERSIANN-PDIR, CHIRPS, GPM-SM2Rain family products) and reanalysis products (ERA5, MEERA2, and APHRO) over a dense gauge network becomes imperative. Tajikistan, like many regions, confronts threats posed by natural disasters, such as floods, storms, landslides, heatwaves, and droughts, with each capable of inflicting significant harm upon communities, infrastructure, and agriculture [15]. The scarcity of gauge data has hampered research on the impacts of climate change, particularly in emerging nations [12], where unevenly distributed gauge networks further complicate precipitation data collection [21]. This study seeks to bridge this substantial research gap by conducting a comprehensive performance analysis of the latest three reanalysis datasets (ERA5, MEERA2, and APHRO) and five satellite datasets (PERSIANN-PDIR, CHIRPS, GPM-SM2Rain, SM2Rain-ASCAT, and SM2Rain-CCI) over the demanding terrain of Central Asia, specifically Tajikistan. Furthermore, as Tajikistan’s Ministry of Energy and Water Resources embarks on an ambitious program to construct numerous hydrological structures, the absence of in situ meteorological stations in the region poses challenges for various hydroclimatic applications [15,22,23]. This work introduces an innovative dimension by conducting a comprehensive evaluation of multiple advanced precipitation products, with a specific focus on distinct elevation zones. While previous studies have assessed only a limited set of datasets, our research broadens the scope by including PERSIANN, PDIR, CHIRPS, GPM-SM2Rain, SM2Rain-ASCAT, and SM2Rain-CCI [24]. Our in-depth analysis across elevation zones (≤1500, ≤2500, >2500 m) allows for a comprehensive examination of precipitation estimates across varying elevation gradients. This unique approach enhances our understanding of precipitation accuracy and reliability in Tajikistan, providing a more robust assessment of the region’s water resources.
In summary, this study aims to assess and compare the error characteristics of observed precipitation estimates from Tajikistan’s in situ gauge network with those derived from three reanalysis datasets (ERA5, MEERA2, and APHRO) and five satellite datasets (PERSIANN-PDIR, CHIRPS, GPM-and SM2Rain family products). Additionally, it represents the first performance evaluation of these datasets across varied elevation zones (≤1500, ≤2500, >2500 m) of the dense gauge network in Central Asia. The outcomes of this study will be very beneficial to those who create algorithms, meteorologists, and hydrologists, users of GPDS, water conservation techniques, and Tajikistani politicians.

2. Materials and Methodology
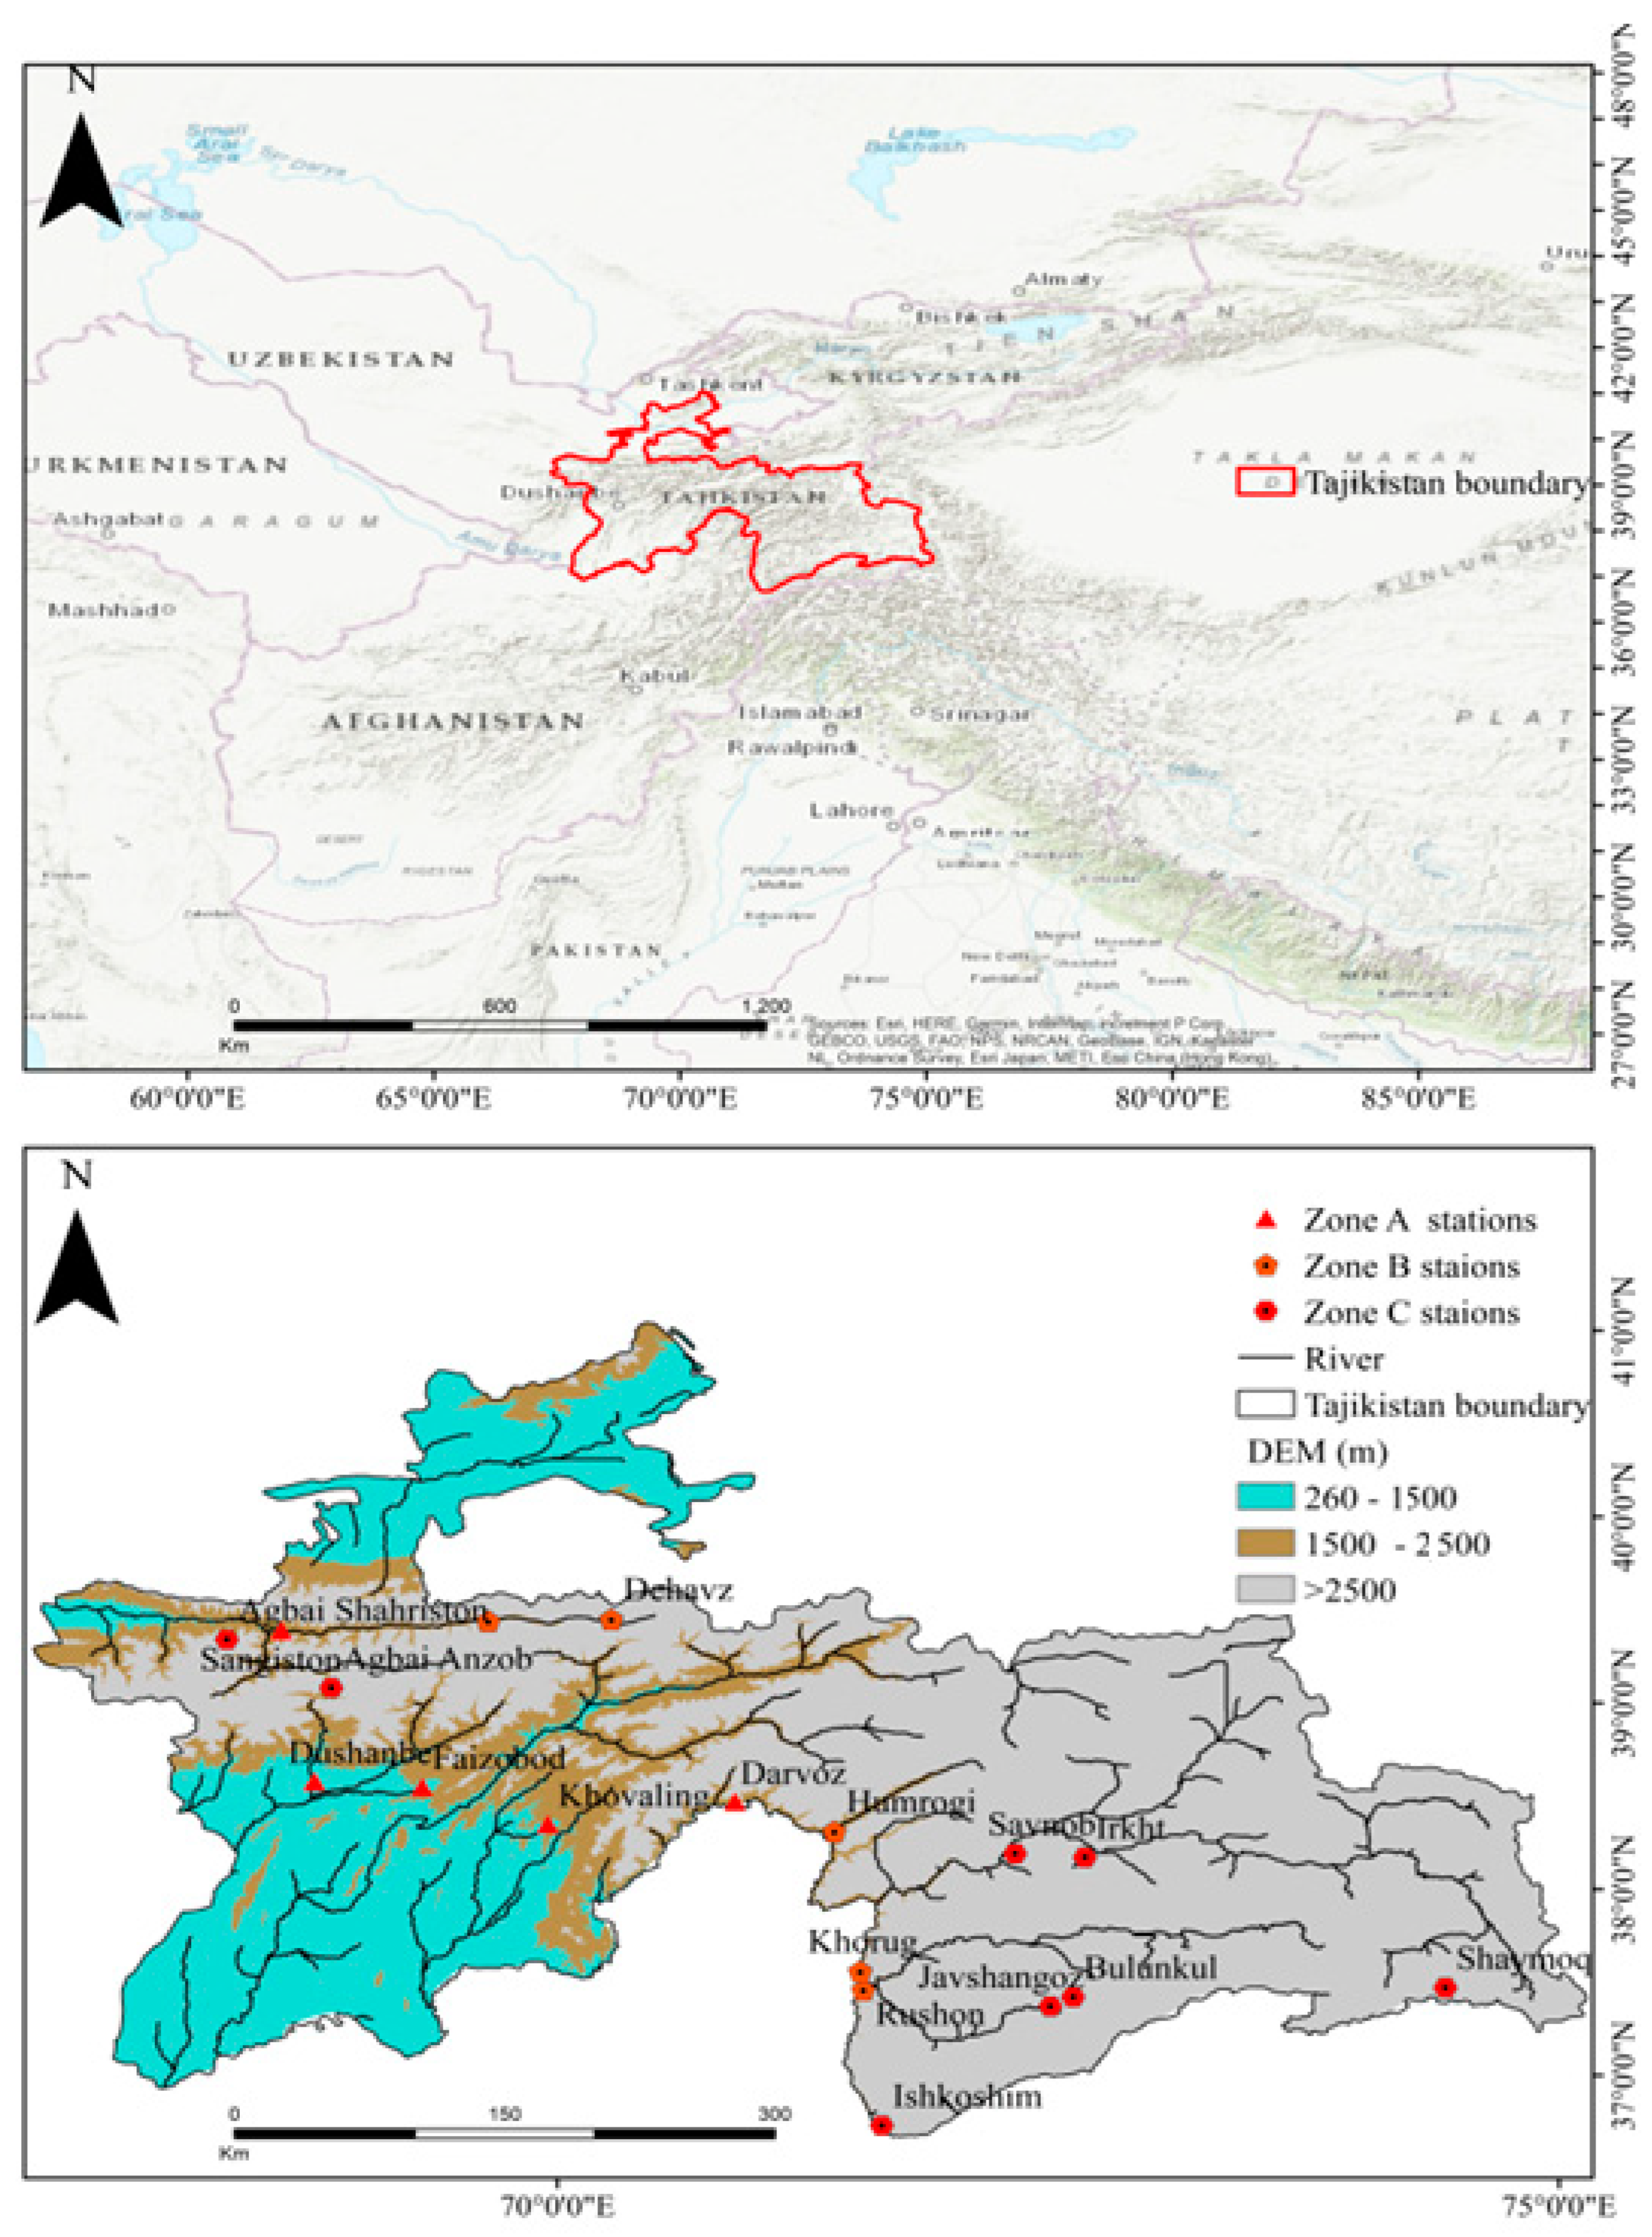
2.1. Study Region

Tajikistan is a rugged surface country in Central Asia due to its mountains. Tajikistan is situated between 36°40′ and 41°05′N and 67°31′ and 75°14′E in the southeast of Central Asia. There are 142,100 km2 in the entire nation. It is important to note that Afghanistan’s territory, which is 15–65 km in width, separates Tajikistan from India and Pakistan to the southeast. The high elevation and abundant precipitation in Tajikistan have a significant effect on the region’s hydrological system [15,22]. Figure 1 shows the salient features of the study area. At an elevation of less than 1000 m, the annual climate regime is characterized by a generally warm air temperature and relatively low precipitation. Precipitation averages 560–650 mm per year between 1200 and 3200 m in elevation. The eastern Pamirs (Murgab region) receive just about 80 mm of precipitation per year at a height of 4000 m. In the central region of Tajikistan, between 1500 and 2000 m in elevation, yearly precipitation reaches 1800 to 2000 mm. Annual precipitation varies across Tajikistan’s many regions. Most of Tajikistan’s plains and foothills see the least amount of precipitation during the eastern summer. March and April are wet months in the foothills and valleys, while April and May are wetter months in the highlands.

2.2. Datasets

There are very few in situ gauge stations in the research area, and those that do exist are mostly weather stations managed by the National Meteorological Service. Daily data were collected from 29 in situ gauging stations. The Tajikistani meteorological service uses a network of standardized gauges that can record both liquid and solid precipitation. The daily data were being measured with calibrated equipment every day. A considerable lack of data (more than 35%) resulted in only 18 meteorological stations’ daily estimations being considered accurate for this performance rating. These measurement-based datasets have previously been extensively utilized in hydroclimatic research in Central Asian mountainous regions. The specific details (period, spatiotemporal resolutions, and data sources of GPDS) are also provided in Table 1. All data was accessed on 13 February 2023. These data sources include five satellite datasets (PERSIANN-PDIR, CHIRPS, GPM-SM2Rain, SM2Rain-ASCAT, and SM2Rain-CCI), as well as three reanalysis datasets (ERA5, MEERA2, and APHRO). Moreover, the yearly average interpolation of all gauging stations is shown in Figure 2. The different algorithms, input data sources, and spatial and temporal resolutions of the eight GPDS have different strengths and weaknesses. For example, IR-based GPDS are less susceptible to cloud cover than MW-based GPDS, but they can be less accurate in regions with high humidity. MW-based GPDS are more accurate in regions with high humidity, but they can be less accurate in regions with high surface emissivity.

2.3. Methods

In anticipation of datasets based on observations, the ground assessment of five satellite-based precipitation datasets (PERSIANN-PDIR, CHIRPS, GPM-SM2Rain, SM2Rain-ASCAT, and SM2Rain-CCI), as well as three reanalysis datasets (ERA5, MEERA2, and APHRO) was assessed. Only GPDS grids with minimum of one gauging station were taken into consideration for this ground assessment using same methods as earlier GPDS evaluations. A grid-to-point matching approach was utilized to add weather stations to the GPDS [36]; this approach was also used in a number of earlier studies [33]. Over the broad network of Central Asia, the estimates of the considered GPDS were contrasted with one another at various spatiotemporal scales. Table 2 provides details on the evaluation indices and categorization indices that were employed to validate the GPDS using gauge estimations. The locations of all the meteorological stations and zone divisions based on different elevations that were taken into consideration for this study are shown in Table 3.
Figure 3 explains the Thiessen polygon method for calculating aerial average precipitation. The gauge weight for each meteorological station was initially calculated using the Thiessen polygon method [30] in ArcGIS 10.8.1. The estimated amount of airborne precipitation was calculated by multiplying the gauge weight for each station by its precipitation. According to the Thiessen polygon method (A), each pixel will be used to record the amount of precipitation in a specific area. As a result, only that region is affected by the amount of precipitation recorded at pixel I. Each pixel’s weight depends on the region of the Thiessen polygon to which it belongs, following the methodology of [37]. For the performance analysis of GPDS in accordance with the WMO (World Meteorological Organization conventions), the standards for daily precipitation scales for low (2 mm/day), medium (>10 mm/day), and heavy precipitation were (>10 mm/day) used [27]. To evaluate the results of category indices using classified indices, ref. [5] devised the presentation graph.

3. Results

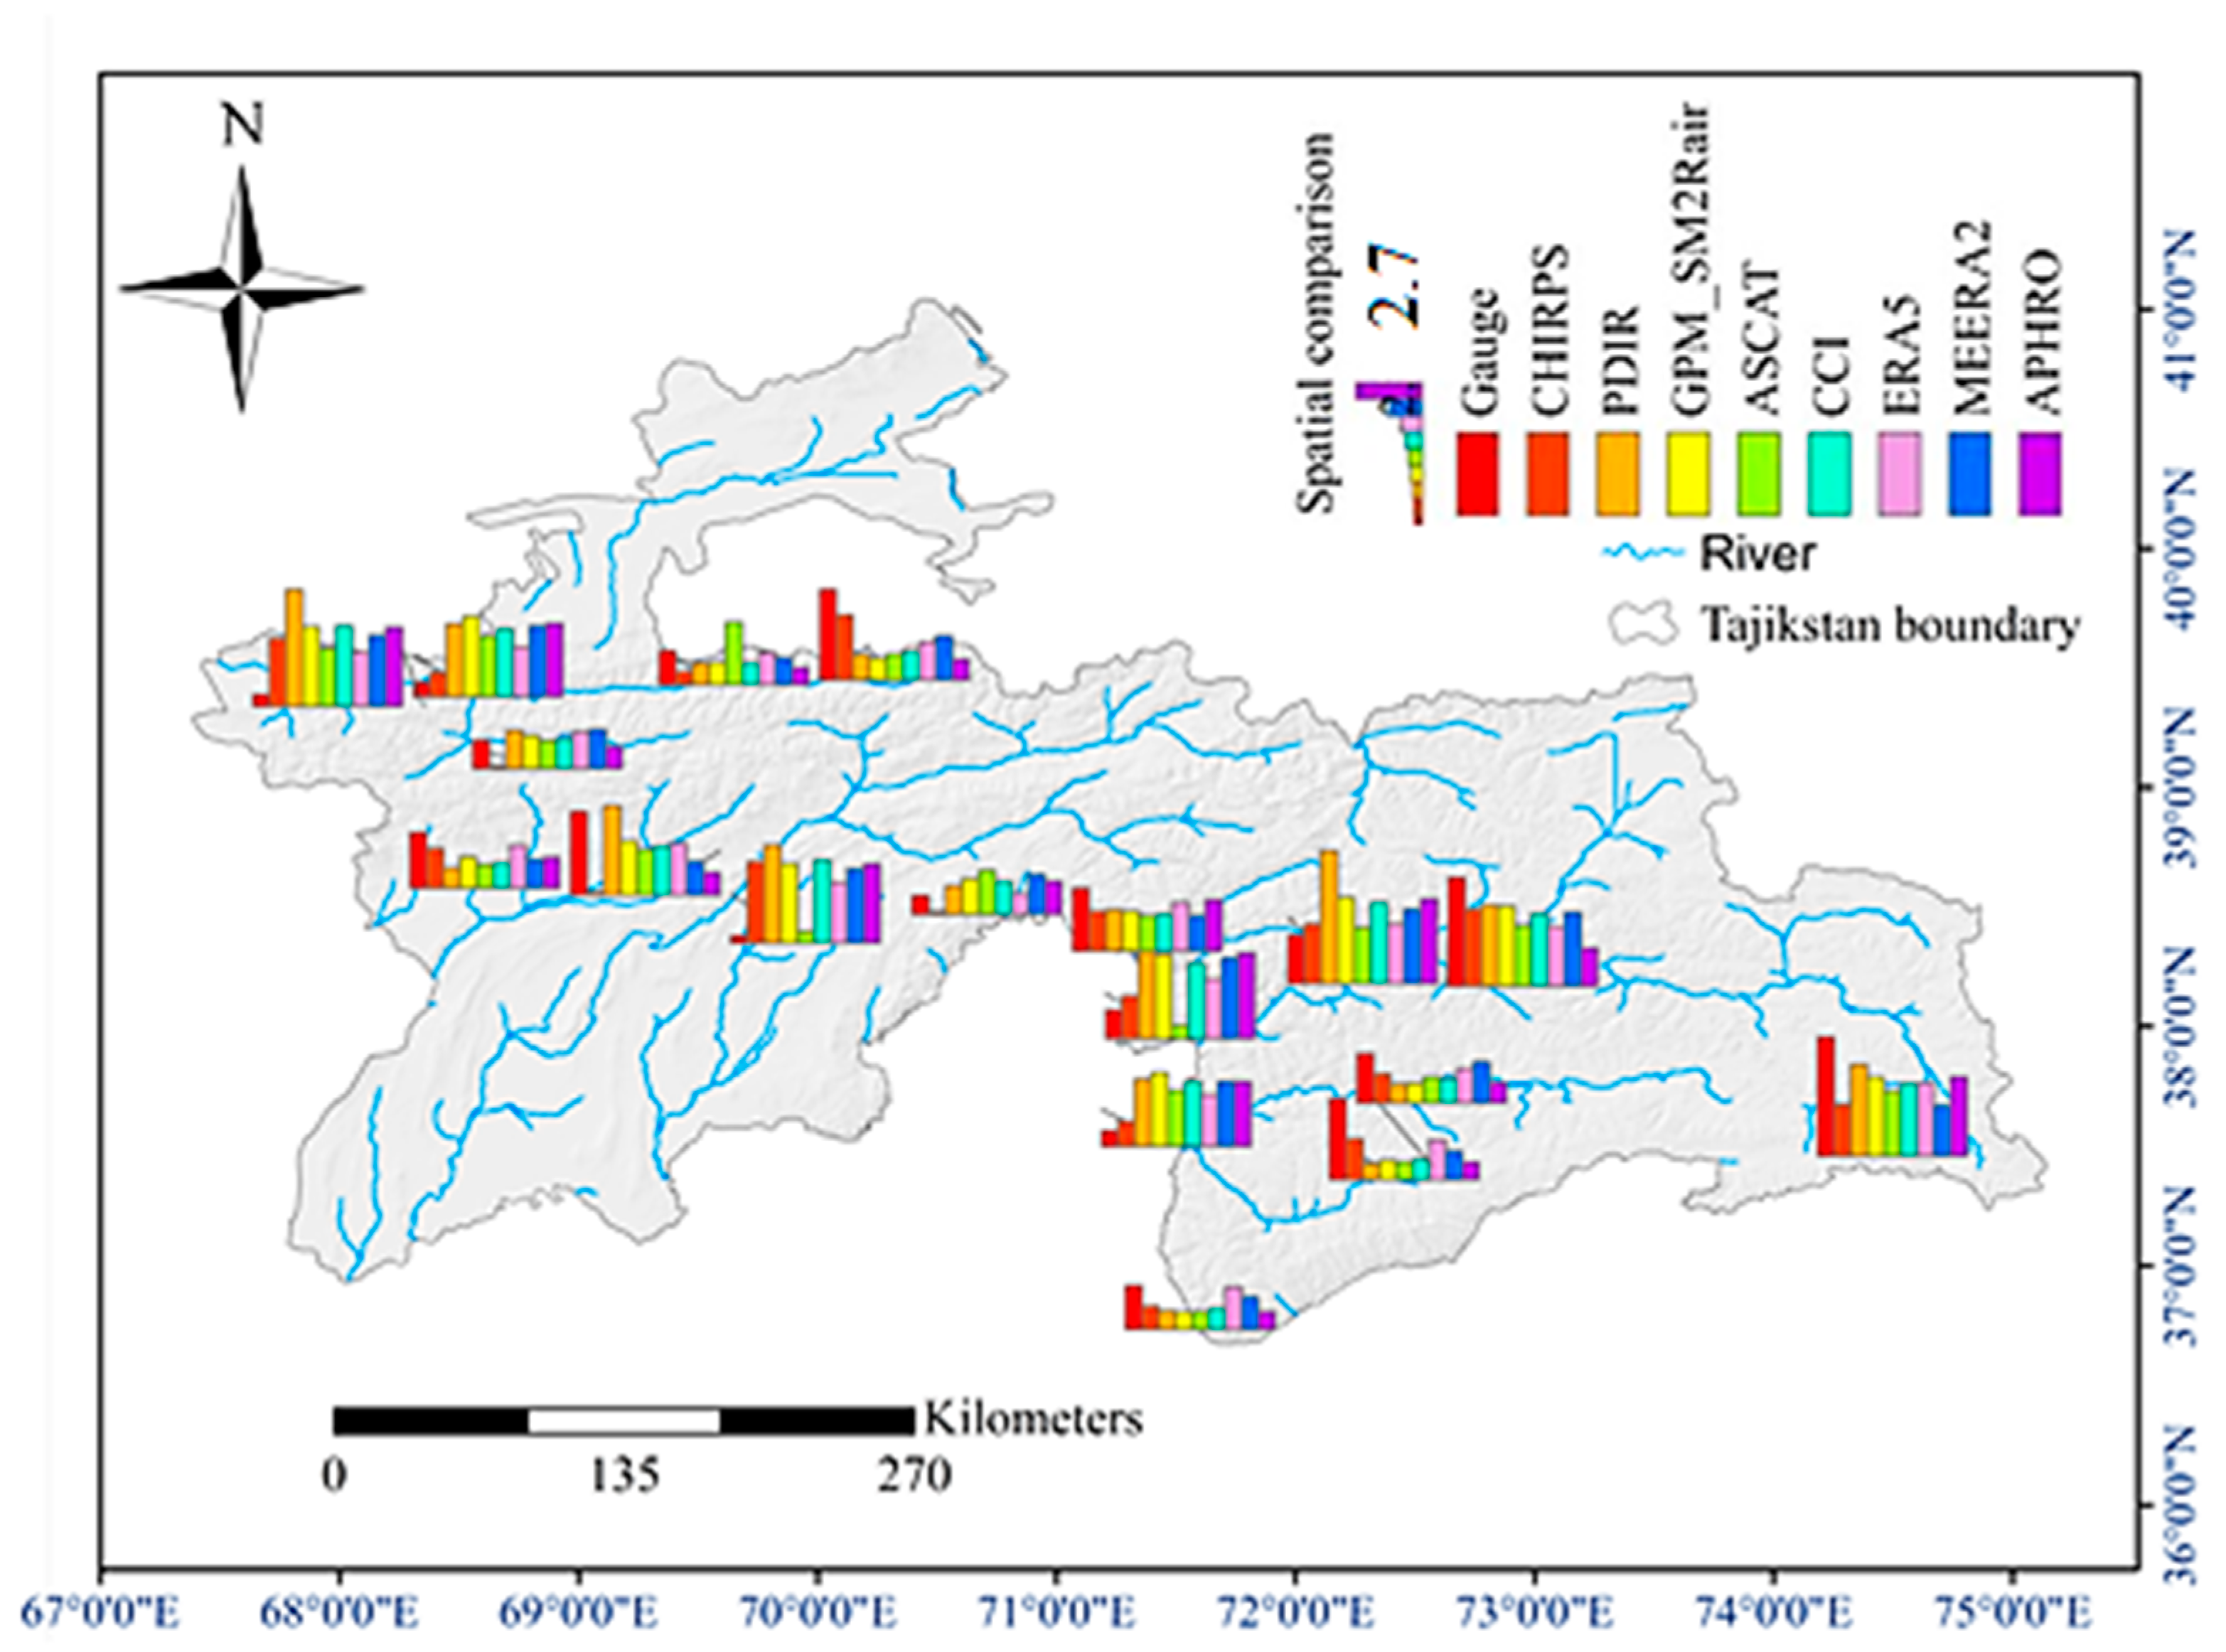
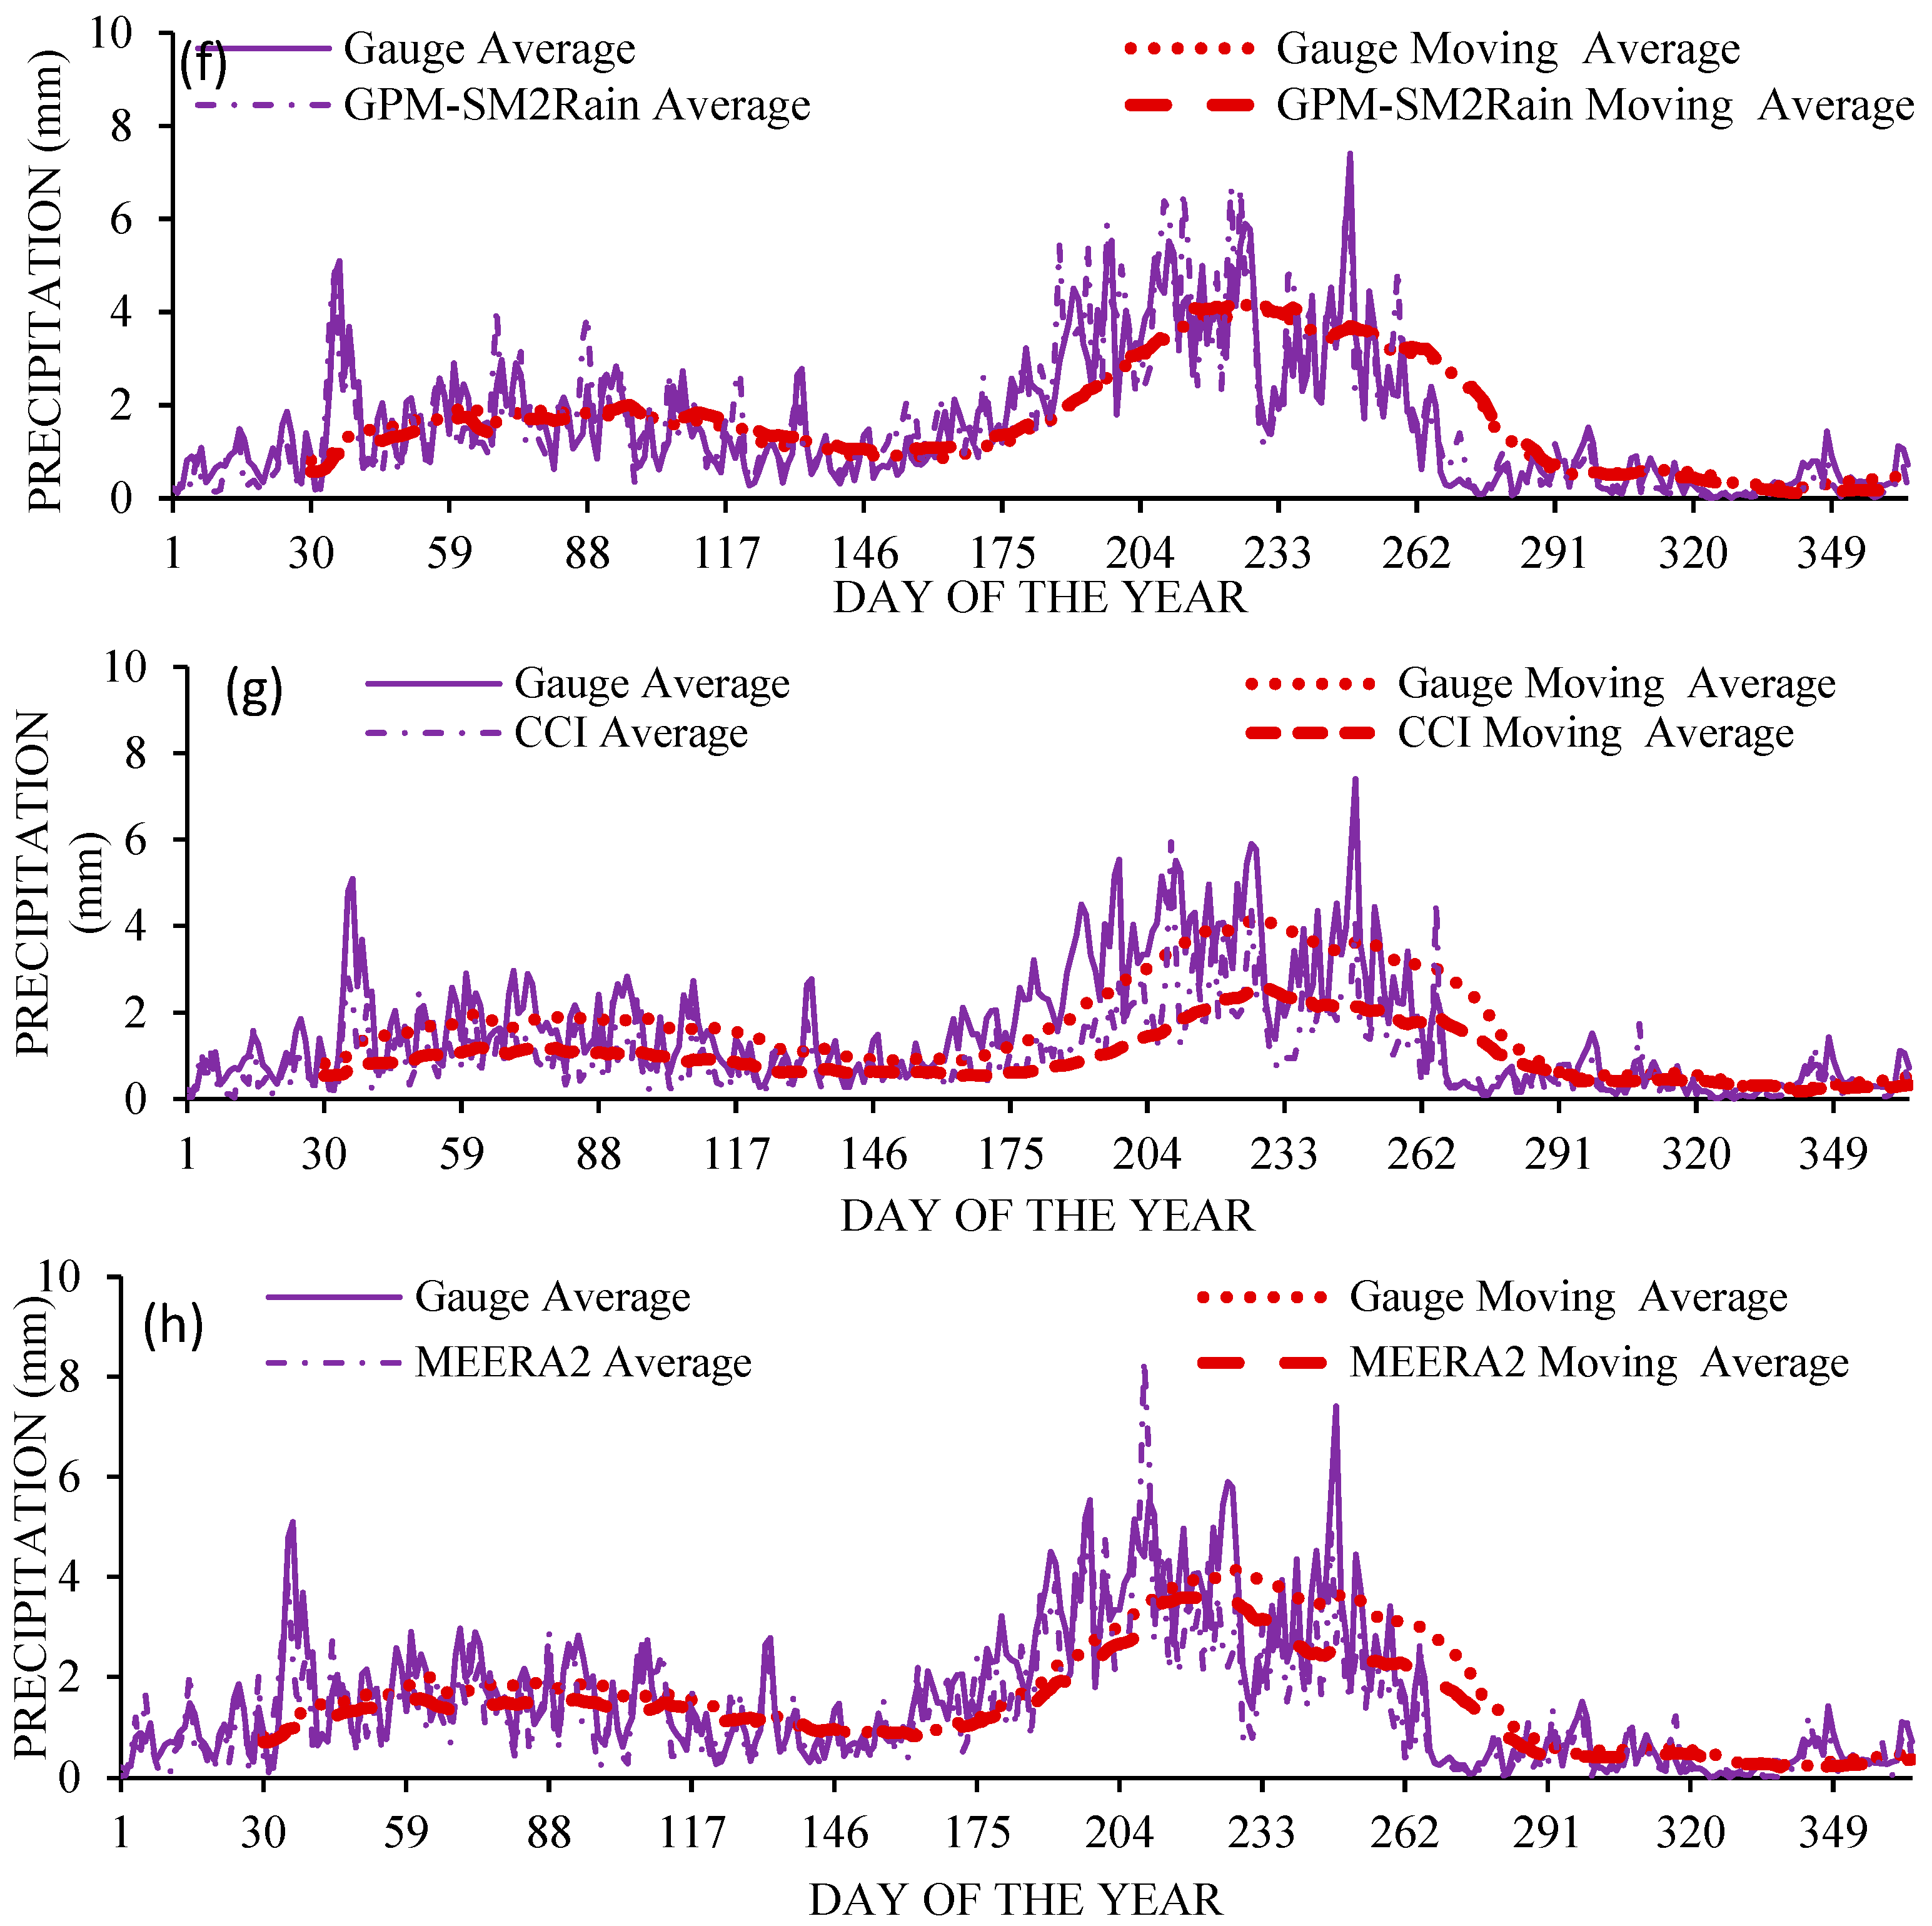
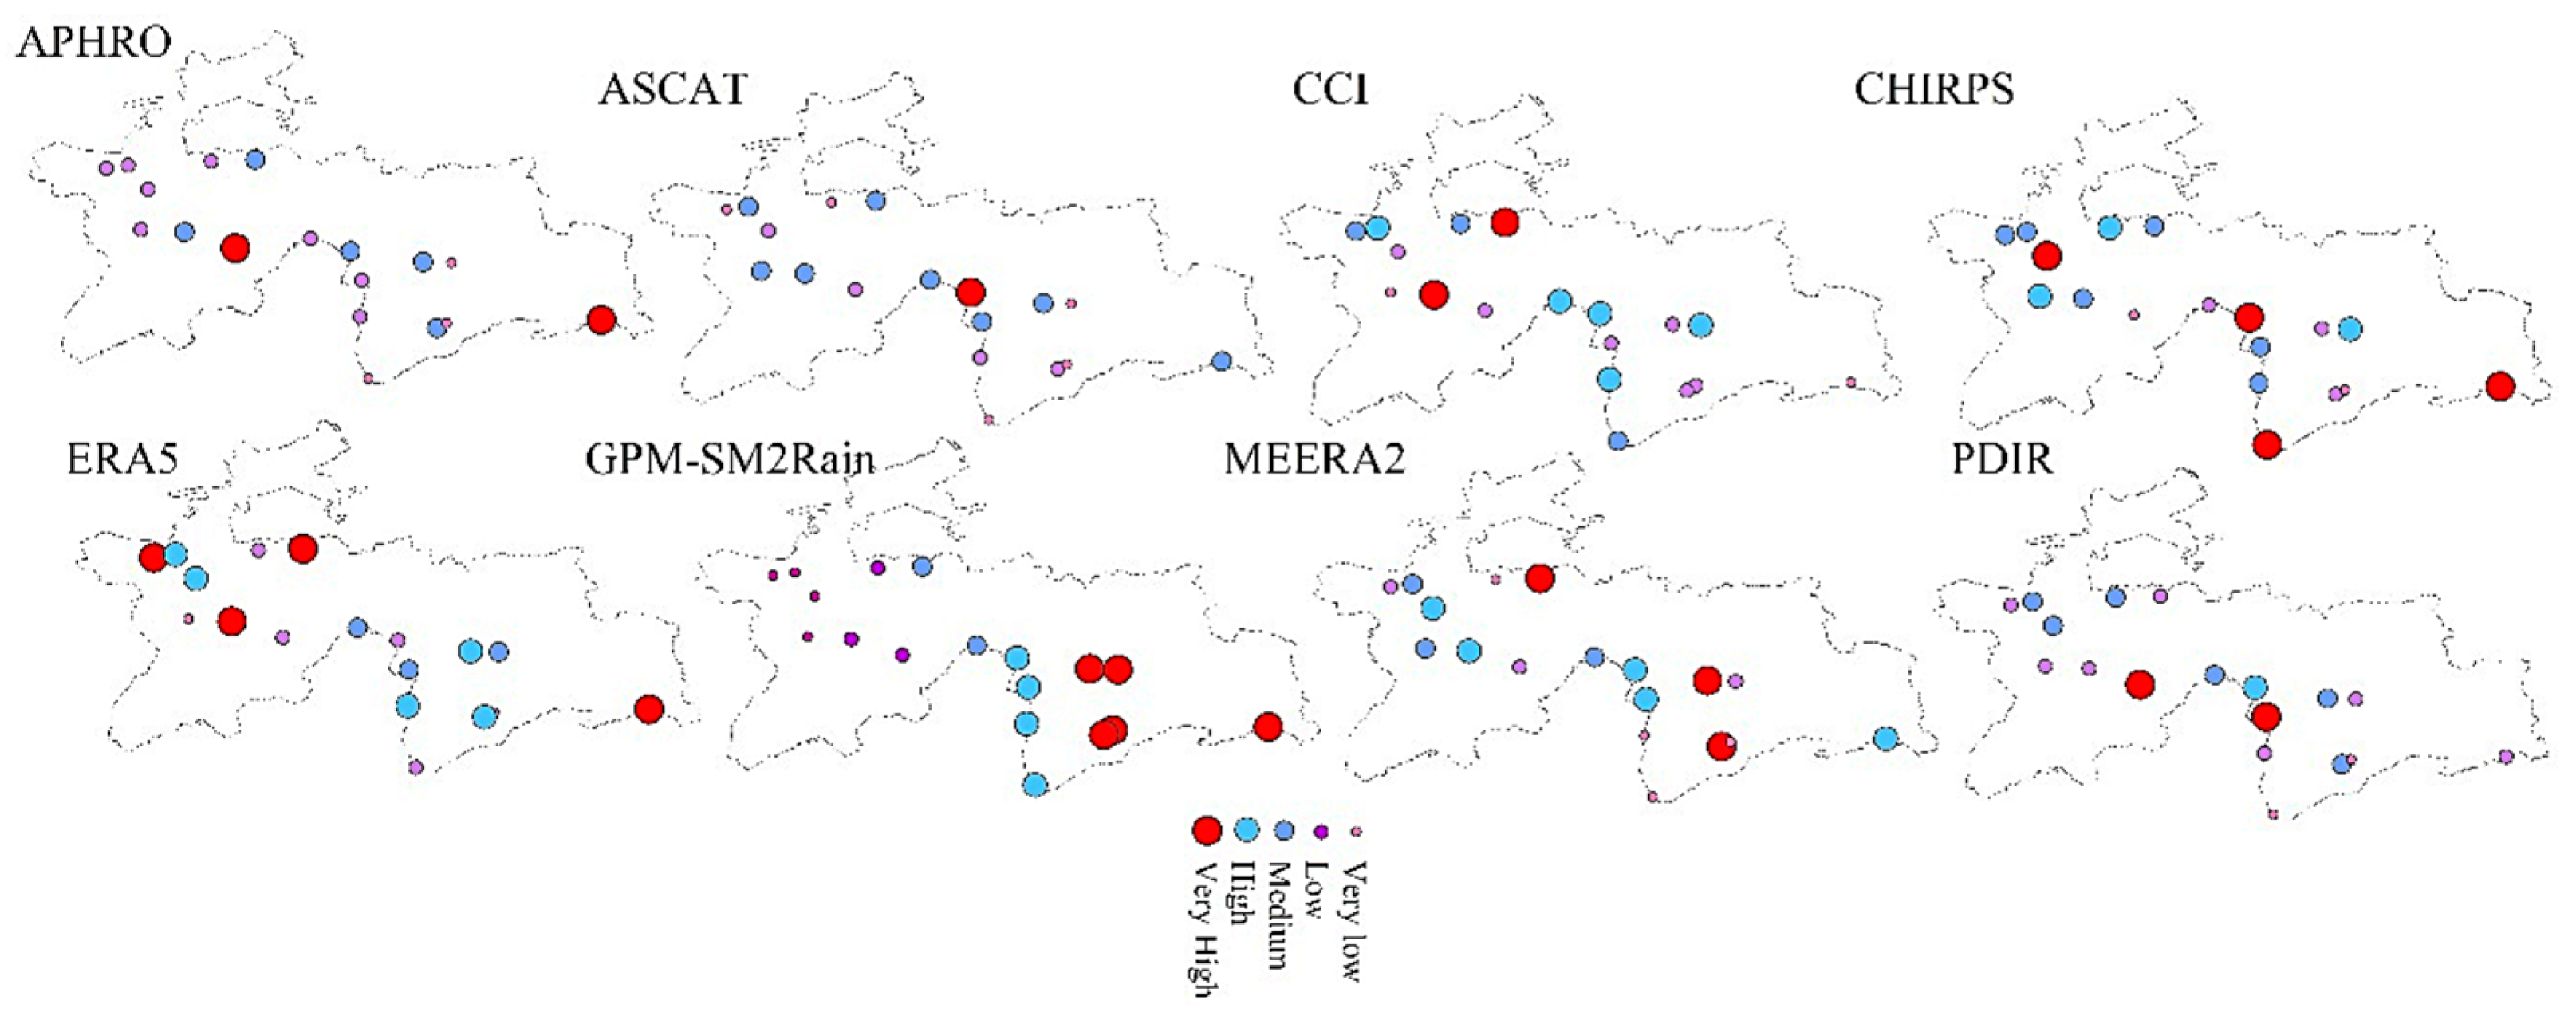
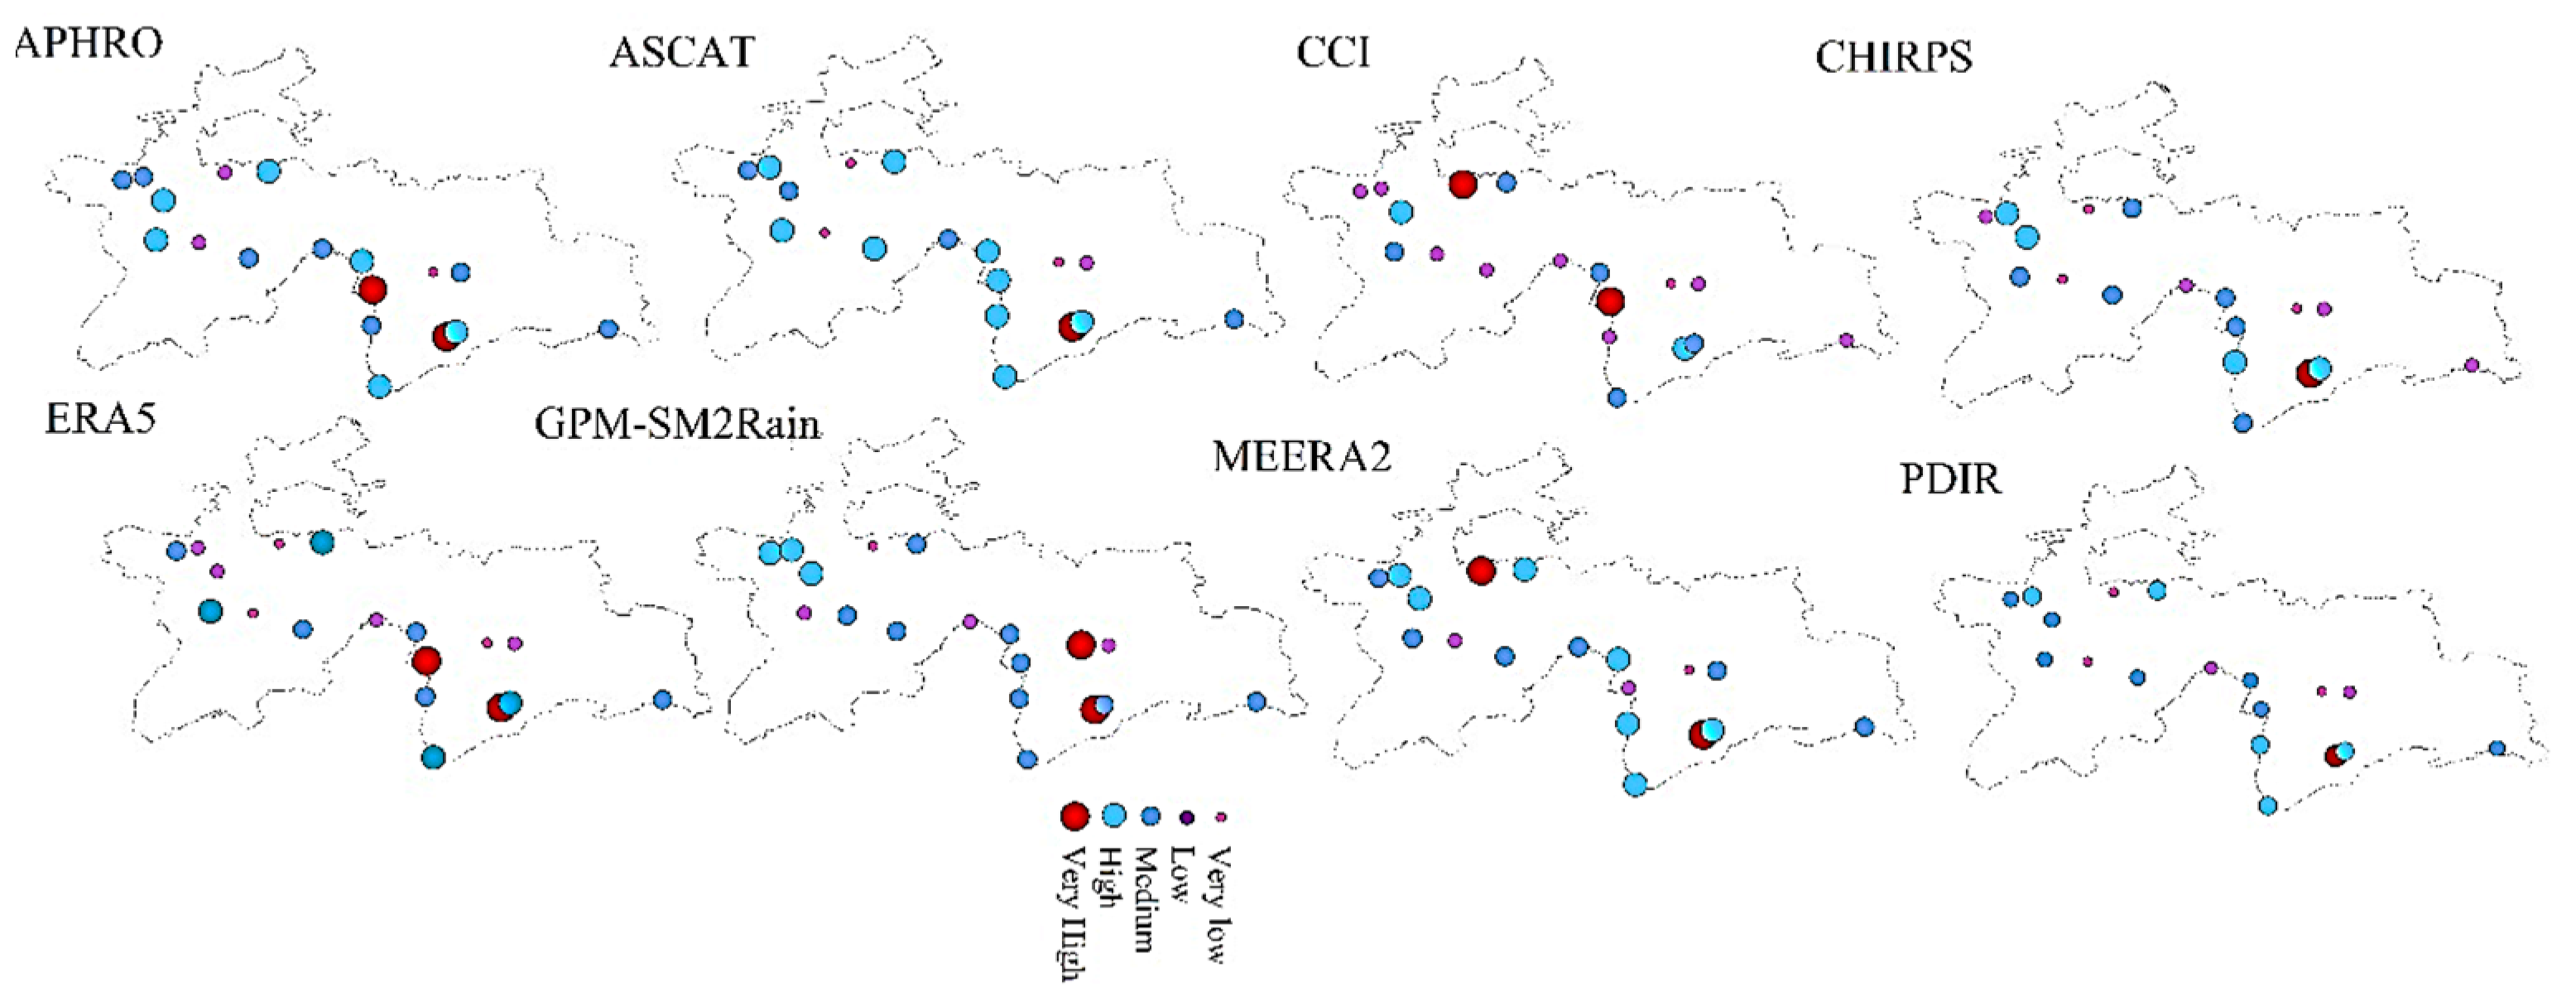
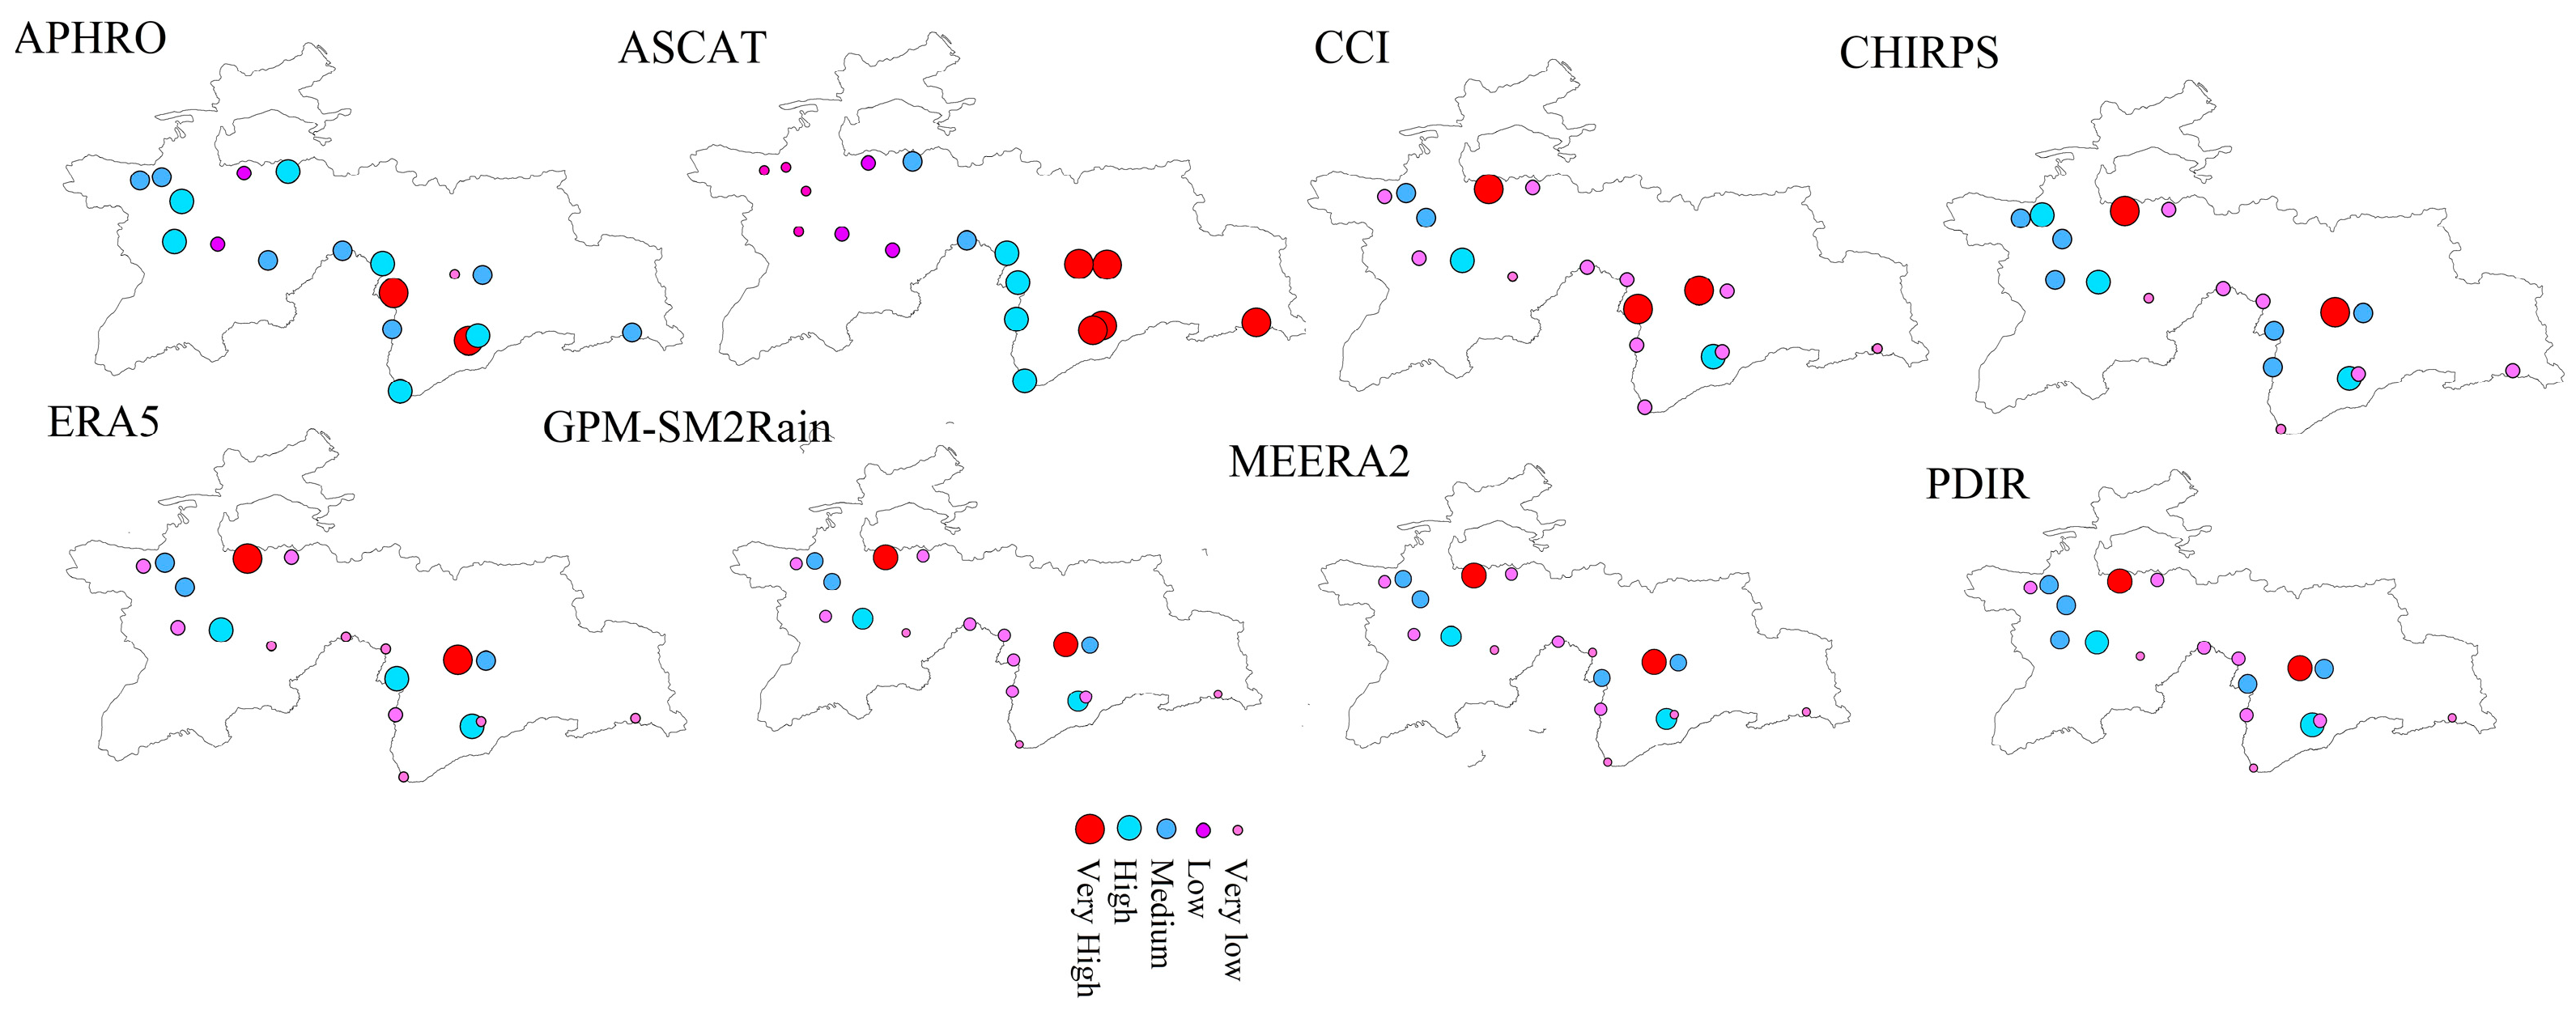
3.1. Spatiotemporal Performance of GPDS

In the mountainous region of Tajikistan, Figure 4 depicts the spatial variability of all the products (PDIR, CHIRPS, GPM-SM2Rain, SM2Rain-ASCAT, SM2Rain-CCI, ERA5, MEERA2, and APHRO) and gauge observations. Each dataset and gauging station show a sizable amount of precipitation, which is indicative of the research area’s mountainous terrain. Northern Tajikistan includes the eastern Pamir highlands (yearly precipitation ranges from 75 to 300 mm). The in situ climatic conditions of the study area have spots that demarcate the region with a rainy environment (<1200 mm/year). During winter, more precipitation falls in the southern region of the nation. All datasets and gauge observations over flat topography capture most of the precipitation. Over the study area’s northern highlands, no GPDS could track precipitation. The MEERA2, ERA5, and PDIR datasets showed a poor ability to track the daily estimations caused by observed precipitation, with a considerable level of underestimation across the northern mountains, according to the results. The good performance of GPM-SM2rain and APHRO over plain topography contrasts with their unsatisfactory performance over rugged surfaces, as seen by a substantial quantity of overestimation. For capturing spatial variability over the uneven terrain of the research area, CHIRPS fared better than any other chosen dataset.
Figure 5 compares the average daily precipitation quantity from the in situ gauges to gridded datasets from 2000 to 2013. Moving averages of daily data from all sources were used to estimate average daily precipitation. Researchers [27,35] used similar methods to show the uncertainty in daily precipitation estimates in China’s Tianshan Mountains and South America’s northwest. The figure shows that the reference data often have two precipitation time series peaks. SM2Rain and ASCAT failed to track precipitation temporal variability. CHIRPS, GPM-SM2rain, and gauge temporal variability agree. Only the ERA5 product showed the biggest gauge temporal variability peak around mid-September. Gauge estimations generally indicate two peaks. MEERA-2 found its peak in early April, not mid-November as the gauge data showed. APHRO and GPM overestimated from mid-January to mid-March. APHRO temporal variability matches gauge estimations.

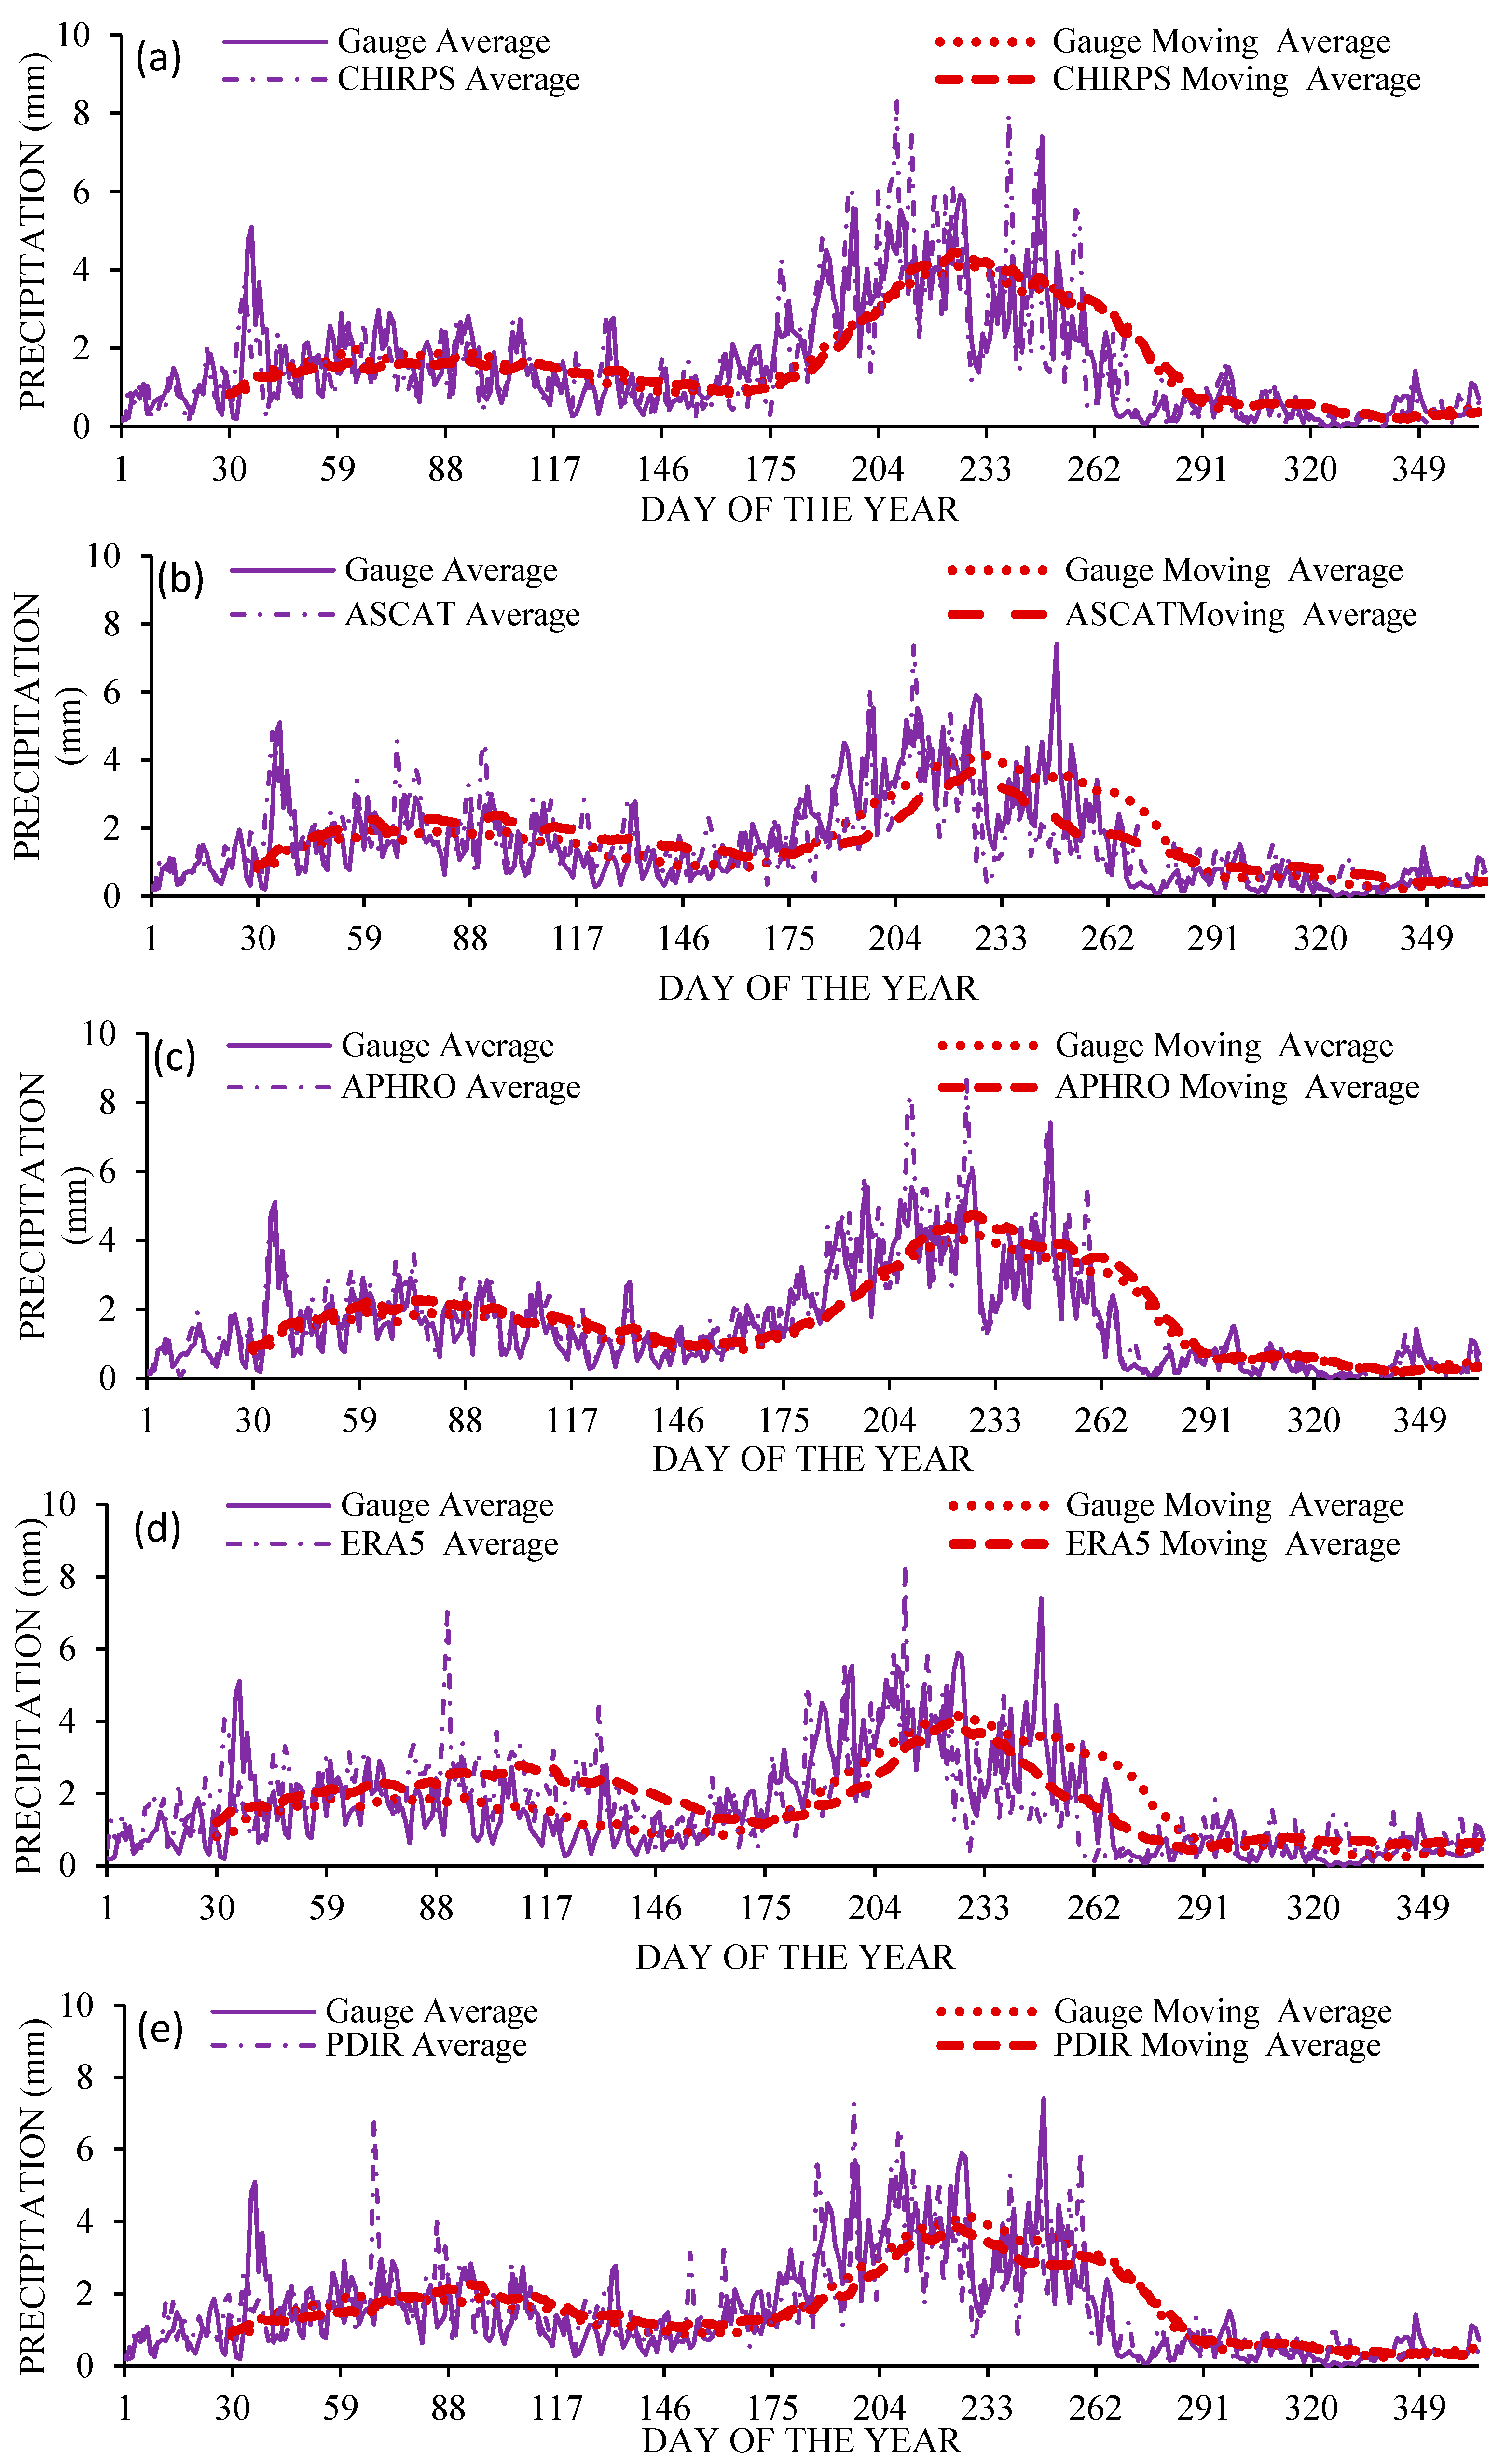
3.2. The Ground Evaluation of all GPDS at Multitemporal (Daily, Monthly, and Seasonal) Scales

Figure 6 and Figure 7 show, respectively, the spatial variability of all evaluation indices derived from ERA5, MEERA2, APHRO, PDIR, CHIRPS, GPM-SM2Rain, SM2Rain-ASCAT, and SM2Rain-CCI. In the evaluation index ranges across the entire nation, we noticed a sizable number of changes. The product CHIRPS displayed the greatest spatial variance in CC values. In comparison to other GPDS, the APHRO, CCI, MEERA2, and PDIR displayed less spatial variation. Where there was a high precipitation rate, the CC between gauge and GPDS varied the most. Following the GPM and APHRO products in terms of RMSE variation is the CHIRPS product. According to the evaluation values of the CHIRPS product, CHIRPS’ capability to track high and low precipitation occurrences is in good agreement with gauge’s spatial variability. Figure 8 describes the RMSE of each point over the study area. Generally, the error values increased with higher altitudes. The CHIRPS showed the least error values compared to other GPDS.
Figure 9 displays the seasonal rBIAS (percent) for all GPDS: ERA5, MEERA2, APHRO, PERSIANN-PDIR, CHIRPS, GPM-SM2Rain, SM2Rain-ASCAT, and SM2Rain-CCI models. ERA5 (60%), PDIR (18%), and CHIRPS (10%) all exhibited significant overestimation during the spring. During the summer, all GPDS were underestimated, with GPM exhibiting the most significant underestimation (−78%). The evaluation of PDIR was only satisfactory during autumn, whereas the GPM product demonstrated significant underestimation (−25%) during the winter season and significant underestimation (−33%) during the autumn season. During the winter season, both the ASCAT and CHIRPS exhibited severe underestimations, with ranges of (−28%) and (−19%), respectively. In all seasons, CHIRPS performed better than the other GPDS in comparison.
The monthly variation in the estimated evaluation indices values for all GPDS is shown in Figure 10. The CC box plot shows how the CHIRPS products performed better compared to other GPDS. CHIRPS estimates are in good agreement with the in situ gauge estimation, according to the BIAS (mm/day) box plot. The PDIR product described subpar performance in terms of CC and error values in the box schemes of RMSE. Only CHIRPS’ performance > 0.7. The RMSE error values for the SM2Rain ASCAT were maximum. The whole GPDS’ monthly performance is shown in Figure 11. In comparison to daily estimates, the daily CC estimations of ERA5, MEERA2, APHRO, PERSIANN-PDIR, CHIRPS, GPM-SM2Rain, SM2Rain-ASCAT, and SM2Rain-CCI were superior. In comparison to other products, the CHIRPS, APHRO, and PDIR products fared well in the CC box scheme. The MEERA2 product performed much worse than other datasets, while the ERA5 product performed poorly on a monthly scale, according to the BIAS box scheme. The GPM-SM2Rain product performed reasonably well across the monthly scale.

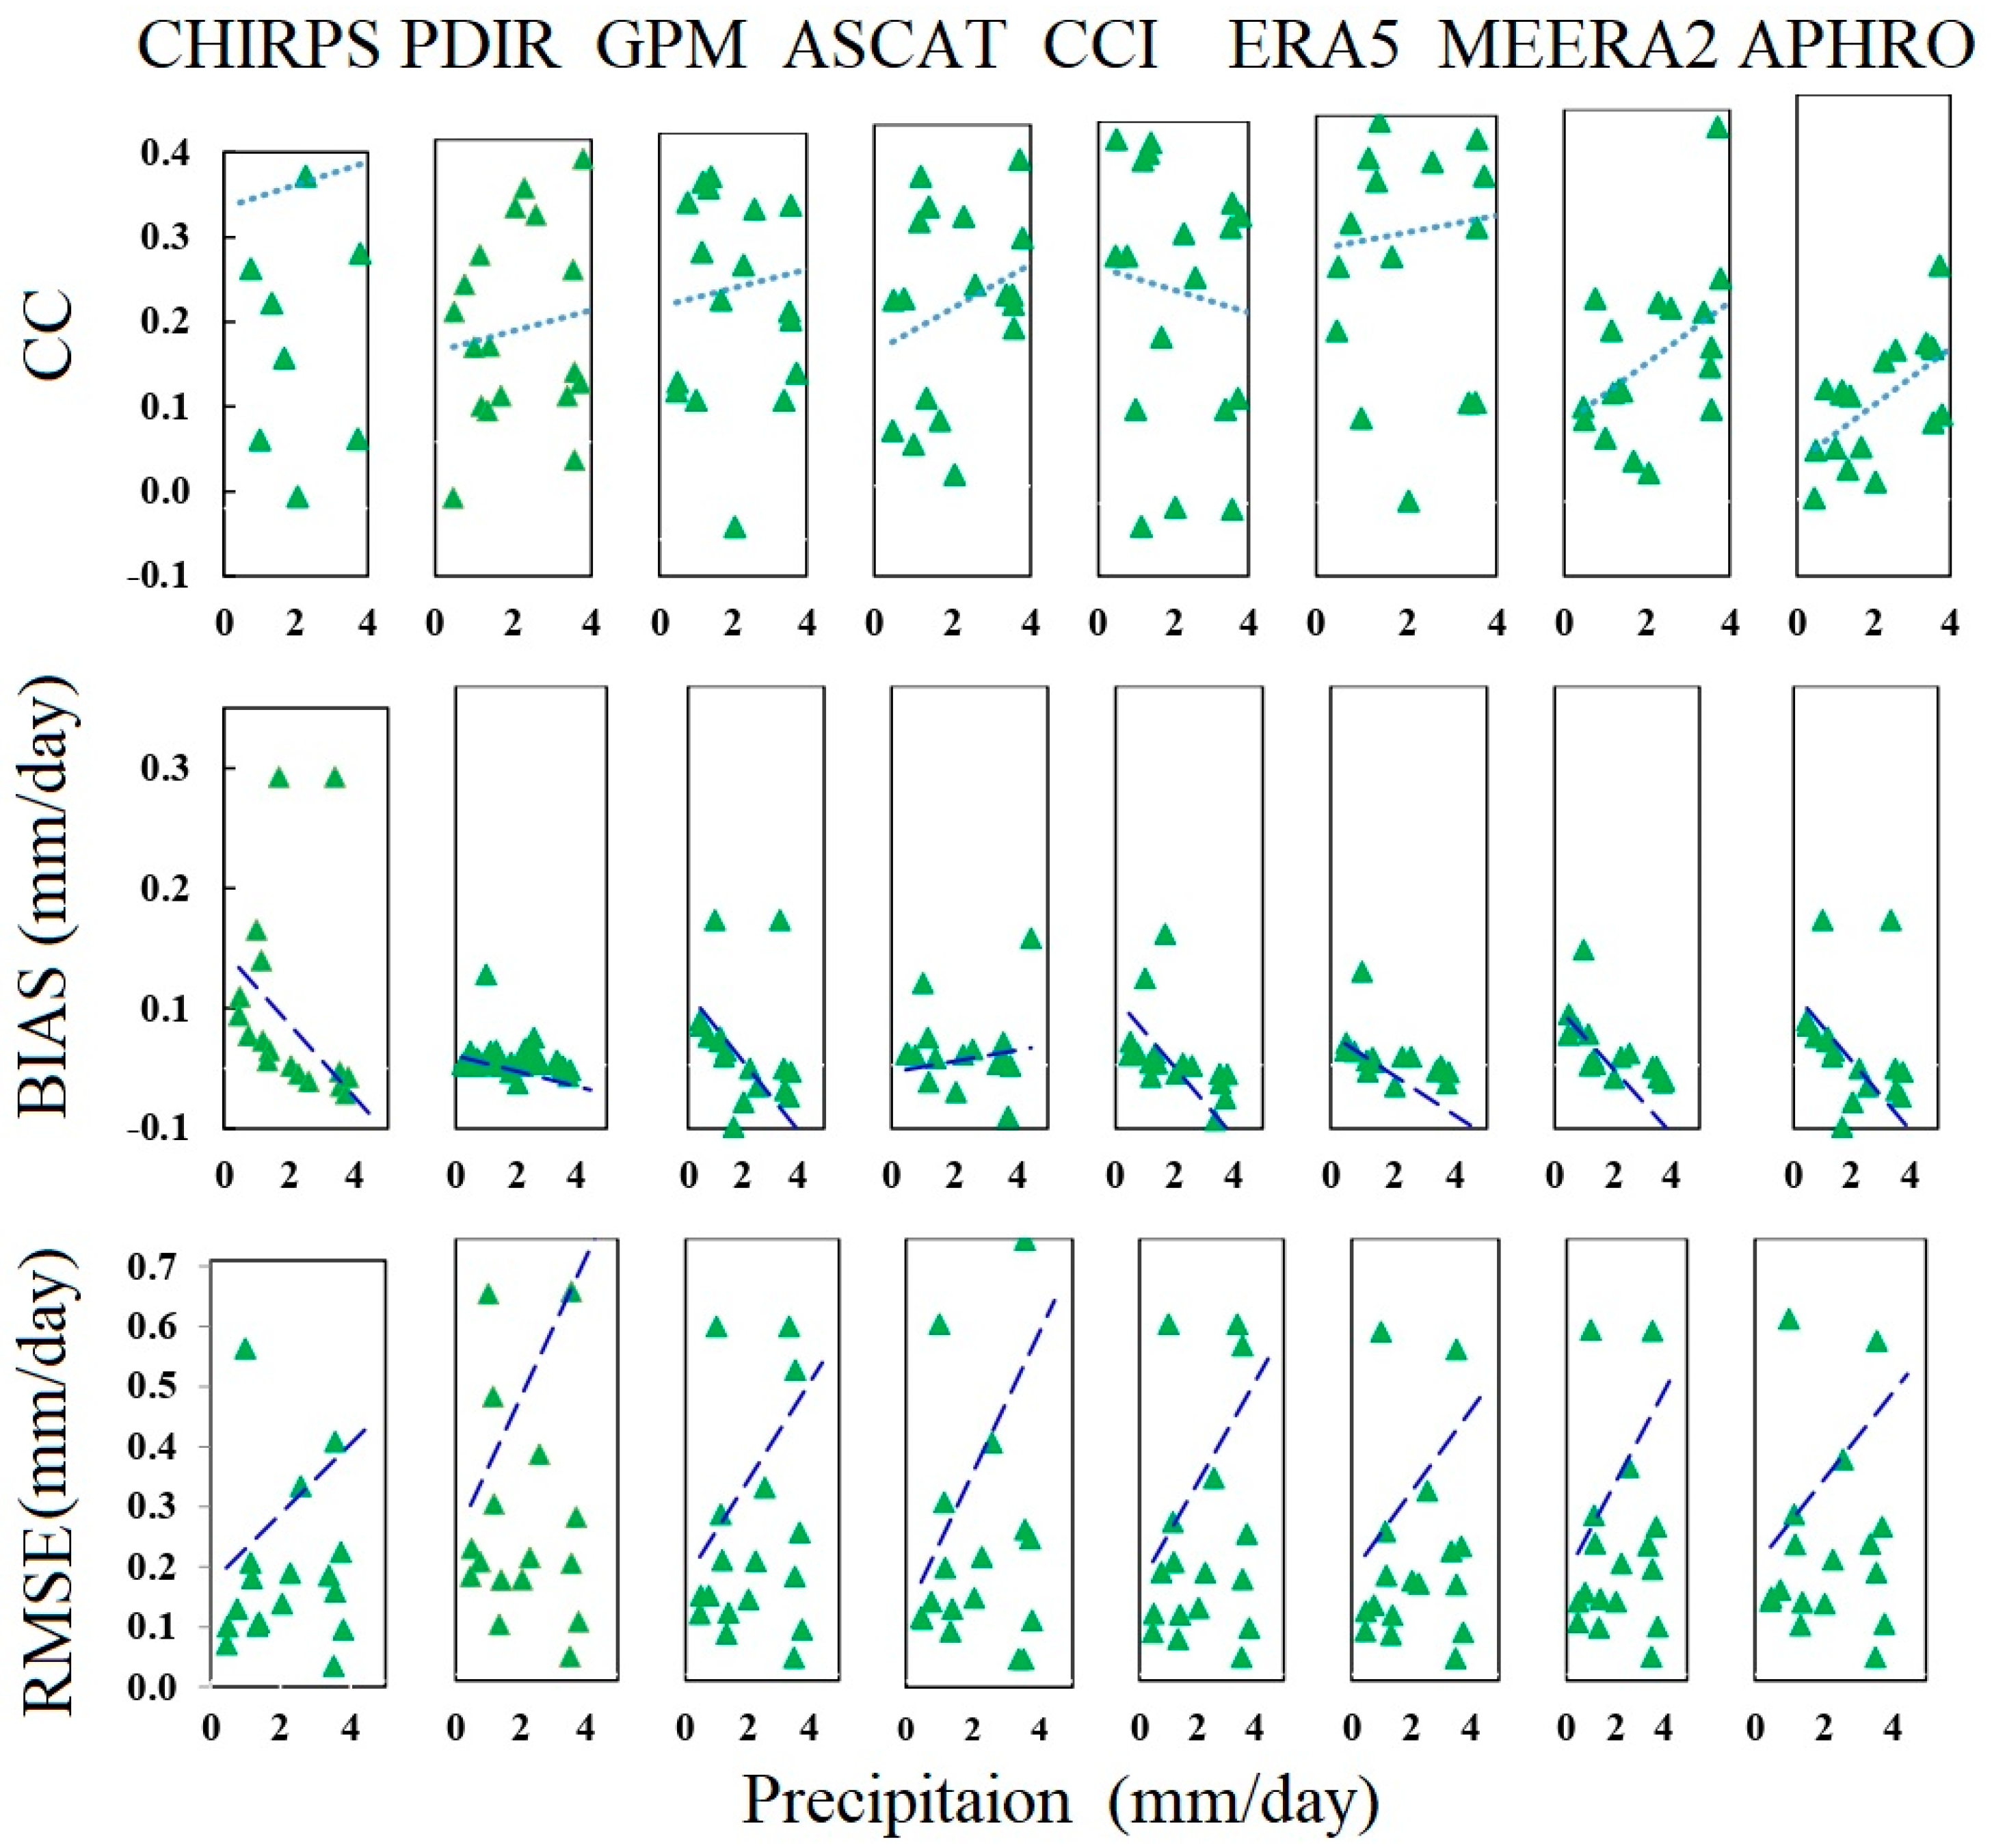
3.3. The Significance of Precipitation Intensity and Altitude on All GPDS Evaluation Indices

For all of the selected GPDS (ERA5, MEERA2, APHRO, PERSIANN-PDIR, CHIRPS, GPM-SM2Rain, SM2Rain-ASCAT, and SM2Rain-CCI), Figure 12 shows how altitude affects the assessment indices (CC, BIAS, and RMSE). The dotted lines showed the regression values of all GPDS. The results show that CC levels decreased as elevation increased. The elevation and error values have a direct correlation, just like the error values do. The low performance was shown by the PDIR, MEERA2, CCI, and ERA5 values for CC. The CHIRPS results were better, even at greater altitudes. Across all GPDS, an elevation shift seems to have little effect on the BI-AS values. Higher elevations also showed good agreement in their error values. Similar changes were seen in the APHRO and GPM in response to elevation.
For all the selected GPDS (ERA5, MEERA2, APHRO, PERSIANN-PDIR, CHIRPS, GPM-SM2Rain, SM2Rain-ASCAT, and SM2Rain-CCI), Figure 13 explains the effects of precipitation intensity on the assessment indices. The findings demonstrate that CC values rise as precipitation intensity increases. The error values, on the other hand, are inversely related to the intensity of the precipitation. All of the reanalysis products’ CC values showed poor agreement with the gauge calculations. Even when the intensity of the precipitation was reduced, the CHIRPS produced better results. Across all datasets, the bias values demonstrated a significant response to precipitation intensity. In response to the intensity of the precipitation, the GPM-SM2Rain and PDIR both exhibited comparable fluctuations, and their margins of error contrasted significantly during peak precipitation.

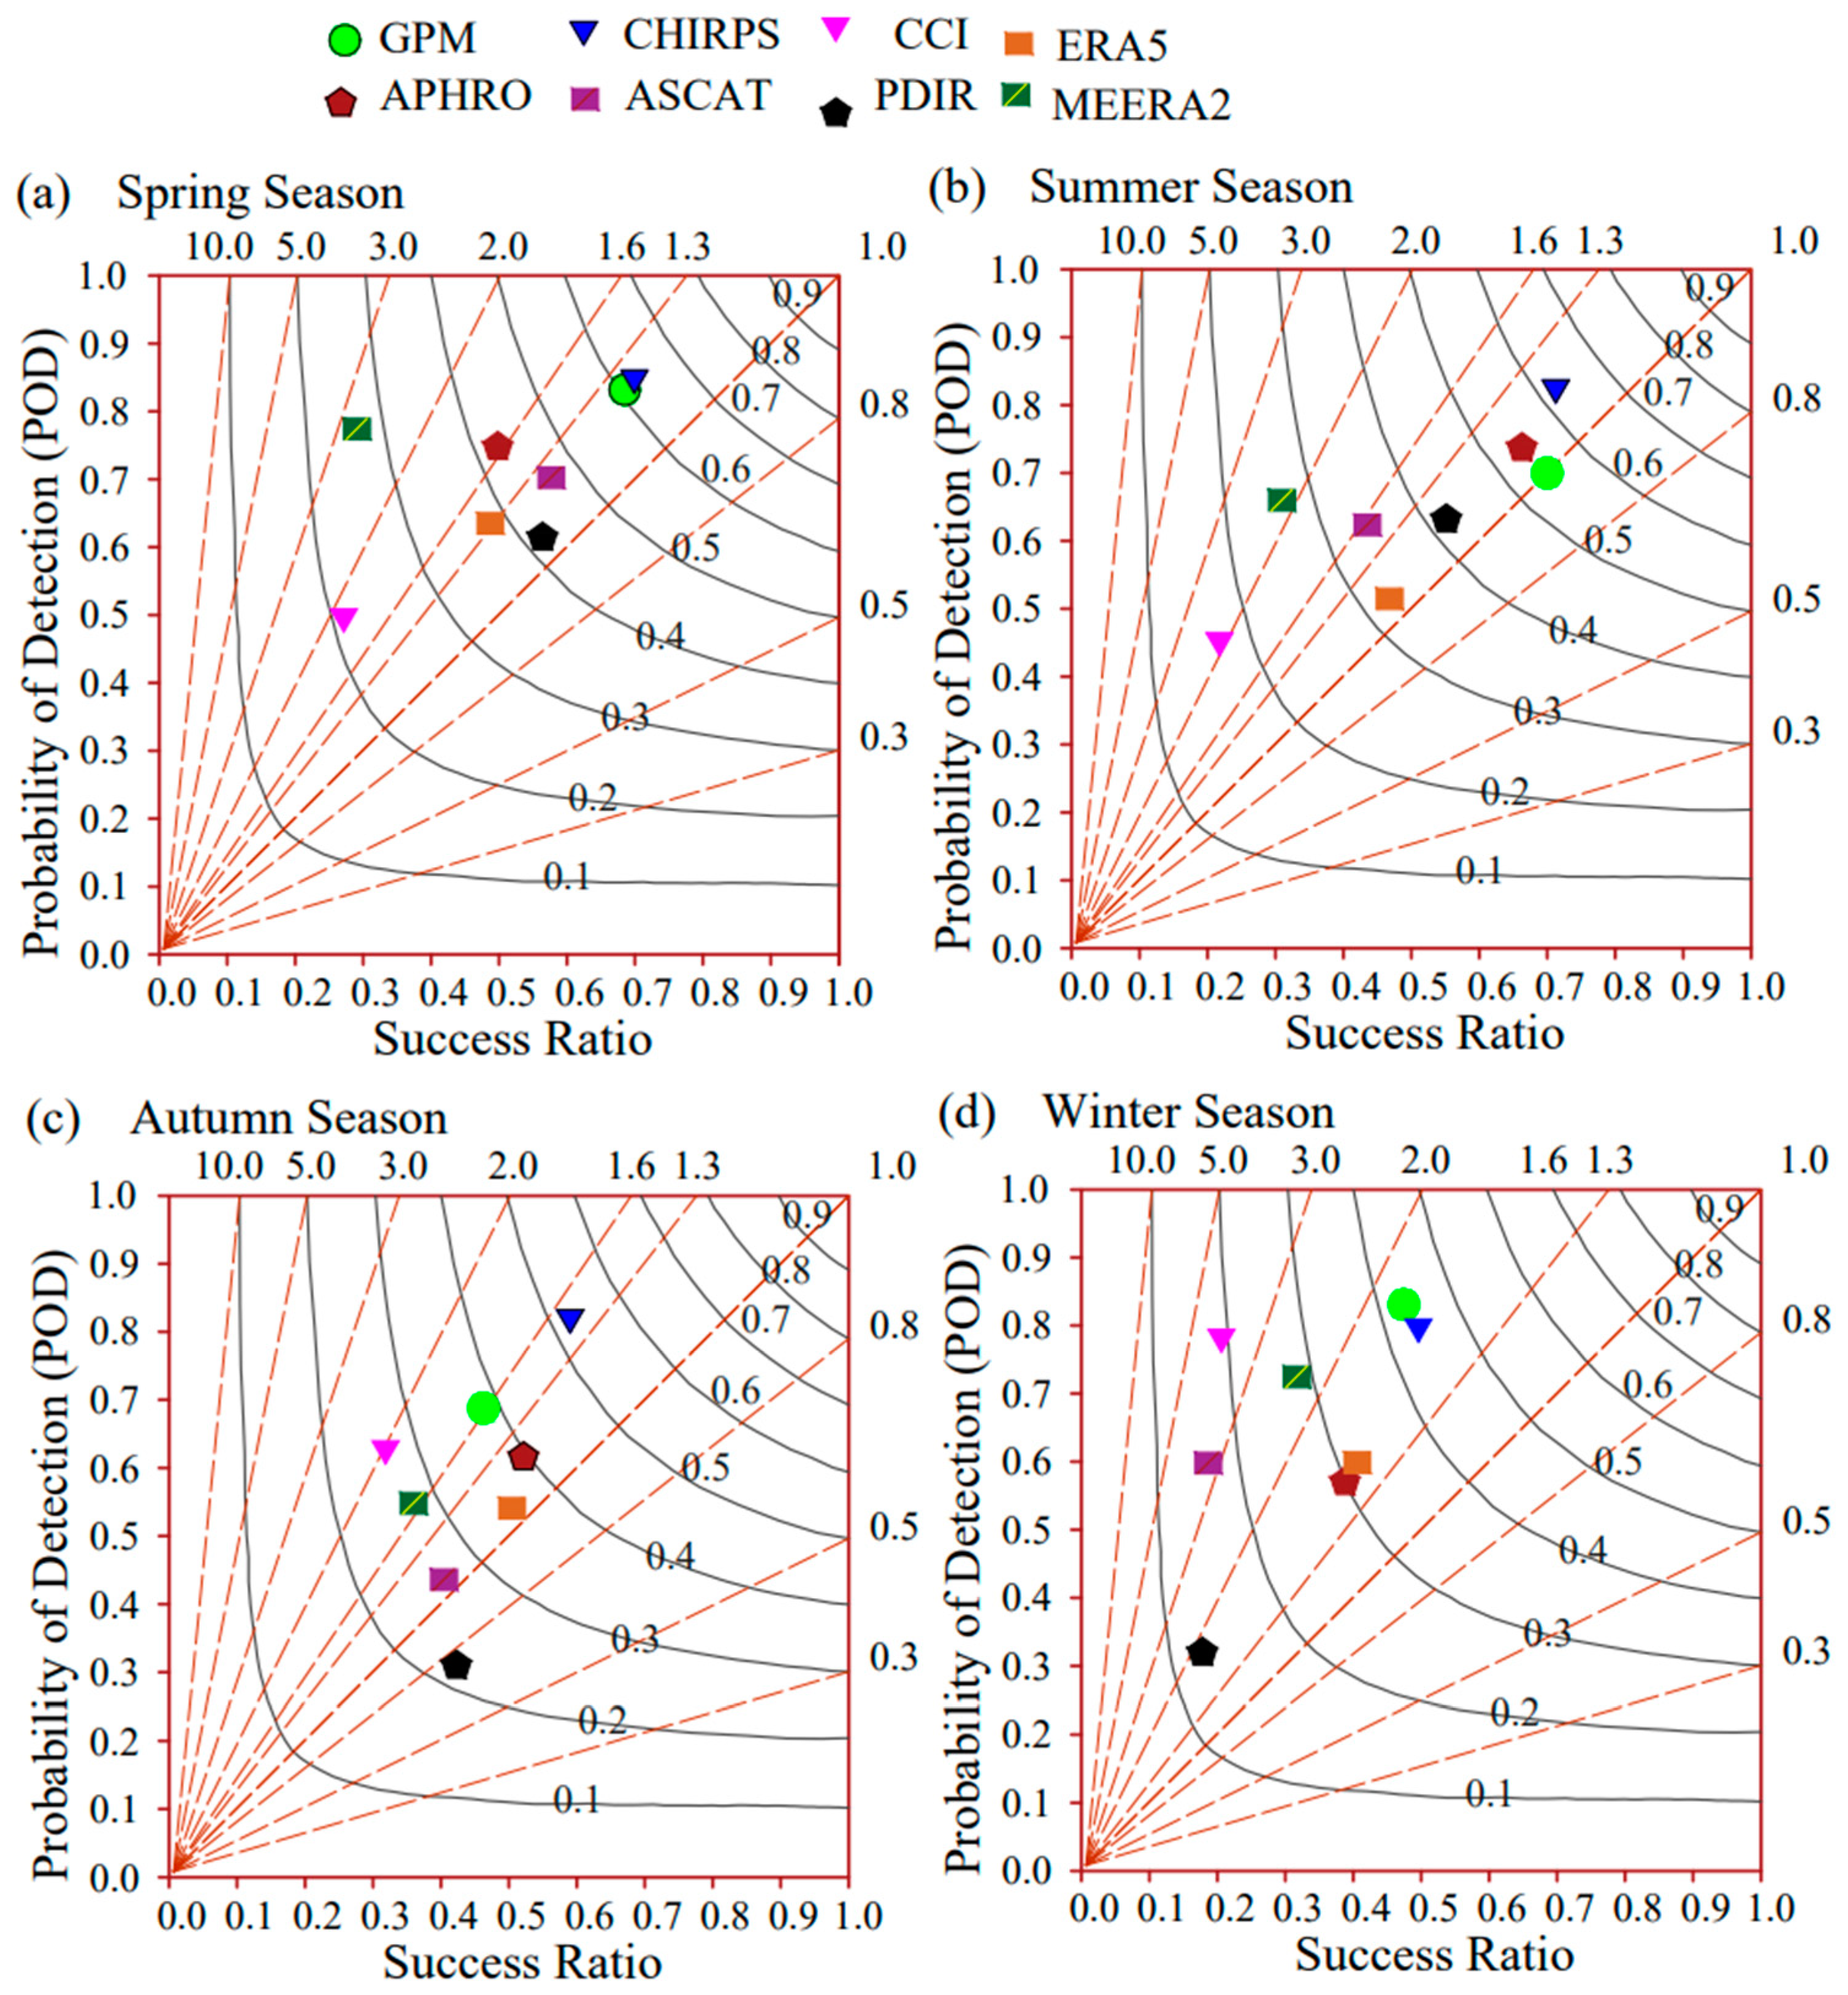
3.4. The Performance Diagram of All GPDS at Daily and Seasonal Scales

Figure 14 provides an overview of the abilities of all the systems considered in Tajikistan (ERA5, MEERA2, APHRO, PERSIANN-PDIR, CHIRPS, GPM-SM2Rain, SM2Rain-ASCAT, and SM2Rain-CCI) in terms of POD. This demonstrates how reference gauges, GPDS, and reanalysis datasets are spatially related. Earlier research made use of this performance diagram to compare the efficacy of various precipitation products in a range of environmental settings. POD estimates for the PDIR, SM2Rain-ASCAT, SM2Rain-CCI, GPM-SM2Rain, and CHIRPS were 0.61, 0.49, 0.36, 0.57, 0.31, 0.36, and 0.60, respectively. Indicating that the product had a good ability to detect the occurrence of precipitation, the POD for CHIRPS was at its highest. While the APHRO value of the reanalysis product was highest when compared to other ERA5 and MEERA 2 products. Figure 15 illustrates the performance of all GPDS on a seasonal scale in terms of the Probability of Detection and success ratio. In the winter, the GPM-SM2Rain performed better, whereas the CHIRPS POD values outperformed the other GPDS. In terms of the chance of detection, APHRO and CCI performed reasonably well. The CHIRPS and GPM were very comparable throughout the winter, while MEERA 2’s all-around performance was subpar.

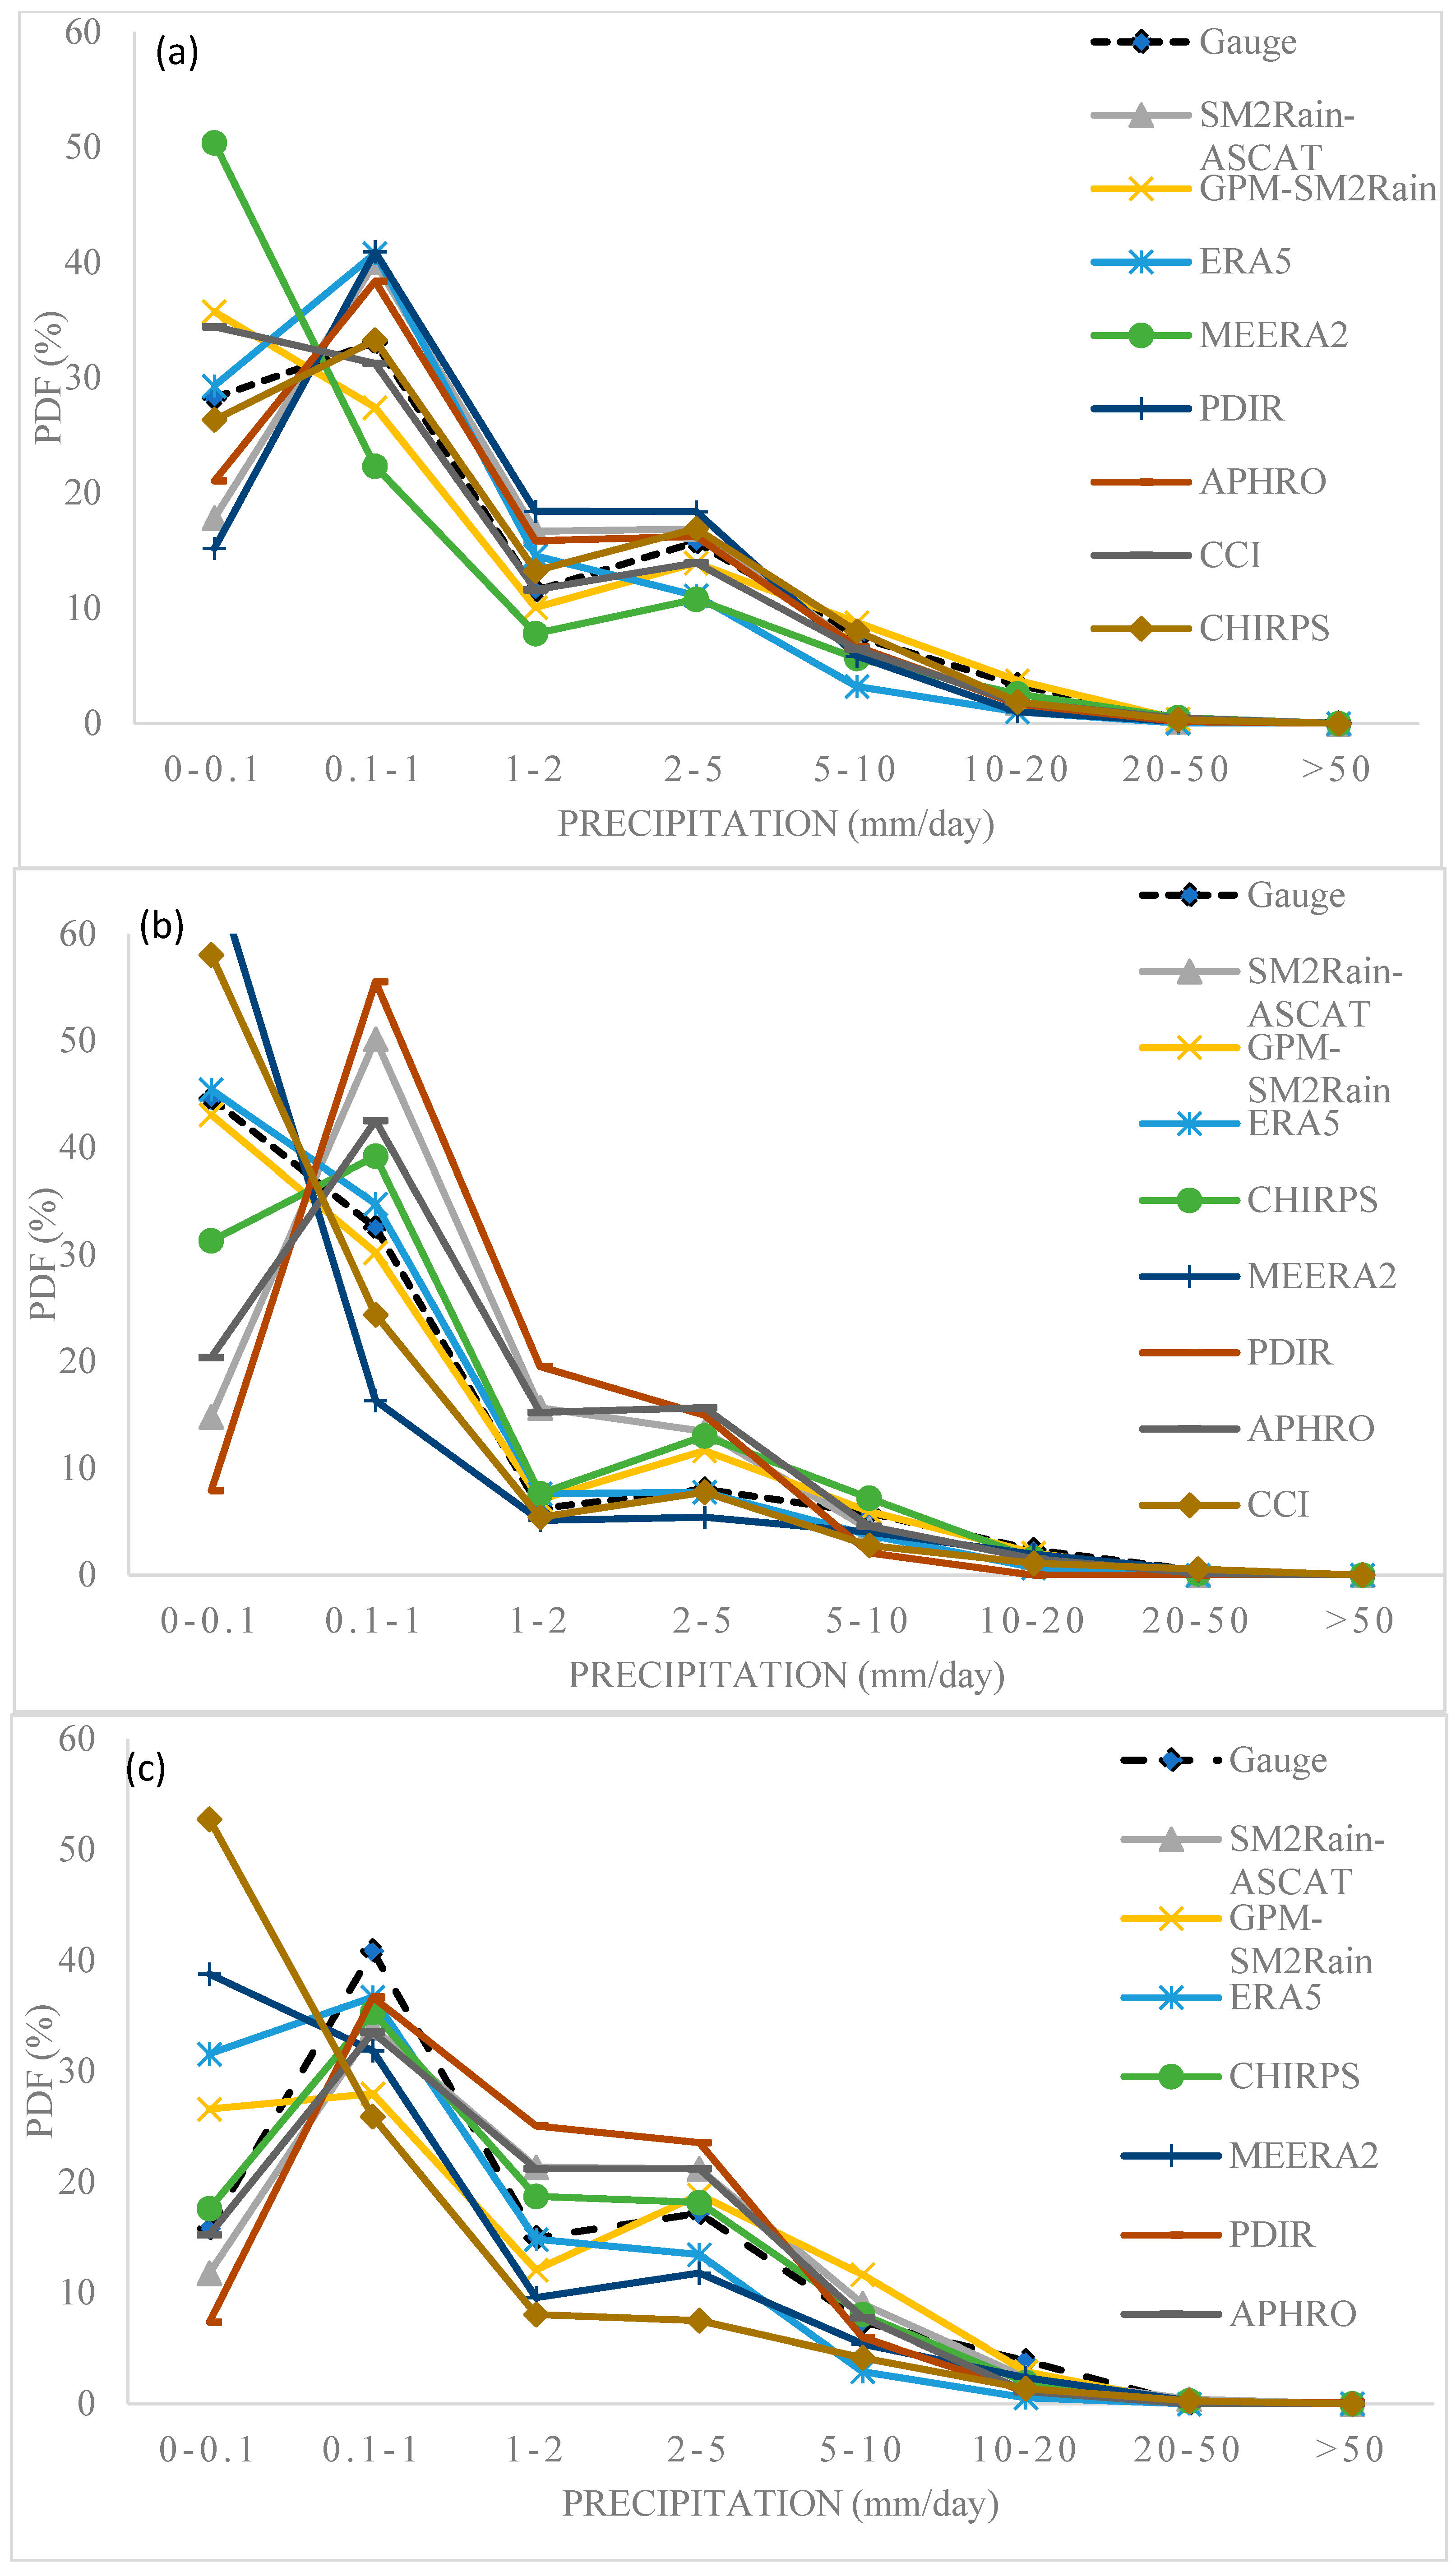
3.5. The Probability Density Function of All GPDS at Daily and Seasonal Scales

The eight GPDS used to evaluate the estimations of the in situ weather stations (ERA5, MEERA2, APHRO, PERSIANN-PDIR, CHIRPS, GPM-SM2Rain, SM2Rain-ASCAT, and SM2Rain-CCI.) are depicted as probability density functions (PDFs) in Figure 16 According to data from all sources, light precipitation events (2 mm/day) were the most common for the entire study period (representing about 72% of all events). Every threshold showed a significant underestimation of precipitation according to the PDIR and ASCAT products. CCI demonstrated an overestimation of light precipitation occurrences while underestimating moderate and heavy precipitation events. In daily estimations, MEERA2 showed a sizable overestimation. The CCI results clearly overestimated the frequency of wintertime light precipitation occurrences. A significant underestimation of light events was found by SM2Rain-ASCAT. The preponderance of light events was rather well captured by the APHRO product while exaggerating moderate-to-heavy rains. Tajikistan precipitation events were best predicted by the CCI product this season. CHIRPS had the best spring performance. All other items depicted light-to-moderate spring precipitation occurrences ambiguously. MEERA2 missed summer light-to-heavy precipitation events.

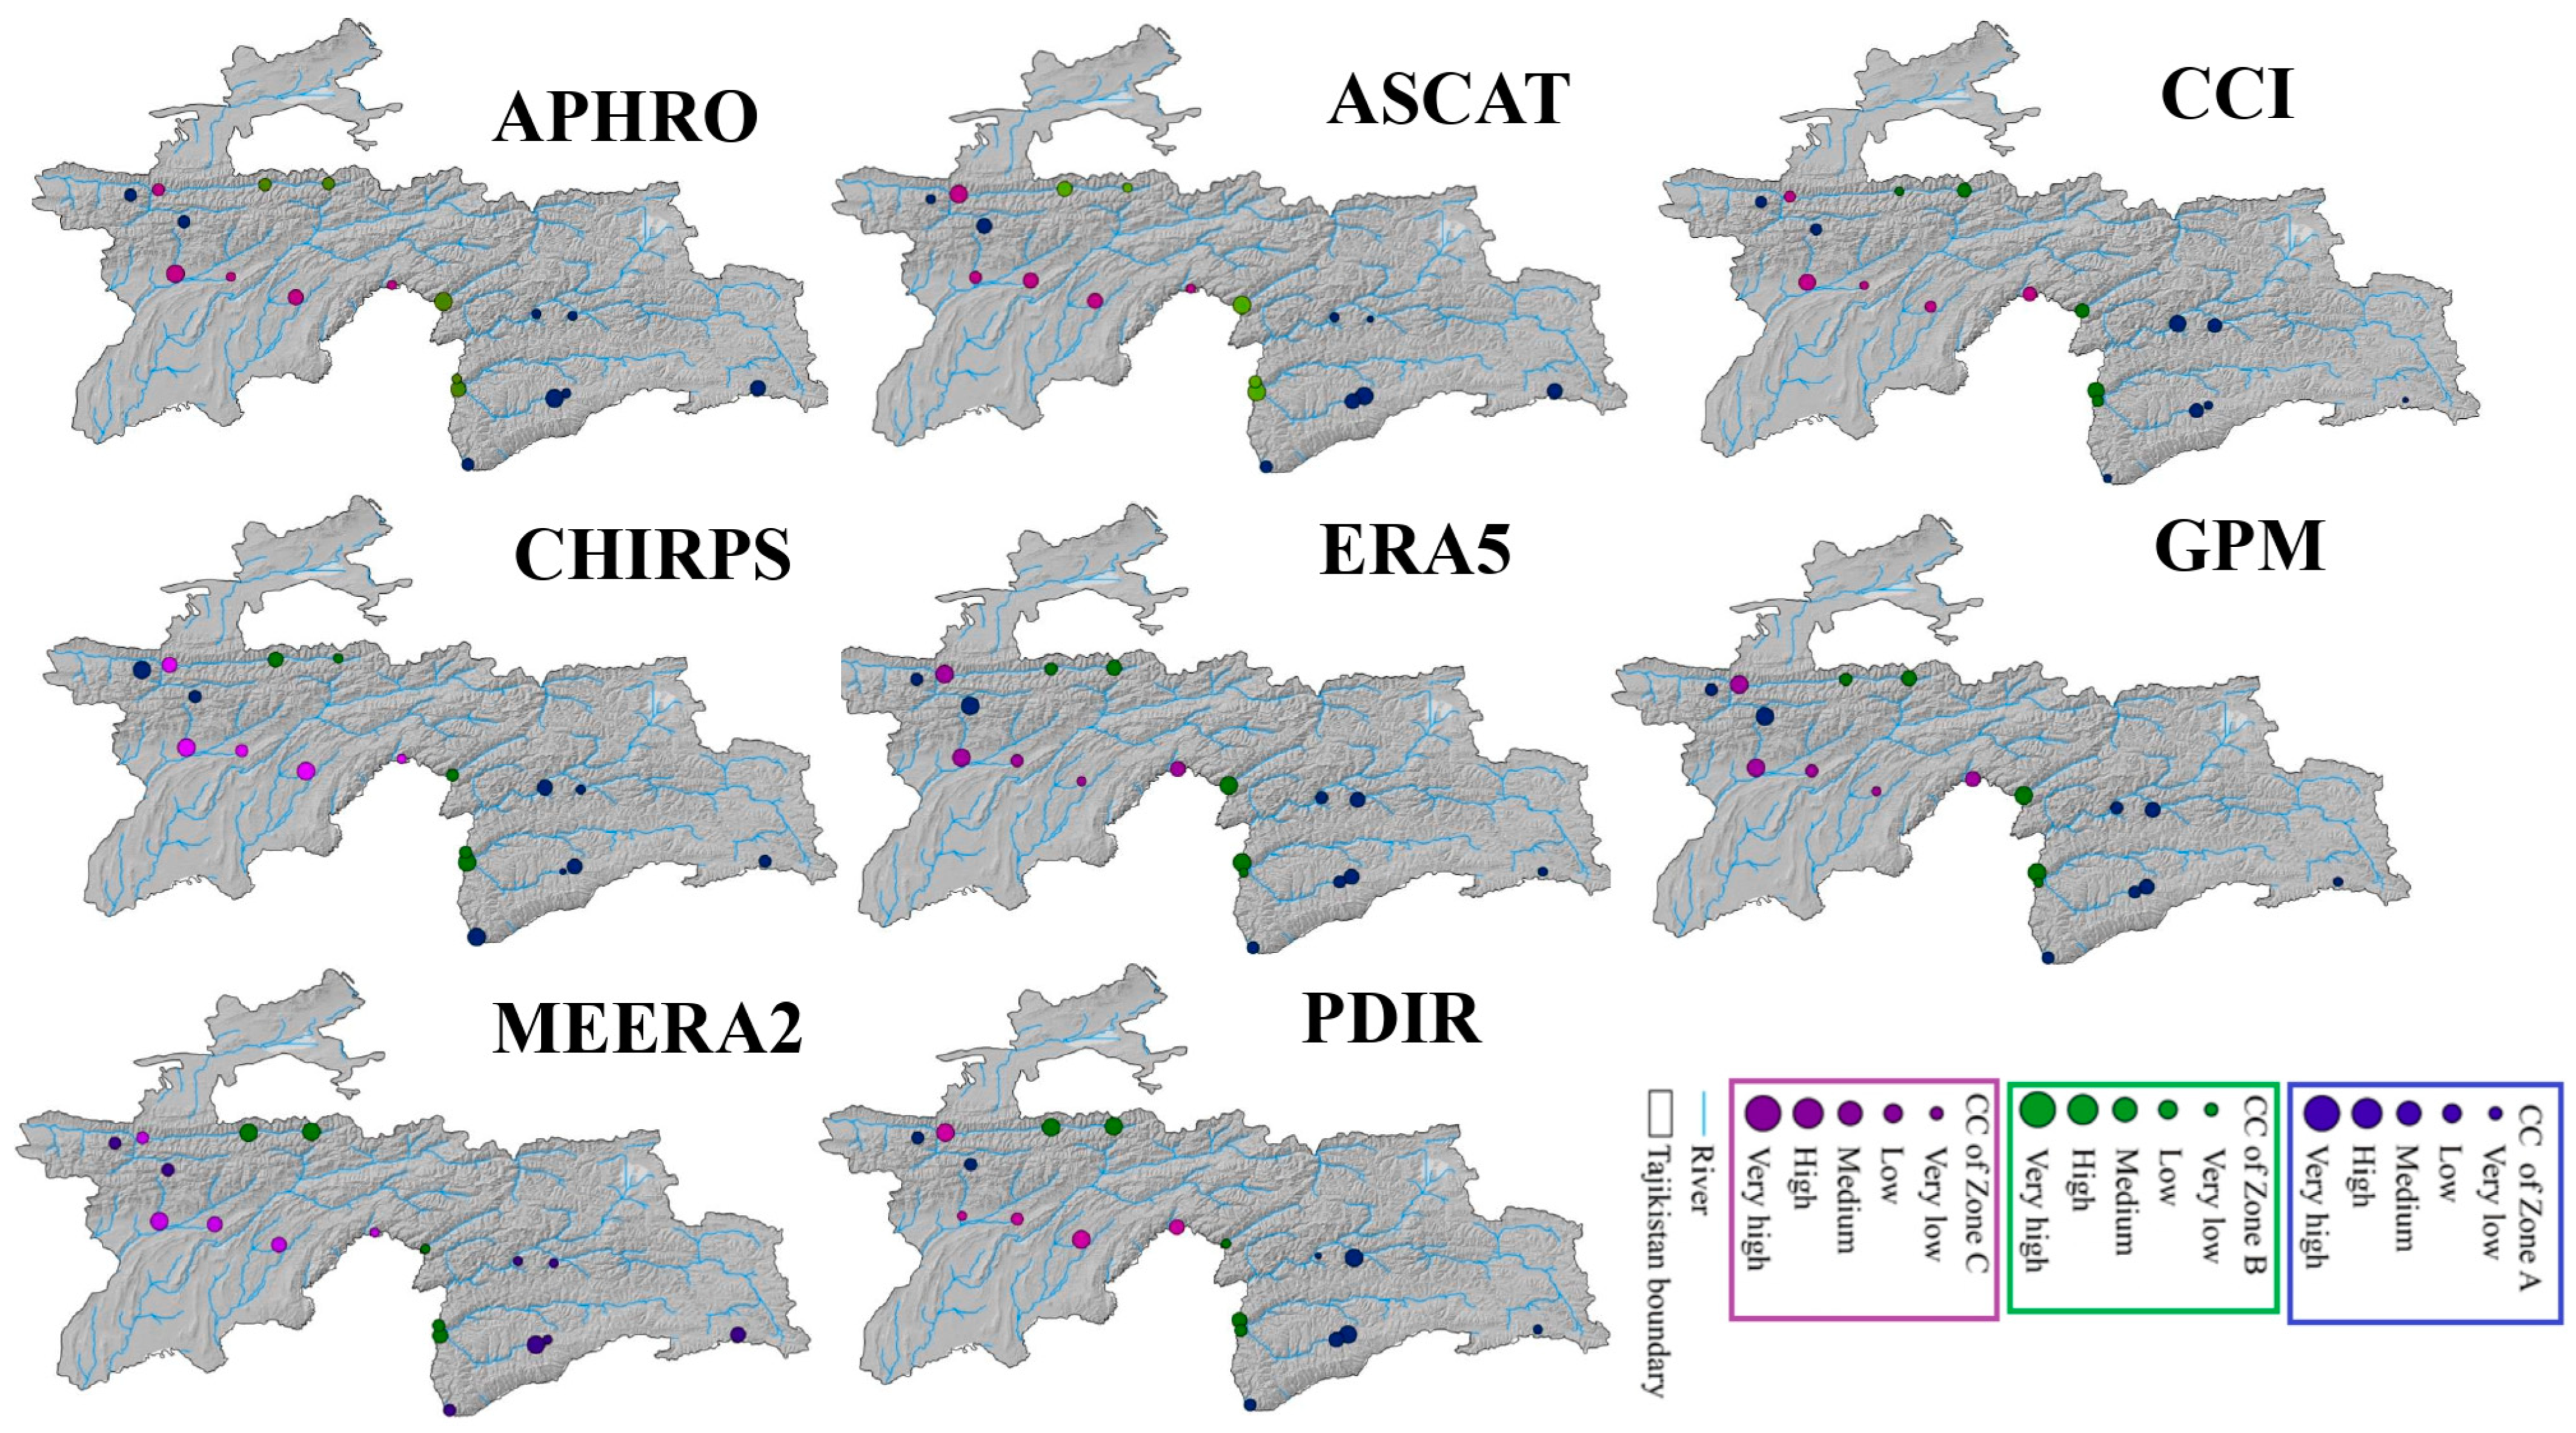
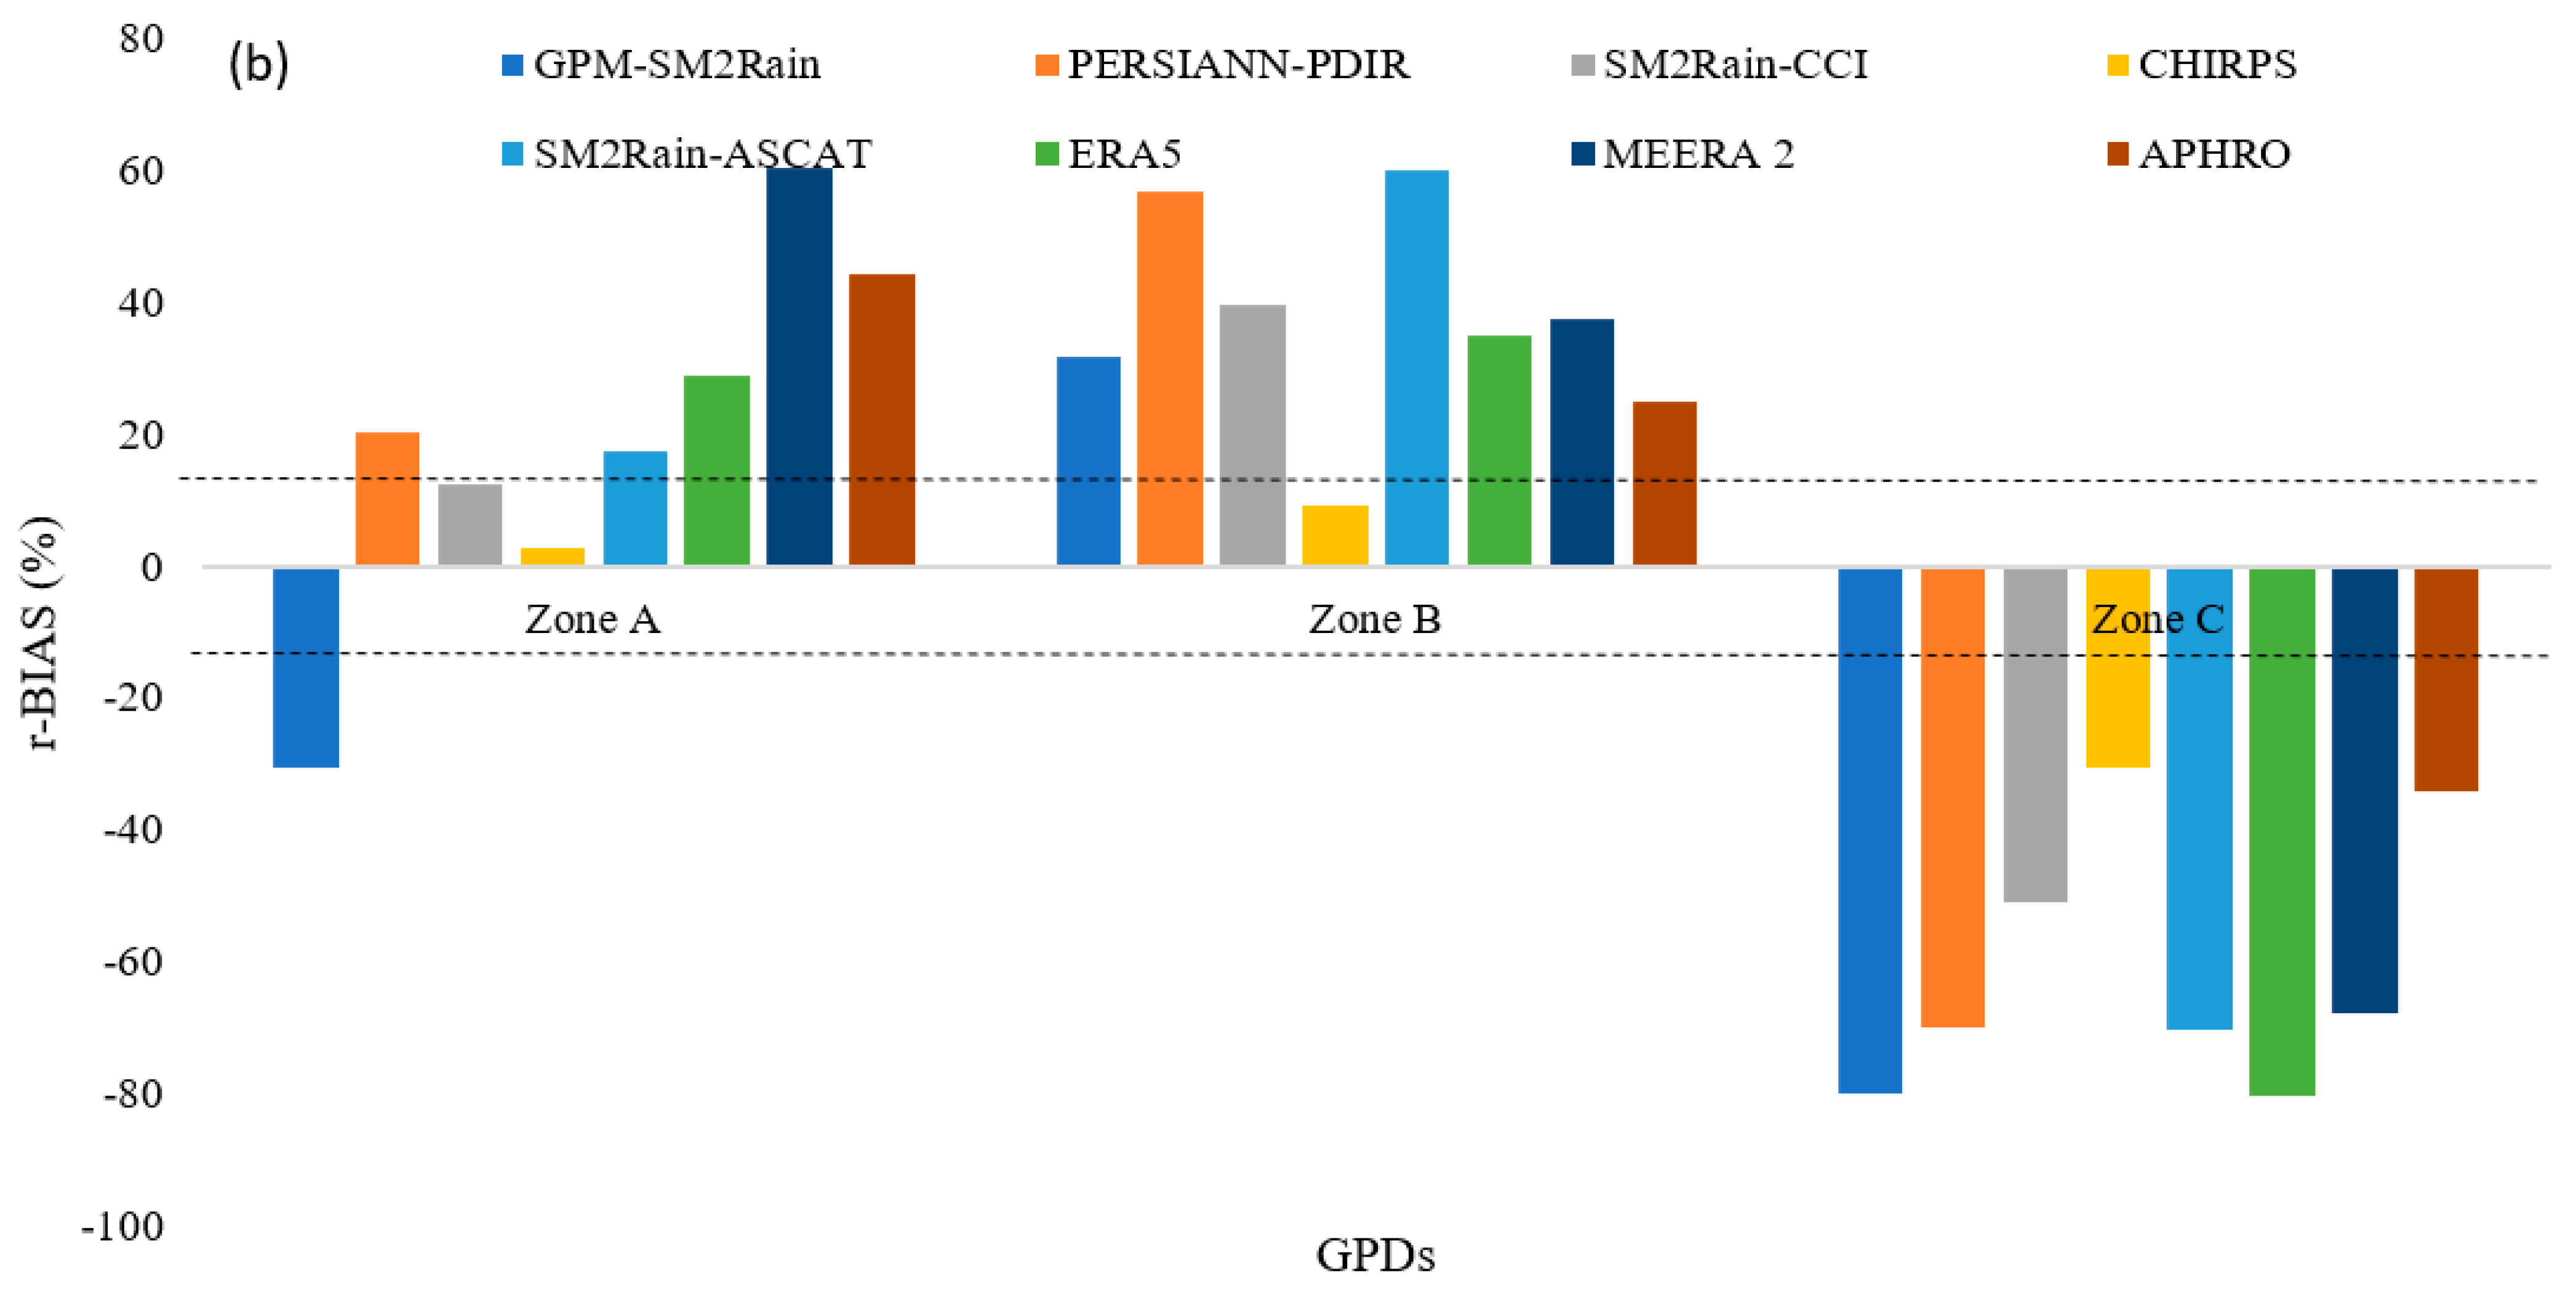
3.6. The Performance of the Datasets over Different Elevation Zones

The research makes it possible to thoroughly examine precipitation performance over a variety of height gradients by categorizing the elevation zones into three groups (1500 m, 2500 m, and 2500 m). For the zone classification, the elevation of installed in situ gauging stations was used as a threshold value. Figure 17 highlights the correlation coefficient spatial distribution of all GPDS (ERA5, MEERA2, APHRO, PERSIANN-PDIR, CHIRPS, GPM-SM2Rain, SM2Rain-ASCAT, and SM2Rain-CCI). Due to the very complex topography, the results showed significant variations in CC values. In zone A, all GPDS performance was comparable with gauge estimations with the dominant performance of CHIRPS. The correlation coefficients between precipitation estimates from various datasets and ground-based measurements generally decrease as elevation rises (zones B and C) because of the complexity of orographic effects, measurement difficulties, scarcity of ground-based data, microclimates, and snow accumulation. These elements must be considered while analyzing precipitation patterns at higher altitudes and enhancing the precision of precipitation estimations for more dependable applications in mountainous areas, like Tajikistan. Generally, only the CHIRPS performance was satisfactory in all elevation zones, although its performance in the southern part of the region was not appropriate. Figure 18 describes the error and r-BIAS values of all the GPDS based on different elevation zones. Generally, the error values increased as elevation increased. CHIRPS showed the least RMSE values in each zone. While all the GPDS were underestimated at higher elevations.

4. Discussion

In this work, the accuracy and error characteristics of the GPDS (ERA5, MEERA2, APHRO, PERSIANN-PDIR, CHIRPS, GPM-SM2Rain, SM2Rain-ASCAT, and SM2Rain-CCI) were assessed using widely used assessment and categorization criteria. In numerous locations around the world, the ground validity of various GPDS has already been evaluated [38,39,40]. Local terrain and weather conditions are known to have a significant influence on GPDS performances. For example, ref. [41] examined a range of GPDS over Pakistan and found that the regional climatology and precipitation retrieval techniques had a significant impact on the accuracy of the precipitation products. Ref. [42] showed that the evaluation indices were heavily contingent on the in situ meteorological circumstances when comparing the capabilities of all GPDS estimations. The current assessment discovered that the climatic and topographic characteristics had a considerable influence on the evaluation of the GPDS under consideration, which is similar to past findings in many places [43].
According to our findings, CHIRPS has superior spatial and temporal capabilities to other chosen products. The findings of our investigation were perfectly reflected in previously published papers [8,14]. According to ground validation, all GPDS predictions were more accurate than in situ gauge estimations monthly, which is consistent with the findings of numerous other studies [10,26,34]. The results of [27] suggest that the spatial distribution of precipitation could be represented by the precipitation products CHIRPS and ASCAT. The study indicated that SM2Rain and CHIRPS products had improved spatial distribution tracking capabilities. According to the low correlation coefficient values, the performance of all GPDS was very poor in comparison to gauge estimations, indicating the better agreement between the GPDS and the reference datasets on a monthly scale as compare to daily. According to [33,37], the estimations of GPM and CHIRPS calculations with the monthly data of the in situ stations were >0.70, showing the superior linear connections of their monthly observations. Moreover, the algorithm used, the data sources used as input, and the spatial and temporal resolution can all affect how well a precipitation estimator performs. Additionally, the location and the weather can have an impact on how well an estimator performs.
Numerous algorithms are used by satellite-based precipitation estimators to calculate precipitation from satellite data. Infrared (IR), microwave (MW), and multispectral algorithms are examples of common algorithms. The foundation of IR algorithms is the idea that clouds with more ice content are related to more precipitation. However, in areas with a lot of cloud cover, they may be inaccurate. MW algorithms can be inaccurate in areas with high surface emissivity because they are based on the idea that precipitation scatters MW radiation. They are less impacted by cloud cover than IR algorithms. In general, multispectral algorithms are more accurate at predicting precipitation than IR or MW algorithms alone, but they can be more difficult to implement.
Global estimates of precipitation are created using reanalysis datasets, which combine information from several sources, including satellite data, on-the-ground observations, and numerical weather prediction models. Reanalysis datasets have a coarser spatial and temporal resolution than satellite-based precipitation estimators, but they are typically more accurate. Using a variety of equipment, including radar and radiometers, precipitation satellites offer estimates of precipitation from space. The ability of these devices to detect precipitation at various scales is impacted by the differing spatial and temporal resolutions of their equipment. Because they offer a longer time window to make up for the instruments’ poor spatial resolution, monthly scales are better suited for precipitation satellite data. The satellite data can offer a trustworthy estimate of the average precipitation for a specific area over monthly timeframes [44]. On the other hand, many variables like cloud cover, atmospheric conditions, and the timing of the satellite overpasses might have an impact on daily precipitation estimations from satellites. Unreliable and noisy results could be the result. It was discovered that as altitude increased, so did the correlations between the GPDS and the actual estimates [45]. Higher precipitation rates exposed the SM2Rain product’s subpar performance. The findings of [17] are congruent with these findings. The POD, FAR, and CSI values of CHIRPS outperform those of competing products, and other studies have found results that are similar. Figure 17 and Figure 18 showed that all GPDS were very sensitive in response to the elevation of installed in situ gauging stations. The station installed at higher altitudes showed a poor correlation coefficient with satellite data and error values that increased significantly; these findings are in line with [33].

5. Conclusions

The GPM-SM2Rain, SM2Rain-ASCAT, and SM2Rain-CCI models were used in this work to evaluate the uncertainties in daily, monthly, seasonal, and annual estimations of various GPDS (ERA5, MEERA2, APHRO, PERSIANN-PDIR, CHIRPS, and GPM-SM2Rain). Utilizing data from January 2000 to December 2013, the evaluation was based on comparisons with measurements from in-country weather stations in Tajikistan:
  • All datasets captured most precipitation over flat topography, but no GPDS could track precipitation over the northern highlands, and GPM-SM2Rain and APHRO overestimated precipitation over rugged surfaces.
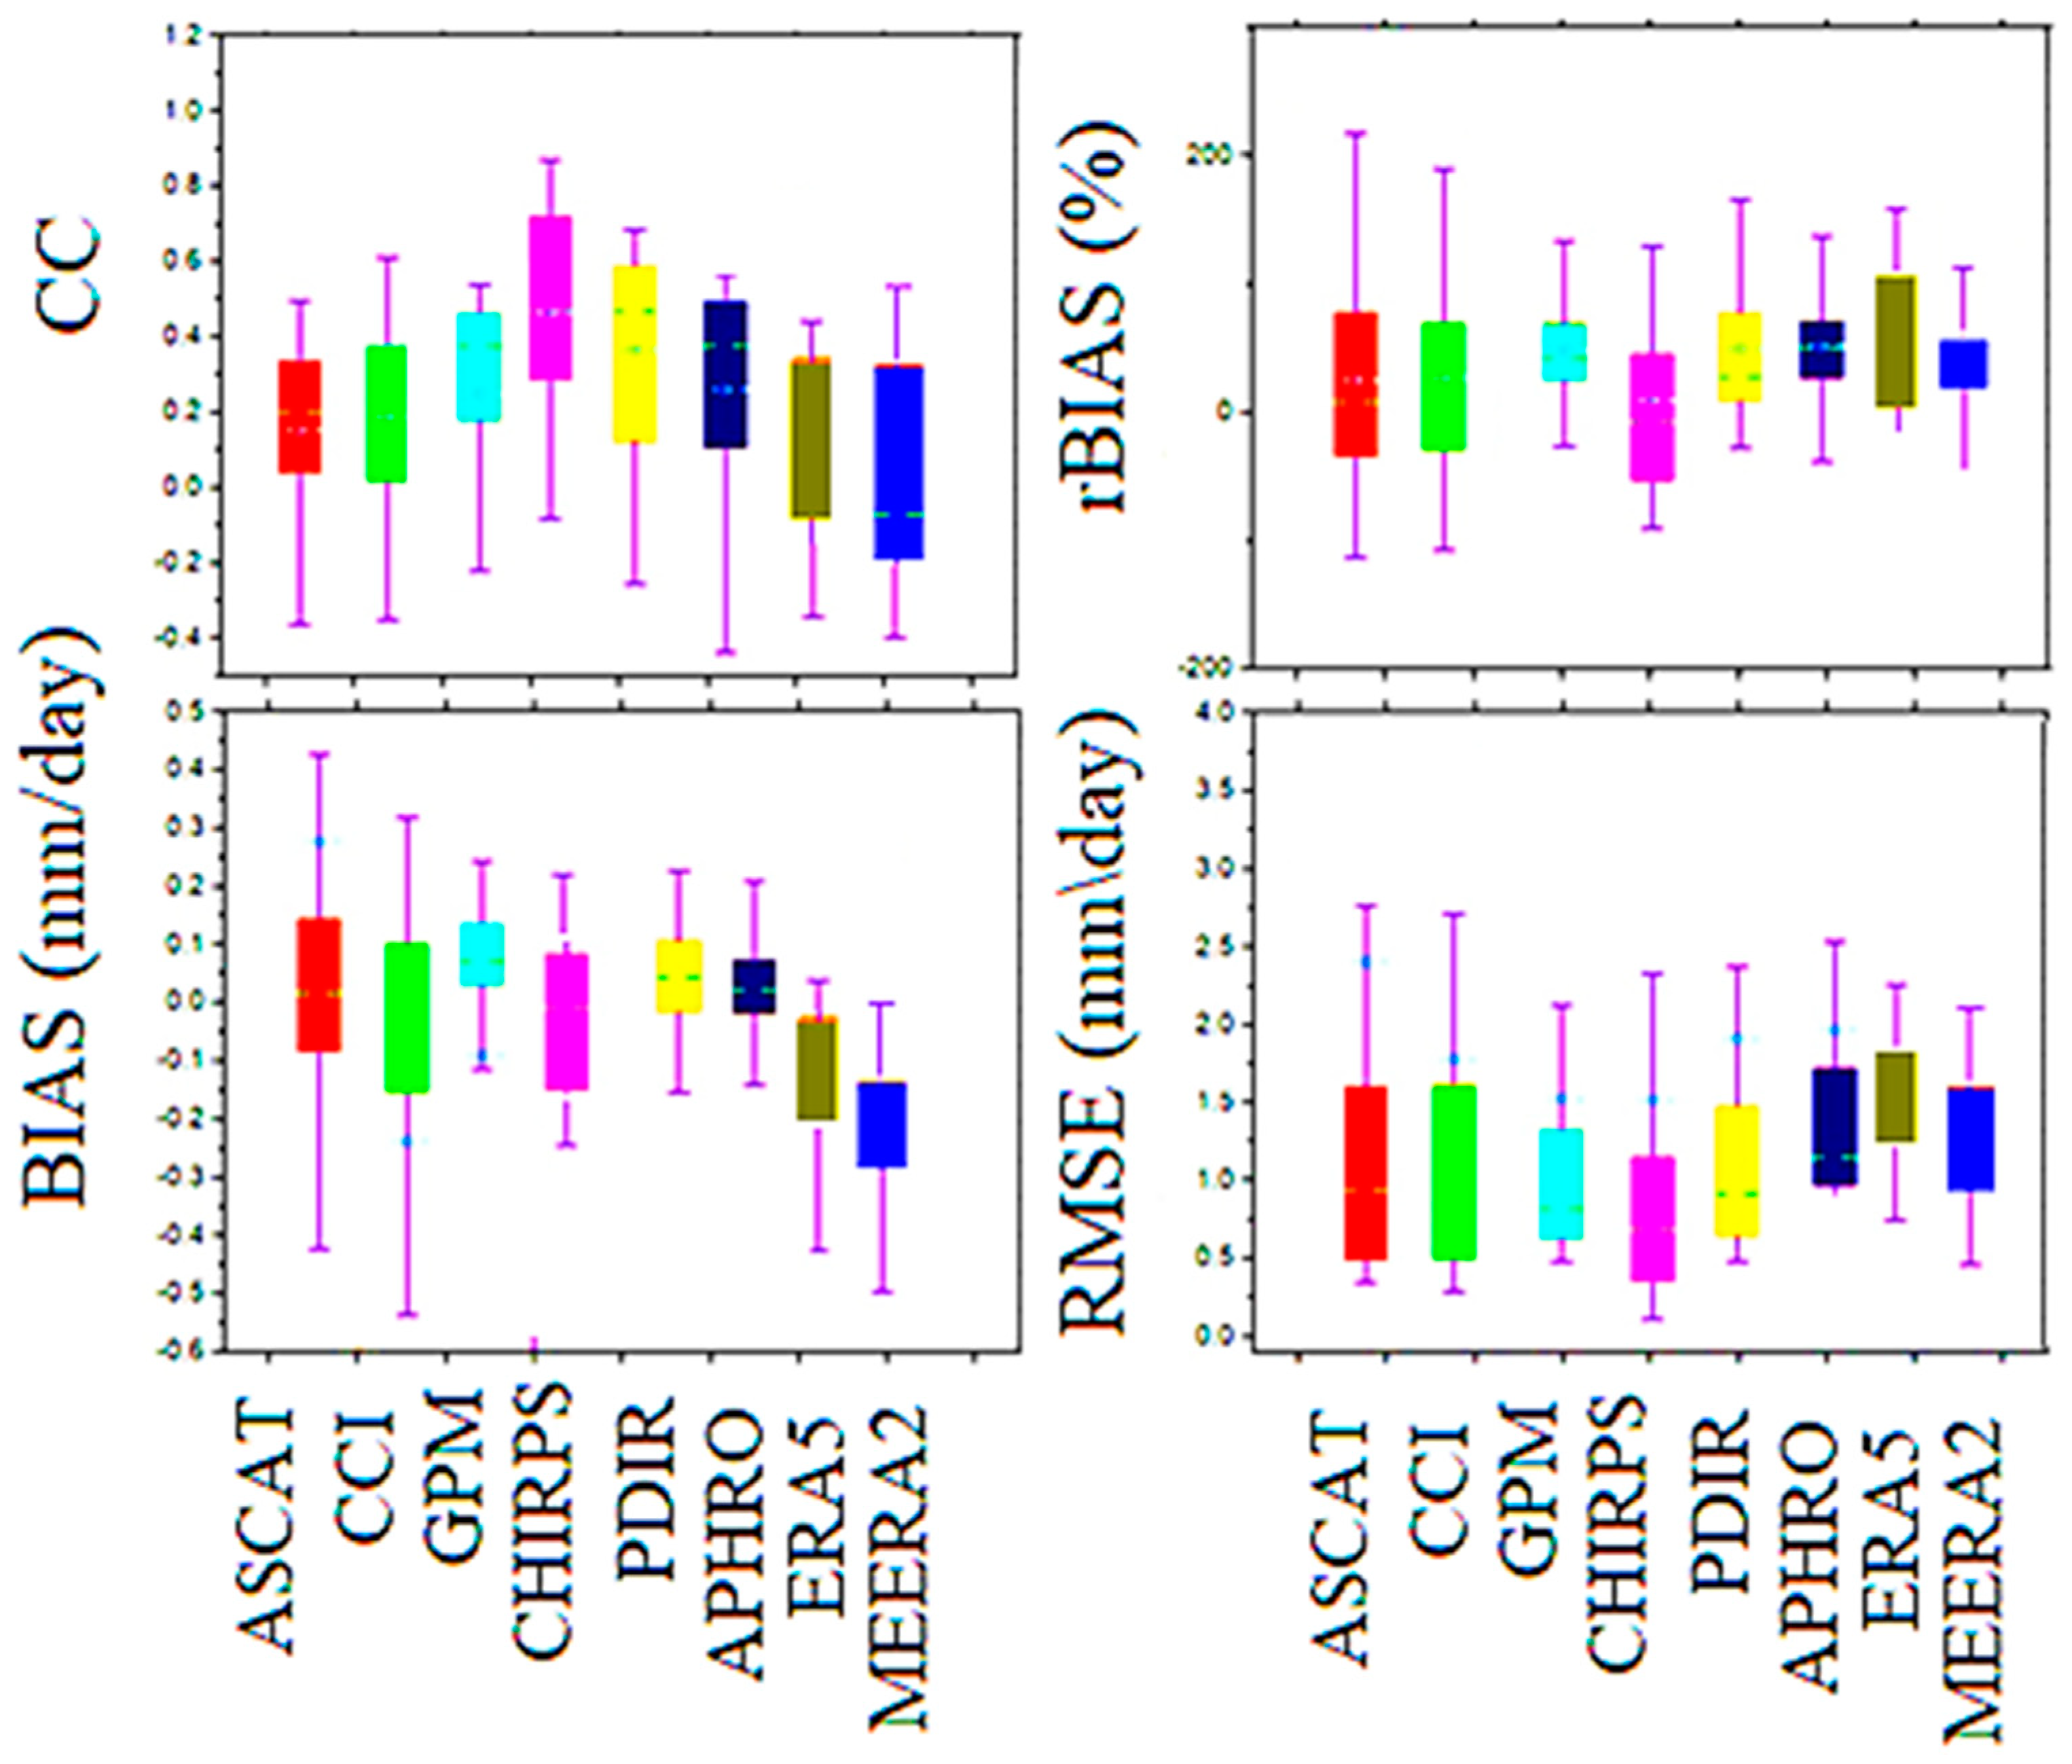
  • APHRO outperformed reanalysis precipitation datasets, such as ERA5 and MEERA2, by a significant margin, with average correlation coefficient c values of 0.69, 0.48, and 0.51, respectively.
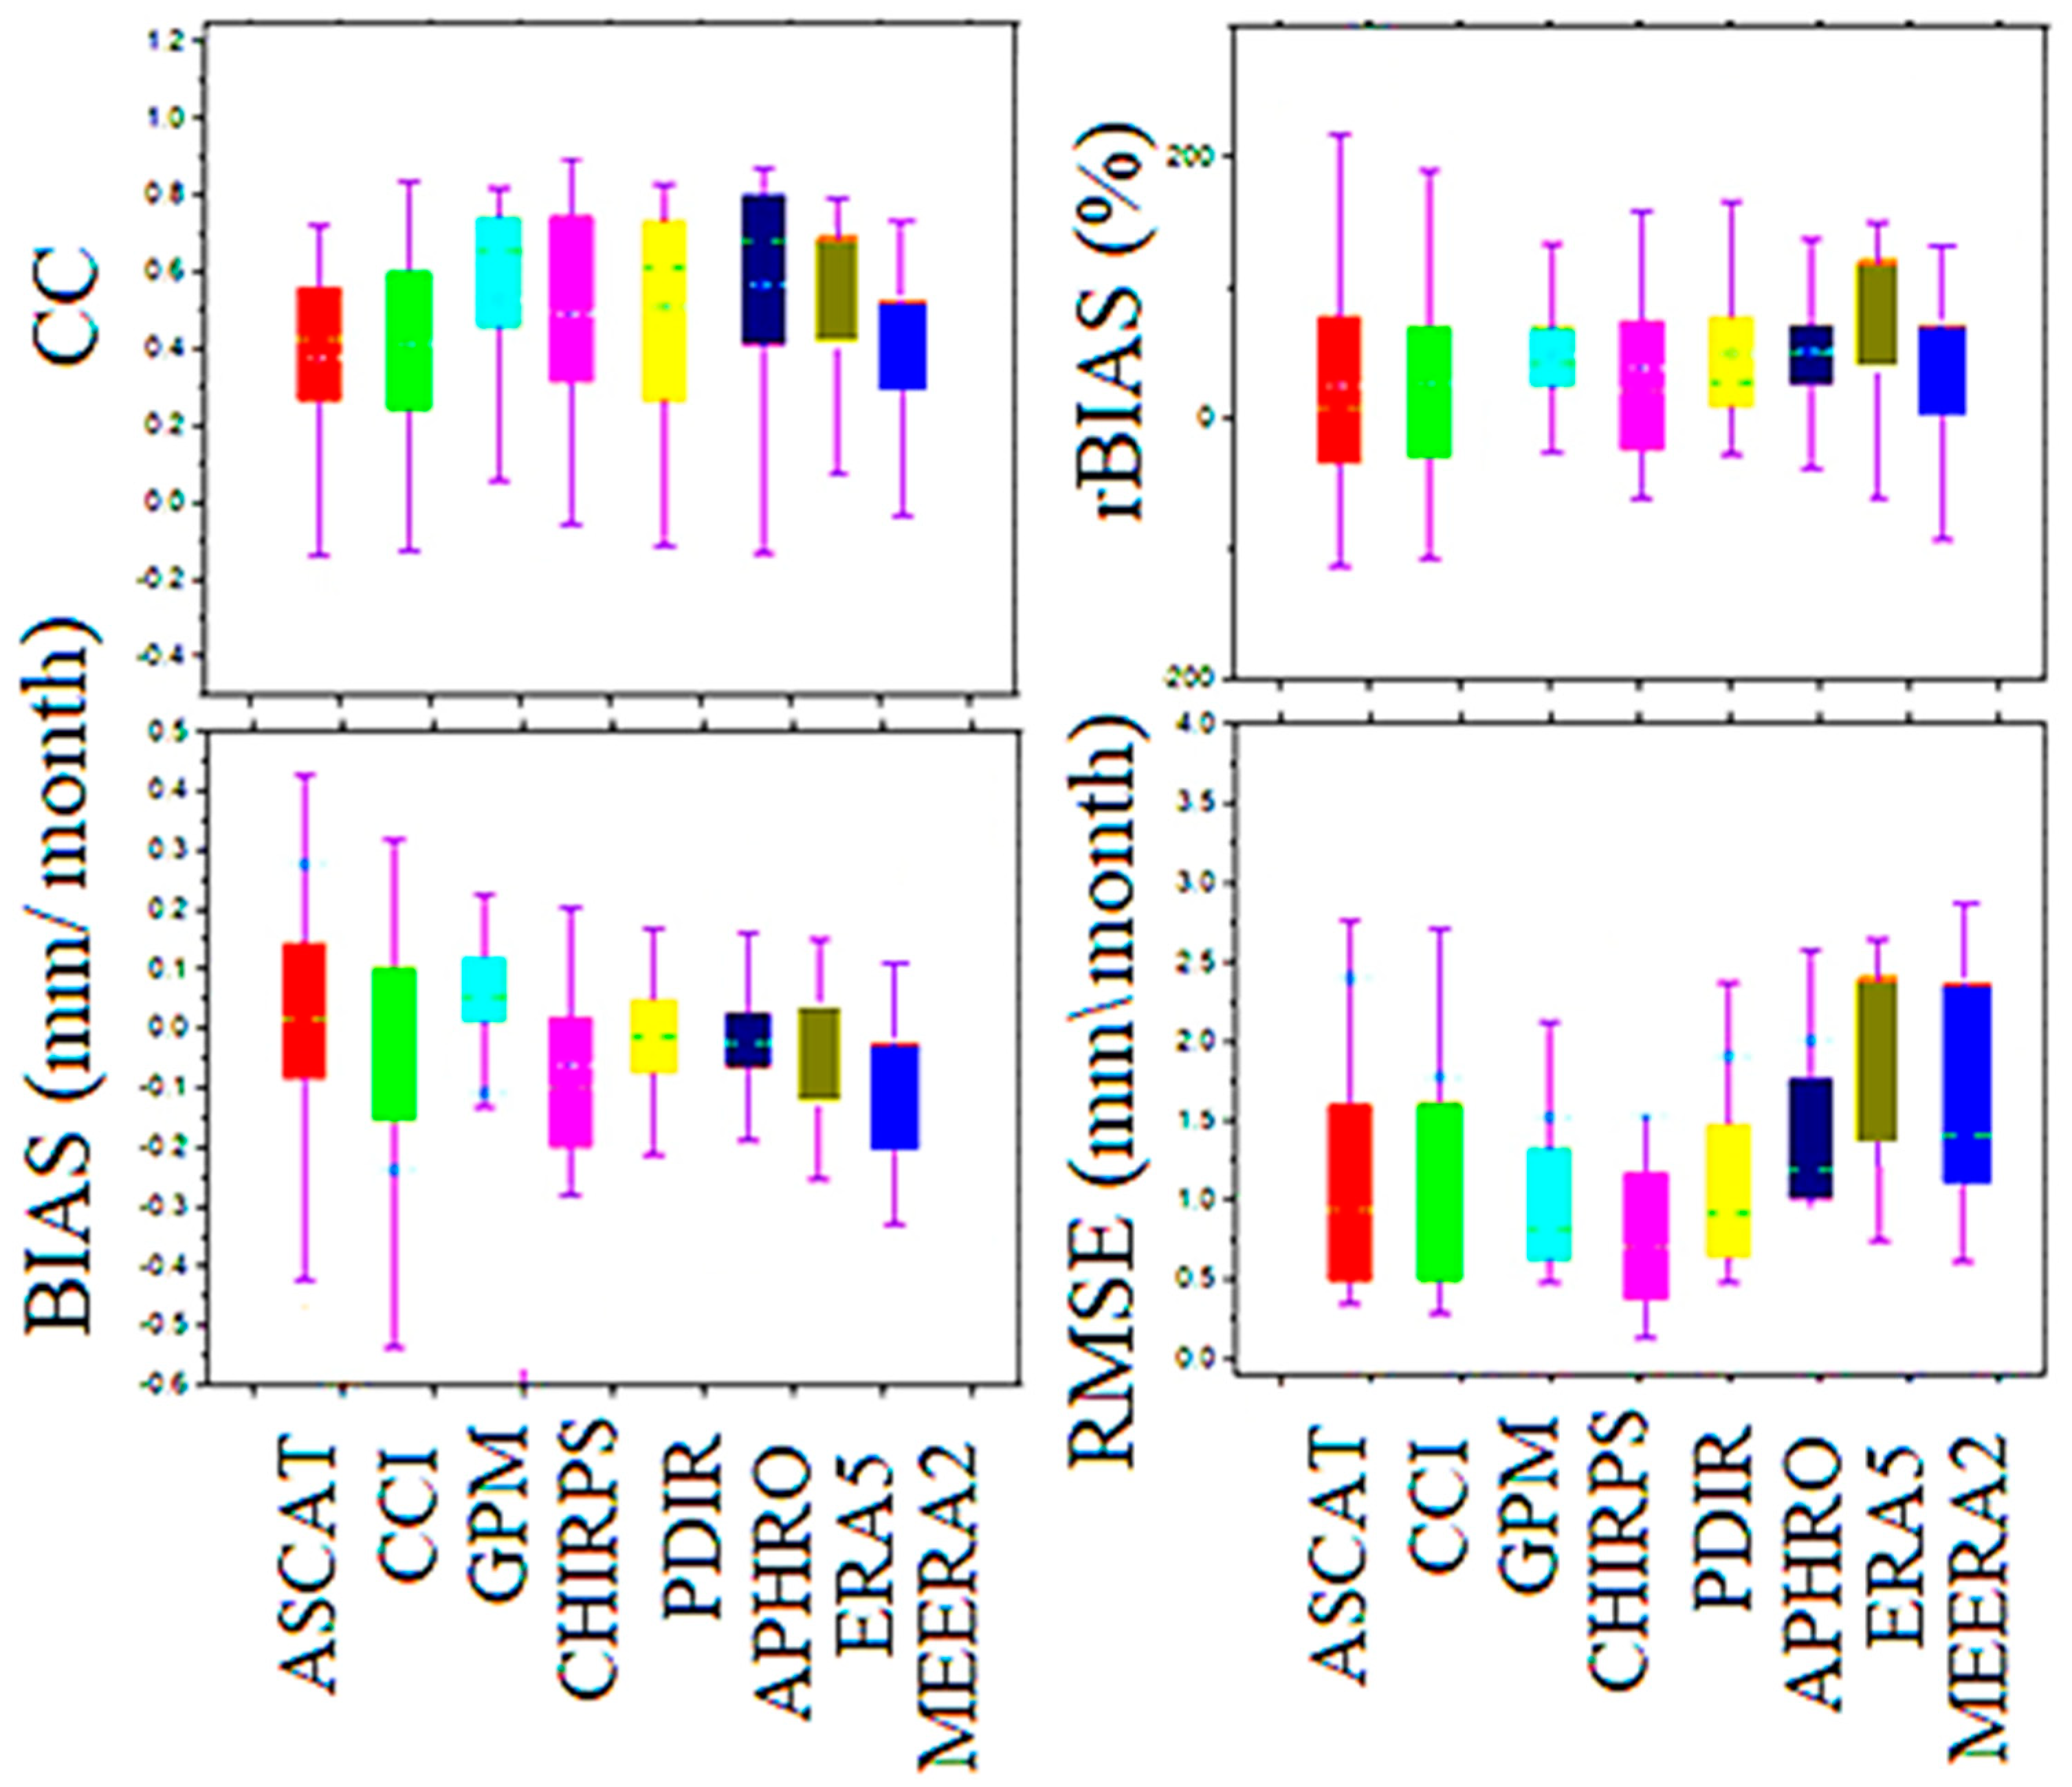
  • All GPDS performed better when measured monthly compared to daily, with average CC values increasing by 0.1–0.25. This underscores the importance of temporal aggregation in reducing uncertainties and inaccuracies in precipitation estimates.
  • The rBIAS values for CHIRPS across each zone (1500 m, 2500 m, and 3500 m) were 7%, 18%, and −30%, respectively. Furthermore, all GPDS exhibited underestimation when assessed in the highest elevation zone (Zone C). Notably, ASCAT-SM2Rain showed the highest degree of underestimation, with a substantial −72% bias.
  • The spatial variation in CC values among soil moisture-based products was notable, with CHIRPS exhibiting the highest average CC value of 0.89 on a monthly scale.
  • The Probability of Detection (POD) estimates for the PDIR, SM2Rain-ASCAT, SM2Rain-CCI, GPM-SM2Rain, and CHIRPS were 0.61, 0.49, 0.36, 0.57, 0.31, 0.36, and 0.60, respectively, indicating CHIRPS estimations were very effective at detecting precipitation events.
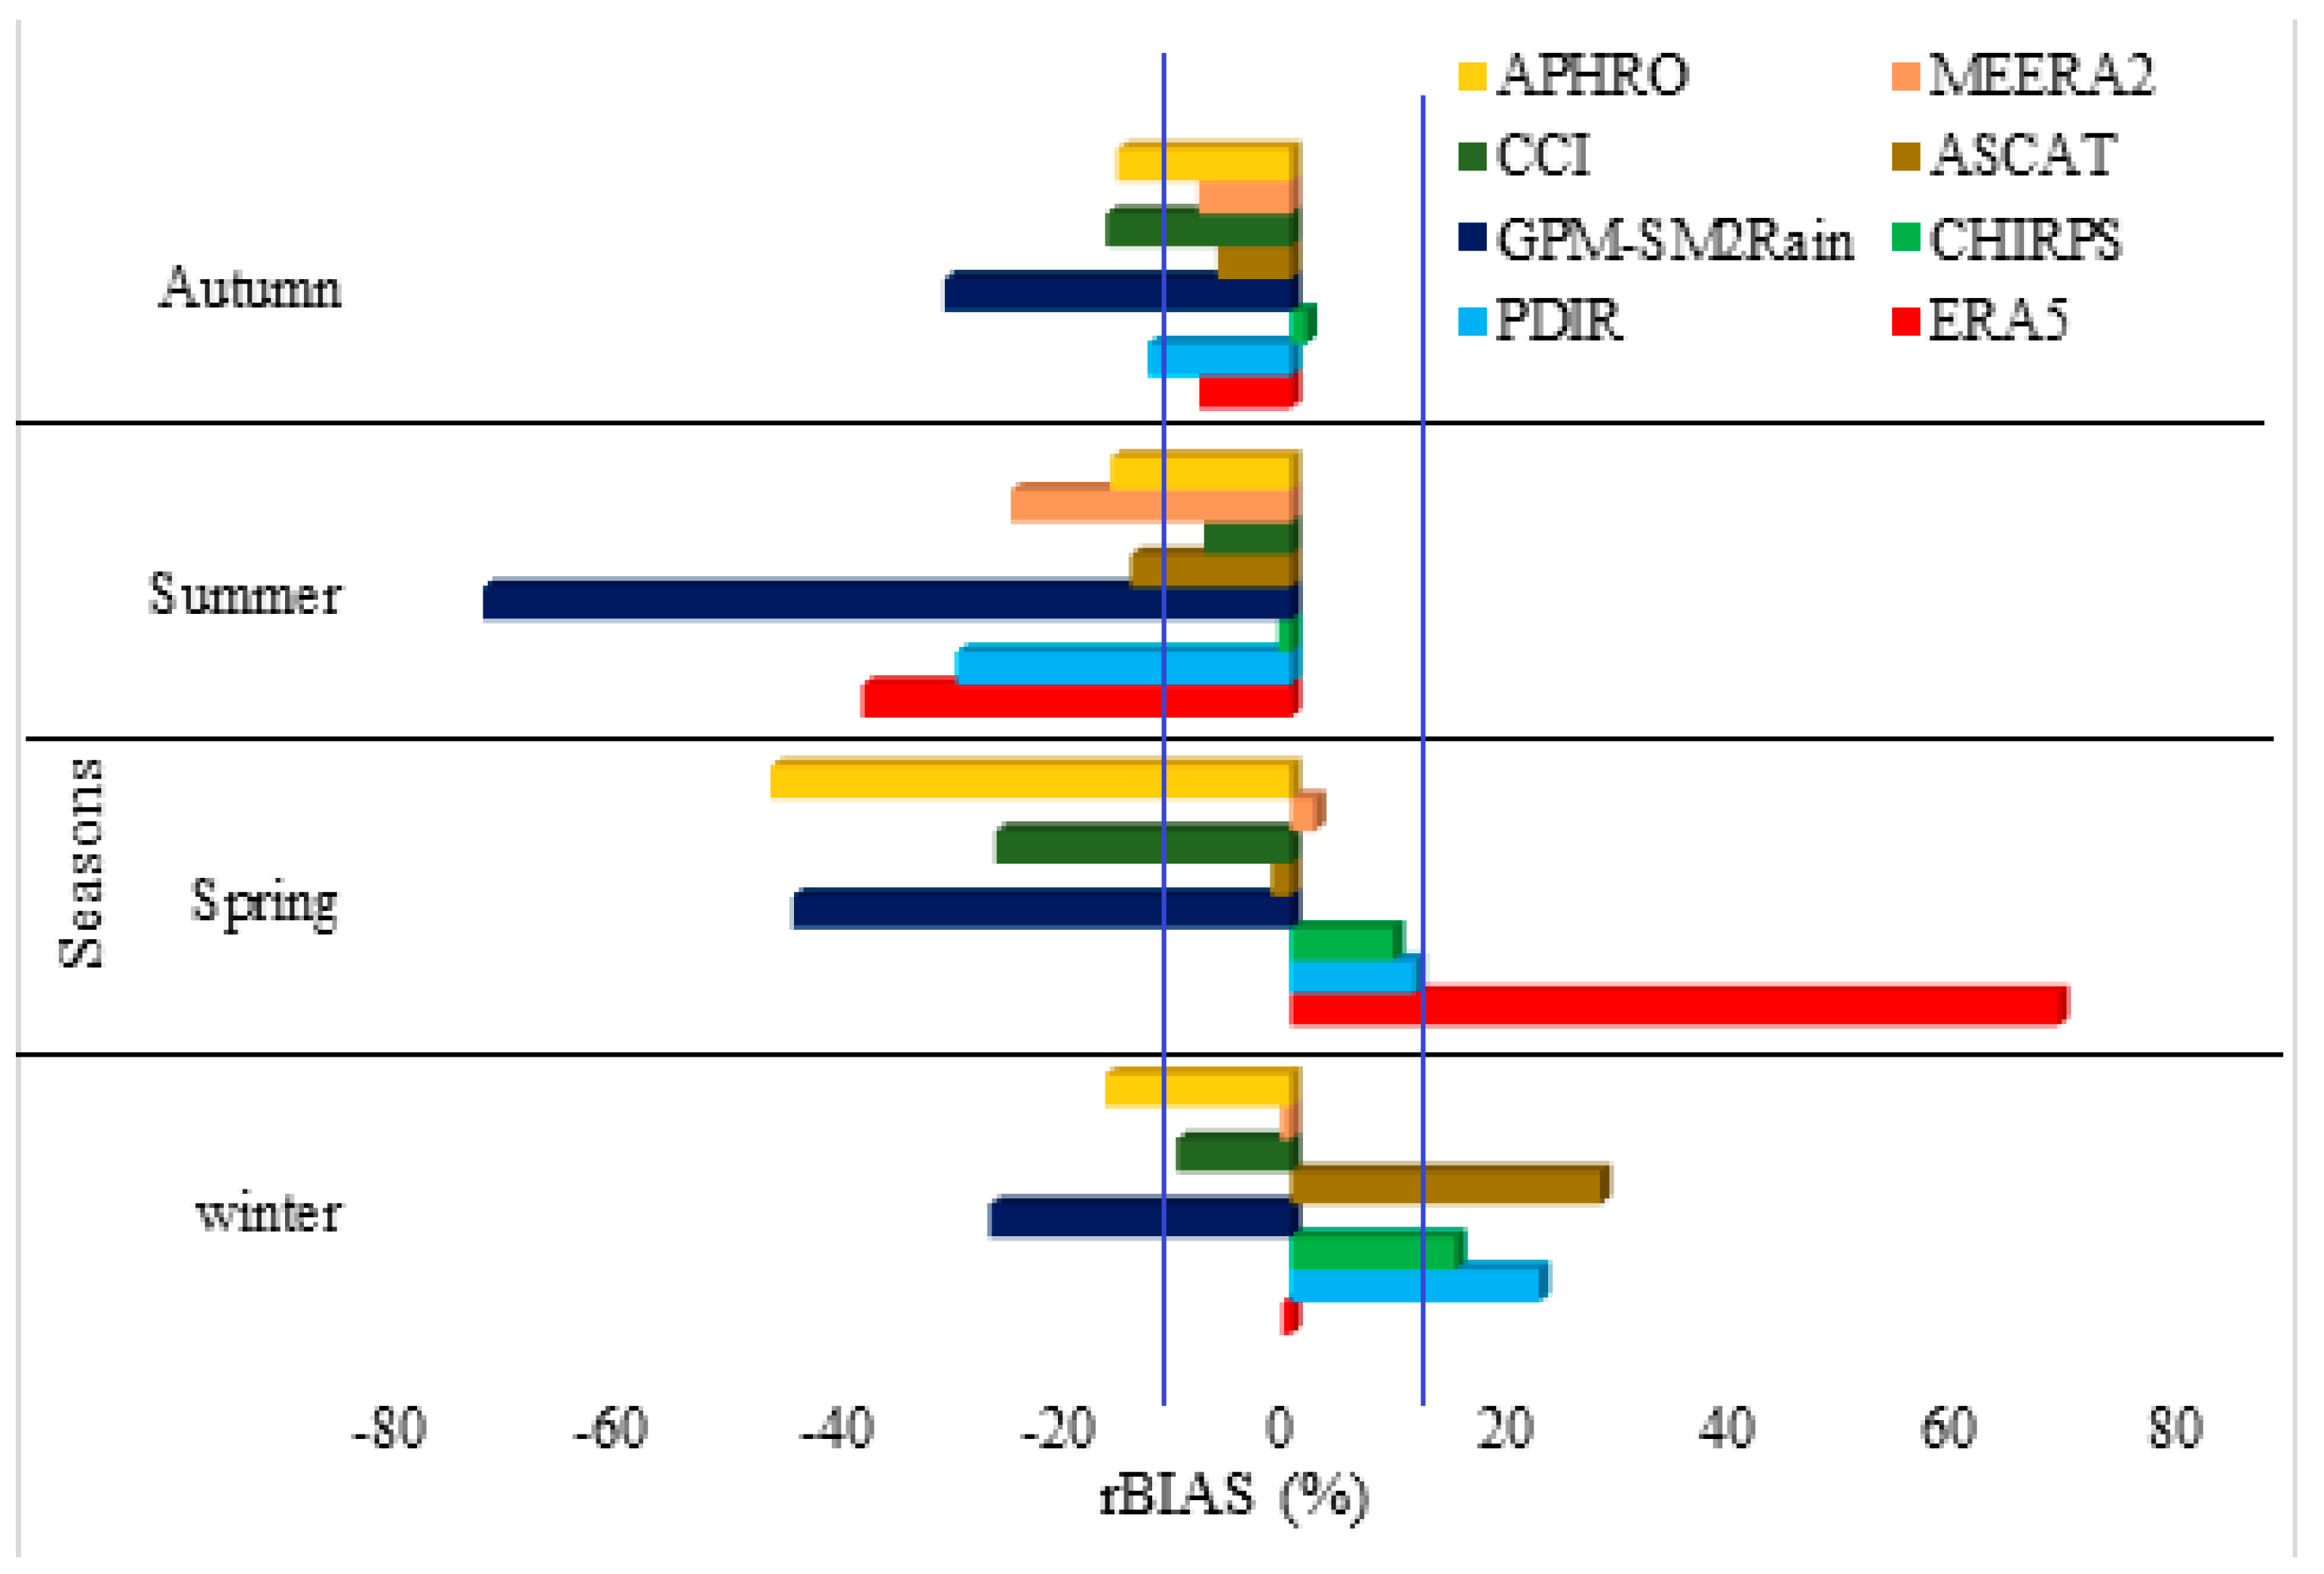
  • During the summer, all GPDS underestimated, with GPM showing the most significant underestimation (−78%); PDIR performed satisfactorily in autumn, while GPM demonstrated notable underestimation (−25%) in winter and significant underestimation (−33%) in autumn; ASCAT and CHIRPS exhibited severe underestimations (−28% and −19%, respectively) in winter; CHIRPS consistently outperformed other GPDS across all seasons.
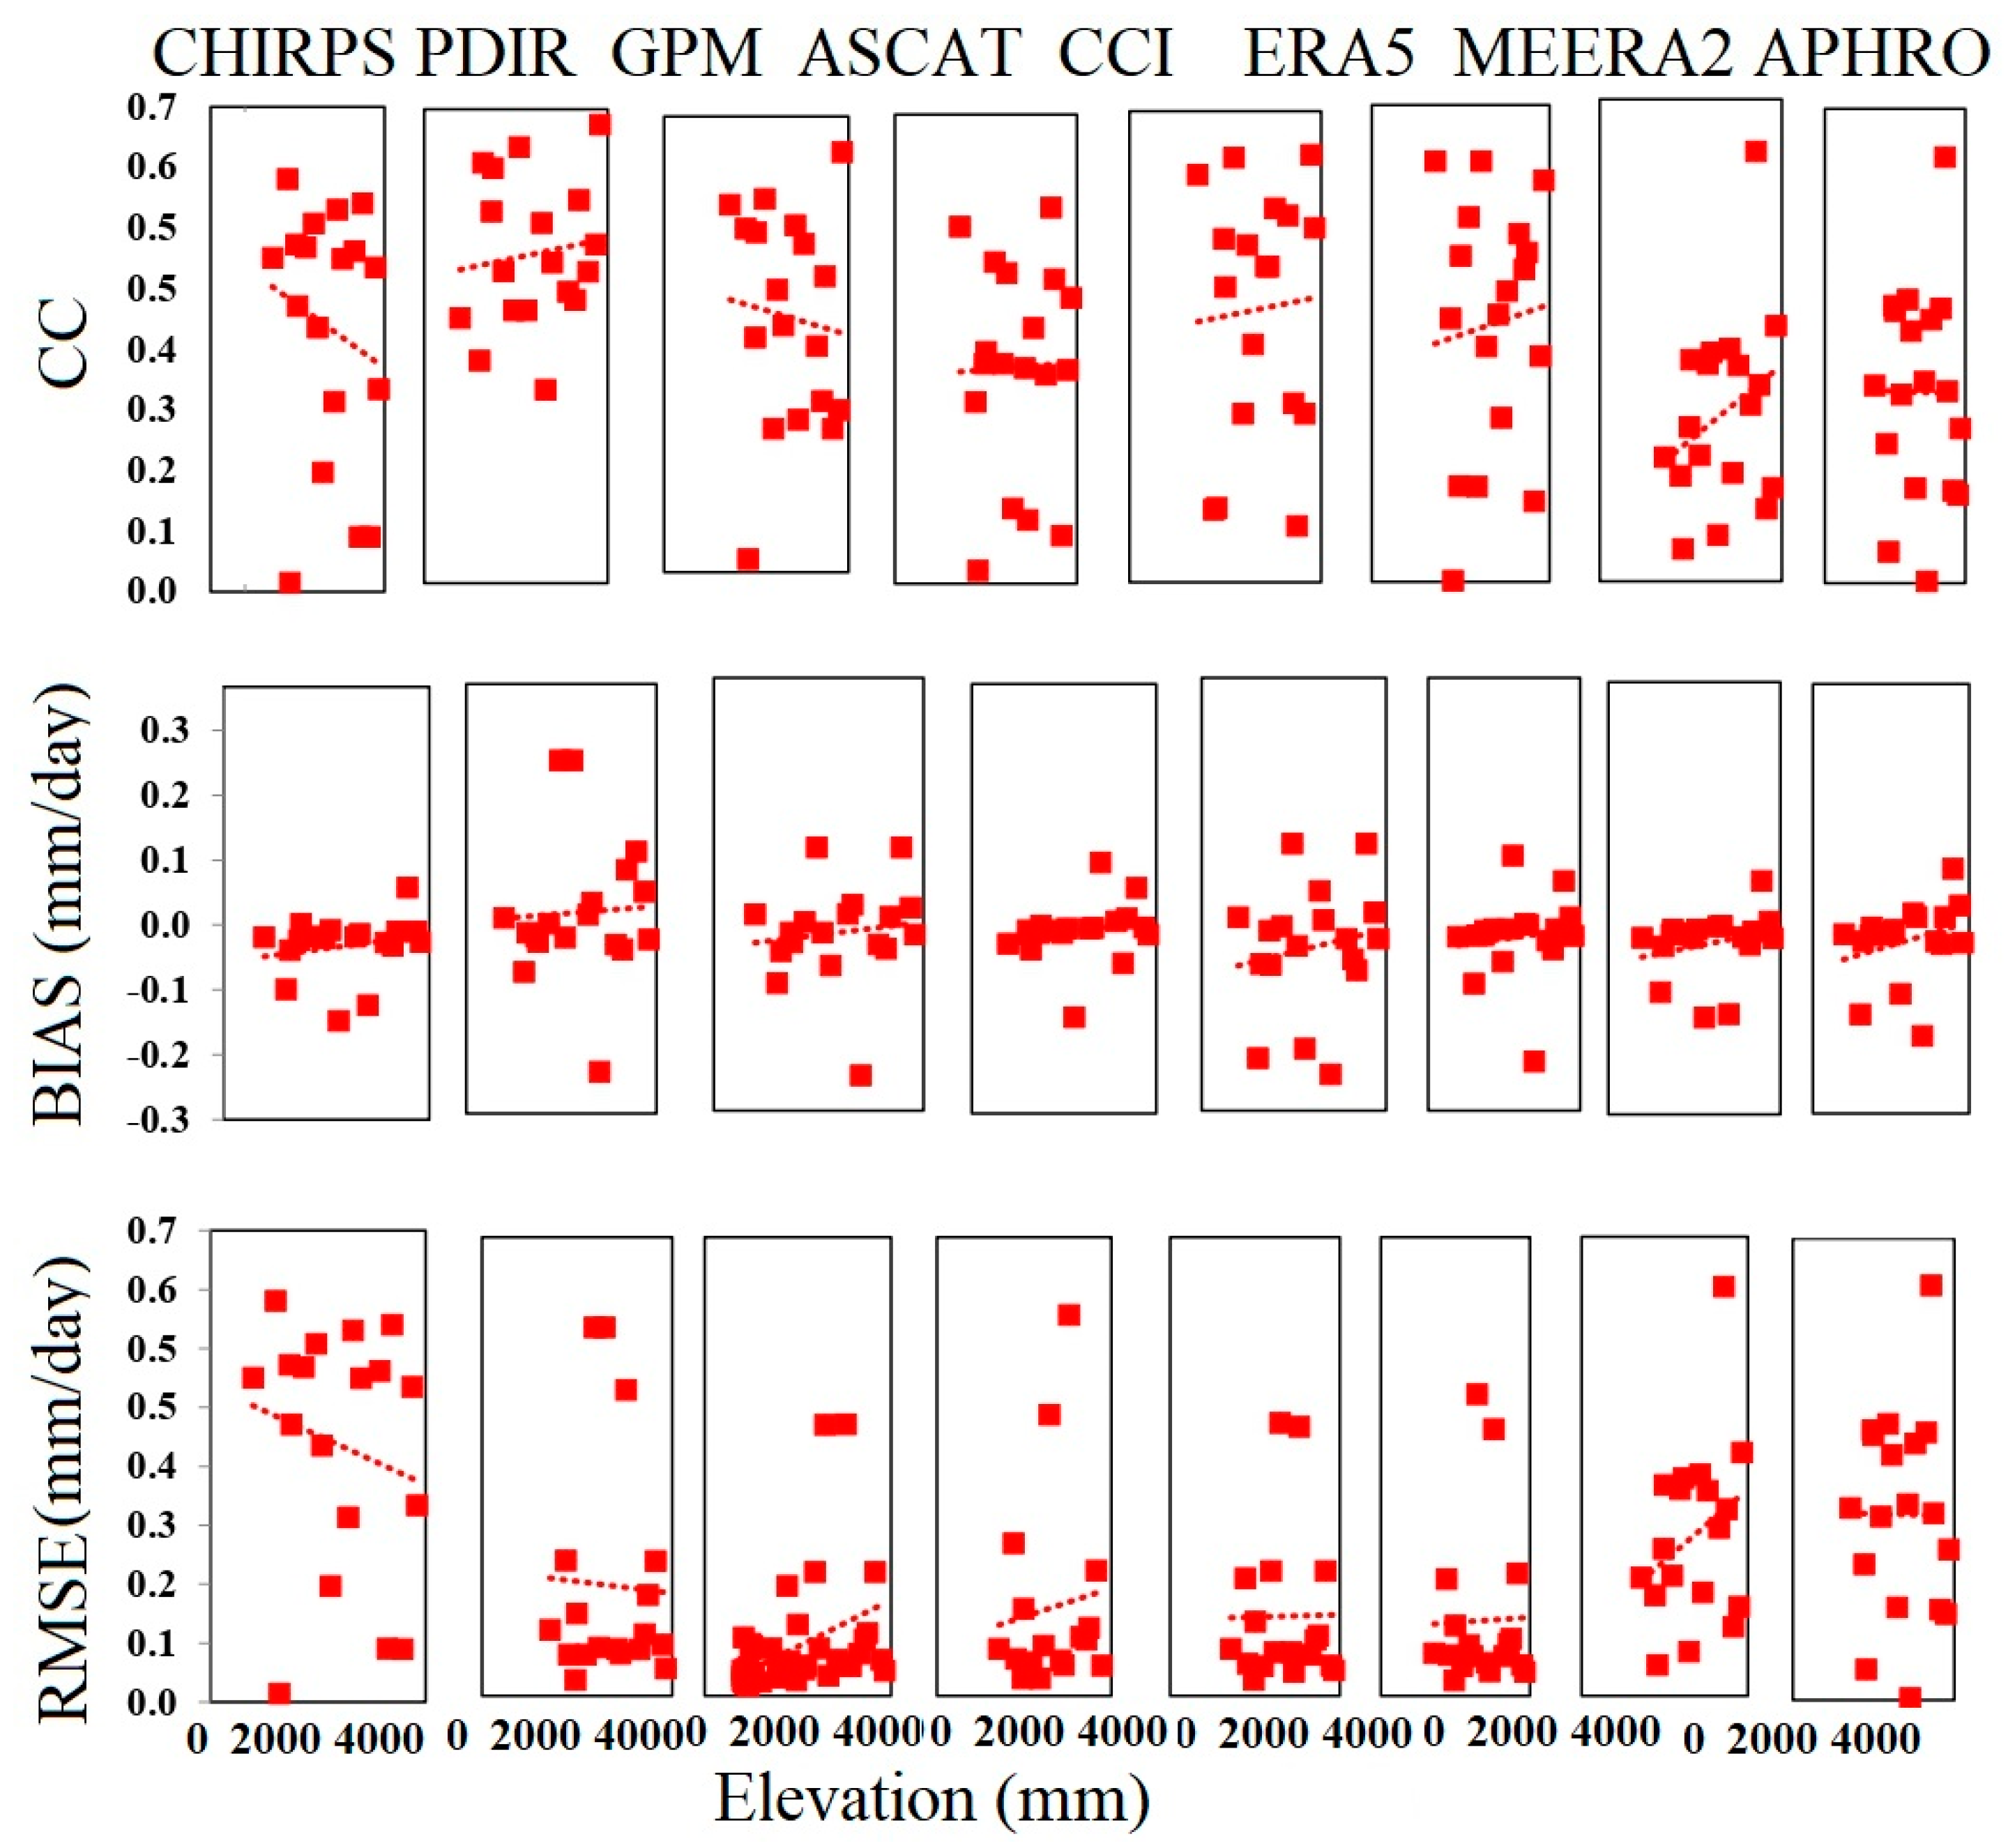
  • GPDS RMSE values generally increased with elevation, except for CHIRPS, which had the lowest RMSE values across all elevation zones (2 mm, 5 mm, and 6 mm in zones A, B, and C). However, the correlation coefficients between precipitation estimates from various datasets and ground-based measurements generally decreased as elevation increased; this is likely due to the more complex precipitation patterns at higher elevations.
  • Light precipitation events (<2 mm/day) were the most frequent (approximately 80% of all events), and CHIRPS and GPM-SM2Rain performed best at tracking precipitation events at different thresholds.
  • Overall, the in situ topographical and climatic conditions have a significant impact on the spatiotemporal performance of GPDS. It is important to be aware of these limitations when using GPDS, especially in regions with complex topography and variable climate.
This study found that the performance of the GPDS varied depending on the metric used and the elevation zone. For example, CHIRPS exhibited the best performance overall, with the highest average CC values and the lowest RMSE values. At higher elevations, all GPDS tended to underestimate precipitation amounts. According to the study’s findings, the three GPDS that performed the best for hydroclimatic applications in the Tajikistan region were CHIRPS, GPM-SM2Rain, and APHRO. At both the daily and monthly scales, these products showed a strong correlation coefficient (CC) (>0.70), and the relative bias (rBIAS) was within a tolerable range (±10). Therefore, for hydroclimatic applications in the area, we advise using both daily and monthly evaluations of these products. Furthermore, to improve algorithmic retrievals of satellite precipitation data for more precise applications, we propose merging deep learning and machine learning approaches and advanced models. The results of this study may be useful to Tajik politicians, water conservation practitioners, users of GPDS, hydrologists, and meteorologists.

Author Contributions

The conceptual aspects of this work were collaborated upon by all of the authors. The overall layout of the research was drawn up by X.C., M.G. and T.L. The study was conducted by M.G., who also wrote the report. M.U.N., N.G. and A.G. contributed to the data management and analysis. All authors have read and agreed to the published version of the manuscript.

Funding

This research was sponsored by the following funding sources: the Strategic Priority Research Program of the Chinese Academy of Sciences, the Pan-Third Pole Environment Study for a Green Silk Road (Grant No. XDA20060303), the National Natural Science Foundation of China (Grant No. 42230708), the Research Fund for International Scientists of the National Natural Science Foundation of China (Grant No. 42150410393), the Xinjiang Scientific Expedition Program (Grant No. 2021XJKK1044), the K.C. Wong Education Foundation (Grant No. GJTD-2020-14), and the CAS Research Center for Ecology and Environment of Central Asia (Grant No. Y934031).

Data Availability Statement

Not appropriate.

Acknowledgments

For their kind financial support of this study, M.G. would like to express their sincere gratitude to the Chinese Academy of Sciences (CAS) and the ANSO Scholarship for Young Talents (Master Program).

Conflicts of Interest

The authors declare no conflict of interest.

References

  1. Arvor, D.; Funatsu, B.M.; Michot, V.; Dubreui, V. Monitoring rainfall patterns in the southern Amazon with PERSIANN-CDR data: Long-term characteristics and trends. Remote Sens. 2017, 9, 889. [Google Scholar] [CrossRef]
  2. Barnett, T.P.; Adam, J.C.; Lettenmaier, D.P. Potential Impacts of a Warming Climate on Water Availability in Snow-Dominated Regions. Nature 2005, 438, 303–309. [Google Scholar] [CrossRef]
  3. Hosseini-Moghari, S.M.; Tang, Q. Validation of gpm imerg v05 and v06 precipitation products over Iran. J. Hydrometeorol. 2020, 21, 1011–1037. [Google Scholar] [CrossRef]
  4. Al Abdouli, K.; Hussein, K.; Ghebreyesus, D.; Sharif, H.O. Coastal Runoff in the United Arab Emirates-the Hazard and Opportunity. Sustainability 2019, 11, 5406. [Google Scholar] [CrossRef]
  5. Keikhosravi-Kiany, M.S.; Masoodian, S.A.; Balling, R.C.; Darand, M. Evaluation of Tropical Rainfall Measuring Mission, Integrated Multi-satellite Retrievals for GPM, Climate Hazards Centre InfraRed Precipitation with Station data, and European Centre for Medium-Range Weather Forecasts 70 Reanalysis v5 data in estimating precipitation and capturing meteorological droughts over Iran. Int. J. Climatol. 2022, 42, 2039–2064. [Google Scholar]
  6. Mu, Y.; Biggs, T.; Shen, S.S.P. Satellite-based precipitation estimates using a dense rain gauge network over the Southwestern Brazilian Amazon: Implication for identifying trends in dry season rainfall. Atmos. Res. 2021, 261, 105741. [Google Scholar] [CrossRef]
  7. Ur Rahman, K.; Shang, S.; Shahid, M.; Wen, Y. Hydrological Evaluation of Merged Satellite Precipitation Datasets for Streamflow Simulation Using SWAT: A Case Study of Potohar Plateau, Pakistan. J. Hydrol. 2020, 587, 125040. [Google Scholar] [CrossRef]
  8. Masiza, W.; Chirima, J.G.; Hamandawana, H.; Kalumba, A.M.; Magagula, H.B. Do Satellite Data Correlate with In Situ Rainfall and Smallholder Crop Yields? Implications for Crop Insurance. Sustainability 2022, 14, 1670. [Google Scholar] [CrossRef]
  9. Gottschalck, J.; Meng, J.; Rodell, M.; Houser, P. Analysis of multiple precipitation products and preliminary assessment of their impact on Global Land Data Assimilation System land surface states. J. Hydrometeor. 2005, 6, 573–598. [Google Scholar] [CrossRef]
  10. Moura Ramos Filho, G.; Hugo Rabelo Coelho, V.; da Silva Freitas, E.; Xuan, Y.; Brocca, L.; das Neves Almeida, C. Regional-scale evaluation of 14 satellite-based precipitation products in characterising extreme events and delineating rainfall thresholds for flood hazards. Atmos. Res. 2022, 276, 106259. [Google Scholar] [CrossRef]
  11. Cattani, E.; Ferguglia, O. Precipitation Products’ Inter–Comparison over East and Southern Africa 1983–2017. Remote Sens. 2021, 13, 4419. [Google Scholar] [CrossRef]
  12. Weng, P.; Tian, Y.; Jiang, Y.; Chen, D.; Kang, J. Assessment of GPM IMERG and GSMaP daily precipitation products and their utility in droughts and floods monitoring across Xijiang River Basin. Atmos. Res. 2023, 286, 106673. [Google Scholar] [CrossRef]
  13. Chen, H.; Lu, D.; Zhou, Z.; Zhu, Z.; Ren, Y.; Yong, B. An overview of the evaluation of satellite precipitation products for Global Precipitation Measurement (GPM). Water Resour. Prot. 2019, 35, 27–34. (In Chinese) [Google Scholar]
  14. Salmani-Dehaghi, N.; Samani, N. Development of bias-correction PERSIANN-CDR models for the simulation and completion of precipitation time series. Atmos. Environ. 2021, 246, 117981. [Google Scholar] [CrossRef]
  15. Gulakhmadov, A.; Chen, X.; Gulahmadov, N.; Liu, T.; Anjum, M.N.; Rizwan, M. Simulation of the Potential Impacts of Projected Climate Change on Streamflow in the Vakhsh River Basin in Central Asia under CMIP5 RCP Scenarios. Water 2020, 12, 1426. [Google Scholar] [CrossRef]
  16. Islam, M.N.; Das, S.; Uyeda, H. Calibration of TRMM Derived Rainfall Over Nepal during 1998–2007. Open Atmos. Sci. J. 2010, 4, 12–23. [Google Scholar] [CrossRef]
  17. Duan, Z.; Liu, J.; Tuo, Y.; Chiogna, G.; Disse, M. Evaluation of Eight High Spatial Resolution Gridded Precipitation Products in Adige Basin (Italy) at Multiple Temporal and Spatial Scales. Sci. Total Environ. 2016, 573, 1536–1553. [Google Scholar] [CrossRef]
  18. Nashwan, M.S.; Shahid, S.; Wang, X. Assessment of satellite-based precipitation measurement products over the hot desert climate of Egypt. Remote Sens. 2019, 11, 555. [Google Scholar] [CrossRef]
  19. Mosaffa, H.; Shirvani, A.; Khalili, D.; Nguyen, P.; Sorooshian, S. Post and near Real-Time Satellite Precipitation Products Skill over Karkheh River Basin in Iran. Int. J. Remote Sens. 2020, 41, 6484–6502. [Google Scholar] [CrossRef]
  20. Moazami, S.; Golian, S.; Kavianpour, M.R.; Yang, H. Comparison of PERSIANN and V7 TRMM multi-satellite precipitation analysis (TMPA) products with rain gauge data over Iran. Int. J. Remote Sens. 2013, 34, 8156–8171. [Google Scholar] [CrossRef]
  21. Li, Y.; Hong, J.; Wang, R.F.; Adler, F.S.; Policelli, S.; Habib, D.; Irwn, T.; Korme, L. Okello Evaluation of the real-time TRMM-based multi-satellite precipitation analysis for an operational flood prediction system in Nzoia Basin, Lake Victoria, Africa Nat. Hazards 2009, 50, 109–123. [Google Scholar] [CrossRef]
  22. Conti, F.L.; Hsu, K.L.; Noto, L.V.; Sorooshian, S. Evaluation and comparison of sattelite precipitation estimations with reference to a local area in the Mediterranean Sea. Atmos. Res. 2014, 138, 189–204. [Google Scholar] [CrossRef]
  23. Azam, M.; Kim, H.S.; Maeng, S.J. Development of Flood Alert Application in Mushim Stream Watershed Korea. Int. J. Disaster Risk Reduct. 2017, 21, 11–26. [Google Scholar] [CrossRef]
  24. Gulakhmadov, M.; Chen, X.; Gulakhmadov, A.; Nadeem, M.U.; Gulahmadov, N.; Liu, T. Performance Analysis of Precipitation Datasets at Multiple Spatio-Temporal Scales over Dense Gauge Network in Mountainous Domain of Tajikistan, Central Asia. Remote Sens. 2023, 15, 1420. [Google Scholar] [CrossRef]
  25. Choudhary, J.S.; Shukla, G.; Prabhakar, C.S.; Maurya, S. Assessment of Local Perceptions on Climate Change and Coping Strategies in Chotanagpur Plateau of Eastern India. J. Progress. Agric. 2012, 3, 8–15. [Google Scholar]
  26. McCollum, J.R.; Krajewski, W.F. Uncertainty of monthly rainfall estimates from rain gauges in the Global Precipitation Climatology Project. Water Resour. Res. 1998, 34, 2647–2654. [Google Scholar] [CrossRef]
  27. Sorooshian, S.; Hsu, K.L.; Gao, X.; Gupta, H.V.; Imam, B.; Braithwaite, D. Gao Evaluation of PERSIANN system satellite based estimaties of tropical rainfall. Bull. Am. Meteorol. Soc. 2000, 8, 2035–2045. [Google Scholar] [CrossRef]
  28. Smith, E.A.; Asrar, G.; Furuhama, Y.; Ginati, A.; Mugnai, A.; Nakamura, K.; Adler, R.F.; Chou, M.-D.; Desbois, M.; Durning, J.F.; et al. International Global Precipitation Measurement (GPM) program mission: An overview. In Measuring Precipitation from Space; Levizzani, V., Bauer, P., Turk, F.J., Eds.; Springer: Dordrecht, The Netherlands, 2007; pp. 611–654. [Google Scholar]
  29. Boluwade, A.; Stadnyk, T.; Fortin, V.; Roy, G. Assimilation of precipitation estimates from the integrated multisatellite retrievals for GPM (IMERG, early run) in the Canadian Precipitation Analysis (CaPA). J. Hydrol. Reg. Stud. 2017, 14, 10–22. [Google Scholar] [CrossRef]
  30. Kourtis, M.; Bellos, V.; Zotou, I.; Vangelis, H.; Tsihrintzis, V. Point-to-pixel comparison of a satellite and a gauge-based Intensity-Duration-Frequency (IDF) curve: The case of Karditsa, Greece. In Proceedings of the 7th IAHR EUROPE Congress, Athens, Greece, 7–9 September 2022. [Google Scholar]
  31. Liu, Z.; Liu, Y.; Wang, S.; Yang, X.; Wang, L.; Baig MH, A.; Chi, W.; Wang, Z. Evaluation of spatial and temporal performances of ERA-interim precipitation and temperature in Mainland China. J. Clim. 2018, 31, 4347–4365. [Google Scholar] [CrossRef]
  32. Ali, A.F.; Xiao, C.; Anjum, M.N.; Adnan, M.; Nawaz, Z.; Ijaz, M.W.; Sajid, M.; Farid, H.U. Evaluation and Comparison of TRMM Multi-Satellite Precipitation Products with Reference to Rain Gauge Observations in Hunza River Basin, Karakoram Range, Northern Pakistan. Sustainability 2017, 9, 1954. [Google Scholar] [CrossRef]
  33. Nadeem, M.U.; Ghanim, A.A.J.; Anjum, M.N.; Shangguan, D.; Rasool, G.; Irfan, M.; Niazi, U.M.; Hassan, S. Multiscale Ground Validation of Satellite and Reanalysis Precipitation Products over Diverse Climatic and Topographic Conditions. Remote Sens. 2022, 14, 4680. [Google Scholar] [CrossRef]
  34. Vicente, G.A.; Scofield, R.A.; Menzel, W.P. The operational GOES infrared rainfall estimation technique. Bull. Amer. Meteor. Soc. 1998, 79, 1883–1898. [Google Scholar] [CrossRef]
  35. Duchon, C.E.; Essenberg, G.R. Comparative rainfall observations from pit and aboveground rain gauges with and without wind shields. Water Resour. Res. 2001, 37, 3253–3263. [Google Scholar] [CrossRef]
  36. Dembélé, M.; Zwart, S.J. Evaluation and Comparison of Satellite-Based Rainfall Products in Burkina Faso, West Africa. Int. J. Remote Sens. 2016, 37, 3995–4014. [Google Scholar] [CrossRef]
  37. Asif, M.; Nadeem, M.U.; Anjum, M.N.; Ahmad, B.; Manuchekhr, G.; Umer, M.; Hamza, M.; Javaid, M.M. Evaluation of Soil Moisture-Based Satellite Precipitation Products over Semi-Arid Climatic Region. Atmosphere 2023, 14, 8. [Google Scholar] [CrossRef]
  38. Guilloteau, C.; Roca, R.; Gosset, M. A Multiscale Evaluation of the Detection Capabilities of High-Resolution Satellite Precipitation Products in West Africa. J. Hydrometeorol. 2016, 17, 2041–2059. [Google Scholar] [CrossRef]
  39. Wang, Q.; Xia, J.; She, D.; Zhang, X.; Liu, J.; Zhang, Y. Assessment of Four Latest Long-Term Satellite-Based Precipitation Products in Capturing the Extreme Precipitation and Streamflow across a Humid Region of Southern China. Atmos. Res. 2021, 257, 105554. [Google Scholar] [CrossRef]
  40. Shen, Y.; Xiong, A.; Hong, Y.; Yu, J.; Pan, Y.; Chen, Z.; Saharia, M. Uncertainty Analysis of Five Satellite-Based Precipitation Products and Evaluation of Three Optimally Merged Multi-Algorithm Products over the Tibetan Plateau. Int. J. Remote Sens. 2014, 35, 6843–6858. [Google Scholar] [CrossRef]
  41. Anjum, M.N.; Ding, Y.; Shangguan, D.; Ahmad, I.; Ijaz, M.W.; Farid, H.U.; Yagoub, Y.E.; Zaman, M.; Adnan, M. Performance Evaluation of Latest Integrated Multi-Satellite Retrievals for Global Precipitation Measurement (IMERG) over the Northern Highlands of Pakistan. Atmos. Res. 2018, 205, 134–146. [Google Scholar] [CrossRef]
  42. Zambrano, F.; Wardlow, B.; Tadesse, T.; Lillo-Saavedra, M.; Lagos, O. Evaluating satellite-derived long-term historical precipitation datasets for drought monitoring in Chile. Atmos. Res. 2017, 186, 26–42. [Google Scholar] [CrossRef]
  43. Lu, X.; Tang, G.; Liu, X.; Wang, X.; Liu, Y.; Wei, M. The Potential and Uncertainty of Triple Collocation in Assessing Satellite Precipitation Products in Central Asia. Atmos. Res. 2021, 252, 105452. [Google Scholar] [CrossRef]
  44. Amjad, M.; Yilmaz, M.T.; Yucel, I.; Yilmaz, K.K. Performance Evaluation of Satellite- and Model-Based Precipitation Products over Varying Climate and Complex Topography. J. Hydrol. 2020, 584, 124707. [Google Scholar] [CrossRef]
  45. Steiner, M.; Bell, T.L.; Zhang, Y.; Wood, E.F. Comparison of two methods for estimating the sampling-related uncertainty of satellite rainfall averages based on a large radar dataset. J. Clim. 2003, 16, 3759–3778. [Google Scholar] [CrossRef]
Figure 1. Tajikistan topographical map with operated gauging stations.
Remotesensing 15 04990 g001
Figure 2. Interpolation of annual average precipitation collected from ground stations.
Remotesensing 15 04990 g002
Figure 3. Thiessen polygon precipitation analysis from in situ gauging stations.
Remotesensing 15 04990 g003
Figure 4. Gauge estimates and the daily spatial fluctuation in (mm/day) of GPDS.
Remotesensing 15 04990 g004
Figure 5. Temporal variation of every gridded and in situ weather estimation.
Remotesensing 15 04990 g005aRemotesensing 15 04990 g005b
Figure 6. Correlation coefficient spatial distribution for all gridded datasets.
Remotesensing 15 04990 g006
Figure 7. BIAS spatial distribution (mm/day) for all gridded datasets.
Remotesensing 15 04990 g007
Figure 8. RMSE spatial distribution (mm/day) for all gridded datasets.
Remotesensing 15 04990 g008
Figure 9. Seasonal rBIAS of all GPDS.
Remotesensing 15 04990 g009
Figure 10. Box schemes of all gridded datasets based on daily estimations.
Remotesensing 15 04990 g010
Figure 11. Box schemes of all gridded datasets based on monthly estimations.
Remotesensing 15 04990 g011
Figure 12. Variability of evaluation indices in response to elevation.
Remotesensing 15 04990 g012
Figure 13. Influence of precipitation intensity on evaluation index estimations.
Remotesensing 15 04990 g013
Figure 14. All gridded datasets’ daily performance diagram.
Remotesensing 15 04990 g014
Figure 15. All gridded datasets’ seasonal performance diagram.
Remotesensing 15 04990 g015
Figure 16. PDF (%) of (a) daily, (b) winter, (c) spring, (d) summer, and (e) fall gridded datasets.
Remotesensing 15 04990 g016aRemotesensing 15 04990 g016b
Figure 17. Correlation coefficient of all GPDS over different elevation zones.
Remotesensing 15 04990 g017
Figure 18. (a) RMSE and (b) r-BIAS of all GPDS over different elevation zones.
Remotesensing 15 04990 g018aRemotesensing 15 04990 g018b
Table 1. Key characteristics shared by all GPDS.
Precipitation DatasetsSpatial/Temporal ResolutionAlgorithmInput Data SourcesTime CoverageOfficial Link
GPM-SM2Rain0.25 degree/1 dayMW dataGPMJanuary 2007 to December 2018https://doi.org/10.5281/zenodo.3854817 (accessed on 13 February 2023)
PERSIANN-PDIR0.25 degree/1 dayMultispectral IR and MW dataTRMM, MODIS, GOES, and GPMMarch 2000–Presenthttps://irain.eng.uci.edu/ (accessed on 13 February 2023)
SM2Rain-CCI0.25 degree/1 dayMW dataSSM/I, TMI, AMSR-E, and AMSR2January 1998 to December 2015https://doi.org/10.5281/zenodo.1305021 (accessed on 13 February 2023)
CHIRPS0.05c
/daily
Geostationary IR dataGPM, Meteosat, GOES, and INSATJanuary 1990 to December 2020https://data.chc.ussb.edu/products/CHIRPS-2.0/ (accessed on 13 February 2023)
weSM2Rain-ASCAT10 km/1 dayMW dataASCATJanuary 2007 to December 2021https://doi.org/10.5281/zenodo.2591214 (accessed on 13 February 2023)
ERA530 km/dailyReanalysisSatellite and ground-based observationsJanuary 1980 to December 2020https://www.ecmwf.int/en/forecasts/datasets/reanalysis-datasets/era5/ (accessed on 13 February 2023)
MEERA 20.25 degree/dailyReanalysisSatellite and ground-based observationsJanuary 1980 to December 2020https://gmao.gsfc.nasa.gov/reanalysis/MERRA-2/ (accessed on 13 February 2023)
APHRO0.05 degree
/daily
ReanalysisSatellite and ground-based observationsJanuary 1990 to December 2018http://aphrodite.st.hirosaki-u.ac.jp/download/ (accessed on 13 February 2023)
Table 2. Principal characteristics of all evaluation and categorical indices.
IndicesSpecificsDescriptionAcceptable Value
CC = i = 1 n ( w i w ) ( S i S ) i = 1 n ( w i w ) 2 × i = 1 n ( S i S ) 2 CC = correlation coefficient
wi = in situ weather estimations
w = average of in situ weather data
Si = estimations of GPDS
s = mean of GPDS evaluations
n = total number of GPDS
A measure of the strength and direction of the linear relationship between two variables.1
B I A S = i = 1 n ( w i s i ) n si = estimates of GPDS
wi = weather estimations
n = total number of GPDS
A measure of whether a precipitation estimate is consistently overestimating or underestimating the observed precipitation.0
r b i a s = i = 1 n ( s i w i ) I = 1 n w i × 100 rBIAS = relative bias
si = estimations of GPDS
wi = in situ weather data
n = total number of GPDS
The rBIAS provides a measure of the magnitude and direction of the bias.±10
R M S E = 1 n I = 1 n ( s i w i ) 2 RMSE = Root Mean Square Error
si = estimations of GPDS
wi = in situ weather data
n = total number of GPDS
The RMSE provides a measure of the magnitude of the error.0
P O D = A A + B POD = Probability of Detection
A = amount of precipitation that was recorded by the GPDS
B = amount of precipitation that was recorded by the reference gauging stations but not by GPDS
The POD provides a measure of the ability of the precipitation datasets to detect precipitation events.1
F A R = C A + C FAR = False Alarm Ratio
C = amount of precipitation that was underreported by the GPDS
A = amount of precipitation that was recorded by the GPDS
The FAR provides a measure of the ability of the precipitation datasets to avoid issuing false alarms.0
C S I = A A + B + C CSI = Critical Success Index
A = amount of precipitation that was recorded by the GPDS
B = amount of precipitation that was recorded by the reference gauging stations but not by GPDS
C = amount of precipitation that were underreported by the GPDS
The CSI provides a measure of the accuracy and reliability of the precipitation datasets.1
Table 3. Salient features of weather stations and elevation zones.
Elevation ZonesElevation Ranges#Weather StationLat (°)Lon (°)Altitude (m)
A≤15001Dushanbe38.5868.787790
2Faizobod38.5569.3251215
3Darvoz38.4770.8871284
4Khovaling38.3569.9531468
5Sangiston39.3968.6231500
B≤25006Humrogi38.3171.3831736
7Rushon37.4671.5271966
8Khorug37.5671.5122075
9Madrushtak39.4469.6562234
10Dehavz39.4570.2702500
C>250011Ishkoshim36.7371.6202646
12Savnob38.1972.2852800
13Agbai Shahriston39.3468.3513143
14Irkht38.1772.6343290
15Agbai Anzob39.0868.8723373
16Javshangoz37.3772.4613576
17Bulunkul37.4272.5753747
18Shaymoq37.4774.4333835
Disclaimer/Publisher’s Note: The statements, opinions and data contained in all publications are solely those of the individual author(s) and contributor(s) and not of MDPI and/or the editor(s). MDPI and/or the editor(s) disclaim responsibility for any injury to people or property resulting from any ideas, methods, instructions or products referred to in the content.

